


1. Introduction
Business is booming in behavioral genetics. We're in the midst of a genome-wide association gold rush (Visscher et al., Reference Visscher, Wray, Zhang, Sklar, McCarthy, Brown and Yang2017). The availability of powerful computers and sequenced DNA of millions of people has led to an industrious search for single-nucleotide polymorphisms (SNPs) that correlate with a variety of psychological and behavioral traits (Harden & Koellinger, Reference Harden and Koellinger2020; Horwitz, Lam, Chen, Xia, & Liu, Reference Horwitz, Lam, Chen, Xia and Liu2019; Mills & Tropf, Reference Mills and Tropf2020). These range from memory capacity (Papassotiropoulos et al., Reference Papassotiropoulos, Henke, Stefanova, Aerni, Müller, Demougin and Vogler2011), cognitive ability (Coleman et al., Reference Coleman, Bryois, Gaspar, Jansen, Savage, Skene and Plomin2019), and educational attainment (Lee et al., Reference Lee, Wedow, Okbay, Kong, Maghzian, Zacher and Nguyen-Viet2018) to moral attitudes (Brandt & Wetherell, Reference Brandt and Wetherell2012), political orientation (Hatemi et al., Reference Hatemi, Gillespie, Eaves, Maher, Webb, Heath and Medland2011), temporal discounting (Sanchez-Roige et al., Reference Sanchez-Roige, Fontanillas, Elson, Pandit, Schmidt and Foerster2018), socioeconomic status (Hill et al., Reference Hill, Hagenaars, Marioni, Harris, Liewald, Davies and Okbay2016), temperament (Zwir et al., Reference Zwir, Arnedo, Del-Val, Pulkki-Råback, Konte, Yang, Romero-Zaliz, Hintsanen, Cloninger, Garcia, Svrakic, Rozsa, Martinez, Lyytikäinen, Giegling, Kähönen, Hernandez-Cuervo, Seppälä, Raitoharju and Cloninger2020), and happiness (Wingo et al., Reference Wingo, Almli, Stevens, Jovanovic, Wingo, Tharp and Li2017). The significance threshold for discovering correlations is high (a typical threshold being p < 5 × 10⁻⁸; Fadista, Manning, Florez, & Groop, Reference Fadista, Manning, Florez and Groop2016) and there are claims that the curse of reverse causality has been lifted. As Plomin and von Stumm (Reference Plomin and von Stumm2018) put it, genome-wide polygenic scores “are an exception to the rule that correlations do not imply causation in the sense that there can be no backward causation … nothing in our brains, behavior or environment changes inherited differences in our DNA sequence.”
The last two decades have also seen a parallel revolution in cultural psychology and cultural evolution that has identified significant cultural variation in our psychology and behavior (Gelfand, Reference Gelfand2018; Henrich, Reference Henrich2016; Henrich, Heine, & Norenzayan, Reference Henrich, Heine and Norenzayan2010; Muthukrishna & Henrich, Reference Muthukrishna and Henrich2019; Muthukrishna et al., Reference Muthukrishna, Bell, Henrich, Curtin, Gedranovich, McInerney and Thue2020; Nisbett, Reference Nisbett2003). These range from fairness and prosocial norms (Henrich et al., Reference Henrich, Heine and Norenzayan2010; Schulz, Bahrami-Rad, Beauchamp, & Henrich, Reference Schulz, Bahrami-Rad, Beauchamp and Henrich2019) and attribution of blame (Barrett et al., Reference Barrett, Bolyanatz, Crittenden, Fessler, Fitzpatrick, Gurven and Henrich2016) to perceptual style (Kitayama, Duffy, Kawamura, & Larsen, Reference Kitayama, Duffy, Kawamura and Larsen2003), susceptibility to visual illusions (Henrich et al., Reference Henrich, Heine and Norenzayan2010), visual perception more broadly (Lupyan, Rahman, Boroditsky, & Clark, Reference Lupyan, Rahman, Boroditsky and Clark2020), numeric chunking (Domahs, Moeller, Huber, Willmes, & Nuerk, Reference Domahs, Moeller, Huber, Willmes and Nuerk2010), interpretation of linear and logarithmic numeric scales (Dehaene, Izard, Spelke, & Pica, Reference Dehaene, Izard, Spelke and Pica2008), neural correlates of reading (Bolger, Perfetti, & Schneider, Reference Bolger, Perfetti and Schneider2005; Tan, Laird, Li, & Fox, Reference Tan, Laird, Li and Fox2005), event segmentation (Swallow & Wang, Reference Swallow and Wang2020), memory (Amici et al., Reference Amici, Sánchez-Amaro, Sebastián-Enesco, Cacchione, Allritz, Salazar-Bonet and Rossano2019; Guida et al., Reference Guida, Megreya, Lavielle-Guida, Noël, Mathy, van Dijck and Abrahamse2018; Wang, Reference Wang2021), spatial cognition (Majid, Bowerman, Kita, Haun, & Levinson, Reference Majid, Bowerman, Kita, Haun and Levinson2004), motor development (Karasik, Tamis-LeMonda, Adolph, & Bornstein, Reference Karasik, Tamis-LeMonda, Adolph and Bornstein2015), folkbiology (Medin & Atran, Reference Medin and Atran2004; Waxman, Medin, & Ross, Reference Waxman, Medin and Ross2007), and personality (Gurven, von Rueden, Massenkoff, Kaplan, & Vie, Reference Gurven, von Rueden, Massenkoff, Kaplan and Vie2013; Smaldino, Lukaszewski, von Rueden, & Gurven, Reference Smaldino, Lukaszewski, von Rueden and Gurven2019). Cultural evolution is part of a broader theoretical framework – dual inheritance theory (Boyd & Richerson, Reference Boyd and Richerson1985; Cavalli-Sforza & Feldman, Reference Cavalli-Sforza and Feldman1981)Footnote 1 – that incorporates genes, environment, culture, and learning to offer an explanatory and predictive framework for human psychology and behavior (Muthukrishna & Henrich, Reference Muthukrishna and Henrich2019). This body of research suggests that humans not only have a genetic inheritance from their parents, as do all animals, but also a substantial cumulative cultural inheritance from their societies, well beyond any culture found in other primates, birds, and whales (Dean, Vale, Laland, Flynn, & Kendal, Reference Dean, Vale, Laland, Flynn and Kendal2014; although also see Whiten, Reference Whiten2019). Genes, culture, and the environment have often coevolved, shaping our species (Henrich, Reference Henrich2016; Laland, Reference Laland2018).
The revolutions in behavioral genetics and cultural evolution have occurred largely independently of each other. Some attempts have been made to integrate the fields (e.g., Cavalli-Sforza & Feldman, Reference Cavalli-Sforza and Feldman1973; Cavalli-Sforza, Feldman, Chen, & Dornbusch, Reference Cavalli-Sforza, Feldman, Chen and Dornbusch1982; Creanza, Kolodny, & Feldman, Reference Creanza, Kolodny and Feldman2017; Feldman & Ramachandran, Reference Feldman and Ramachandran2018; Laland, Odling-Smee, & Myles, Reference Laland, Odling-Smee and Myles2010), with these efforts typically being launched by researchers in cultural evolution. As a result, cultural evolution has incorporated some aspects of behavioral genetics. Behavioral genetics, in turn, has been largely agnostic with respect to cultural evolution, which is perhaps understandable given the focus, size, and historical trajectory of the field. However, given the extensiveness of the cultural and culturally shaped environment, cultural evolution offers an important but typically missing complement to otherwise insightful methodological and empirical analyses within behavioral genetics (e.g., Brumpton et al., Reference Brumpton, Sanderson, Hartwig, Harrison, Vie, Cho and Howe2020; Turkheimer, Pettersson, & Horn, Reference Turkheimer, Pettersson and Horn2014; Young, Benonisdottir, Przeworski, & Kong, Reference Young, Benonisdottir, Przeworski and Kong2019).
The effect of culture in behavioral genetics is typically incorporated into a broad environmental term that is partitioned into between- and within-family variance components. While behavioral genetic research implicitly or explicitly incorporates an understanding of the way in which genetic evolution shapes genotypes, the environment – cultural or otherwise – is assumed to be exogenous or at best shaped by genes (Plomin, DeFries, & Loehlin, Reference Plomin, DeFries and Loehlin1977; Rutter, Reference Rutter2007). The environment is treated as given, while the genome is at least implicitly understood through the lens of selection and function. But just as genetic evolution offers a systematic framework for understanding how distributions of alleles change over time, cultural evolution offers a framework for understanding how distributions of cultural traits change over time; both evolving in response to ecological, demographic, and social factors. Thus, an understanding of cultural change can provide insights into the structure and dynamics of the environmental component of phenotypic variation as well as their interaction with genes. Statistical and theoretical models of gene–environment interactions and correlations are well-trod territory (Plomin et al., Reference Plomin, DeFries and Loehlin1977; Purcell, Reference Purcell2002; Rutter, Reference Rutter2007), but these models do not capture the cultural evolutionary dynamics of environmental change or the coevolutionary dynamics of gene–culture interactions and correlations.
Humans have long been evolving in ways that deeply intertwine genes and culture: A prominent example is that we have jaws too weak and guts too short for a world without controlled fire and cooked food (Aiello & Wheeler, Reference Aiello and Wheeler1995; Wrangham, Reference Wrangham2017); we lack genes for fire-making or cooking, instead relying on culture to compensate. This kind of coevolutionary history renders some aspects of gene–culture or gene–environment interactions puzzling when taken outside of a dual inheritance framework. Such insights help with interpretation of data. For example, it is well understood and also statistically obvious that reducing environmental variation will increase heritability scores (Stoolmiller, Reference Stoolmiller1999). What's less obvious is the way in which culture can either mask or unmask genetic variation, and the way in which cultural diffusion and innovation can increase or decrease heritability. It's similarly not obvious how to define a single society for the purposes of measuring heritability, without being able to identify cultural cleavages that can lead to Scarr–Rowe type effects (see sect. 4.1; Tucker-Drob & Bates, Reference Tucker-Drob and Bates2016; Turkheimer, Haley, Waldron, D'Onofrio, & Gottesman, Reference Turkheimer, Haley, Waldron, D'Onofrio and Gottesman2003). Our goal is to offer a path to reconciliation between behavioral genetics and cultural evolution with new or complementary interpretations for various puzzles, such as differences in heritability between and within populations, differences in heritability across development, and the Flynn effect. In doing so, we hope to instigate a discussion that nuances common interpretations of the nature and nurture of human behavior.
2. Interpreting heritability
Heritability is an important metric in behavioral genetics. In its standard formulation, heritability refers to the proportion of phenotypic variance for some trait that is explained by genetic variance. Much has been written about the misunderstandings and pitfalls that commonly occur when interpreting heritability (e.g., Haworth & Davis, Reference Haworth and Davis2014; Lewontin, Reference Lewontin1974; Visscher, Hill, & Wray, Reference Visscher, Hill and Wray2008; Vitzthum, Reference Vitzthum2003), and we will not recapitulate these arguments here except when necessary. Suffice to say, heritability is sometimes incorrectly treated as an index of the genetic basis of a trait, and hence as a measure of the relative contribution of nature vis-à-vis nurture.
Cultural evolutionary theory can contribute to our understanding of the interpretation of heritability by describing the processes of cultural transmission and cultural change. In standard treatments of heritability, phenotypic variance is partitioned into a component explained by genetic variance and a component explained by environmental variance. We will further conceptually partition this environmental component into a subcomponent whose distribution is shaped by cultural transmission (the cultural environment or culture) and another whose distribution is not (the ecological environment or ecology). For the purposes of exposition, we will treat these as separable, though of course this dichotomization is merely an approximation as any sharp separation between the two is in reality implausible (Laland et al., Reference Laland, Uller, Feldman, Sterelny, Müller, Moczek and Jablonka2015).
2.1 An example: Skin pigmentation and UV
Before we unfold the complexities of interpreting the cultural evolution of genetic heritability, let's begin with a simple illustration that introduces some basic concepts in both behavioral genetics and cultural evolution: the heritability of cancers associated with skin pigmentation. Genes affect the level of skin pigmentation and propensity for tanning instead of burning (Crawford et al., Reference Crawford, Kelly, Hansen, Beltrame, Fan, Bowman and Jewett2017). These are ancestral adaptations to levels of ultraviolet (UV) radiation at different latitudes (Barsh, Reference Barsh2003; Sturm & Duffy, Reference Sturm and Duffy2012). Darker pigmentation protects against high levels of UV radiation, such as near the equator. Lighter pigmentation enables vitamin D synthesis in low levels of UV radiation, such as at northern latitudes (Jablonski & Chaplin, Reference Jablonski and Chaplin2010, Reference Jablonski and Chaplin2017). It is important to get the correct amount of UV radiation – too much causes skin cancer, but too little causes vitamin D deficiency, which is associated with other health problems (Edlich et al., Reference Edlich, Mason, Chase, Fisher, Dean Gubler, Long and Giesy2009; Garland et al., Reference Garland, Garland, Gorham, Lipkin, Newmark, Mohr and Holick2006).
Worldwide migration has led to people with skin pigmentation mismatched to the level of UV radiation: Australians with European ancestry have higher rates of skin cancer compared to Australian Aboriginals and other non-European populations (Australian Institute of Health and Welfare, 2016), and conversely, Europeans with African and South Asian ancestry have higher rates of vitamin D deficiency and associated afflictions (Cashman et al., Reference Cashman, Dowling, Škrabáková, Gonzalez-Gross, Valtueña, De Henauw and Moreno2016; Spiro & Buttriss, Reference Spiro and Buttriss2014). A gene by environment interaction (G × E) approach could measure how these mismatches affect the heritability of skin cancer or vitamin D concentrations, but not how we should predict these heritability estimates to change over time through cultural evolution, specifically through diffusion and innovation. Through cultural evolution, non-genetic adaptations evolve to compensate for genetic mismatches: Fairer Australians wear sunscreen, a hat, and covered clothing (Montague, Borland, & Sinclair, Reference Montague, Borland and Sinclair2001),Footnote 2 while darker Europeans consume vitamin D supplements and vitamin D-rich or fortified foods (Spiro & Buttriss, Reference Spiro and Buttriss2014).
In this example, the challenges to measuring and interpreting heritability and understanding genome-wide association study (GWAS) results are, perhaps, more obvious than for many psychological traits. The heritability of skin cancer, for example, should be highest when there is more diversity of skin pigmentation (genes), more homogeneity of cultural practices (culture), and high UV radiation (ecology)Footnote 3; see Figure 1. While ecology and genes may change to some degree (e.g., smaller hole in the ozone layer and immigration, respectively), cultural change can be particularly fast and potent – greater uptake of anti-skin cancer practices and technologies or new medical interventions for treating cancer. In some cases, cultural evolution is broadly predictable because of directionality – few are working on ways to increase rates of skin cancer. Of course, there may be other forces that work in the opposite direction, such as a tan becoming associated with attractiveness.Footnote 4 Here, it is easier to see that heritability is a function not only of genes, traits, and ecology, but also of a cultural environment that is evolving according to dynamics that can be understood. The environment of the genome is, therefore, not an inert backdrop against which genes should be evaluated, but rather, a moving reference frame that rapidly evolves in relation to both genes and ecology.
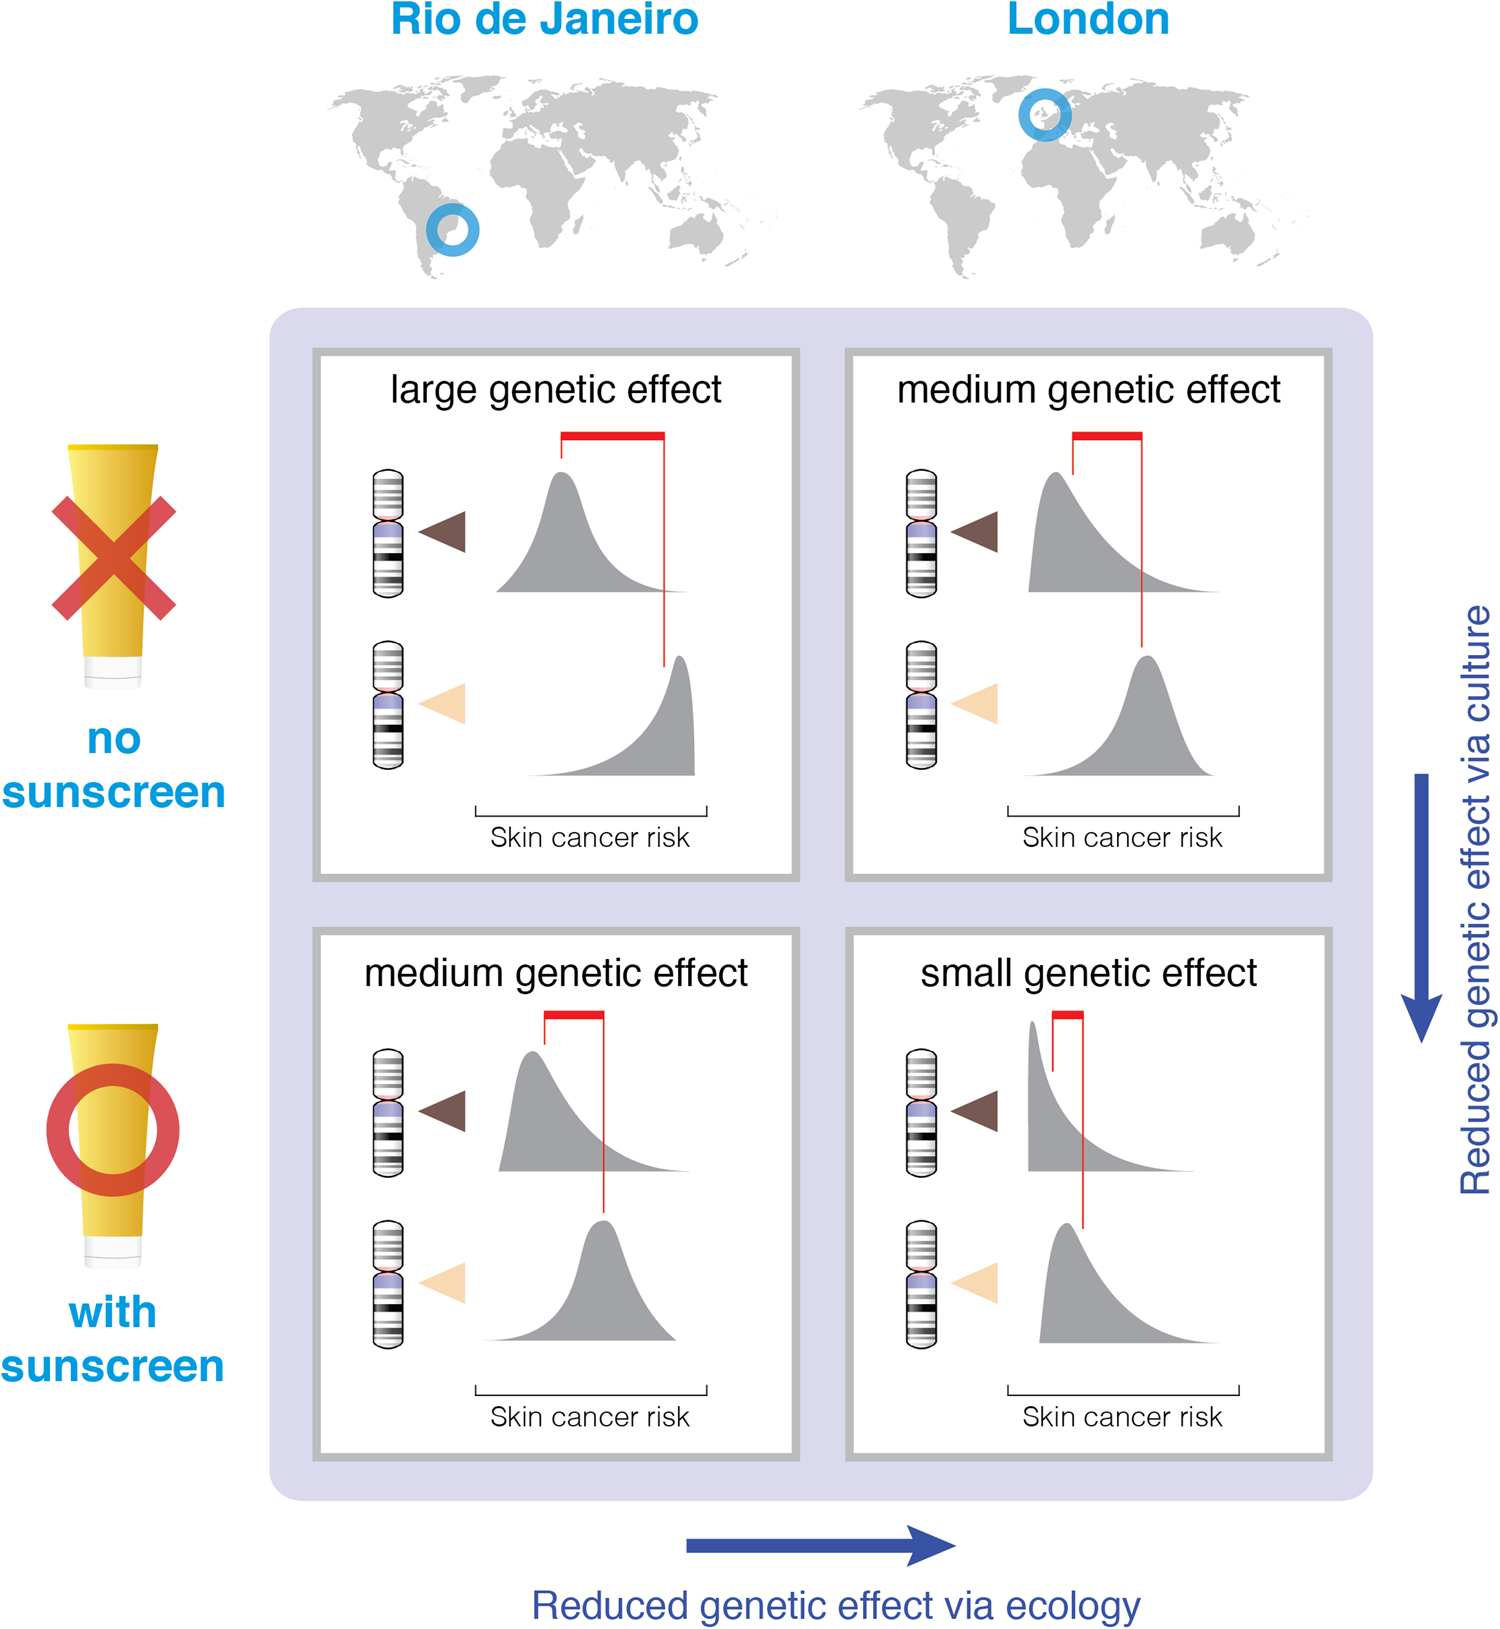
Figure 1. Illustration of the effect of sunscreen and geographic location on the effect size of a skin pigmentation gene with respect to skin cancer risk. The largest genetic effect should be found in societies that lack sunscreen and reside in locations with high levels of UV radiation (top-left square). Genetic effects should be reduced with either the introduction of sunscreen or residence in a lower-UV environment, both factors that mask the effect of skin pigmentation (bottom-left and top-right squares, respectively). The smallest effect should be found in societies that have both low UV and sunscreen (bottom-right square). Each cell represents a hypothetical scenario – if Rio and London did or did not have sunscreen. Chromosomes with dark indicators represent genes for strong pigmentation, and those with light indicators represent genes for light pigmentation. Gray distributions represent population distributions for skin cancer risk, and red lines point to the mean of each distribution.
This example helps us understand four key points. The first of these is well understood by behavioral geneticists and the second is sometimes noted, but the third and fourth points are typically absent from these discussions because of the disconnect between behavioral genetics and cultural evolution. First, there is no overarching, one-quantity heritability of a trait to be discovered. There is no fixed answer to the question, “What is the heritability of skin cancer?” Second, this answer will depend not only on ecology, but also on culture and specifically on cultural diffusion and innovation – both of which can rapidly change and therefore rapidly change heritability estimates. Third, the diffusion and innovation are broadly directional.Footnote 5 Cultural diffusion of sunscreen, clothing, shade and sunglasses, and cultural innovation toward more effective screening and treatment of melanomas all work to reduce heritability estimates. In these cases, we expect a reduction in heritability because of the masking effect of the cultural trait. Were any of these an example of culture unmasking genetic effects, such as tanning salons that induce differential risk according to the skin pigmentation level, we would have predicted an increase in heritability. Insofar as a preference for avoiding some outcome outweighs other forces that tend to bring it forth, there will be a directional trend over time, similarly to directional selection in genetic evolution (Byars, Ewbank, Govindaraju, & Stearns, Reference Byars, Ewbank, Govindaraju and Stearns2010; Sanjak, Sidorenko, Robinson, Thornton, & Visscher, Reference Sanjak, Sidorenko, Robinson, Thornton and Visscher2018). Fourth, we might also expect the cultural response to be stronger where the ecological and cultural selection pressures are stronger – skin cancer mitigation in Australia but vitamin D supplementation in Northern Europe. Heritability or changes in heritability of these cases have not been tested to our knowledge, but the predictions are clear.
Like heritability, the question “Which SNPs are associated with skin cancer?” is similarly culturally dependent. In societies where sunscreen use is common, we expect SNPs associated with skin pigmentation to be less predictive of skin cancer compared to societies where this is not the case. Similarly, we would expect SNPs associated with antioxidant metabolism (Oskina et al., Reference Oskina, Еrmolenko, Boyarskih, Lazarev, Petrova, Ganov and Tonacheva2014) to be less predictive of skin cancer in societies whose foods are rich in antioxidants – such as in traditional Mediterranean cuisine (Visioli & Galli, Reference Visioli and Galli2001).
That heritability is affected by the environment is widely understood (Charmantier & Garant, Reference Charmantier and Garant2005; Feldman & Ramachandran, Reference Feldman and Ramachandran2018; Hamer & Sirota, Reference Hamer and Sirota2000; Haworth & Davis, Reference Haworth and Davis2014; Moore & Shenk, Reference Moore and Shenk2016; Tenesa & Haley, Reference Tenesa and Haley2013; Turkheimer et al., Reference Turkheimer, Pettersson and Horn2014; Vitzthum, Reference Vitzthum2003). And researchers such as Lewontin and Feldman (Feldman & Lewontin, Reference Feldman and Lewontin1975; Lewontin, Reference Lewontin1970; Reference Lewontin1974) long ago described the fallacy of extrapolating heritability scores from one population to another. Their argument was made from the standpoint of gene–environment interactions: Genetic effects must be understood in the environmental conditions under which the genes are expressed. In this target article, we build on this rich body of research to launch a discussion of how the cultural environment changes over time and affects heritability – that is, the cultural evolution of genetic heritability (we schematically capture some of these key ideas in Fig. 2).
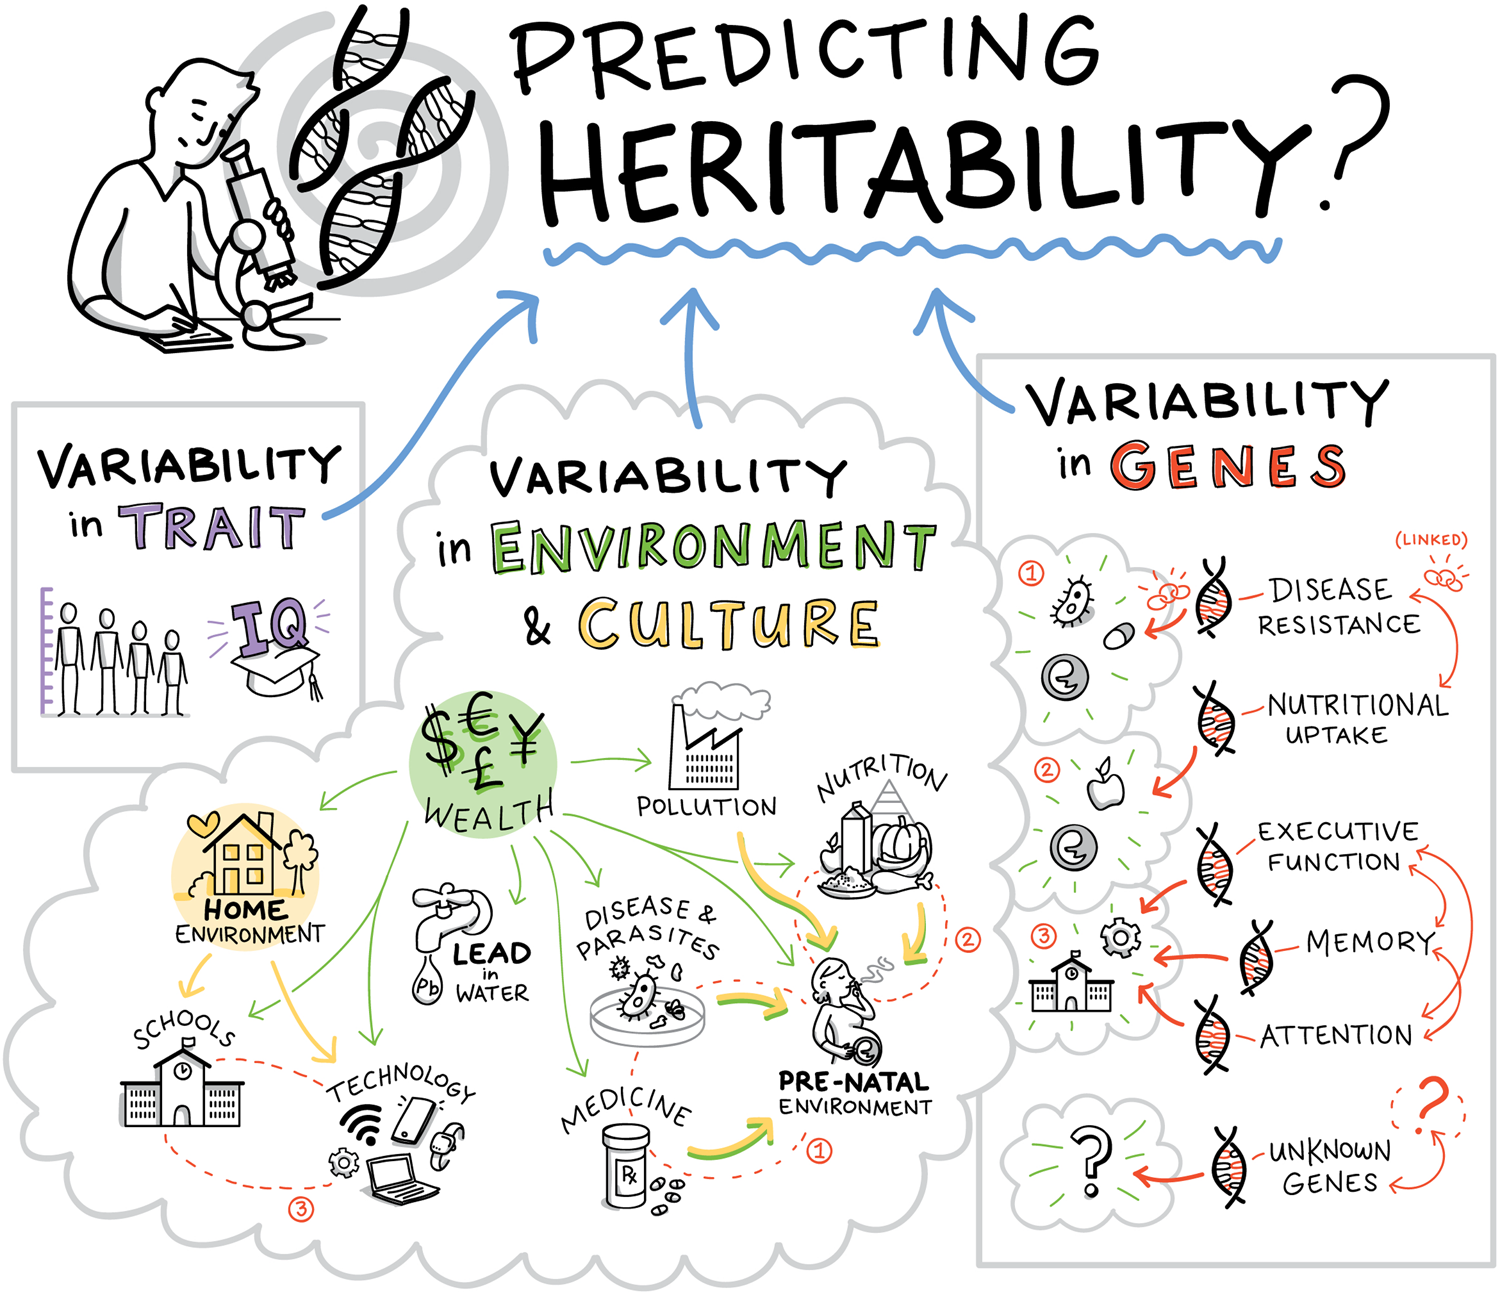
Figure 2. Genetic heritability is a function of variability in the phenotypic trait, variability in the environment, including the cultural environment, and variability in genes. Although heritability is often interpreted as a genetic effect, cultural evolution and diffusion can also systematically shape the variability of environmental variables, and thus heritability. Psychological and behavioral phenotypes are typically the outcome of a complex network of interactions that involve all these factors.
2.2 Cultural evolution shapes heritability
Assume that for a given society, we were able to collect comprehensive data on genetic effects across all relevant environmental variables that contribute to some trait. This would allow us to exhaustively map out the reaction norms (pattern of phenotypic expression across a range of environments) that specify expected phenotypic outcomes over the full range of extant genetic and environmental variation, thus setting up the conditions for a G × E analysis. But in a species like ours, extant environments are not necessarily a meaningful backdrop against which to judge genetic effects. Human environments have already been shaped over deep historical timescales by cumulative cultural evolution – functionally overlapping with genetic evolution (Richerson, Boyd, & Henrich, Reference Richerson, Boyd and Henrich2010) and can, therefore, obscure our interpretation of genetic evolution, unless properly accounted for. For humans, the environmental axes of a reaction norm analysis do not simply map out the space of environmental parameters that impact phenotypic outcomes; they rather map out the local and global peaks that have already been climbed by cultural evolution, which correspond to the many solutions to problems that have been discovered and refined over human history. Because cultural evolution enables faster adaptation compared to genetic evolution, a substantial portion of our adaptations are built into our cultures rather than our genomes.
The human environment is deeply shaped by culture. As heritability is a function of both genetic and environmental variance, cultural evolution carries significant implications for the interpretation of heritability. This idea goes back to the beginnings of the cultural evolutionary paradigm. For example, two founders of the field of cultural evolution, Cavalli-Sforza and Feldman (Reference Cavalli-Sforza and Feldman1973), modeled the effect of parent-to-child (“vertical”) cultural transmission on standard behavioral genetic estimates of genetic effects, showing that vertical transmission should inflate heritability estimates relative to a gene-only model. In contrast, here we focus on a different aspect of the interplay between culture and heritability, namely how oblique and horizontal transmission can impact heritability through processes of broad diffusion that systematically shape phenotypic distributions. We begin this discussion by describing the effects of cultural diffusion and innovation upon heritability, as well as the predictions we can make for differences in heritability between societies.
2.2.1 Cultural diffusion
In human societies, mechanisms such as conformist-biased learning (learning from the majority or plurality at a rate above population frequency; Boyd & Richerson, Reference Boyd and Richerson1985; Cavalli-Sforza & Feldman, Reference Cavalli-Sforza and Feldman1981; Muthukrishna, Morgan, & Henrich, Reference Muthukrishna, Morgan and Henrich2016), payoff biases (e.g., learning from successful others; Boyd & Richerson, Reference Boyd and Richerson1985; Cavalli-Sforza & Feldman, Reference Cavalli-Sforza and Feldman1981), and norm enforcement (identifying norms and punishing norm violators; Chudek & Henrich, Reference Chudek and Henrich2011) result in particular behaviors, beliefs, and norms disseminating widely across a society. To the degree that these cultural traits mask the effects of genes (such as in the skin cancer and vitamin D examples), heritability is reduced. In contrast, to the degree to which these cultural traits unmask or interact positively with genes without masking, heritability is increased.
One example that can illustrate both masking and unmasking through diffusion is genes that support the perception of lexical tone in tonal languages such as Cantonese and Yoruba (Dediu & Ladd, Reference Dediu and Ladd2007; Wong et al., Reference Wong, Kang, Wong, So, Choy and Geng2020). To the degree that tonal languages such as Cantonese or Yoruba diffuse in the population (and holding constant other genetic contributions), heritability of language ability would increase in a manner proportional to variation in these genes; to the degree that non-tonal languages such as Norwegian or Russian diffuse in the same population, heritability of language ability would decrease. As another example: It is known that fertility is predicted by genes (Zietsch, Kuja-Halkola, Walum, & Verweij, Reference Zietsch, Kuja-Halkola, Walum and Verweij2014), but Briley, Paige Harden, and Tucker-Drob (Reference Briley, Paige Harden and Tucker-Drob2015) report a large rise in the heritability of fertility in the United States over the mid-twentieth century, likely because of the increase in the variety of acceptable reproductive choices that was brought about by the diffusion of new social values. In this case, an increase in cultural variance unmasked the effect of genes associated with reproductive behaviors and preferences. Conversely, cultural or policy changes that reduce variation in reproductive practices – such as rigid childbearing norms or a one-child policy – would be expected to mask the genetic effect.
The diffusion of cultural traits is not random and is, in fact, well studied within cultural evolution and elsewhere (Henrich, Reference Henrich2001; Muthukrishna & Henrich, Reference Muthukrishna and Henrich2016; Rogers, Reference Rogers2003). One mechanism for cultural diffusion that is important in industrialized societies is formal education. We use this example, because the effect of this particular cultural institution on heritability has been studied. Samuelsson et al. (Reference Samuelsson, Byrne, Olson, Hulslander, Wadsworth, Corley and Willcutt2008) measured the heritability of reading and spelling test scores. Australian twins demonstrated a narrow-sense heritability of 0.84 in kindergarten and a similar score of 0.80 in Grade 1. In contrast, Swedish and Norwegian twins demonstrated a heritability of only 0.33 in kindergarten, rising to 0.79 in Grade 1. Heritability was at the same level in both the Australian and Scandinavian children in Grade 1, but not in kindergarten. Why? Cultural diffusion of literacy. Australian children begin receiving compulsory literacy instruction in kindergarten, while in Scandinavia the kindergarten curriculum emphasizes social, emotional, and esthetic development – literacy instruction only begins in Grade 1. Here, we see the effect of national curriculum policy differences affecting cultural diffusion of literacy and thus heritability, in a case where the cultural trait interacts with genes. Australian kindergarteners are exposed to standardized environmental input and much of the remaining variation in reading ability is explained by genetic differences, whereas for the Swedish and Norwegian kindergarteners, variation in the amount of reading instruction received at home is much larger than any genetic differences. In line with this interpretation, Samuelsson et al. (Reference Samuelsson, Byrne, Olson, Hulslander, Wadsworth, Corley and Willcutt2008) show that the boost in heritability among the Scandinavian children was also accompanied by an almost equivalent decrease in phenotypic variance attributed to the common (home) environment, which would include home instruction.
If we were to assess the genetic basis of literacy skill in schoolchildren without accounting for the impact of their particular educational curricula on cultural diffusion and environmental variation, we would be subjecting ourselves to a selection bias, with no idea of the magnitude of this bias. This would distort our understanding of the generalizability of our finding to samples that have undergone different educational curricula, and even more so to those with different levels of educational attainment. Note that even the literacy instruction provided in the home environment is already shaped by cultural evolution, both in terms of the content being transmitted (reading and spelling), and the structures that are transmitting (family organization in Western countries; Henrich, Reference Henrich2020; Schulz et al., Reference Schulz, Bahrami-Rad, Beauchamp and Henrich2019). In societies that produce literate children, culture impacts the heritability of literacy from the moment that variation in this trait emerges in development, virtually sealing off the possibility of assessing “baseline” heritability without cultural interference, even at the very start of life (e.g., children born in literate societies are typically surrounded by writing and literate adults). Heritability is a composite measure that captures both genetic and cultural effects, and without knowledge of the cultural context, it is difficult or impossible to judge what is being measured. When we say that the heritability of reading among Scandinavian children jumps up to 0.79 when they enter Grade 1, this measurement reveals just as much if not more about the disseminative power of modern schooling than it does about the genetic basis of literacy.
Looking toward a broader social context, several insightful studies have shown that the heritability of educational attainment increases with equality of opportunity. We see evidence for this within countries over time (Heath et al., Reference Heath, Berg, Eaves, Solaas, Corey, Sundet and Magnus1985), within and between countries over time (Engzell & Tropf, Reference Engzell and Tropf2019; de Zeeuw, de Geus, & Boomsma, Reference de Zeeuw, de Geus and Boomsma2015), and within countries following a major policy change (Colodro-Conde, Rijsdijk, Tornero-Gómez, Sánchez-Romera, & Ordoñana, Reference Colodro-Conde, Rijsdijk, Tornero-Gómez, Sánchez-Romera and Ordoñana2015; Rimfeld et al., Reference Rimfeld, Krapohl, Trzaskowski, Coleman, Selzam, Dale and Esko2018; Ujma et al., Reference Ujma, Eszlári, Millinghoffer, Bruncsics, Török, Petschner, Antal, Deakin, Breen, Bagdy and Juhász2022). Although there is also some evidence going in the other direction (Silventoinen et al., Reference Silventoinen, Jelenkovic, Sund, Latvala, Honda, Inui and Tomizawa2020), the overall pattern appears to be that diffusion of educational opportunity results in genes explaining a relatively greater proportion of variance in educational attainment. These studies serve as robust demonstrations of how heritability can be boosted by changes in social context broadly, and diffusion of particular forms of environmental exposure more specifically. Although these patterns are broadly consistent with our thesis, both the consistent and inconsistent results may obscure cultural structuring, such as the hidden cluster problem and cultural Simpson's paradox, as we discuss in section 3.
2.2.2 Cultural innovation
The human capacity for cumulative cultural evolution (Dean et al., Reference Dean, Vale, Laland, Flynn and Kendal2014; Henrich, Reference Henrich2004a) ensures that in our societies, the diffusion of extant cultural traits goes hand-in-hand with the continual generation of new cultural traits. Whether emerging through serendipitous discovery, iterated trial-and-error, or recombination of ideas, some portion of new technologies and behaviors manages to spread across a society, displacing other competing variants. The dynamics of innovation are a significant component of the cultural evolutionary framework (Henrich, Reference Henrich2004a; Muthukrishna & Henrich, Reference Muthukrishna and Henrich2016).
Cultural evolution predicts that societies will vary in their rate and type of cultural innovation (e.g., number of patents and incremental vs. revolutionary invention) because of differences in, for example, the size and interconnectedness of their social networks (sociality), effectiveness of cultural transmission (e.g., education), and tolerance for diversity; for a review see Muthukrishna and Henrich (Reference Muthukrishna and Henrich2016). Tolerance for diversity can drive differences in heterogeneity. Some societies such as Pakistan and Indonesia maintain relatively low levels of cultural heterogeneity, whereas others such as Brazil and Australia maintain relatively high levels of heterogeneity. One metric that can serve as a proxy for this tolerance is cultural tightness/looseness, which represents the degree to which societies tolerate deviation from social norms, and is expected to correspond to their rate of innovation (Gelfand, Reference Gelfand2018; Gelfand, Nishii, & Raver, Reference Gelfand, Nishii and Raver2006; Gelfand et al., Reference Gelfand, Raver, Nishii, Leslie, Lun, Lim and Duan2011). Societies that are more tolerant of cultural variation allow for more individual-level exploration, and if the best of these cultural mutants can be selectively incorporated into the mainstream, those societies will tend to undergo higher rates of increase in cultural complexity (Henrich, Reference Henrich2004a). Cultural variation is the engine of cultural change. Aside from variables such as cultural looseness, policies such as social safety nets and forgiving bankruptcy laws can also create the incentive structure for promoting exploration and innovation (Muthukrishna & Henrich, Reference Muthukrishna and Henrich2016).
The initial spread of an innovation will be tied to an increase in environmental variance if that innovation is disrupting an earlier, relatively homogeneous state. To the degree that innovation is masking genes, heritability will begin to decrease. To the degree that innovation is unmasking genes, heritability will begin to increase.
2.2.3 Predicting differences in heritability across societies
Over long historical durations, cultural evolution tends toward a compressive environmental effect, as ecological problems are solved and more favorable environmental conditions spread. But on shorter timescales, diffusion and innovation have opposing effects on environmental variance. Although indoor plumbing, antibiotics, and formal education have diffused to the point of being ubiquitous in the Western world, new innovations are also constantly emerging. During their early spread, such innovations increase environmental variance and between-group differences, thereby bringing forth new forms of diversity and inequality. But, as these new traits diffuse further, some of them become gradually established within the cultural corpus, reducing environmental variation through homogenization. The dynamics of diffusion and innovation thus differ in their effects, although the magnitude and direction of these effects also depend upon whether the trait in question masks or unmasks genetic variation. Moreover, across societies, the balance between diffusion and innovation differs as well.
If we imagine a society in which innovations are rapidly diffused across the whole society shortly after they emerge, the society will have a low level of cultural variation at most times. This is a society in which a high rate of diffusion quickly overpowers the environmental variance-increasing potential of cultural innovation. Now imagine a contrasting society in which innovations take a much longer time to diffuse. Perhaps, the society is more culturally clustered with less interaction between individuals in different subgroups, or perhaps there is a subset of individuals who are well-connected with the inventor and become early adopters but the novel trait diffuses only gradually beyond this inner circle. This would be a culturally unequal society that is characterized by high environmental variability at any given point in time. This kind of stunted diffusion may suggest cultural clustering, with relatively dense connections within subgroups and relatively sparse connections between subgroups. In such societies, even highly useful forms of cultural knowledge may not easily permeate social barriers, and the waves of environmental change are correspondingly “loose.” These barriers are not necessarily ethnic boundaries: They could be organized around class, wealth, occupation, political alignment, religion, or incidental geographic layout. A society may be clustered for reasons that stem from within the society itself, or it could simply be a matter of nominal mismatch between the political boundaries that we use to refer to a society and the actual organization of cultural groups. Greater differential clustering can lead to a cultural Simpson's paradox (discussed in sect. 3.4).
We can derive testable hypotheses from these dynamics: Culturally homogeneous societies will have higher heritability for culturally transmissible phenotypic traitsFootnote 6 compared to culturally diverse or clustered societies. We model this prediction in the Appendix. One way to measure cultural diversity would be to use cultural tightness/looseness as a proxy (Gelfand et al., Reference Gelfand, Nishii and Raver2006, Reference Gelfand, Raver, Nishii, Leslie, Lun, Lim and Duan2011). One way to measure cultural clustering would be to use the cultural fixation index (CF ST) as a measure of cultural distance between groups within a society (Muthukrishna et al., Reference Muthukrishna, Bell, Henrich, Curtin, Gedranovich, McInerney and Thue2020) – we discuss this in more detail in section 3.2. Whatever the measure, homogeneity of cultural traits should be associated with higher heritability on average, but with respect to specific traits, the relationship between homogeneity and heritability will also depend upon the genetic masking or unmasking effect of the trait.
For cultural traits that neither mask nor unmask genetic effects, heritability will generally be higher in culturally homogeneous societies than in culturally diverse societies because of the reduced environmental variance that is a consequence of behavioral uniformity, as described above. For cultural traits that unmask genes, heritability will be higher overall compared to traits that neither mask nor unmask, and on average higher in homogeneous societies than in diverse societies. For cultural traits that mask genes, heritability will be lower overall compared to traits that neither mask nor unmask, but whether it is higher in homogeneous or diverse societies will depend upon which has the stronger effect: genetic masking or the reduction in environmental variance accompanying homogeneity. If the effect of genetic masking is stronger, heritability will be lower in culturally homogeneous societies than that in culturally diverse societies; if the reduction in environmental variance is stronger, heritability will be higher in homogeneous societies than that in diverse societies.
Thus, heritability estimates reflect cultural evolutionary dynamics. Researchers such as Harden (Reference Harden2021) have highlighted how heritability can be used as a tool for measuring useful characteristics across environments such as cross-national differences in social opportunity. These interpretations are consilient with our approach, but are limited by treating the environment as exogenous rather than modeling its dynamics and interactions. Such complexities in the role of the cultural environment have historically been obscured, because, in part, of a number of methodological and epistemological problems that encumber standard behavioral genetic analysis.
3. Problems that obscure the effect of culture
The effects of cultural evolution on our understanding of heritability are complex, but we hope that at least the significance of this relationship has now become more obvious. At the very least, we hope this target article will spark a vibrant discussion of the role of cultural evolution in behavioral genetics. There are several features of behavioral genetic methodology that tend to obscure the effect of culture and cultural evolution. Here, we will discuss three of these problems – the western, educated, industrialized, rich, and democratic (WEIRD) sampling problem, the hidden cluster problem, and the causal locus problem – and then describe a cultural Simpson's paradox that emerges at their junction. Various aspects of these problems have been discussed in prior literature, but we will focus on how the problems specifically interact with the detection and interpretation of effects stemming from cultural evolution. Clarity regarding these issues will be a first step toward integrating the cultural evolutionary framework with behavioral genetics.
3.1 WEIRD sampling problem
Behavioral genetics suffers from its own variant of the WEIRD people problem, which was originally raised in the field of experimental psychology (Apicella, Norenzayan, & Henrich, Reference Henrich2020; Henrich et al., Reference Henrich, Heine and Norenzayan2010). The WEIRD people problem refers to the vast over-representation in the published studies of individuals from developed Western countries, who are similar in their cultural history, social values, and standards of living. Just as behavioral experimental samples are psychologically WEIRD, behavioral genetic samples are both genetically and culturally WEIRD. This results in a WEIRD sampling problem that limits the variation required to make sense of genetic effects. This problem involves both genetic and cultural restriction of range, and we will discuss each in turn.
3.1.1. WEIRD genetics
A comprehensive meta-analysis that claims to contain essentially all twin studies published between 1958 and 2012 (Polderman et al., Reference Polderman, Benyamin, de Leeuw, Sullivan, van Bochoven, Visscher and Posthuma2015) reveals that 94% of sampled twin pairs were from Western populations. The United States, United Kingdom, and Australia alone accounted for almost 60%, and Nordic countries accounted for another 25%. Of the non-Western countries (6%), two-thirds (4%) are from northeast Asia – specifically, China, Japan, South Korea, and Taiwan, countries that are not Western, but have most of the remaining letters of the WEIRD acronym. The remainder of the world, representing the vast majority of the human population, accounts for only 2% of the dataset.
GWASs too suffer from a myopic focus on WEIRD genomes (Need & Goldstein, Reference Need and Goldstein2009; Popejoy & Fullerton, Reference Popejoy and Fullerton2016; Sirugo, Williams, & Tishkoff, Reference Sirugo, Williams and Tishkoff2019). As of 2017, 88% of samples in GWASs were of European ancestry (Mills & Rahal, Reference Mills and Rahal2019).Footnote 7 Paralleling the twin studies data, 72% of participants were recruited from just three countries – United States, United Kingdom, and Iceland – with nearly 20% of the remainder being recruited from Japan, China, and South Korea.
Polygenic scores do not translate well across ancestry groups (Bitarello & Mathieson, Reference Bitarello and Mathieson2020; Curtis, Reference Curtis2018; Guo et al., Reference Guo, Bakshi, Wang, Jiang, Yengo, Goddard and Visscher2021; Kim, Patel, Teng, Berens, & Lachance, Reference Kim, Patel, Teng, Berens and Lachance2018; Martin et al., Reference Martin, Gignoux, Walters, Wojcik, Neale, Gravel and Daly2017, Reference Martin, Kanai, Kamatani, Okada, Neale and Daly2019). For example, European ancestry-derived polygenic scores have only 42% of the effect size in African ancestry samples (Duncan et al., Reference Duncan, Shen, Gelaye, Meijsen, Ressler, Feldman and Peterson2019). From a cultural evolutionary perspective, this is not unexpected given the cultural environment, coevolution between culture and genes, and cultural differences between populations.
Polygenic scores are also highly sensitive to inadequately controlled population stratification (Berg et al., Reference Berg, Harpak, Sinnott-Armstrong, Joergensen, Mostafavi, Field and Boyle2019; Morris, Davies, Hemani, & Smith, Reference Morris, Davies, Hemani and Smith2020; Sohail et al., Reference Sohail, Maier, Ganna, Bloemendal, Martin, Turchin and Chiang2019). Even within a single ancestry group, the predictive accuracy of polygenic scores can be dependent on age, sex, and socioeconomic status (Mostafavi et al., Reference Mostafavi, Harpak, Agarwal, Conley, Pritchard and Przeworski2020) – this too, from a cultural evolutionary perspective, is not unexpected given the cultural variation that exists within a population (Muthukrishna & Henrich, Reference Muthukrishna and Henrich2019; Muthukrishna et al., Reference Muthukrishna, Bell, Henrich, Curtin, Gedranovich, McInerney and Thue2020). Similarly, the SNPs that contribute to the variance of a trait are different in different populations (Akiyama et al., Reference Akiyama, Ishigaki, Sakaue, Momozawa, Horikoshi, Hirata and Matsuda2019; Gurdasani et al., Reference Gurdasani, Carstensen, Fatumo, Chen, Franklin, Prado-Martinez and Bouman2019; Pemberton et al., Reference Pemberton, Verdu, Becker, Willer, Hewlett, Le Bomin and Froment2018; Rotimi et al., Reference Rotimi, Bentley, Doumatey, Chen, Shriner and Adeyemo2017) and it is difficult to disentangle the genetic, environmental, and cultural contribution to differing polygenic scores between populations (Rosenberg, Edge, Pritchard, & Feldman, Reference Rosenberg, Edge, Pritchard and Feldman2019). Recent projects have aimed to capture a greater degree of global human genetic diversity (e.g., Simons Genome Diversity Project, Mallick et al., Reference Mallick, Li, Lipson, Mathieson, Gymrek, Racimo and Zhao2016; the exome analysis of Lek et al., Reference Lek, Karczewski, Minikel, Samocha, Banks, Fennell and O'Donnell-Luria2016; and the GenomeAsia project, Wall et al., Reference Wall, Stawiski, Ratan, Kim, Kim, Gupta and Suryamohan2019), but we are far from proportionately representing the genetic diversity of the global population.
3.1.2. WEIRD culture
When we restrict the scope of genetic samples, the cultural environment against which genetic effects are evaluated also becomes skewed, and this greatly reduces the interpretability of genetic effects. Because of a combination of cultural-group dynamics (Chudek & Henrich, Reference Chudek and Henrich2011; Henrich, Reference Henrich2004b; Richerson et al., Reference Richerson, Baldini, Bell, Demps, Frost, Hillis and Mathew2016) and cumulative cultural evolution (Dean et al., Reference Dean, Vale, Laland, Flynn and Kendal2014; Henrich, Reference Henrich2004a), the human species is characterized by large amounts of cultural and hence environmental variation between societies, which exceeds genetic variation by orders of magnitude (Bell, Richerson, & McElreath, Reference Bell, Richerson and McElreath2009). The WEIRD countries that are over-represented in genetic samples are clustered together along multiple cultural dimensions (Hofstede, Reference Hofstede2001; Inglehart & Welzel, Reference Inglehart and Welzel2005; Muthukrishna et al., Reference Muthukrishna, Bell, Henrich, Curtin, Gedranovich, McInerney and Thue2020), and are perhaps an extreme unrepresentative outlier on many psychological and behavioral measures, with these countries registering the highest scores for traits such as individualism, analytical thinking, and prosociality toward strangers, and the lowest scores on opposite constructs such as collectivism, holistic thinking, and prosociality toward relatives but not strangers (Henrich, Reference Henrich2020; Henrich et al., Reference Henrich, Heine and Norenzayan2010; Muthukrishna et al., Reference Muthukrishna, Bell, Henrich, Curtin, Gedranovich, McInerney and Thue2020; Schulz et al., Reference Schulz, Bahrami-Rad, Beauchamp and Henrich2019).
WEIRD societies are also roughly aligned on basic environmental factors such as technology, civil infrastructure, healthcare, schooling, and transportation, with typically advanced levels in each of these. Within each of these countries as well, inequality is low compared to non-WEIRD countries, as can be inferred from the comparatively low Gini coefficients of Western countries, with the United States being somewhat of an unequal outlier (Selita & Kovas, Reference Selita and Kovas2019).
Just as this restricted cultural range limits our understanding of human psychology (Henrich et al., Reference Henrich, Heine and Norenzayan2010), it also limits the inferences that can be made about human genetics. Behavioral geneticists understand that genes can have different effects under different environmental conditions (Assary, Vincent, Keers, & Pluess, Reference Assary, Vincent, Keers and Pluess2018; Moffitt, Caspi, & Rutter, Reference Moffitt, Caspi and Rutter2005), but there is less appreciation of how those environmental conditions and interactions change through cultural evolution. Cultural evolution can mask or unmask genetic effects, such that gene function becomes confounded with the effect of the cultural environment in a manner that is dependent on the specifics of the underlying dynamics. Cutting through this confound requires a theoretical understanding of the cultural dynamics as well as empirical data on genetic effects across a wide variety of cultural environments. The WEIRD sampling problem, therefore, harms accurate inference of genetic effects.
3.2 Hidden cluster problem
Despite this severe restriction of range among behavioral genetic samples, these samples may also paradoxically be too inclusive. This is because of the presence of cultural clusters that introduce population structure into genetic samples, but which remain hidden to standard behavioral genetic methods. A cultural evolutionary approach can help reveal environmental structure that does not necessarily map onto conventional demographic groupings.
3.2.1 Cultural clustering
Whether the method is a twin study or GWAS, behavioral genetic studies typically draw their data from databases such as twin registries or biobanks, whose coverage spans some circumscribed geographic range such as a country or a subnational region. Because these samples trace over political or administrative boundaries, they may not match up with the actual structure of environmental variation, which will often be dependent upon the organization of cultural clustering. Culture, generally, tends to agglomerate, such that groups of individuals who are bound together by dense links of cultural influence share a substantially greater number of features of their cultural environment than do individuals who belong to different groups (Richerson et al., Reference Richerson, Baldini, Bell, Demps, Frost, Hillis and Mathew2016). As has been discussed extensively in the cultural evolutionary literature, this in-group similarity is generated and maintained by processes such as conformist learning (Boyd & Richerson, Reference Boyd and Richerson1985), norm enforcement (Chudek & Henrich, Reference Chudek and Henrich2011; Fehr & Fischbacher, Reference Fehr and Fischbacher2004), symbolic markers of in-group membership (Boyd & Richerson, Reference Boyd and Richerson1987), and cultural-group selection (Henrich, Reference Henrich2004b; Richerson et al., Reference Richerson, Baldini, Bell, Demps, Frost, Hillis and Mathew2016). The structure of environmental variation is, thus, shaped by networks of cultural interaction, and the topology of these networks is assembled over time by cultural-group dynamics and cultural evolution.
A highly clustered population is one that can be easily partitioned into multiple subgroups whose members share among each other cultural traits that are substantially different from those found in other subgroups. When we know the underlying social network, network clustering algorithms (Emmons, Kobourov, Gallant, & Börner, Reference Emmons, Kobourov, Gallant and Börner2016) can help identify these clusters. When we have measures of a range of cultural traits, we can see the effects of clustered cultural influence by measuring the cultural distance between subgroups, for example by using CF ST (Muthukrishna et al., Reference Muthukrishna, Bell, Henrich, Curtin, Gedranovich, McInerney and Thue2020). CF ST applies the “fixation index” (Cavalli-Sforza, Menozzi, & Piazza, Reference Cavalli-Sforza, Menozzi and Piazza1994) to the World Values Survey of cultural beliefs and behaviors (Inglehart et al., Reference Inglehart, Haerpfer, Moreno, Welzel, Kizilova, Diez-Medrano and Lagos2014), and can quantify the cultural differentiation between any two groups. When applied to subgroups within societies, this measure can tell us, for example, the degree to which Singaporean Catholics differ from Singaporean Protestants, thus identifying the degree to which a nation state or other political grouping contains large clustering (note that this is different than diversity – a country may be diverse, but uniformly so, showing no large clustering).
Cultural clusters are typically created by barriers that impede cultural interaction, such as topography (e.g., mountain ranges or bodies of water separating populations) or cultural conflict (e.g., conflicting religious beliefs). Mutually unintelligible languages are an example of a social barrier that impedes cultural and even genetic mixing. Thus, the density of languages within a population will also predict clustering. A topographically fractured country like Papua New Guinea with its 839 often mutually unintelligible languages is likely to be a much more clustered population than an equally populated but less multilingual society like Austria. Populations can also become clustered because of more extrinsic factors. Countries that grew through recent immigration, such as Canada, are likely to have more clustering than countries that are characterized by relative cultural homogeneity, such as Japan (Fearon, Reference Fearon2003). Countries whose borders are drawn arbitrarily with respect to the geographic arrangement of cultural groups, for example as a product of past colonial administration (many countries in Africa), are also likely to have high clustering (Michalopoulos & Papaioannou, Reference Michalopoulos and Papaioannou2020). Note the parallel between the present argument and assortative mating (Schwartz, Reference Schwartz2013): whereas assortative mating results in phenotypic clustering because of reproduction, cultural transmission results in phenotypic clustering because of segregated learning.
Moreover, cultural clusters may cut through divisions of society that we don't always think of as being “cultural,” such as stratification by social class or wealth. The strength of this stratification regulates the amount of within-stratum versus between-stratum cultural interaction. Although this picture may be complicated by factors such as prestige bias engendering asymmetric influence from upper to lower classes (Henrich & Gil-White, Reference Henrich and Gil-White2001), such forms of social hierarchy can create clusters. These examples show that cultural clustering is not necessarily bound by geographic contiguity. Although spatial proximity is a good predictor of cultural influence, cultural influence may also be decoupled from geography, particularly with modern forms of mass media and information technology (Anderson, Reference Anderson2006; Martin & Yurukoglu, Reference Martin and Yurukoglu2017). In section 4.1, we discuss in more detail how cultural clustering may contribute to the phenomenon of differential heritability across socioeconomic levels.
In sum, the scope of a genetic sample is often defined by political and administrative boundaries, but these boundaries may be mismatched to the organization of cultural clusters within a society, and the extent of this mismatch will vary greatly across populations. So, in addition to measuring cultural variation (diversity) using indices such as cultural looseness, we need to also measure cultural clustering (“segregated diversity”) to fully understand the environment. Once we are able to do this, the next intellectual step would be to achieve an understanding of the superimposition of cultural and genetic clusters as well as their interaction.
3.2.2 Contrasts between cultural and genetic clustering
Behavioral geneticists have devoted much effort to the study of genotypic clustering, usually referred to as population stratification or population structure. Populations can become stratified in the presence of genetic variation arising from systematic differences in subpopulation ancestry or from other forms of structured, non-random mating (Brumpton et al., Reference Brumpton, Sanderson, Hartwig, Harrison, Vie, Cho and Howe2020). This kind of genetic clustering can introduce spurious associations between genotypes and traits. As such, researchers continue to develop an array of methods for dealing with this problem (Hellwege et al., Reference Hellwege, Keaton, Giri, Gao, Velez Edwards and Edwards2017; Price, Zaitlen, Reich, & Patterson, Reference Price, Zaitlen, Reich and Patterson2010).
Genetic clustering and cultural clustering are linked – a well-known example is the close alignment of genes and languages in historical populations (Cavalli-Sforza, Reference Cavalli-Sforza2001; Cavalli-Sforza, Piazza, Menozzi, & Mountain, Reference Cavalli-Sforza, Piazza, Menozzi and Mountain1988; Pagani et al., Reference Pagani, Kivisild, Tarekegn, Ekong, Plaster, Romero and Ayub2012; Tishkoff et al., Reference Tishkoff, Reed, Friedlaender, Ehret, Ranciaro, Froment and Hirbo2009). This gene–language alignment occurs because languages, similar to genes, have traditionally been transmitted vertically – that is, from parents to children or within the family. This is because of critical periods for language learning that close as early as 6 months for phonology (Kuhl, Williams, Lacerda, Stevens, & Lindblom, Reference Kuhl, Williams, Lacerda, Stevens and Lindblom1992) and year 7 for grammar (Johnson & Newport, Reference Johnson and Newport1989), because of plasticity in the relevant cortical networks being progressively staunched by “molecular brakes” (Werker & Hensch, Reference Werker and Hensch2015). Early learning of this kind is primarily dispensed by parents or other immediate caretakers (Hewlett, Fouts, Boyette, & Hewlett, Reference Hewlett, Fouts, Boyette and Hewlett2011; Kline, Boyd, & Henrich, Reference Kline, Boyd and Henrich2013), and it is unsurprising that genes and languages should be largely aligned in reconstructions of population history.Footnote 8
However, beyond early childhood, children become increasingly exposed to other children from different families as well as to non-kin adults, and the range of sources for cultural learning widens accordingly: a two-stage model of cultural learning (Kline et al., Reference Kline, Boyd and Henrich2013). Because of transmission through these horizontal (i.e., age-peers) and oblique (i.e., non-parent adults) channels, cultural learning becomes untethered from strict vertical transmission and extends laterally across genetic lineages, similar in structure to horizontal gene transfer that is prevalent in bacteria and archaea (Soucy, Huang, & Gogarten, Reference Soucy, Huang and Gogarten2015). Similar to horizontal gene transfer, horizontal cultural transmission is rapid, because of it being unconstrained by the generational cycle of vertical transmission. Oblique and horizontal transmission play a large role in cultural diffusion both within and across extant small-scale societies (Henrich & Henrich, Reference Henrich and Henrich2010; Hewlett et al., Reference Hewlett, Fouts, Boyette and Hewlett2011; Kline et al., Reference Kline, Boyd and Henrich2013), just as they do in large-scale industrialized societies where innovation, knowledge, and practices across domains such as technology, art, education, political systems, and supernatural beliefs commonly diffuse horizontally (Rogers, Reference Rogers2003). Indeed, with only vertical transmission, culturally evolution as it is currently understood would not work (Enquist et al., Reference Enquist, Strimling, Eriksson, Laland and Sjostrand2010). The importance of oblique and horizontal transmission in human cultural evolution may have been amplified by adaptations such as the timing of weaning relative to brain maturation, which is substantially earlier in our species than would be expected on the basis of our close primate relatives, thereby expediting the human child's exposure to cultural models other than parents (Finlay & Uchiyama, Reference Finlay, Uchiyama and Kaas2020; Hawkes & Finlay, Reference Hawkes and Finlay2018).
Because, in part, of horizontal transmission, the diffusion of culture can occur much more rapidly than the diffusion of genes, or “demic” diffusion. In historical populations, the speed of demic diffusion has been limited by rates of reproduction and migration (Ammerman & Cavalli-Sforza, Reference Ammerman and Cavalli-Sforza1984; Fort, Reference Fort2012). Horizontal transmission is the diffusion of ideas rather than people and has no such limits; cultural clusters are, therefore, more fluid and malleable than genetic clusters. For example, if archeological data show cultural commonality between two contemporaneous populations but genomic analyses suggest disjunction, we can often infer that the shared cultural traits between the two groups were because of cultural transmission rather than migration or admixture (e.g., Fu et al., Reference Fu, Posth, Hajdinjak, Petr, Mallick, Fernandes and Furtwängler2016; Olalde et al., Reference Olalde, Brace, Allentoft, Armit, Kristiansen, Booth and Rohland2018).
Cultural clusters are not only more fluid than genetic clusters, but they also explain intergroup differences better than genes do. Cultural distances between neighboring countries are an order of magnitude larger than genetic distances (Bell et al., Reference Bell, Richerson and McElreath2009). Among small-scale societies in Kenya, pastoral clans are differentiated by cultural traits considerably more than they are by genes, and cooperation among these clans is predicted by their cultural – but not geographic – distance to each other (Handley & Mathew, Reference Handley and Mathew2020). These findings are consistent with the predictions of cultural-group selection (Henrich, Reference Henrich2004b; Richerson et al., Reference Richerson, Baldini, Bell, Demps, Frost, Hillis and Mathew2016), particularly in how competition between cultural trait-groups helps explain the evolution of human cooperation (Henrich & Muthukrishna, Reference Henrich and Muthukrishna2021). Cultural-group selection requires large differences between groups of cultural traits relative to differences within groups (Apicella, Marlowe, Fowler, & Christakis, Reference Apicella, Marlowe, Fowler and Christakis2012; Fehr & Fischbacher, Reference Fehr and Fischbacher2003).
Reconciliation between cultural evolution and behavioral genetics requires an update in the way we think about culture. An ethnolinguistic conception of culture that revolves around vertical transmission roughly in alignment with genes is insufficient. For example, linguistic, ethnic, religious, or caste boundaries can create genetic population structure through endogamous marriage practices, whereby individuals marry others who are culturally similar. In the modern world, such assortative mating may be exaggerated as people become more mobile and better connected, making it easier to mate with partners who share cultural traits across many dimensions. Efficiency of assortment may be boosted by cultural matching through dating apps, stretching the tails of the genetic distribution. These are all examples of human culture but they represent only one particular aspect of it, namely cultural effects that channel mating and thereby regulate genetic clusters. This aspect of culture is what appears as signal in population genetic data and is thus often the focus of attention for geneticists insofar as culture is concerned. This ethnolinguistic conception of culture that reduces culture to its effects on genetic clustering is inadequate for comparing genetic effects to environmental effects, given the many non-reproductive cultural effects that shape human phenotypes and environments. Indeed, an understanding of cultural clustering may elucidate novel aspects of genetic population stratification.
Abdellaoui and colleagues (Abdellaoui, Verweij, & Nivard, Reference Abdellaoui, Verweij and Nivard2021; Abdellaoui et al., Reference Abdellaoui, Hugh-Jones, Yengo, Kemper, Nivard, Veul and Holtz2019) offer evidence for geographic clustering of polygenic scores in the United Kingdom that is statistically independent of genetic ancestry, and explained instead by recent migration. For example, coal mining regions experienced “brain drain” and other forms of trait-conditional departure because of changes in the UK economy over the twentieth century. The outcome is detectable in genetic assortment at both the source and destination regions. This is an example of gene–environment correlation, where the environmental factor is a macroeconomic variable with a relatively clear geographic distribution. But this kind of genetic sorting is likely to occur also with respect to environmental factors that are shaped by cultural transmission yet not as readily localizable along geography or other conventional social scientific dimensions. Just as we can use genomic methods to reconstruct aspects of cultural history (e.g., Dai et al., Reference Dai, Vazifeh, Yeang, Tachet, Spencer Wells and Vilar2020; Peter, Petkova, & Novembre, Reference Peter, Petkova and Novembre2020; Petkova, Novembre, & Stephens, Reference Petkova, Novembre and Stephens2016), a research strategy that builds upon cultural transmission may help us reconstruct and even predict the emergence of genetic clusters that coalesce around – and perhaps feed back onto – cultural clustering of human behavior, psychology, and environments.
3.3. Causal locus problem
The hidden cluster problem described the implicit complexity that exists within social groupings, which can hinder robust inference unless parsed properly. Below, we discuss the causal locus problem, which refers to a source of complexity that exists within the space of functional organization in which genes and culture interact. Inference is hindered here when we view culture as an unstructured exogenous variable, when in fact it is a constructive system that accumulates functional adaptations in a directed manner over time.
3.3.1 Genes that break and genes that make
The more complex a system, the more ways it can fail. Take the history of lighting: Compared to the two ways in which a wood-fueled fire can be extinguished (smothering and exhaustion of fuel), there are seven known failure modes for a fluorescent bulb and more than 30 for the newer LED bulb (de Groot, Vos, Vogels, & van Driel, Reference de Groot, Vos, Vogels, van Driel, van Driel and Fan2013). A faulty rubber O-ring caused the space shuttle Challenger to explode, and a severed fiber-optic cable knocked out internet access for a large swath of people across India and the Middle East. There is a fundamental asymmetry between the identification of elements that support a system and those that undermine it. A well-functioning system is the product of a design process that has solved many problems and closed many paths that do not work. For such a system, “something going wrong” can be caused by singular aberrations, but “going right” and “going well” are properties of the integrated system as a whole. The notions of success and failure in this context, therefore, point to very different things. For complex functional systems such as machines and organisms, it is easier to identify ways to break the system than ways to explain or improve it.
Gene function can be viewed through this lens. Organisms are the outcomes of complex, emergent interactions involving many genes and their surroundings (Davies, Reference Davies2014), but there are many ways these interactions can go wrong. It is easier to identify deleterious genetic mutations than beneficial mutations, as deleterious mutations are more common. The space of failure is larger than the space of success, making genes that break more detectable than genes that make. For example, a single mutation can cause Mendelian disorders such as cystic fibrosis and Huntington's disease, but no single mutation creates genius. Over 1,000 genes have been linked to intelligence (Davies et al., Reference Davies, Lam, Harris, Trampush, Luciano, David Hill and Hagenaars2018; Lee et al., Reference Lee, Wedow, Okbay, Kong, Maghzian, Zacher and Nguyen-Viet2018; Savage et al., Reference Savage, Jansen, Stringer, Watanabe, Bryois, de Leeuw and Nagel2018). Each gene only explains a miniscule fraction of variation in intelligence, and the causal mechanisms are unlikely to be straightforward (Gottlieb, Reference Gottlieb2003; Turkheimer, Reference Turkheimer2000). In contrast to these genes that make, the causal mechanisms behind single-gene mutations that cause intellectual disability – for example, BCL11A (Dias et al., Reference Dias, Estruch, Graham, McRae, Sawiak, Hurst and Joss2016), PHF8 (Bathelt, Astle, Barnes, Lucy Raymond, & Baker, Reference Bathelt, Astle, Barnes, Lucy Raymond and Baker2016), ZDHHC9 (Schirwani, Wakeling, Smith, Study, & Balasubramanian, Reference Schirwani, Wakeling, Smith, Study and Balasubramanian2018) – are relatively well understood.
This spectrum of localizability ranging from Mendelian to polygenic to “omnigenic” traits (Boyle, Li, & Pritchard, Reference Boyle, Li and Pritchard2017) has been discussed extensively, but its interaction with cumulative culture has not sufficiently been appreciated. We have known for a long time that increasing nutrition (Lynn, Reference Lynn1990; Stoch, Smythe, Moodie, & Bradshaw, Reference Stoch, Smythe, Moodie and Bradshaw1982), improving schooling (Ceci, Reference Ceci1991; Davis, Reference Davis2014; Ritchie & Tucker-Drob, Reference Ritchie and Tucker-Drob2018), and removing parasites (Jardim-Botelho et al., Reference Jardim-Botelho, Raff, de Ávila Rodrigues, Hoffman, Joseph Diemert, Corrêa-Oliveira and Michael Bethony2008) have positive effects on IQ. None of this is surprising, but it means that in a society where parasite infection is kept under control, we would not notice that parasite status correlates with intelligence, because of a lack of sufficient variation in parasite load. For the same reason, a correlation between lead exposure and IQ (Needleman & Gatsonis, Reference Needleman and Gatsonis1990; Wasserman et al., Reference Wasserman, Liu, Lolacono, Factor-Litvak, Morina, Musabegovic and Vrenezi1997) will not be revealed in a society where lead is not a problem. And by corollary, genes that provide protection against malnutrition, parasites, or pollution would only be positively associated with intelligence in environments where these insults occur. In environments where these insults have been removed, the same genes would not be associated with intelligence, and can even be deleterious, as in the well-known example of sickle cell trait (Elguero et al., Reference Elguero, Délicat-Loembet, Rougeron, Arnathau, Roche, Becquart and Gonzalez2015). Similarly, alleles that protect against parasite infection (Carter, Reference Carter2013) or lead poisoning (Onalaja & Claudio, Reference Onalaja and Claudio2000) will be predictive of IQ only if the environmental risk factors are present in sufficient quantities.
3.3.2. Cumulative culture masking genes
Our living conditions have not always been the way they are today. Just 200 years ago, 89% of humanity lived in extreme poverty (Ravallion, Reference Ravallion2016), 88% were illiterate (van Zanden, Baten, Mira d'Ercole, Rijpma, & Timmer, Reference van Zanden, Baten, Mira d'Ercole, Rijpma and Timmer2014), and 43% of children died before they were 5 years old (Gapminder, 2020). Conditions have rapidly improved: rates of extreme poverty are now 10%, illiteracy is down to 14%, and deaths before 5 years of age are now 4% (UNESCO Institute for Statistics, 2013; World Bank Group – International Development, Poverty, & Sustainability, 2020). Of course, even if most are now better off, our world still suffers from immense global inequality. Given this restriction in historical range combined with the WEIRD sampling problem, it is not clear how well the genetic effects that have been cataloged thus far can be generalized beyond the particular cultural and temporal contexts in which they were studied. And even if this generalizability issue is acknowledged in principle, the bounds on generalizability are unknown.
Genes can be functionally masked by cumulative cultural evolution, and we expect that this masking is extensive and systematic. Cultural masking may help explain the limited portability of polygenic scores across populations (Kim et al., Reference Kim, Patel, Teng, Berens and Lachance2018; Martin et al., Reference Martin, Kanai, Kamatani, Okada, Neale and Daly2019, Reference Martin, Gignoux, Walters, Wojcik, Neale, Gravel and Daly2017). There is nothing too mysterious about this phenomenon: It's what happens when there are multiple evolutionary systems operating within a shared space of biological function. To build upon an example discussed by Deacon (Reference Deacon, Weber and Depew2003): Vitamin C is an essential nutrient and its acquisition is thereby an essential biological function. Endogenous synthesis of vitamin C requires a gene called GLO, and GLO is present across most of the animal kingdom. But, because vitamin C synthesis is metabolically costly, the gene is inactive in some species that have access to sufficient quantities of the nutrient in their diets (Drouin, Godin, & Page, Reference Drouin, Godin and Page2011). These include taxa such as teleost fishes, guinea pigs, many bats, some passerine birds, and anthropoid primates, that is, monkeys and apes (Chatterjee, Reference Chatterjee1973). Anthropoids, for instance, occupy a frugivorous niche, and fruits often contain sufficient vitamin C. Here, gene function is offloaded onto environmental resources. In turn, this offloading has behavioral implications. If a species becomes dependent on its environment (“auxotrophic”) for vitamin C, both its behavioral range and evolutionary trajectory become constrained by the availability of the nutrient. Humans are a nice example of this. As our species migrated across the planet, we found ourselves in environments where vitamin C was in short supply. A deficiency of vitamin C causes scurvy – the bane of seafarers until the trial-and-error discovery that certain food items such as sauerkraut and citrus could prevent ships from being packed with tired, bleeding, toothless, and eventually dead sailors (Lamb, May, & Harrison, Reference Lamb, May and Harrison2017).
Other species have other ways of obtaining vitamin C from their environments, and once these alternative pathways are established, the function of GLO becomes masked. A functionally masked gene is removed from the selection pressures that brought it about in the first place, and can therefore be culled from the genome, as evolution tends to do to unused elements (Albalat & Cañestro, Reference Albalat and Cañestro2016; Wolf & Koonin, Reference Wolf and Koonin2013). Masking does not necessarily need to be in the direction from culture to genes: We can think of genetic assimilation (Crispo, Reference Crispo2007; Waddington, Reference Waddington1953) as the same process working in the opposite direction, where a trait that is regularly acquired through learning gradually transfers its locus to the genome (see Baldwin effect; Morgan, Suchow, & Griffiths, Reference Morgan, Suchow and Griffiths2020). Genetic assimilation can eliminate the cost of learning, but only by sacrificing flexibility. The masking of genes by cumulative culture can eliminate the metabolic cost of endogenous synthesis in the case of vitamin C, and perhaps other costs in other cases, but only by sacrificing reliability of outcome.
Culture and genes are tightly intertwined in this manner, but this kind of functional interaction occurs across various levels of biological organization: between genes within the same genome – intragenomic (Phillips, Reference Phillips2008), between nuclear and organellar (mitochondria and plastid) genomes – cytonuclear (Sloan et al., Reference Sloan, Warren, Williams, Wu, Abdel-Ghany, Chicco and Havird2018), and between host and microbial symbiont genomes – holobiontic (Bordenstein & Theis, Reference Bordenstein and Theis2015). Mitochondria, for example, are believed to have undergone extensive reductive evolution, transferring nearly all of their genes to the nuclear genome (Sloan et al., Reference Sloan, Warren, Williams, Wu, Abdel-Ghany, Chicco and Havird2018; Wolf & Koonin, Reference Wolf and Koonin2013). Indeed, the residual mitochondrial and nuclear genomes collaboratively assemble “chimeric” proteins (Osada & Akashi, Reference Osada and Akashi2012). This kind of coevolution is not uncommon in the history of life (Jablonka & Lamb, Reference Jablonka and Lamb2005; Laland et al., Reference Laland, Uller, Feldman, Sterelny, Müller, Moczek and Jablonka2015).
Similar to these cross-level interactions, culture and genes are interwoven in the construction of many behavioral traits, making separation effectively impossible. Because these two systems interact within a shared space of phenotypic variation, a focus on only one or the other leaves significant ambiguity in the causal underpinnings of these phenotypes. For example, is language primarily the result of culture or genes? Such a question can be answered only by recourse to both sides of our dual inheritance (Chater, Reali, & Christiansen, Reference Chater, Reali and Christiansen2009; Christiansen & Chater, Reference Christiansen and Chater2008; Deacon, Reference Deacon1997; Dediu, Reference Dediu2011; Dediu & Ladd, Reference Dediu and Ladd2007; Wong et al., Reference Wong, Kang, Wong, So, Choy and Geng2020). Epistemological biases in the interpretation of the causal loci of phenotypic traits can misinform policy decisions and impede progress in the research and development of beneficial interventions. Given the inherent ambiguity that arises because of gene–culture interaction, it is important to adopt a sufficiently integrative framework to interpret findings.
3.4 Cultural Simpson's paradox
The WEIRD sampling problem, the hidden cluster problem, and the causal locus problem are fairly general issues. But, when we consider them jointly, the three problems contribute to a more specific problem that is perhaps not so obvious without a cultural evolutionary perspective. In particular, cultural adaptations that mask genetic effects (causal locus problem) can confound the measurement of genetic effects when the researcher lacks information about the fine-grained distribution of cultural adaptations (hidden cluster problem) and simultaneously lacks access to a sufficiently broad range of samples that could otherwise cut through the cultural confound (WEIRD sampling problem). This set of problems can create a Simpson's paradox (Kievit, Frankenhuis, Waldorp, & Borsboom, Reference Kievit, Frankenhuis, Waldorp and Borsboom2013; Simpson, Reference Simpson1951): the association between two variables qualitatively changing after controlling for subgroup structuring.
As an example, consider UV once again. In section 2.1, we discussed how mismatch between genes (skin pigmentation) and ecology (UV levels) can be masked by the cultural diffusion of sunscreen, especially in regions with more exposure to sunlight. In other parts of the world, the more important health issue is the set of problems associated with underexposure to the sun, which causes vitamin D deficiency. Low vitamin D is associated with a broad range of risk factors, most significantly for bone integrity but also for muscle strength, autoimmune disease, cardiovascular disease, cancer (Holick, Reference Holick2007), and perhaps COVID-19 (Meltzer et al., Reference Meltzer, Best, Zhang, Vokes, Arora and Solway2020; Rhodes, Subramanian, Laird, Griffin, & Kenny, Reference Rhodes, Subramanian, Laird, Griffin and Kenny2021). Controlling for skin pigmentation, vitamin D deficiency is correlated with latitude: One US study compared a sample in Erie, Pennsylvania (42°N) to one in Bradenton, Florida (27°N) that was matched along many key variables, and found that the northern group had lower levels of serum vitamin D and were at much greater risk of vitamin D deficiency than the southern group (Leary, Zamfirova, Au, & McCracken, Reference Leary, Zamfirova, Au and McCracken2017). A study in France similarly found that people in more northern regions had lower levels of vitamin D and a much higher prevalence of vitamin D deficiency compared to people in more southern regions (Chapuy et al., Reference Chapuy, Preziosi, Maamer, Arnaud, Galan, Hercberg and Meunier1997).
Despite this intuitive pattern within countries, several studies have shown that when we compare across countries within Europe, we see the opposite pattern where people in northern countries have higher levels of serum vitamin D than people in southern countries (Lips, Reference Lips2001; Lips et al., Reference Lips, Duong, Oleksik, Black, Cummings, Cox and Nickelsen2001; Van der Wielen et al., Reference Van der Wielen, De Groot, Van Staveren, Löwik, Van den Berg, Haller and Moreiras1995). This is the case even when data collection is conducted during the winter months when sunlight is scarce, and even when the data are processed by a central laboratory facility, avoiding confounding by variation in laboratory procedures. What's going on? This inverted pattern may be partly because of genetic factors, for example, people in southern European countries having more pigmented skin, but a substantial part of it is likely because of culture. As an explanation, various researchers have pointed to the high consumption of fatty fish and cod liver oil in Northern Europe, as well as greater sun-seeking behavior in these countries compared to Mediterranean Europe; policies for vitamin D fortification of foods may also give the northern countries an advantage (Brustad, Sandanger, Aksnes, & Lund, Reference Brustad, Sandanger, Aksnes and Lund2004; Lips, Reference Lips2007; Mithal et al., Reference Mithal, Wahl, Bonjour, Burckhardt, Dawson-Hughes, Eisman and El-Hajj Fuleihan2009; Pilz et al., Reference Pilz, März, Cashman, Kiely, Whiting, Holick and Grant2018). These are potent cultural adaptations: Brustad et al. (Reference Brustad, Sandanger, Aksnes and Lund2004) fed participants with the traditional northern Norwegian fish dish mølje three times over a span of 2 days, and discovered that it had supplied 54 times the recommended daily dosage of vitamin D. Therefore, the relationship between latitude and vitamin D levels goes one way within a country, and the other way between the countries of Europe.
Another example of a cultural Simpson's paradox from Europe is excess mortality in winter months compared to non-winter months across countries: Excess winter mortality is highest in warmer countries such as Portugal and Malta, and lowest in colder countries such as Finland and Iceland (Fowler et al., Reference Fowler, Southgate, Waite, Harrell, Kovats, Bone and Doyle2015; Healy, Reference Healy2003; McKee, Reference McKee1989). Portugal has the highest excess winter mortality among the countries estimated by Healy (Reference Healy2003) at 28% while Finland has the lowest at 10%, despite a much sharper temperature differential between summer and winter months (as well as lower absolute temperature) in Helsinki and Tampere compared to Lisbon and Porto. This has been called the “paradox of excess winter mortality” (Healy, Reference Healy2003). The likely cause is that houses in warmer climate regions tend to be poorly insulated, which causes lower indoor temperatures. Populations in these regions also do not wear appropriate clothing when outdoors in cold weather (Healy, Reference Healy2003; The Eurowinter Group, 1997). In south Finland, 72% of people wore hats while outdoors at 7°C, but only 13% of people in Athens did (The Eurowinter Group, 1997). A number of studies show that within countries, regions with colder winters experience higher excess winter mortality (Aylin et al., Reference Aylin, Morris, Wakefield, Grossinho, Jarup and Elliott2001; Davie, Baker, Hales, & Carlin, Reference Davie, Baker, Hales and Carlin2007): Here too there appears to be an inversion when comparing the effect between countries and within countries.
If we had been Martian anthropologists who did not know that the populated landmass known as “Europe” can, in fact, be broken down into subunits called “countries,” these examples would be standard examples of a Simpson's paradox (Kievit et al., Reference Kievit, Frankenhuis, Waldorp and Borsboom2013; Simpson, Reference Simpson1951). In these cases, the paradox occurs when we do not know how to partition the higher-order population (Europe) into lower-order units. Fortunately, we do know how to partition continents into countries, but in other cases, the relevant units may not always be as easily identifiable as countries or administrative regions.
Countries are territorially exclusive political entities, but we can also see them as cultural groups – clusters of cultural traits that can be identified using tools such as CF ST. People within a cultural group share more cultural traits than do people between separate cultural groups. All else being equal, there is more mutual cultural influence among individuals within a country than there is among people between countries. Even when we take a powerful social organizing force like religion into account, co-residents of a country who belong to different religions are more psychologically similar to each other than to co-religionists who live in different countries, although religion nonetheless also explains a sizable amount of similarity (White, Muthukrishna, & Norenzayan, Reference White, Muthukrishna and Norenzayan2021). This suggests that ideas and practices spread more easily within countries than between countries, and that countries constitute cultural clusters that can be used to partition higher-order levels of organization, such as continents. Countries too may, in turn, be decomposed into relevant cultural clusters – more acutely in places such as Africa, where colonial borders were often drawn arbitrarily without respect for ethnolinguistic groups (Michalopoulos & Papaioannou, Reference Michalopoulos and Papaioannou2020), but clustering is prevalent across many countries as revealed by subnational CF ST analyses (Muthukrishna et al., Reference Muthukrishna, Bell, Henrich, Curtin, Gedranovich, McInerney and Thue2020). To avoid a cultural Simpson's paradox, we must be able to measure cultural clustering.
Hidden clustering creates inferential problems for behavioral genetics precisely because cultural clusters are the most salient unit of organization upon which cultural-group dynamics and cultural evolution act (Handley & Mathew, Reference Handley and Mathew2020). Cultural evolution is fast and potent but bound within cultural clusters to varying degrees. Because different clusters are each independently able to incorporate cultural adaptations, genetic effects can get differentially masked in a cluster-wise fashion. The extent of this masking varies across clusters, and those that are exposed to greater ecological challenges (e.g., higher latitudes) may build up stronger cultural adaptations and undergo deeper masking. When these cultural adaptations not only compensate for the ecological challenge, but also overcompensate, and do so proportionally to the magnitude of the ecological challenge, the outcome is an inversion of the natural relationship between ecologies and phenotypes – as we saw earlier in the inverted correlation between latitude and vitamin D (Brustad et al., Reference Brustad, Sandanger, Aksnes and Lund2004; Lips, Reference Lips2007; Mithal et al., Reference Mithal, Wahl, Bonjour, Burckhardt, Dawson-Hughes, Eisman and El-Hajj Fuleihan2009; Pilz et al., Reference Pilz, März, Cashman, Kiely, Whiting, Holick and Grant2018) and between latitude and winter mortality (Fowler et al., Reference Fowler, Southgate, Waite, Harrell, Kovats, Bone and Doyle2015; Healy, Reference Healy2003). The cultural Simpson's paradox thus arises when cluster-wise cultural adaptation across an ecological gradient changes the slope of the ecological effect: attenuating, neutralizing, or inverting its directionality depending on the strength of the cultural adaptation relative to the ecological challenge.
Therefore, the relationship between genes, ecology, and phenotype will often be qualitatively different for humans than it will be for other animals. We should be careful of inferential errors that may derive from neglecting the cluster-wise cultural evolution of environments. Even if the gradient of cultural adaptation does not go as far as inverting the ecology–phenotype relationship and instead takes a more moderate form, it can nonetheless confound measurement of genetic or ecological effects. If the arrangement of the cultural clusters within a population is unknown, such gradients may be difficult to detect in the first place.
To summarize the problems that we have discussed thus far: The WEIRD sampling problem and the hidden cluster problem each obscure the variance structure of a sample – the former by concealing the range of total variation that exists outside of a restricted (possibly unrepresentative) segment, the latter by concealing the heterogeneity within that segment. The causal locus problem allows for differential masking among the heterogeneous subgroups, and poses a challenge to interpretation of gene function, for example in the form of a cultural Simpson's paradox. Collectively, these problems have long obscured the effect of culture within behavioral genetics. Cultural evolution can help us understand phenotypic distributions in human societies as well as more accurately represent the structure of our nature and nurture.
4. Behavioral genetic puzzles in light of cultural evolution
A dual inheritance and cultural evolutionary theoretical framework can help make sense of various puzzles in behavioral genetics. Here, we discuss three: differences in heritability across socioeconomic levels, differences in heritability across development, and the Flynn effect.
4.1 Heritability across socioeconomic levels
The heritability of IQ is higher among affluent, high socioeconomic status (SES) households than among poorer, low-SES households in some societies (sometimes referred to as the Scarr–Rowe effect; Rowe, Jacobson, & Van den Oord, Reference Rowe, Jacobson and Van den Oord1999; Scarr-Salapatek, Reference Scarr-Salapatek1971), but the relationship between SES and heritability is mixed in other societies (Giangrande et al., Reference Giangrande, Beam, Carroll, Matthews, Davis, Finkel and Turkheimer2019; Hanscombe et al., Reference Hanscombe, Trzaskowski, Haworth, Davis, Dale and Plomin2012; Nisbett et al., Reference Nisbett, Aronson, Blair, Dickens, Flynn, Halpern and Turkheimer2012; Platt, Keyes, McLaughlin, & Kaufman, Reference Platt, Keyes, McLaughlin and Kaufman2019; van der Sluis, Willemsen, de Geus, Boomsma, & Posthuma, Reference van der Sluis, Willemsen, de Geus, Boomsma and Posthuma2008; Turkheimer et al., Reference Turkheimer, Haley, Waldron, D'Onofrio and Gottesman2003). A cultural evolutionary perspective can shed light on these findings.
4.1.1. Discrepancies in cultural transmission across societies
A meta-analysis (Tucker-Drob & Bates, Reference Tucker-Drob and Bates2016) found the gene × SES interaction on IQ in a subset of US samples, but not in samples from Europe and Australia. Pooling the US studies, the authors found an effect size that corresponds to a heritability estimate of 0.61 at 2 standard deviations above the mean SES but only 0.26 at 2 standard deviations below the mean. In Western Europe and Australia, heritability is more uniform. The cause of this interaction is still debated.
Several researchers (e.g., Bates, Lewis, & Weiss, Reference Bates, Lewis and Weiss2013; Beam, Turkheimer, Dickens, & Davis, Reference Beam, Turkheimer, Dickens and Davis2015; Tucker-Drob, Briley, & Paige Harden, Reference Tucker-Drob, Briley and Paige Harden2013) have suggested that gene–environment correlation via phenotype-to-environment transmission, otherwise referred to as “reciprocal causation,” is the most likely explanation. By this explanation, those with genes well suited to a task can better nurture their skills in a wealthier environment compared to in a poorer environment. That is, initially small differences in genetic potential become gradually amplified over time because of the iterative matching of environments to abilities: An increase in expressed ability brings forth new environmental conditions that enable further growth along that dimension (Bronfenbrenner & Ceci, Reference Bronfenbrenner and Ceci1994; Dickens & Flynn, Reference Dickens and Flynn2001; Scarr, Reference Scarr1992). Such processes can increase genetic heritability, but through reciprocal shaping between genetic potential and environment, rather than through innately specified ability levels. The reasoning is that high-SES households are able to provide environments that do this more effectively and are thereby able to let genetic potential be more reliably associated with the corresponding outcomes, lifting heritability as a result. While such reciprocal causation may indeed be occurring, reconciling this explanation with the findings from Europe and Australia seems more challenging or at least incomplete.
Heritability is a function of the variability in culture, which is shaped by cultural-group dynamics and cultural evolutionary forces. In the United States, the differences between, for example, school and home environments among high-SES households is likely to be small relative to differences between school and home environments among low-SES households, where factors such as school lotteries can dramatically affect the cultural input. In contrast, the cultural environment is less unequal in Western Europe and Australia, where, for example, high-quality schools are available across SES. Where these two explanations make different predictions is for poorer countries. The reciprocal causation explanation would predict low heritability in poorer countries. The cultural evolution of genetic heritability explanation would instead predict high heritability where there is equal access to similarly poor schools and household conditions, but low heritability if inequality is high.
Although environmental variability is commonly construed through the framework of economic inequality, we can also look at it through the lens of cultural variability. For example, even if a society maintains economic equality, it may still contain cultural subdivisions that lead to multiple clusters each with different traditions and behaviors. When this cultural clustering creates differences in the level of some given trait between clusters, the heritability of this trait decreases in accordance with the strength of the clustering.
We predict that networks of cultural transmission are more fractured (i.e., contain a higher density of cultural clusters) in low-SES households than they are in high-SES households comparing within a country, at least for (but not limited to) transmission of cultural information and influence that impacts traits in domains such as cognitive ability. We also predict that these cultural networks are more fractured in the United States compared to those in Australia and Europe, with the greatest fracturing expected in low-SES US communities. Moreover, we predict that these differences across groups will explain at least some portion of the interaction between SES and heritability in the measurement of IQ. These effects could be tested through causal identification techniques, including randomized controlled trials or natural experiments such as school lotteries.
A number of studies have examined unstandardized variance components to make sense of the forces that are driving the gene × SES interaction effects for cognitive ability, but the results have been mixed. In some studies, the interaction is apparently because of an increase in variance explained by the shared environment (the C component of the ACE model; A: additive genetic variance, C: shared environmental variance, E: nonshared environmental variance) in lower-SES households compared to higher-SES households (e.g., Hanscombe et al., Reference Hanscombe, Trzaskowski, Haworth, Davis, Dale and Plomin2012; Kremen et al., Reference Kremen, Jacobson, Xian, Eisen, Waterman, Toomey and Neale2005), while other studies suggest that it is instead because of a decrease in variance explained additively by genes (the A component of the ACE model) (e.g., Bates et al., Reference Bates, Lewis and Weiss2013; Kirkpatrick, McGue, & Iacono, Reference Kirkpatrick, McGue and Iacono2015). The shared environment explanation is more consistent with cultural dynamics, although reality may be more complicated with other processes such as reciprocal causation (Bronfenbrenner & Ceci, Reference Bronfenbrenner and Ceci1994; Dickens & Flynn, Reference Dickens and Flynn2001; Scarr, Reference Scarr1992) contributing to the same effect through other pathways, such as via moderation of the additive genetic component. Moreover, we would predict that this environmental variance would be reduced if cultural opportunities and transmission networks among low-SES households became more broadly connected, supporting greater cultural homogeneity. This would be true, even if the level of poverty or other indicators of well-being remained just as low. That is, this effect is not about poverty or deprivation per se – heritability can be high even among lower-SES groups – but more about cultural clustering. Simply moving neighborhoods can vastly improve life outcomes for low-SES Americans (Chetty & Hendren, Reference Chetty and Hendren2018a, Reference Chetty and Hendren2018b), but we would not predict such large effects for high-SES Americans.
In general, we predict that Scarr–Rowe-like discrepancies in the heritability of IQ will be found when comparing groupings that vary in their degree of within-group cultural clustering (or homogeneity) whenever this clustering imposes barriers upon the cultural transmission of cognitive ability. The more clustered society will be associated with a lower heritability for the trait; this effect would be expected across many culturally transmissible traits beyond IQ as well. When disaggregated by cultural cluster (e.g., SES), we should expect lower heritability among the more culturally diverse and/or more culturally clustered subgroup.
4.1.2 Discrepancies in environmental variation between humans and other animals
A comparison of these SES effects on humans with similar experiments in rodents offers additional insight. Sauce et al. (Reference Sauce, Bendrath, Herzfeld, Siegel, Style, Rab and Korabelnikov2018) found that mice reared in an enriched environment exhibited lower heritability of a rodent analog of general intelligence (for standard rodent-learning tasks such as odor discrimination and navigation) than did mice reared in a control environment, with a heritability of 0.15 in the enriched group versus 0.55 in the controls. The directionality of this difference is opposite of what we have described earlier for the human literature, and the opposite of what the reciprocal causation explanation would suggest (Bronfenbrenner & Ceci, Reference Bronfenbrenner and Ceci1994; Dickens & Flynn, Reference Dickens and Flynn2001; Scarr, Reference Scarr1992). If we assume that this type of environmental enrichment paradigm can be mapped onto differences between high- and low-SES environments in humans, as has been argued (Hackman, Farah, & Meaney, Reference Hackman, Farah and Meaney2010; Rosenzweig & Bennett, Reference Rosenzweig and Bennett1996), the reported discrepancy between rodent and human studies might appear surprising.
Non-genetic phenotypic variation in mice appears to be generated in part by initially small, random differences in experience being amplified over the course of development (Kempermann, Reference Kempermann2019) – complex environments enable greater amplification of these initial differences and hence “individualization,” whether the environmental complexity is of a physical (Freund et al., Reference Freund, Brandmaier, Lewejohann, Kirste, Kritzler, Kruger and Sachser2013) or social nature (Shemesh et al., Reference Shemesh, Sztainberg, Forkosh, Shlapobersky, Chen and Schneidman2013). In these studies, both genes (because of inbreeding) and the shared environment are controlled. It is, therefore, the nonshared environment, or individually unique forms of experience, that is driving this differentiation. The enriched environment enables a greater range of variation in experience and as a consequence, genetic effects are proportionally reduced.
Compare this to humans, where cultural transmission gradually homogenizes the environment within a cultural cluster (though not necessarily between cultural clusters), and to varying degrees across clusters as well. We predict that high-SES US households as well as households within Australia and European countries are less culturally fragmented compared to low-SES US households, leading to higher environmental similarity within Australians, Europeans, and high-SES Americans, respectively (but not necessarily high similarity between the groups). In other words, relatively enriched environments (high-SES or Australia/Europe) are also those that are more culturally homogeneous. This, in turn, may explain why enriched environments would be negatively associated with heritability in mice (Sauce et al., Reference Sauce, Bendrath, Herzfeld, Siegel, Style, Rab and Korabelnikov2018) but positively associated with heritability in humans at least under certain conditions (Tucker-Drob & Bates, Reference Tucker-Drob and Bates2016). Our prediction is that the opposite effect between the two species arises because in humans, the amplification of initial differences in experience by complex environments (individualization) is overwhelmed by the homogenizing effect of cultural learning and group dynamics (e.g., through oblique transmission from favored models in the previous generation and horizontal transmission from peers). The more variation is generated by enriched environments and individualization, the more incentive there is to learn from successful individuals or from those who are likely to have learned from successful individuals themselves. Cultural diffusion systematically squashes the variation created by innovation (see the Appendix for a model of such dynamics).
A cultural evolutionary approach to heritability distinguishes between humans and other animals in ways that a standard behavioral genetics approach does not. Whereas behavioral genetics provides no clear reason to differentiate analysis of genetic effects in humans from genetic effects in nonhuman animals, cultural evolutionary theory explicitly formalizes the difference between humans and other animals: our extensive dual inheritance (Boyd & Richerson, Reference Boyd and Richerson1985). The human-specific predictions that arise from a cultural evolutionary behavioral genetics offer clear tests for our hypotheses. The approach may, thus, also be validated by comparative behavioral genetic analyses between humans and nonhuman animals. This research direction may help make sense of some of the limitations of nonhuman animal models, in cases where cultural adaptations create unexpected gaps in generalizability despite sufficient phylogenetic conservation of relevant phenotypes.
4.2 Heritability across development
Cultural heterogeneity may also vary across development. Because culture typically acts as a phenotypic homogenizer within cultural clusters, we should be able to detect the influence of culture across development in the form of changes in genetic heritability. How we learn and who we learn from changes over the lifespan. One, especially, important transition is the shift from learning primarily from parents and other family members to learning from more distant models who are selected from a broader swath of society (Cavalli-Sforza & Feldman, Reference Cavalli-Sforza and Feldman1981). In the first of these two phases, there is less choice in what to learn, and much of the acquired knowledge is passed down through the same route as genetic information – from parent to child – by vertical transmission. In the second phase, the child is more independent, and has the opportunity to update what they have learned from a broader range of models, using learning strategies to decide whom to learn from, by oblique transmission. This expansion in learning models is essential for cumulative cultural evolution (Enquist et al., Reference Enquist, Strimling, Eriksson, Laland and Sjostrand2010), and may be facilitated by adaptations such as early weaning (Finlay & Uchiyama, Reference Finlay, Uchiyama and Kaas2020; Hawkes & Finlay, Reference Hawkes and Finlay2018). Building on Cavalli-Sforza and Feldman (Reference Cavalli-Sforza and Feldman1973), who show that vertical transmission inflates heritability estimates by increasing similarity between caretakers and children, our argument focuses on how broad, community-level oblique and horizontal transmission can either inflate or deflate heritability by unmasking or masking genetic effects. Both processes are likely to be operating simultaneously, although if oblique transmission is broad enough, it may weaken the confounding effect of vertical transmission.
This transition from vertical to oblique learning moves the child from the idiosyncrasies of their parents and household to the larger environment they now have in common with other adolescents and young adults. When the child is primarily relying on vertical transmission, the characteristics of their household plays a larger role in explaining variation in cultural input, in which case we should expect a high proportion of phenotypic variance to be explained by the shared (home) environment in twin studies. When the child switches to oblique learning, they now share more common influences with other children. Insofar as these traits unmask genetic differences, this would be expected to reduce environmental variation across the population and increase heritability.
This reasoning implies that for phenotypic traits that are molded in real time by the current shared environment instead of by the persisting effects of earlier parental influence, heritability should increase at this later life stage. Indeed, this is precisely what Hatemi et al. (Reference Hatemi, Funk, Medland, Maes, Silberg, Martin and Eaves2009) find in the case of political orientation, or where one lies on a progressive–conservative spectrum, measured in a US sample by questionnaire (Fig. 3). Monozygotic (MZ) and dizygotic (DZ) twin pairs are both equally similar from middle childhood up to early adulthood, although the degree of twin similarity increases over time for both. Right around the age at which American children leave home, this pattern is broken, and the phenotypic correlations drop precipitously in DZ twins while remaining steady in MZ twins, and this discrepancy persists for the rest of the lifespan. The drop in DZ but not MZ correlation at this age suggests that the shared home environment exerts a convergent influence for both twin types early in life, but that once this influence is removed, genetic effects become unmasked and able to guide political attitudes independently from the shared environment. More phenotypic variance is explained by genes from this point onward, thus boosting heritability. In countries such as Italy and Croatia, where the mean age of leaving the parental household is past 30 (European Statistical Office, 2020), we would predict the developmental time course of heritability to reflect this later independence relative to American samples. Note that the present example has the same overall structure as the literacy example discussed earlier (Samuelsson et al., Reference Samuelsson, Byrne, Olson, Hulslander, Wadsworth, Corley and Willcutt2008), with heritability increasing as cultural influences from outside of the home environment kick in. Both examples indicate that heritability can be an index of shared life history and communal structure.
Figure 3. Twin concordances in political orientation. In middle to late childhood, within-twin correlations for reported political orientation are roughly the same between monozygotic (MZ) and dizygotic (DZ) twin pairs in a US sample. In the early 20s, shortly after many US youth leave home for the first time to attend university, the correlation drops for the DZ twins but not for the MZ twins (identified with a red asterisk). This shift corresponds to a sudden rise in heritability, as genetic similarity now predicts similarity in political orientation. When the effect of the home environment is weakened and replaced with more diverse cultural input, the effect of genes becomes unmasked and separates the phenotypic concordances between the two twin types. The horizontal axis indicates age and the vertical axis indicates percentage twin concordances in political orientation. Figure reproduced from Hatemi et al. (Reference Hatemi, Funk, Medland, Maes, Silberg, Martin and Eaves2009).
Although the use of shared household environment to analyze twin data is a standard methodological convention, the household is, in fact, just one among many groupings of cultural organization that generate environmental convergence (Harris, Reference Harris1995). Households may be the most potent cultural grouping for some phenotypic traits, but other groupings may have significant impact as well for specific kinds of traits. These may include schools, peer-groups, sports teams, religious communities; society-wide groupings such as different mass media and popular culture; more diffuse groupings that are organized around particular sets of values such as political ideology or professional values; and possibly new kinds of groupings such as online communities.
Separating out the effect of household from the effect of genes is typically considered to be an explanatory goal, but there may be further phenotypic variance that could be meaningfully explained if we were able to match phenotypes to other relevant cultural groupings and therefore to other sources of cultural influence. Twins share “common environments” across multiple scales of social organization in this manner, but when phenotypic similarity is engendered by cultural groupings that extend beyond the household, the resulting correlations will usually be relegated to the broad category of “nonshared environment,” unless membership, for example, happens to align with household structure (Plomin & Daniels, Reference Plomin and Daniels1987; Plomin, Asbury, & Dunn, Reference Plomin, Asbury and Dunn2001). Although the nonshared environment is typically discussed as environmental exposure that is specific to the individual, it remains possible that there are multiple layers of communal structure embedded within this variance component.
This point becomes somewhat obvious when we consider systems outside of the European Marriage Pattern (Henrich, Reference Henrich2020), such as the Israeli kibbutzim (Lieblich, Reference Lieblich2010), the “walking marriages” of the Mosuo of southwest China (Ji et al., Reference Ji, Wu, He, Xu, Mace and Tao2013), or the communal child rearing of the Ache of eastern Paraguay or of the Hiwi of Venezuela (Hill & Magdalena Hurtado, Reference Hill and Magdalena Hurtado2009). In such societies, similarity of developmental environments may not be adequately parsed at the unit of the household (Kǎĝitçibaşi, Reference Kǎĝitçibaşi1984). The Western notion that socialization takes place primarily in the household may not apply even to Western societies (Harris, Reference Harris1995). If this is the case, then the strategy of looking for phenotypic correlations within the household that are unexplained by genes may be appropriate for answering questions about the specific influence of the household, but is insufficient for answering questions about nature–nurture more broadly.
One potential way to overcome this limitation is to map out clusters of cultural similarity within a society using a tool like cultural F ST (Muthukrishna et al., Reference Muthukrishna, Bell, Henrich, Curtin, Gedranovich, McInerney and Thue2020), explained earlier, and match this finer-grained population structure with genetic data. If assignment to a cluster explains phenotypic similarity over and above that of the shared household, for instance, such methods could be leveraged to capture a broader picture of the environmental factors that guide phenotypic development. If we were able to track the changing organization of these cultural clusters over time, it would allow us to follow the dynamic trajectory of environmental structure and partition this out from measurements of genetic effects longitudinally. We expect social phenomena such as urbanization and demographic change to be associated with change in these cultural clusters over time.
General intelligence is another trait whose heritability is known to change over the course of development (Briley & Tucker-Drob, Reference Briley and Tucker-Drob2013; Haworth et al., Reference Haworth, Wright, Luciano, Martin, de Geus, van Beijsterveldt and Bartels2010; for a number of other traits see Bergen, Gardner, & Kendler, Reference Bergen, Gardner and Kendler2007). This takes the form of a steady increase from childhood through adolescence all the way to early adulthood, after which it remains more or less steady over the lifespan. Although estimates vary, one meta-analysis (Haworth et al., Reference Haworth, Wright, Luciano, Martin, de Geus, van Beijsterveldt and Bartels2010) put the heritability of general intelligence at 0.41 in childhood and 0.66 in adulthood. Explanations for this pattern typically invoke a combination of (1) gradual activation of relevant genes over the course of brain development and (2) active gene–environment correlation or “reciprocal causation” (Bouchard, Reference Bouchard2013; Haworth et al., Reference Haworth, Wright, Luciano, Martin, de Geus, van Beijsterveldt and Bartels2010; Plomin, DeFries, Knopik, & Neiderhiser, Reference Plomin, DeFries, Knopik and Neiderhiser2016; Tucker-Drob et al., Reference Tucker-Drob, Briley and Paige Harden2013).
In contrast, a cultural evolutionary perspective would attribute the rise in the heritability of IQ to the developmental time course of cultural influence. One clear testable prediction is that in a society with different constraints on the development of cultural learning, as in the above example of political orientation, the developmental trajectory of heritability would also differ. A society that engages with communal childrearing immediately from infancy will impose a different set of developmental constraints (and opportunities) compared to a typical Western society. Even in Western societies, cultural development may look very different from now just a few decades into the future, if information technology continues to transform children's networks of social interaction and influence. A cultural evolutionary explanation can help make sense of the relevant data. For example, we predict that sharp changes in heritability will map onto sharp changes in an individual's cultural environment (e.g., the start of school, university, or military service). These milestones may shift because of policy changes, allowing for causal tests of this hypothesis. If, for example, children start higher education later, then large increases in heritability should also occur later.
Whether or not one agrees with our construal of these particular examples, it is logical that genetic effects for many traits become confounded with communal structure unless the developmental time course of cultural influence is properly accounted for. Cultural evolutionary theory predicts that over the life course, cultural influence begins from a primarily parental setting and progressively expands its scope into the greater community, diversifying the models from which an individual can learn (Fogarty, Creanza, & Feldman, Reference Fogarty, Creanza and Feldman2019; Muthukrishna, Doebeli, Chudek, & Henrich, Reference Muthukrishna, Doebeli, Chudek and Henrich2018). Insofar as this occurs, we predict a general increase in heritability over the lifespan for culturally malleable traits. The slope of this increase would depend upon cultural parameters and vary by society. Conversely, if there is a correlation between communal structure and the heritability of some trait, this may serve as an index of the cultural malleability of that trait. Our goal here is to bring attention to the conceptual and analytic power that cultural evolution can contribute to developmental behavioral genetics.
4.3 The Flynn effect
The Flynn effect describes the rise in IQ test scores over time (Flynn, Reference Flynn1984, Reference Flynn1987) – roughly 2–3 IQ points per decade on average around the world (Flynn, Reference Flynn2009; Pietschnig & Voracek, Reference Pietschnig and Voracek2015; Trahan, Stuebing, Hiscock, & Fletcher, Reference Trahan, Stuebing, Hiscock and Fletcher2014). The rate of increase differs between countries, being largest in countries that have recently started modernizing, and smallest in countries that had attained modernization by the beginning of the twentieth century (for a review, see Nisbett et al., Reference Nisbett, Aronson, Blair, Dickens, Flynn, Halpern and Turkheimer2012). In some countries in Northern and Western Europe including Denmark, the Netherlands, and the United Kingdom, there is evidence that the Flynn effect has been slowing down and even reversing in recent decades (Dutton, van der Linden, & Lynn, Reference Dutton, van der Linden and Lynn2016). This negative Flynn effect is even less well understood compared to the positive Flynn effect. Bratsberg and Rogeberg (Reference Bratsberg and Rogeberg2018) find that in Norway, the negative Flynn effect is found within families (between siblings), thereby making it unlikely to be explained by demographic changes or immigration, and instead supporting an environmental explanation.
There is no consensus regarding the cause of the Flynn effect, but given the recent and rapid increase, genetic explanations are unlikely. Various hypotheses include increases in test familiarity, improvements in education, sophistication of the technological and media environment, better nutrition, decreasing family size, and slowing life history, and increased out-breeding or “hybrid vigor” (Bratsberg & Rogeberg, Reference Bratsberg and Rogeberg2018; Clark, Lawlor-Savage, & Goghari, Reference Clark, Lawlor-Savage and Goghari2016; Johnson, Reference Johnson2006; Joshi et al., Reference Joshi, Esko, Mattsson, Eklund, Gandin, Nutile and Jackson2015; Nisbett et al., Reference Nisbett, Aronson, Blair, Dickens, Flynn, Halpern and Turkheimer2012; Pietschnig & Voracek, Reference Pietschnig and Voracek2015; Trahan et al., Reference Trahan, Stuebing, Hiscock and Fletcher2014; Woodley, Reference Woodley2012).
Flynn (Reference Flynn2007) and Greenfield (Reference Greenfield and Neisser1998, Reference Greenfield2009) suggest that the effect is caused by a rapid worldwide increase of cultural practices, technologies, and environments that promote abstract cognitive processing as opposed to more traditional forms of concrete, pragmatic thinking. Some examples explored by these authors included urbanization, mass media, video games, education style, counterfactual thinking, and white-collar occupations. This account is mostly consistent with a cultural evolutionary explanation, which would suggest that intelligence is not just about hardware – genes, parasites, pathogens, pollution, and nutrition affecting health and brain development, but also software – the increasingly complex cultural package we acquire from our societies (Bloom, Reference Bloom2020; Gordon, Reference Gordon2018; Jones, Reference Jones2020; Mesoudi, Reference Mesoudi2011). By this account, not only is the idea of a culture-free IQ test implausible, but so too is the idea of culture-free IQ (for discussion, see Muthukrishna & Henrich, Reference Muthukrishna and Henrich2016). Indeed, the largest Flynn effect can be seen on the supposedly culture-free Raven's matrices (Flynn, Reference Flynn2007; Nisbett et al., Reference Nisbett, Aronson, Blair, Dickens, Flynn, Halpern and Turkheimer2012), and on tests for fluid IQ rather than crystallized IQ (Pietschnig & Voracek, Reference Pietschnig and Voracek2015). When it comes to heritability, subtests of IQ that are more culturally influenced are more heritable (Kan, Wicherts, Dolan, & van der Maas, Reference Kan, Wicherts, Dolan and van der Maas2013).
Beyond the diffusion of specific traits and abilities, a cultural evolutionary explanation also highlights how the Flynn effect is driven by the reorganization of cultural transmission pathways themselves. The introduction and improvement of formal schooling is one major instance of reorganization in cultural transmission that is also known to positively impact IQ (Brinch & Galloway, Reference Brinch and Galloway2012; Ceci, Reference Ceci1991; Davis, Reference Davis2014; Ritchie & Tucker-Drob, Reference Ritchie and Tucker-Drob2018). Greenfield (Reference Greenfield and Neisser1998) describes how IQ scores in some rural US towns in the early twentieth century increased rapidly at the same time as a number of coordinated changes in infrastructure, including better access to urban areas and new, high-quality road systems. Such enhancements in social connectivity directly translate into cultural connectivity, allowing for the influx and diffusion of psychological and behavioral traits that are considered valuable within the broader society. In much of the modern world, the kind of abstract information-processing ability measured by IQ tests is considered valuable, as it is useful in various white-collar professions that are typical of WEIRD societies. The Flynn effect, therefore, captures the progressive enhancements in cultural connectivity that have been occurring around the world because of improvements in various domains of infrastructure and technology including transportation, urbanization, education, and media. Global IQ rises in response to both the invention of relevant cultural traits and the enrichment of cultural transmission networks that carry those traits.
One clear test of this cumulative culture explanation for the Flynn effect would be to randomly assign children to attend or avoid formal schooling. Such a test would be highly unethical and differences in school attendance and quality are typically associated with various kinds of deprivation. Where policy changes have changed years of schooling in ways that lend themselves to causal identification through a natural experiment, an increase in formal education has been shown to cause an increase in IQ (Brinch & Galloway, Reference Brinch and Galloway2012; Ritchie & Tucker-Drob, Reference Ritchie and Tucker-Drob2018). A recent test by Davis, Stieglitz, Tayo, Kaplan, and Gurven (Reference Davis, Stieglitz, Tayo, Kaplan and Gurven2020) offers even clearer data. Children, but not adult IQ performance is compared within age groups, because we assume children perform better as they get older. Exploiting a natural experiment where access to education was uncorrelated with SES, nutritional status, and acculturation, Davis and colleagues show that without access to education, there is no correlation between age and IQ test performance. With moderate access, we see a moderate slope and with more access, a slope similar to the West.
5. Cultural evolutionary behavioral genetics
Behavioral genetics offers a powerful empirical approach to understanding human behavior, but since the advent of whole-genome methods, its strategy appears to lean toward the notion that with enough data, ground truths about human nature and nurture, if only for some traits, will be revealed. Data alone is not enough (Muthukrishna & Henrich, Reference Muthukrishna and Henrich2019); the thrust of our theoretical case is that human psychology and behavior have a large cultural component that has been changing over history (Boyd, Reference Boyd2018; Boyd & Richerson, Reference Boyd and Richerson1985; Chudek, Muthukrishna, & Henrich, Reference Chudek, Muthukrishna and Henrich2015; Henrich, Reference Henrich2020, Reference Henrich2016; Laland, Reference Laland2018; Muthukrishna, Henrich, & Slingerland, Reference Muthukrishna, Henrich and Slingerland2021; Nunn, Reference Nunn2020; Wilson, Reference Wilson2019). Most recently, our psychology has been shaped by the advent of writing, numeracy, different types of agriculture, the Industrial Revolution, the internet, and smart phones (Domahs et al., Reference Domahs, Moeller, Huber, Willmes and Nuerk2010; Firth et al., Reference Firth, Torous, Stubbs, Firth, Steiner, Smith and Alvarez-Jimenez2019; Ong, Reference Ong1982; Talhelm et al., Reference Talhelm, Zhang, Oishi, Shimin, Duan, Lan and Kitayama2014; Uskul, Kitayama, & Nisbett, Reference Uskul, Kitayama and Nisbett2008; Wilmer, Sherman, & Chein, Reference Wilmer, Sherman and Chein2017). As new adaptive traits emerge (Muthukrishna & Henrich, Reference Muthukrishna and Henrich2016), initially those who possess these traits will have an advantage, as in the case of access to new food sources, better healthcare, more efficient technologies, or easier methods of learning. But eventually the traits will reach fixation in the population through the processes of cultural diffusion (Henrich & Broesch, Reference Henrich and Broesch2011; Muthukrishna et al., Reference Muthukrishna, Morgan and Henrich2016), at least until they are unseated by subsequent innovations (Kolodny, Creanza, & Feldman, Reference Kolodny, Creanza and Feldman2015; Muthukrishna & Henrich, Reference Muthukrishna and Henrich2016). We predict that these cultural dynamics are reflected in heritability estimates.
As any geneticist knows, genetic heritability is a function of the variability in the environment, variability in genes, and variability in the phenotype. There is little to predict if the phenotype is homogeneous, as in the number of fingers or kidneys. There is little to predict with if the environment or genes are homogeneous. But what is factored into the environment includes not only the physical ecology, but also the cultural environment. While variance in genes and ecology may be relatively stable, the variance in the cultural environment is continually changing through the processes of cultural evolution. Genetic heritability estimates are highly affected by not only cultural diversity and cultural clustering, but also by factors that affect cultural transmission such as sociality (Muthukrishna, Shulman, Vasilescu, & Henrich, Reference Muthukrishna, Shulman, Vasilescu and Henrich2014), transmission fidelity (Morgan et al., Reference Morgan, Uomini, Rendell, Chouinard-Thuly, Street, Lewis and Cross2015), tolerance for variation (Muthukrishna & Henrich, Reference Muthukrishna and Henrich2016), population structure (Henrich, Reference Henrich2004a), and social network topology (Derex & Mesoudi, Reference Derex and Mesoudi2020; Muthukrishna & Schaller, Reference Muthukrishna and Schaller2020). Under most empirical conditions, behavioral genetics underestimates the contribution of culture, including in estimates of heritability. We don't disagree with the findings in these fields or the data used, but instead argue that more nuance is required in how they are interpreted. Our dual inheritance demands that a genetic account of human psychology and behavior must also account for culture and cultural evolution.
5.1 Toward a dynamic model of environment
We are surrounded by the products of culture yet are generally unaware of the generative processes that bring such complex objects and conditions into existence. Cultural transmission spans broad networks of interconnected individuals, as well as deep timescales of inheritance. Each individual experiences just a snapshot, leaving the global mechanics opaque. Thus, each of us is left with an intuition that our world is largely the world, which perhaps explains why the extent of the WEIRD people problem went unappreciated for so long, even a decade after publication of Henrich et al. (Reference Henrich, Heine and Norenzayan2010) (Apicella et al., Reference Apicella, Norenzayan and Henrich2020; Barrett, Reference Barrett2020; Nielsen, Haun, Kärtner, and Legare, Reference Nielsen, Haun, Kärtner and Legare2017; Pollet and Saxton, Reference Pollet and Saxton2019; Tiokhin, Hackman, Munira, Jesmin, and Hruschka, Reference Tiokhin, Hackman, Munira, Jesmin and Hruschka2019). From this limited vantage point, we evaluate questions such as the relative contributions of nature versus nurture. But our understanding of “nurture” remains fundamentally anchored in our restricted experience of being enculturated into a particular environment, which leads us to implicitly see environmental features shared by members of our community as factors to be held constant, while our variables of interest – be they the absence of a parent, a childhood illness, birth into nobility, or a polygenic score – become matched to outcomes in our predictive models. Such models may be informal or formal, either encountered in community gossip (“children raised by single parents usually become”) or in scientific journals (“growth mindset interventions predict”; Sisk, Burgoyne, Sun, Butler, and Macnamara, Reference Sisk, Burgoyne, Sun, Butler and Macnamara2018Footnote 9). Our need for causal explanations (Gopnik et al., Reference Gopnik, Glymour, Sobel, Schulz, Kushnir and Danks2004; Penn & Povinelli, Reference Penn and Povinelli2007) meets our tendency to essentialize people and groups, where genes offer a better essentialist vehicle than the environment (Dar-Nimrod & Heine, Reference Dar-Nimrod and Heine2011; Heine, Reference Heine2017).
The importance of limiting behavioral genetic findings to the reference population was famously argued for by Lewontin (Reference Lewontin1970), and remains a caveat for the analysis of genetic effects. But it is far less appreciated that the reason why a multitude of phenotypic factors can be successfully held constant (or controlled for) in the first place is, in large part, because of the convergent force of cultural learning. Lewontin (Reference Lewontin1970), in his counterargument to Jensen's (Reference Jensen1969) controversial article that argued for the innateness of IQ, used inbred corn and a uniformly acting nutrient solution as his rhetorical props for explaining the environmental sensitivity of genetic effects. Domesticated crops experience a more homogeneous environment not by accident, but as a product of human cumulative culture. Lewontin's famous example is, thus, an unintentional illustration of how culture can generate at times extreme phenotypic convergence in significant features of the environment – either our own or of our domesticated flora and fauna.
We are all aware of gene–environment interactions (Hunter, Reference Hunter2005; Lewontin, Reference Lewontin1970; Moffitt et al., Reference Moffitt, Caspi and Rutter2005), but we still tend to focus on what is predictive in our statistical models, which are constructed in a particular population, environment, and period of time but whose apparent lessons are commonly generalized beyond these contexts (e.g., the effects of an educational intervention). These models typically do not capture how the relevant environments are distributed within and between populations or how (or why) one type of environment transitions into another – “environment” is simply given as an exogenous variable. The cultural evolutionary approach forces us to explicitly recognize that human environments do not just happen to fall into place; they are rather the outcome of a dynamic, adaptive process that responds to both environmental and genetic factors. The literature on gene–environment interaction already recognizes genes and environments as non-orthogonal, but dependencies between the two are likely to be tighter and more prevalent than would be expected in a culture-free framework. This dynamic view of the environment also suggests that the problem of limited portability of polygenic scores across populations (Kim et al., Reference Kim, Patel, Teng, Berens and Lachance2018; Martin et al., Reference Martin, Kanai, Kamatani, Okada, Neale and Daly2019, Reference Martin, Gignoux, Walters, Wojcik, Neale, Gravel and Daly2017) is also likely to be a problem across historical time in a single population, as the issue is not just about differences in nucleotides across groups but also about the buildup of the cultural environment.
If we are to accommodate culture, the environment can no longer be treated as a static projection plane over which active elements (i.e., genes and G × E interactions) drop their shadows. Instead, both genes and environment – the latter animated by cultural dynamics – are in motion with respect to each other (as an example, see language–brain coevolution; Christiansen, Reference Christiansen1994; Christiansen & Chater, Reference Christiansen and Chater2008; Deacon, Reference Deacon1997; and cultural niche construction; Laland & O'Brien, Reference Laland and O'Brien2011; Laland, Odling-Smee, & Feldman, Reference Laland, Odling-Smee and Feldman2001). An environment can be used as a reference frame against which to judge the effect of genes, but this is done for pragmatic purposes and not because environments are intrinsically fixed (Haworth & Davis, Reference Haworth and Davis2014). We might take our cue from James Gibson's contribution to the study of vision, which he summarizes in the following manner:
The standard approach to vision begins with the eye fixed and exposed to a momentary pattern of stimuli… The ecological approach to visual perception works from the opposite end. It begins with the flowing array of the observer who walks from one vista to another, moves around an object of interest, and can approach it for scrutiny, thus extracting the invariants that underlie the changing perspective structure. (Gibson, Reference Gibson1979, p. 303)
Gibson recognized that environmental change is not noise, but rather the very medium through which the scientist obtains knowledge about visual function. Our argument presents an analogous approach to the study of genes.
5.2 Toward a culturally situated understanding of intelligence
The genetic underpinnings of intelligence have roots going back to the beginning of behavioral genetics (Galton, Reference Galton1869, Reference Galton1874) and have been fiercely debated since at least Jensen (Reference Jensen1969) and Lewontin (Reference Lewontin1970). The topic remains contentious, but a dual inheritance perspective cuts through some of this debate. Here, we summarize some key points.
IQ appears heritable – often measured at around 0.4 in toddlers and increasing up to 0.7 or 0.8 in adults (Bergen et al., Reference Bergen, Gardner and Kendler2007; Bouchard, Reference Bouchard2009). But as we and others have discussed, a high heritability score does not necessarily tell us whether a trait is primarily genetic; high heritability can also be an indicator of environmental homogeneity. Intelligence is a function of both our hardware (brain) and our software (culture) (Heyes, Reference Heyes2018; Hutchins, Reference Hutchins1995; Vygotsky, Reference Vygotsky1980), and the software has been changing far more and far more rapidly than has the hardware (Uchiyama & Muthukrishna, Reference Uchiyama, Muthukrishna, Chiao, Li, Turner, Lee-Tauler and Pringlein press). Genes certainly contribute to the size and organization of our brains – indeed, the cultural brain hypothesis predicts a strong selection pressure for larger brains (Muthukrishna et al., Reference Muthukrishna, Doebeli, Chudek and Henrich2018), still evident in the rapid increase in emergency birth interventions as a function of head size (Lipschuetz et al., Reference Lipschuetz, Cohen, Ein-Mor, Sapir, Hochner-Celnikier, Porat and Amsalem2015). But those genes are explaining residual phenotypic variation only after accounting for environmental factors that also affect the quality of neural hardware, such as nutrition (Lynn, Reference Lynn1990; Stoch et al., Reference Stoch, Smythe, Moodie and Bradshaw1982), parasites (Jardim-Botelho et al., Reference Jardim-Botelho, Raff, de Ávila Rodrigues, Hoffman, Joseph Diemert, Corrêa-Oliveira and Michael Bethony2008), air pollution (Zhang, Chen, & Zhang, Reference Zhang, Chen and Zhang2018), and lead exposure (Needleman & Gatsonis, Reference Needleman and Gatsonis1990; Wasserman et al., Reference Wasserman, Liu, Lolacono, Factor-Litvak, Morina, Musabegovic and Vrenezi1997). All are known to influence intelligence, but in societies that have been able to minimize variation in such factors through cultural diffusion, the environmental effect is also minimized. And it is not only such physical and physiological variables: changes in and diffusion of the cultural package delivered by schooling (Ceci, Reference Ceci1991; Davis, Reference Davis2014; Davis et al., Reference Davis, Stieglitz, Tayo, Kaplan and Gurven2020; Ritchie & Tucker-Drob, Reference Ritchie and Tucker-Drob2018) and our ever more complex entertainment media (Greenfield, Reference Greenfield2009; Johnson, Reference Johnson2006) also reduce the variation to be explained. All these processes unfold outside of any genetic changes to our neural hardware.
Recent, high-powered GWASs have found that genes associated with intelligence are expressed predominantly in the central nervous system (Davies et al., Reference Davies, Lam, Harris, Trampush, Luciano, David Hill and Hagenaars2018; Savage et al., Reference Savage, Jansen, Stringer, Watanabe, Bryois, de Leeuw and Nagel2018; Sniekers et al., Reference Sniekers, Stringer, Watanabe, Jansen, Coleman, Krapohl and Taskesen2017), but these findings too only explain the residual variation that remains after cumulative culture has reduced variation across many other variables – such as pathogens, parasites, and nutrition – that would otherwise account for huge portions of variation in IQ test performance. The expression of “intelligence genes” may cluster inside the head (Davies et al., Reference Davies, Lam, Harris, Trampush, Luciano, David Hill and Hagenaars2018; Savage et al., Reference Savage, Jansen, Stringer, Watanabe, Bryois, de Leeuw and Nagel2018; Sniekers et al., Reference Sniekers, Stringer, Watanabe, Jansen, Coleman, Krapohl and Taskesen2017), but this expression profile cannot be meaningfully evaluated without first considering the prior contributions of cumulative culture, which are invisible to standard methods in behavioral genetics. We predict that, in general, the set of identified genes that explain human traits such as intelligence is liable to change as a result of cumulative cultural evolution, both across cultures and across time within a single culture. Gene–phenotype mappings for culturally modifiable traits in humans are typically more transient than they are in other species, whose gene–phenotype mappings will typically (but not exclusively; see niche construction: Laland, Matthews, & Feldman, Reference Laland, Matthews and Feldman2016) only change at the slower timescales of genetic evolution or of passive ecological change. Just as limited sampling across historical time has obscured this difference in the temporal horizon of genetic effects across humans and nonhuman animals, the WEIRD sampling problem has obscured differences between humans and nonhumans with respect to within-species generalizability as well.
Even if intelligence is highly heritable in humans, this does not indicate that its genomic substrate works independently of the environment. The cultural environment can amplify heritability, and the degree of this amplification covaries with the extent to which a society has been able to reduce variation in physical, physiological, and informational factors that impact the phenotype. Developed countries, almost by definition, have been most successful in reducing this variation. This flattening of variation is an outcome brought about by expanded networks of cultural influence and greater cultural connectivity, both in part because of technological innovation and in part because of culturally evolving social norms and institutions. High heritability of intelligence is, therefore, most likely to reflect the effect of the cultural environment in these societies. As we argue in our discussion of the Flynn effect, cultural traits associated with high IQ are themselves transmitted through these cultural networks.
If a society demonstrates high heritability of some trait together with a high relative level of the trait, this combination may give the strong impression of genetic advantage, but the argument that we have developed in this target article points to a different kind of explanation. Comparisons of mean IQ across countries, or “National IQ” (Lynn & Vanhanen, Reference Lynn and Vanhanen2012), have been under scrutiny recently, but apart from the various methodological flaws that have been pointed out (e.g., Ebbesen, Reference Ebbesen2020), the non-obvious role of the cultural environment in shaping both the trait and its measurement should be seriously considered in this discussion as well. Epistemic issues such as the cultural Simpson's paradox should also be considered in cross-national analysis, as it can create associations between groups and traits that are a product of the cultural environment even when it appears otherwise. The examples that we use to illustrate the paradox – vitamin D deficiency and excess winter mortality (sect. 3.4) – are easy to grasp, but actual instantiations of the cultural Simpson's paradox are likely to be less straightforward.
The cultural evolutionary framework possesses unique strength in providing these kinds of explanatory strategies, as well as a general theoretical basis for understanding the formation and distribution of psychological traits such as intelligence. The approach that we develop here builds upon earlier, culturally situated approaches to intelligence (Berry, Reference Berry, Cronbach and Drenth1972; Cole, Reference Cole1998; Greenfield, Reference Greenfield and Neisser1998; Nisbett, Reference Nisbett2009; Vygotsky, Reference Vygotsky1980), but goes further in incorporating the population dynamics of cumulative culture, which offers greater clarity in how traits like IQ are shaped by non-genetic processes that span generational time.
6. Conclusion
Genetics is indeed in a peculiarly favoured condition in that Providence has shielded the geneticist from many of the difficulties of a reliably controlled comparison. The different genotypes possible from the same mating have been beautifully randomised by the meiotic process. A more perfect control of conditions is scarcely possible, than that of different genotypes appearing in the same litter. (Fisher, Reference Fisher1952)
Above, Sir Ronald Fisher exalts the inferential purity that is afforded by the powerful pairing of sexual recombination with simultaneous multiple birth, which conveniently flattens environmental variation. But of course, this purity becomes progressively degraded with age, as environmental effects channel offspring through different developmental trajectories. Even among inbred, genetically identical mice that cohabit an experimentally controlled space, self-organizing trajectories of environmental experience result in clear differentiation in phenotypes such as exploration, sociality, play behavior, and postnatal neurogenesis (Freund et al., Reference Freund, Brandmaier, Lewejohann, Kirste, Kritzler, Kruger and Sachser2013, Reference Freund, Brandmaier, Lewejohann, Kirste, Kritzler, Krüger and Sachser2015; Shemesh et al., Reference Shemesh, Sztainberg, Forkosh, Shlapobersky, Chen and Schneidman2013).
Humans’ trajectories differentiate so much more. We inhabit almost every ecosystem on Earth, not by speciating as many animals do, but through cultural adaptation, opening different developmental pathways in different societies. But even within a single society, our massive specialization leads to high levels of differentiation. Our genetic variation explains some of this, but we are the least genetically diverse great ape – two groups of chimpanzees in the Congo are more genetically different from each other compared to two groups of humans plucked from Berlin and Beijing (Prado-Martinez et al., Reference Prado-Martinez, Sudmant, Kidd, Li, Kelley, Lorente-Galdos and Veeramah2013). Most of our diversity is cultural rather than genetic (Bell et al., Reference Bell, Richerson and McElreath2009; Muthukrishna et al., Reference Muthukrishna, Bell, Henrich, Curtin, Gedranovich, McInerney and Thue2020); culture drives much of our within-species phenotypic variation. At best, genetic effects can only be specified within the ambit of a specific cultural context, but even the boundaries of that context cannot be specified without cultural evolutionary tools. And because culture is also evolving over time, these cultural contexts also require a timestamp. Heritability is not a property of a trait in itself, because in the absence of a reference culture it is necessarily unstable.
Cultural evolution yields cultural clusters. Within each society, environments are relatively homogeneous, and the homogeneity that we find within societies is coupled with pronounced heterogeneity between societies (Bell et al., Reference Bell, Richerson and McElreath2009; Richerson et al., Reference Richerson, Baldini, Bell, Demps, Frost, Hillis and Mathew2016). Extrapolating genetic effects beyond a species is obviously mistaken, but so too is extrapolating a genetic effect beyond a culture. But this is what researchers have been doing since Galton, and it is ingrained in both our methodology and our thinking, culminating in the recent triumphalist discourse surrounding behavioral genetics and GWASs.Footnote 10 The movement toward more diverse genomic data ought to make some of these problems more obvious, just as more diverse psychological data made the problems of WEIRD psychology more obvious. But here too, data alone will not solve the problem (Muthukrishna & Henrich, Reference Muthukrishna and Henrich2019; Muthukrishna et al., Reference Muthukrishna, Bell, Henrich, Curtin, Gedranovich, McInerney and Thue2020). The question is not whether genes or culture contribute more to a behavioral trait, as behavioral traits can only be understood as emergent products of our dual inheritance, genetic and cultural. Nothing in behavioral genetics makes sense except in the light of cultural evolution.
Acknowledgments
We are grateful for comments to an earlier version of this target article from Hovig Artinian, Benjamin Cheung, Ilan Dar-Nimrod, Steven Heine, Joseph Henrich, and Jay Lasker, as well as for the valuable input by the anonymous reviewers. We thank all those who posted comments about our preprint on Twitter and other social media. We would also like to thank Veronika Plant for illustrating Figure 2, as well as Madison Johnson, Mercedes Lucia Minahan, Monty Nitschke, Haley P. Riggs, and Mona J. Xue for replicating an earlier version of our model.
Financial support
This research received no specific grant from any funding agency, commercial, or not-for-profit sectors.
Conflict of interest
None.
Appendix A: Modeling the effect of cultural evolution on heritability
A.1 Variance partitioning model
Here, we describe a simple mathematical model that captures the relationship between cultural evolution and heritability. Cultural evolution is a process in which some cultural variants spread through a population more prolifically than others. This spread can be partly because of intrinsic differences in the trait (e.g., steel axes are better than stone axes) and partly because of social learning strategies such as the conformist bias, success bias, and prestige bias (for summary, see Chudek et al., Reference Chudek, Muthukrishna and Henrich2015; Kendal et al., Reference Kendal, Boogert, Rendell, Laland, Webster and Jones2018). Such strategies vary in their rules for selecting what to learn or whom to learn from, but they all lead to the disproportionate adoption of particular cultural variants over others, and thus to a reduction in the population-level variability of behaviors. Individual incremental improvement, individual learning (Legare & Nielsen, Reference Legare and Nielsen2015; Rogers, Reference Rogers1988), cultural transmission error, recombination of cultural traits, and other sources of innovation (Muthukrishna & Henrich, Reference Muthukrishna and Henrich2016) will continue to inject novel variants into the population, but the fact that a nearly unrestricted number of learners can inherit the behaviors and ideas of a few influential individuals makes it easy for cultural transmission to induce homogeneity. It is not only behavioral traits that become similar within a population through cultural transmission, but also environmental factors that shape behavioral traits, such as nutrition, sanitation, education, and media.
Heritability is defined as the proportion of phenotypic variance for some trait that is explained by genes. For broad-sense heritability, H 2 = V G/V P, where H 2 is the heritability, V P is the variance in phenotype, and V G is the phenotypic variance explained by all genetic factors including additive genetic variance, dominance interactions, and epistatic interactions. Because total phenotypic variance is made up of contributions from both genes and environment (V P = V G + V E), a reduction in the environmental contribution necessarily increases heritability; cultural evolution has been a powerful force for behavioral homogenization and hence reduction in environmental variance over human history. Behavioral geneticists partition phenotypic variance into genetic and environmental components, but here we further partition the environmental component into environmental variation unaffected by cultural evolution (e.g., UV exposure because of geographic location) and environmental variation affected by cultural evolution (e.g., UV exposure because of sunscreen use). For convenience, we refer to the former as the ecological environmental variance component and the latter as the cultural environmental variance component, and represent this partition using the following notation:
 $$V_{\rm E} = V_{\rm e} + V_{\rm c}$$
where V e and V c denote the phenotypic variance explained by ecology and culture, respectively. In reality, the cultural environment and even individual cultural traits will typically have a high-dimensional variance structure, such as with the various components of a tool or a ritual that can be independently modified, but here we employ a unidimensional space of cultural variation. For simplicity, we model cultural environmental variation as a uniform continuous distribution that is bound by k min, the most unfavorable environmental state (for some given phenotype) within the experienced range of environments, and k max, the most favorable. We can use the theoretically expected variance of the continuous uniform distribution ((1/12)(b − a)2, where a and b are the minimum and maximum values) to rewrite (1):
 $$V_{\rm E} = V_{\rm e} + \displaystyle{1 \over {12}}( k_{{\rm max}}-k_{{\rm min}}) ^2\;$$
We can then substitute (2) into the standard formula for broad-sense heritability:
 $$H^2 = \displaystyle{{V_{\rm G}} \over {V_{\rm G} + V_{\rm e} + ( 1/12) {( k_{{\rm max}}-k_{{\rm min}}) }^2}}$$
Heritability, thus, decreases when (k max − k min) is large and increases when it is small. The smaller the experienced range of aspects of the cultural environment that contribute to phenotypic variation, the more phenotypic variation there is left to be explained by genes and by consequence, the higher the heritability. The magnitude of this cultural effect depends upon (a) the ratio of V c to V e, which is the extent of cultural influence upon the environmental variance component as a whole, as well as (b) the ratio of genetic influence to total environmental influence (V G to V E). We illustrate the effect of each of these variance components on heritability in Figure 4. To keep the model simple, we omit the gene–environment interaction and gene–environment correlation terms.
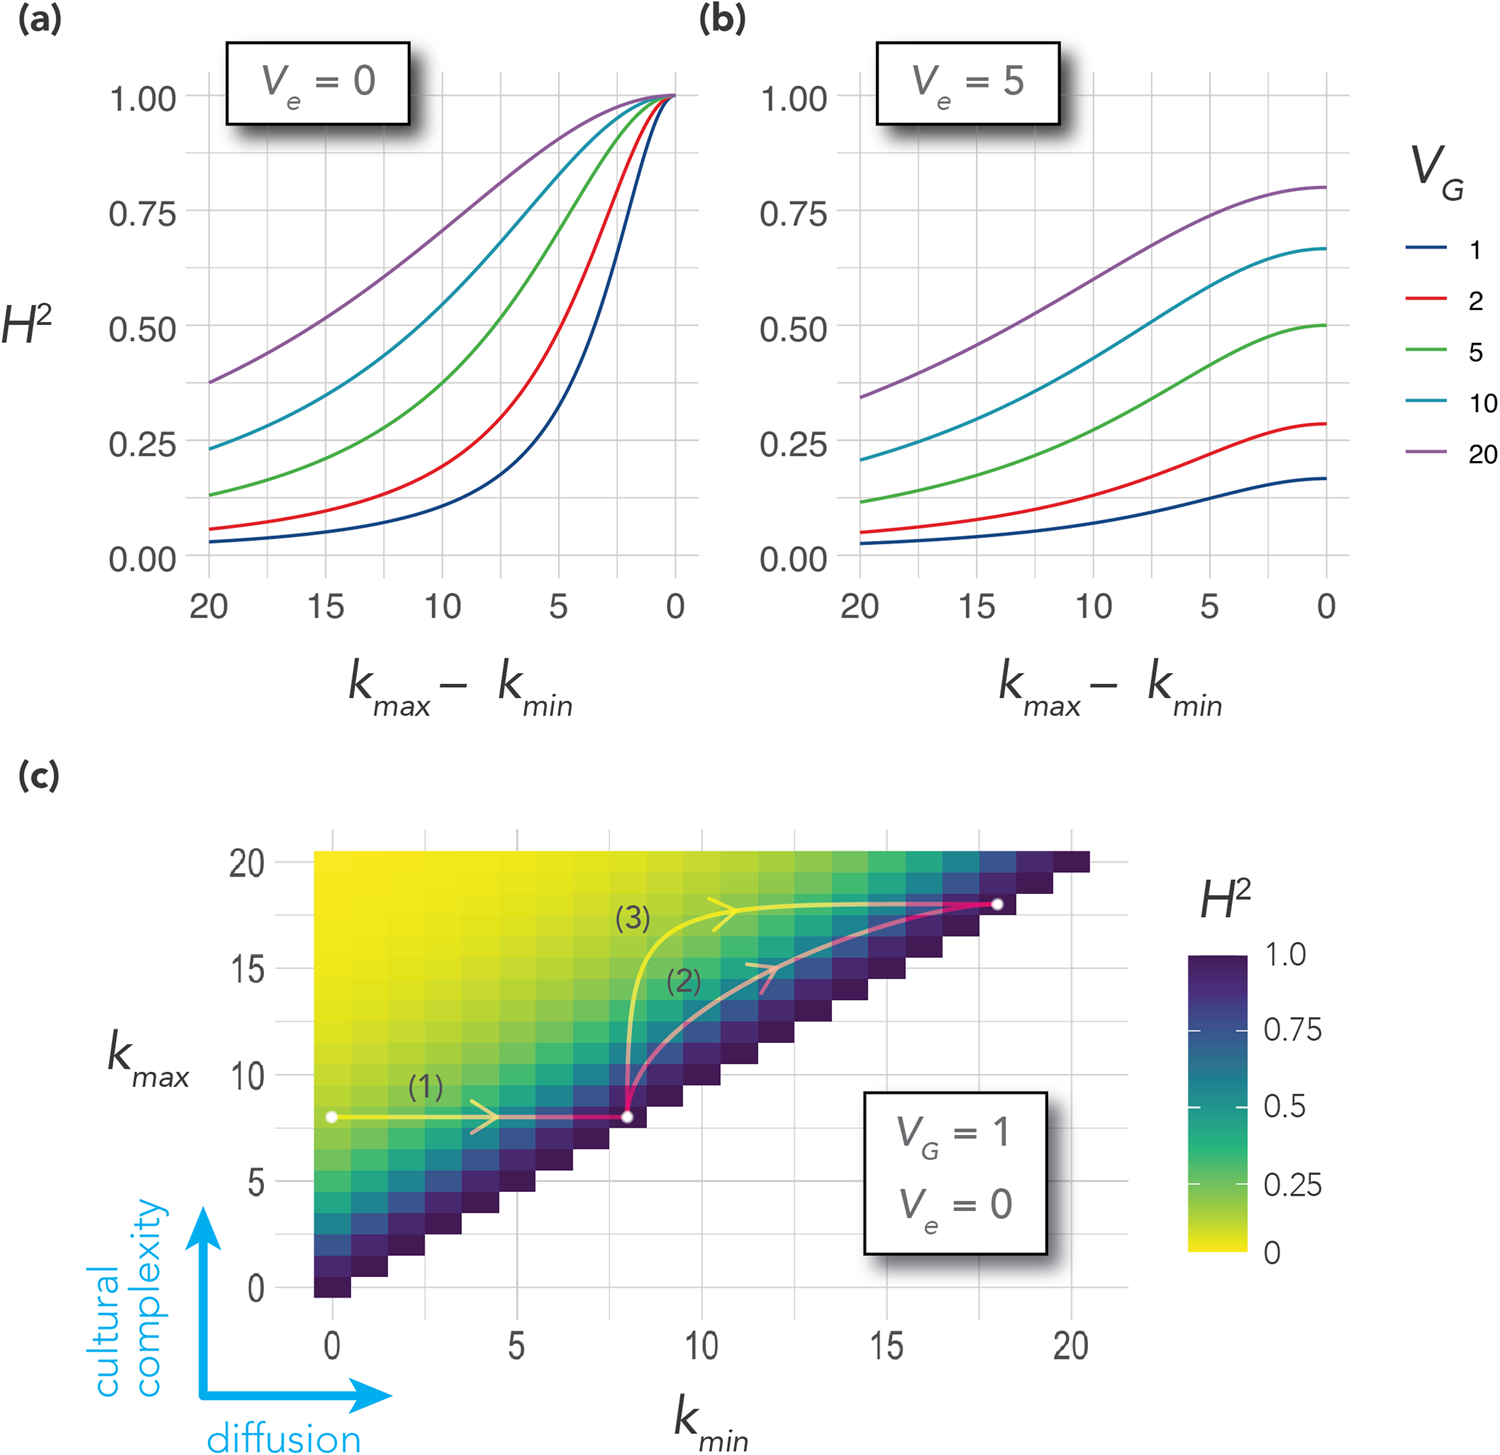
Figure 4. Visualizations of equation (3). Heritability curves as a function of cultural range (k max − k min) and of the amount of genetic variance (V G). (a) Values are computed for V e = 0 (the environment is entirely explained by cultural factors) and (b) for V e = 5 (some of the environment is explained by non-cultural factors, such as climate). (c) An alternative visualization in which we look at the absolute values of k max and k min rather than just their difference, plotted for V e = 0 and V G = 1. An increase in k max expands environmental variation and implies increasing maximum cultural complexity, whereas an increase in k min reduces environmental variation and implies diffusion. Trajectory 1 represents a society's transition from a more unequal cultural environment to a more equal cultural environment, but with no increase in cultural complexity. Trajectories 2 and 3 represent a simultaneous increase in cultural complexity and diffusion of the newly established complex traits, where a rising k max pulls k min upward but with varying lags: For trajectory 2 there is little lag between increase in the complexity of the culture and its spread, whereas for trajectory 3 there is considerable lag, with a longer period of relative cultural inequality. Genetic heritability decreases with rising cultural complexity and increases with cultural equality (diffusion). For example, continued innovation will reduce heritability up to the point at which the society is maximally unequal, and then increase heritability once more as the cultural innovations spread to the entire population – that is, curves 2 and 3 are non-monotonic.
This model shows how heritability can be shaped by a shifting cultural environment. Once again, this insight is in itself neither new nor surprising. But the model we describe here allows us to go further and consider the particular, systematic ways in which the cultural environment is expected to change. Although this model does not incorporate cultural dynamics as such, we can nonetheless map two broad cultural dynamics onto its framework: (1) new innovations elevating the upper bound of cultural complexity (Henrich, Reference Henrich2004a; Muthukrishna & Henrich, Reference Muthukrishna and Henrich2016) and (2) diffusion of these innovations (Comin & Hobijn, Reference Comin and Hobijn2010; Henrich, Reference Henrich2001; Rogers, Reference Rogers2003) – new traits emerge and then spread to fixation in the population. Within this framework, we can think of increases in cultural complexity as pushing up k max, the most favorable cultural conditions in a society. In turn, we can think of diffusion as pushing up k min, the most unfavorable cultural conditions in a society. As an example, imagine k max is the educational contribution of the best school in a society and k min is the educational contribution of the worst school in a society. In some societies, educational innovations diffuse quickly, whereas in others, there is more lag between the discovery of a new technology or pedagogical technique and its widespread adoption. Some societies are highly equal (k max − k min is small) and others are more unequal (k max − k min is large). The magnitude of the lag between increasing k max and k min – for example, how quickly educational innovations in the best schools diffuse to other schools – impacts environmental heterogeneity and thus heritability: We illustrate this effect as different trajectories of cultural change in Figure 4c. Moreover, by further decomposing k max and k mininto their governing cultural dynamics, we can predict the trajectories of heritability over time.
A.2 Cultural dynamics model
To capture the effect of a changing cultural environment on heritability estimates over time, we construct a simple model that incorporates a time axis and whose parameters can be adjusted to compare different cultural trajectories. This dynamic model builds upon the previous variance partitioning model, but extends it by representing k min and k max – the upper and lower bounds of the acquired range of cultural complexity – as sigmoidal trajectories (s-shaped curves), which are commonly used to model cultural diffusion (Henrich, Reference Henrich2001; Rogers, Reference Rogers2003). Here, we use the Gompertz function, which is a special case of the generalized logistic function that is commonly used in biology to model growth. In particular, we employ the following re-parameterization of the Gompertz that is given by Tjørve and Tjørve (Reference Tjørve and Tjørve2017):
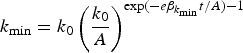 $$k_{{\rm min}} = k_0\left({\displaystyle{{k_0} \over A}} \right)^{{\rm exp}( {-e\beta_{k_{{\rm min}}}t/A} ) -1}$$
 $$k_{{\rm max}} = k_0\left({\displaystyle{{k_0} \over A}} \right)^{{\rm exp}( {-e\beta_{k_{{\rm max}}}t/A} ) -1}$$
where t is the time; A is the upper asymptote of both k min and k max; k 0 is a parameter that fixes both k min and k max to a particular value at t = 0; and  $\beta _{k_{{\rm min}}}$ and
  $\beta _{k_{{\rm max}}}$ are the maximum growth rates of k min and k max, respectively. At any given time point, k min ≤ k max by definition: this condition is satisfied for all t ≥ 0 (but not for t < 0) when we set
  $\beta _{k_{{\rm max}}}$ to be larger than
  $\beta _{k_{{\rm min}}}$, because of both curves being fixed to the same value k 0 at t = 0. This model, therefore, requires that k min and k max only be evaluated over non-negative time points.
The parameters  $\beta _{k_{{\rm min}}}$ and
  $\beta _{k_{{\rm max}}}$ determine the shapes of the diffusion and innovation curves, respectively. They indicate maximum (absolute) growth rates, which occur at the inflection points of k min and k max. In a Gompertz function, inflection occurs at 1/e = 36.79% of the upper asymptote value A, regardless of the parameter values. Therefore, curves with a larger maximum growth rate are steeper and approach the asymptote more rapidly. By adjusting
  $\beta _{k_{{\rm min}}}$ and
  $\beta _{k_{{\rm max}}}$, we can model the variation in relative rates of cultural innovation and diffusion across different types of society, as well as the impact of these different cultural trajectories on heritability. Many factors can affect these rates of innovation and diffusion (De, Nau, & Gelfand, Reference De, Nau and Gelfand2017; Gelfand, Reference Gelfand2018; Kolodny et al., Reference Kolodny, Creanza and Feldman2015; Muthukrishna & Henrich, Reference Muthukrishna and Henrich2016; Muthukrishna & Schaller, Reference Muthukrishna and Schaller2020; Rogers, Reference Rogers2003; Schaller & Muthukrishna, Reference Schaller and Muthukrishnain press). For example, a “tight” society may have low rates of radical innovation, high rates of incremental innovation, and high rates of diffusion of these innovations, whereas a “loose” society may have high rates of radical innovation but lower rates of diffusion (Gelfand, Reference Gelfand2018). Other societies may be high or low in both. In Figure 5, we illustrate a 2 × 2 of societies that vary in their innovation and diffusion rates.
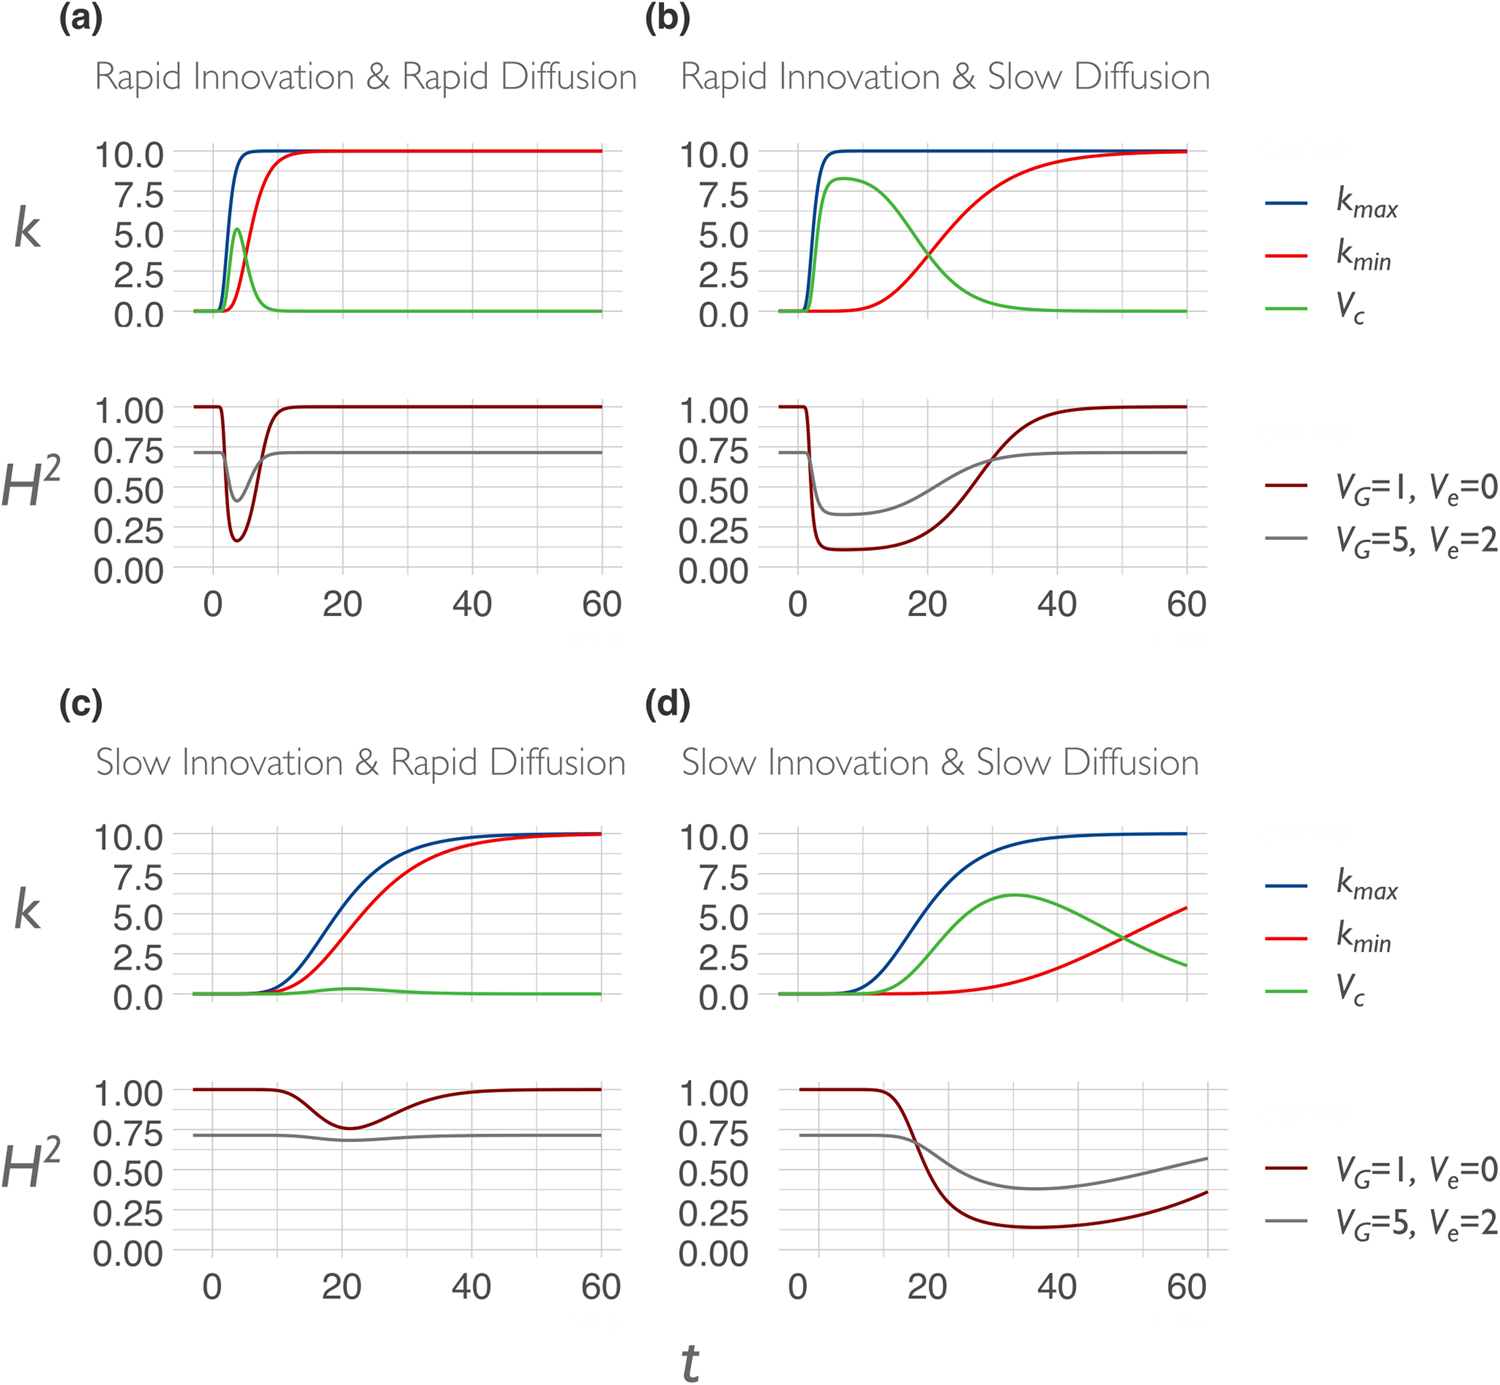
Figure 5. Output examples of the cultural dynamics model, for four prototypical societies. For each society, the upper panel displays the change over time in the lower (k min) and upper bounds (k max) of the society's cultural complexity as it pertains to some given phenotypic trait, together with the variance explained by the cultural environment V c, which is the theoretically expected variance of the uniform distribution over the interval [k min, k max]. The lower panel displays the change in heritability over time under two different settings for genetic and ecological variance components. Global model parameters are set to A = 10 and W 0 = 10−6. (a) A society that innovates rapidly while also diffusing these innovations across the population rapidly; maximum growth rates of k min and k max are  $\beta _{k_{{\rm min}}} = 2$ and
  $\beta _{k_{{\rm max}}} = 5$, respectively. (b) A society that innovates rapidly but whose innovations are slow to diffuse;
  $\beta _{k_{{\rm min}}} = 0.5$ and
  $\beta _{k_{{\rm max}}} = 5$. (c) A society that innovates only gradually but whose innovations diffuse quickly;
  $\beta _{k_{{\rm min}}} = 0.5$ and
  $\beta _{k_{{\rm max}}} = 0.6$. (d) A society that innovates only gradually and whose innovations take even longer to diffuse;
  $\beta _{k_{{\rm min}}} = 0.2$ and
  $\beta _{k_{{\rm max}}} = 0.6$.
Heritability is computed using the same procedure as the variance partitioning model, but dynamically. Following equation (2), we compute the cultural variance component V c at time t by taking the variance of the uniform distribution over the interval [k max, k max] at time t. Phenotypic variance explained by the environment (i.e., ecology and culture) at time t therefore takes the following form:
 $$V_{{\rm E}( t ) } = V_{\rm e} + \displaystyle{1 \over {12}}( k_{{\rm max}( t ) }-k_{{\rm min}( t ) }) ^2$$
where V e is again the ecological variance component, which we treat as static compared to the rapidly changing cultural environment. By selecting values for both V e and V G (the genetic variance component), we can thus compute broad-sense heritability at time t in the same manner as (3):
 $$H_{( t ) }^2 = \displaystyle{{V_{\rm G}} \over {V_{\rm G} + V_{\rm e} + ( 1/12) {( k_{{\rm max}( t ) }-k_{{\rm min}( t ) }) }^2}}$$
These dynamics of changing environmental variance and heritability were only implicitly included in the variance partitioning model above (see Fig. 4c) but are represented here explicitly. The effects of innovation and diffusion on cultural variance and heritability for each society are illustrated in the lower panels of Figure 5. These results show, for example, that societies with both rapid innovation and rapid diffusion of these innovations should experience large transient changes in heritability (Fig. 5a), while a combination of slow innovation and rapid diffusion has little impact on heritability (Fig. 5c). Societies with rapid innovation but long lags in diffusion will experience large changes in heritability over longer timescales (Fig. 5b), as will societies with slow innovation and slow diffusion (Fig. 5d). In reality, there may be multiple relevant cultural innovations for some given phenotypic trait at any given point in time – under such a scenario, heritability would tend to fluctuate around some intermediate value rather than traverse the full range depicted in the lower panels of Figure 5. The output of this model predicts that on average, heritability of culturally transmissible traits should be higher in more homogeneous (tight or less clustered) societies than in less homogeneous (loose or more clustered) societies, as discussed in section 2.2.3.


Target article
Cultural evolution of genetic heritability
Related commentaries (29)
(Super-)cultural clustering explains gender differences too
A cultural evolutionary behavior genetics will need a more sophisticated conceptualization of cultural traits
Changes in heritability: Unpredictable and of limited use
Cultural dynamics add multiple layers of complexity to behavioural genetics
Cultural evolution and behavior genetic modeling: The long view of time
Cultural evolution may influence heritability by shaping assortative mating
Cultural evolution: The third component of mental illness heritability
Cultural evolutionary theory is not enough: Ambiguous culture, neglect of structure, and the absence of theory in behavior genetics
Culture and causal inference: The impact of cultural differences on the generalisability of findings from Mendelian randomisation studies
Culture is reducing genetic heritability and superseding genetic adaptation
Developmental noise is an overlooked contributor to innate variation in psychological traits
Differential application of cultural practices at the family and individual levels may alter heritability estimates
Evolving the blank slate
From the trajectory of heritability to the heritability of trajectories
Genetic solutions to cultural problems?
Going beyond heritability: Mechanisms of gene–culture coevolution
Heritability is a poor, if not unhelpful, measure of complex human behavioral processes
Hidden clusters beyond ethnic boundaries
Interpreting and reinterpreting heritability estimates in educational behavior genetics
Measuring heritability: Why bother?
Models of gene–culture evolution are incomplete without incorporating epigenetic effects
The dubious precision and utility of heritability estimates
The evolutionary dance between culture, genes, and everything in between
The implications of the cultural evolution of heritability for evolutionary psychology
The many geographical layers of culture
There is no such thing as culture-free intelligence
This time I mean it: The nature–nurture debate is over
Understanding cultural clusters: An ethnographic perspective
Unpackaging cultural variability in behavioral phenotypes
Author response
Integrating cultural evolution and behavioral genetics