


1. Introduction
When an ultrasound-driven microbubble oscillates in a volume of fluid, it creates a periodic oscillatory displacement of the fluid particles. In addition, the fast bubble oscillations may lead to a relatively slow mean flow, called acoustic streaming. Its origin lies in the nonlinear second-order effects in the fluid mechanics equations. The nonlinear term  $\boldsymbol{u} \boldsymbol {\cdot } \boldsymbol {\nabla } \boldsymbol{u}$ is large in the oscillatory boundary layer of the oscillating bubble, and is non-zero when time-averaged over the acoustic time scale. Thence, microstreaming can be generated by a source sinusoidal in time, such as even a purely translating body may generate a mean flow. Due to the time-averaging process, microstreaming results from the interaction of two components of the bubble interface oscillation occurring at the same frequency. If a gas bubble experiences a translation – or spherical – oscillation only at a given frequency, then some fluid flow can originate in the interaction of this oscillation with itself. If two oscillatory components coexist (amongst the translation, spherical or any nonspherical oscillations) at the same frequency, then steady flows arise from the interaction between these two oscillations. We must go back to 1831 in order to find the early beginnings of experimental work on acoustic streaming, when Faraday (Reference Faraday1831) observed and reported for the first time air streaming that resulted from a vibrating plate, and then wait 50 years for the first theoretical work accomplished by Rayleigh (Reference Rayleigh1884) with his study on steady air flows between parallel walls. He explained their existence in resonant pipes as a time-independent second-order flow driven by the viscous stresses of the fluid, and justified their specific patterns by the presence of the parallel solid boundaries. The association of this phenomenon to a gas bubble is first attributed to Kolb & Nyborg (Reference Kolb and Nyborg1956), who discovered the generation of microstreaming when the bubble is tethered to a vibrating metal cone, and to Elder (Reference Elder1959), who observed the acoustic streaming of a bubble visualized from a side view, as a function of the fluid viscosity and the acoustic pressure. At that time, Elder stated for the first time that the direction of the flow in a low-viscosity medium ‘is such as to move the liquid away from the nodes and towards the anti-nodes’. In these works, nonspherical instabilities of a tethered bubble were reported above certain pressure values, as well as changes in the microstreaming behaviour associated with changes in the bubble modal deformations.
Since then, microstreaming induced by a single bubble has been investigated through several scenarios, either when undergoing a rigid-body translation motion only (Davidson & Riley Reference Davidson and Riley1971; Longuet-Higgins Reference Longuet-Higgins1998; Collis et al. Reference Collis, Manasseh, Liovic, Tho, Ooi, Petkovic-Duran and Zhu2010), or when accompanied by a radial oscillation (Gormley & Wu Reference Gormley and Wu1998; Longuet-Higgins Reference Longuet-Higgins1998; Marmottant et al. Reference Marmottant, Versluis, de Jong, Hilgenfeldt and Lohse2006; Bolañs-Jimenez et al. Reference Bolañs-Jimenez, Rossi, Rivas, Kähler and Marin2017), when animated by either axisymmetric shape modes (Spelman & Lauga Reference Spelman and Lauga2017; Cleve et al. Reference Cleve, Guédra, Mauger, Inserra and Blanc-Benon2019) or asymmetric ones (Tho, Manasseh & Ooi Reference Tho, Manasseh and Ooi2007). These shape modes are generated through the process of parametric instability when the bubble radial oscillation is driven above some pressure threshold (Brenner, Lohse & Dupont Reference Brenner, Lohse and Dupont1995; Feng & Leal Reference Feng and Leal1997; Shaw Reference Shaw2017). For an initially spherical bubble, shape modes are usually decomposed over the set of orthonormal spherical harmonics  $Y_{nm}(\theta, \phi )$ of degree
  $n$ and order
  $m$. They are called zonal when
  $m=0< n$, sectoral when
  $n=m > 0$, and tesseral when
  $n > m > 0$. Zonal harmonics correspond to axisymmetric deformations that preferentially develop for bubbles free of any constraint. Such a case occurs when bubbles are acoustically trapped in a standing-wave levitation system (Cleve et al. Reference Cleve, Guédra, Mauger, Inserra and Blanc-Benon2019) or stabilized close to the vortex core of a propagating beam (Baresch & Garbin Reference Baresch and Garbin2020). Investigation of bubble interface motion and induced streaming in an unbounded fluid presents the advantage of allowing comparison to mathematical models that are based on the assumption of axisymmetric bubble oscillation. Bubble-induced microstreaming generated by the combination of radial, translation or any arbitrary axisymmetric oscillation is now well documented (Longuet-Higgins Reference Longuet-Higgins1998; Spelman & Lauga Reference Spelman and Lauga2017; Doinikov et al. Reference Doinikov, Cleve, Regnault, Mauger and Inserra2019a,Reference Doinikov, Cleve, Regnault, Mauger and Inserrab; Inserra et al. Reference Inserra, Regnault, Cleve, Mauger and Doinikov2020a,Reference Inserra, Regnault, Cleve, Mauger and Doinikovb).
Sectoral and tesseral harmonics correspond to asymmetric deformation whose triggering is facilitated when a bubble is close to or in contact with a wall. The mathematical description of bubble asymmetric oscillation is complex and brings a bunch of new difficulties when resolving the bubble interface dynamics. As a result, experimental works about microstreaming induced by asymmetric shape modes are very scarce. When deriving the equation of motion of the bubble surface oscillation at the first order of the ratio between modal displacement amplitudes and the bubble radius at rest  $\epsilon _n = a_n/R_0$, it appears that asymmetric modes
  $m$ of a same degree
  $n$ are degenerate. The associated Lamb spectrum describing the instability regions of any surface mode is therefore limited to the spectrum of the zonal, axisymmetric modes. The splitting of the natural frequencies of the whole set of asymmetric oscillation has been evidenced recently, experimentally for a substrate-attached bubble (Fauconnier, Béra & Inserra Reference Fauconnier, Béra and Inserra2020) and theoretically for a bubble oscillating near a wall (Maksimov Reference Maksimov2020). The study of an oscillating bubble close to or in contact with a wall takes an interest in the capacity for microstreaming to generate shear stresses in close boundary, which is widely reported in literature, whether it focuses on medical applications (Doinikov & Bouakaz Reference Doinikov and Bouakaz2010; Yu & Chen Reference Yu and Chen2014; Pommella et al. Reference Pommella, Brooks, Seddon and Garbin2015) or for purposes of industrial cleaning (Chahine et al. Reference Chahine, Kapahi, Choi and Hsiao2016; Reuter & Mettin Reference Reuter and Mettin2016). In this latter application, the emphasis is rather on jetting bubbles and bubbly flows induced by cavitating and collapsing bubbles, given that huge stresses are required for efficiently cleaning textiles (Choi, Kim & Kim Reference Choi, Kim and Kim2016), sterilizing pharmaceutical materials (Verhaagen & Rivas Reference Verhaagen and Rivas2016) or treating waste water (Dular et al. Reference Dular2016).
The present article focuses on the microstreaming induced by a wall-attached microbubble undergoing asymmetric shape modes. Section 2 describes the experimental set-up that allows the capture of high-resolved temporal dynamics of an ultrasound-driven wall-attached bubble. Section 3 gives a short overview on the decomposition of the bubble interface motion over the set of spherical harmonics. Finally, § 4 is dedicated to the experimental investigation of the diverse forms of microstreaming patterns and their correlation to the bubble interface modal content. Throughout this section we also briefly discuss our method for quantitatively describing the bubble nonspherical dynamics. All main classes of spherical harmonics are explored, from the zonal mode, which is widely documented in the literature, to its interaction with a sectoral mode, passing by sectoral modes only and tesseral modes only.
2. Methodology
Figure 1(a) depicts a schematic of the experimental set-up, which barely differs from the one described by Fauconnier et al. (Reference Fauconnier, Béra and Inserra2020) concerning the study of the interface dynamics of an ultrasound-driven wall-attached bubble. A dihydrogen microbubble is nucleated by electrolysis by means of a signal generator (Agilent 33210A, squared signal, peak-to-peak amplitude 4 V $_{pp}$, offset 2 V
 $_{pp}$, 50 % duty cycle). This is performed within a polymethyl methacrylate tank of inner size
  $L_x \times L_y \times L_z = 44 \times 260 \times 50$ mm
 $^3$ filled with pure water (Milli-Q® IQ 7000) with additional NaCl (concentration
  $24\pm 1$ mg l
 $^{-1}$). A three-axis hydraulic micromanipulator (Narishige MMO-203) allows a fine displacement of the electrolysis actuator, and hence the tethering of the microbubble at the desired location at the bottom of the tank. Once the bubble is released, the electrolysis wire is moved away so that it does not interfere with the oscillation of the attached bubble. Positioned in the optical path of an inverted Nikon Eclipse-Ti microscope, the bubble visualization from the top view is done through a 10
 $\times$ magnification optical lens. Once it has been created, the microbubble, with equilibrium radius sizing in the range 60–140
  $\mathrm {\mu }{\rm m}$, is acoustically excited by a Langevin transducer (SinapTec, 30.5 kHz nominal frequency, high-voltage gain amplifier Trek50/750) supplied by a signal generator (Agilent 33220A) delivering a sine wave signal of frequency
  $f_0 =30.5$ kHz. The transducer is acoustically coupled to the tank by means of ultrasound transmission gel (Aquasonic, Thermo Fisher Scientific). The bubble dynamics and the surrounding fluid motion are captured by a high-frame-rate camera (Vision Research, Phantom V12.1) with an image scaling of
  $2\,\mathrm {\mu }{\rm m}\,{\rm pixel}^{-1}$. The monitoring of the bubble-induced fluid motion was enabled by appending tracking particles (Fluoro-max red beads
  $3\,\mathrm {\mu }{\rm m}$, Thermo Fisher Scientific) in the water. Since the bubble interface displacement and the fluid motion occur at different time scales, the camera records alternatively two video sequences with different acquisition parameters (frame size, frame rate and exposure time), summarized in table 1. This allows us not only to associate the microstreaming patterns to its bubble dynamics, but also to ensure that bubble oscillations are stable. The capture of the streaming lasts a few seconds, which is a sufficient duration to fully resolve the trajectory of the particles. Microstreaming patterns are then obtained by retaining for each pixel the minimum value among the whole stack of images. In addition, in order to obtain information about the velocity field, a particle tracking velocimetry (PTV) analysis has been performed using the Fiji software (Schindelin et al. Reference Schindelin2012) and the plugin Trackmate (Tinevez et al. Reference Tinevez, Perry, Schindelin, Hoopes, Reynolds, Laplantine, Bednarek, Shorte and Eliceiri2017) with the linear motion tracker. While the tracking particles are fluorescent and thus originally built for being lit by a laser source, we were here visualizing them with the microscope white light, which turned out to be a functional configuration. In addition, we are confident in the ability of these tracking particles to follow with closeness and fidelity the global fluid motion, since their Stokes number (Tropea, Yarin & Foss Reference Tropea, Yarin and Foss2007)
  $St$ is much smaller than 1:
 \begin{equation} St \propto \frac{d_p |\rho_p - \rho_f| v_{max}}{\mu} \simeq 6.2 \times 10^{{-}3} \ll 1, \end{equation}
where  $\rho _f \simeq 0.998 \times 10^3\,{\rm kg}\,{\rm m}^{-3}$ is the density of pure water (at
  $20\,^{\circ }$C),
  $\rho _p \simeq 1.05 \times 10^3\,{\rm kg}\,{\rm m}^{-3}$ is the density of particles,
  $d_p \simeq 3\,\mathrm {\mu }{\rm m}$ is their equivalent mean diameter,
  $\mu \simeq 1$ mPa s is the dynamic viscosity of water and
  $v_{max} \simeq 40$ mm s
 $^{-1}$ is the approximated maximal velocity of streaming.

Figure 1. Schematic representation of the experimental set-up illustrating a bubble attached to the bottom of a water-filled tank (a) and geometry of the system under study: three-dimensional (b) and top view (c) representations of a numerical bubble exhibiting the nonspherical deformation of a sectoral mode  $n=m=4$. The bubble interface is characterized using spherical coordinates
  $(r,\theta,\phi )$.
Table 1. Acquisition parameters (frame size, frame rate and exposure time) as set in the software Phantom Camera Control (PCC).

Before closing this section, the matter of the tethering and how the bubble stands on the wall has to be addressed, given that it can play a decisive role on the bubble modal behaviour. Geometrically, the contact angle  $\alpha$ of the bubble is defined by the angle formed by the tangent to the bubble surface at the contact point and the substrate plane. Measurements have been performed before ultrasound activation for a large number of single wall-attached bubbles, in an occasional side-view configuration. The angle
  $\alpha = \sin ^{-1}(L/2R_0)$ is obtained from the optical measurement (figure 2a) of the bubble radius
  $R_0$ and the diameter of the bubble base
  $L$ via the Fiji software (Schindelin et al. Reference Schneider, Rasban and Eliceiri2012). It came out that it lies in a broad range
  $40$–
$40$– $60\,^{\circ }$ (figure 2b) and shows no dependency with the bubble radius (figure 2c). The large dispersion in the measured contact angles comes from the fact that they are highly dependent on the way the bubble has been deposited on the surface (Noblin, Buguin & Brochard-Wyart Reference Noblin, Buguin and Brochard-Wyart2009). We have also noticed that after ultrasound activation, as long as the bubble does not shift from its original location, the contact angle at rest does not change significantly for the same bubble.

Figure 2. Investigation of the bubble contact angle  $\alpha = \sin ^{-1}(L/2R_0)$, allowed by the optical measurement from a side view of the bubble radius
  $R_0$ and the contact diameter
  $L$ (a). The angle
  $\alpha$ is displayed as a frequency distribution (b) and as a function of the bubble equilibrium radius
  $R_0$ (c).
3. Nonspherical shape modes
Nonspherical modes are three-dimensional spatial functions that develop in elevation and azimuth at the bubble interface following spherical harmonics  $Y_{nm}(\theta,\phi )$, which are eigenmodes of a sphere. The general expression of the bubble interface animated by nonspherical shape modes is
 \begin{equation} r(\theta,\phi,t) = R_0 + R(t) + \sum_{n,m} a_{nm}(t)\,Y_{nm}(\theta,\phi), \end{equation}
where  $\theta \in [0\ {\rm \pi}]$ and
  $\phi \in [0\ 2{\rm \pi} ]$ are spherical coordinates,
  $R(t)$ is the radial (volumetric) oscillation occurring at the driving frequency,
  $Y_{nm}(\theta,\phi ) = f_{nm} P_{nm}(\cos \theta )\,{\rm e}^{{\rm i} m \phi }$ are the spherical harmonics of degree
  $n$ and order
  $m$ (
$m$ ( $n\ge 1$,
  $-n \le m \le n$),
  $P_{nm}$ is the associated Legendre polynomial,
 \begin{equation} f_{nm} = ({-}1)^m \sqrt{\frac{(2n+1)}{4 {\rm \pi}} \frac{(n-|m|)!}{(n+|m|)!}} \end{equation}
is a normalization coefficient and  $a_{nm}(t)$ are the time-varying amplitudes of the surface modes. The bubble equilibrium radius
  $R_0$ is obtained experimentally from a snapshot captured at rest, right after the two video sequences. As a reminder, spherical harmonics
  $Y_{nm}$ are called zonal when
  $m=0< n$, sectoral when
  $n=m > 0$ or tesseral when
  $n > m > 0$. A numerical example of a bubble exhibiting a sectoral harmonic deformation of degree
  $n=4$, displayed in figures 1(b) and 1(c), illustrates the geometry of the system under study.
For the bubbles investigated here with equilibrium radius in the range 60–140  $\mathrm {\mu }{\rm m}$ and acoustically driven at 30.5 kHz, modes of degrees
  $n=3$ to
  $n=6$ are observable, as expected from the theoretical predictions on free bubbles (Francescutto & Nabergoj Reference Francescutto and Nabergoj1978) and recent experiments on wall-attached bubbles (Fauconnier et al. Reference Fauconnier, Béra and Inserra2020). This range of bubble radii includes the resonant radius of the radial (volumetric) oscillation, given that, according to Minnaert's theory (Minnaert Reference Minnaert1933), it corresponds to
  $108.3\,\mathrm {\mu }{\rm m}$ for the chosen forcing frequency. On the other hand, the spectrum of the resonant radii
  $R_{res}^{n}$ of bubble shape modes was derived by Lamb (Reference Lamb1916) and is given by
 \begin{equation} R_{res}^{n} = \sqrt[3]{\dfrac{(n-1) (n+1) (n+2) \sigma}{\rho \omega_0^2 /4}}, \end{equation}
where  $\sigma$ is the surface tension,
  $\rho$ is the liquid density and
  $\omega _0 = 2 {\rm \pi}f_0$ is the angular frequency of acoustic driving. It should be highlighted that (3.3) does not contain the index
  $m$: all
  $n+1$ shape modes associated with the same degree
  $n$ are defined by the same resonant radius, and are thus said to be degenerate. Moreover, the studied shape modes are parametrically excited by the radial oscillation on their first resonance and therefore behave subharmonically. As a consequence, no streaming can result from the interaction between a nonspherical shape mode and the radial oscillation occurring at the driving frequency (Cleve et al. Reference Cleve, Guédra, Mauger, Inserra and Blanc-Benon2019). The pressure thresholds for their onset are predicted by Francescutto & Nabergoj (Reference Francescutto and Nabergoj1978). In accordance with our experimental parameters, their computation leads to the graphic representation displayed in figure 3, joined with the associated modal natural frequencies issued from (3.3).

Figure 3. Theoretical instability threshold curves of the axisymmetric (zonal) modes of a free bubble, according to Francescutto & Nabergoj (Reference Francescutto and Nabergoj1978), for modal degrees  $n=3$ to
  $n=6$, joined with their respective resonant radius
  $R_{res}^{n}$. The resonant radius associated with the radial (volumetric) oscillation equals 108.3
  $\mathrm {\mu }{\rm m}$.
Generally speaking, a nonspherical mode of degree  $n$ and order
  $m$ has
  $n-m$ parallel nodal lines and
  $2m$ meridian nodal lines. With a single experimental top view, the characterization of nonspherical modes can therefore struggle as soon as the bubble interface contains any mode such as
  $n \neq m$ and nodal parallels appear. The top-view bubble's silhouette
  $s(\phi,t)$ is the interface global maximum
  $r(\theta,\phi,t) \sin {\theta }$. Since there exists no analytic solution for this projection, the quantification of the amplitudes of any arbitrary asymmetric oscillation from a single top view becomes challenging. As a reminder, in Fauconnier et al. (Reference Fauconnier, Béra and Inserra2020), the modal amplitudes were qualitatively evaluated through a projection of the bubble top-view contour on the azimuthal component
  ${\rm e}^{{\rm i} m \phi }$ of spherical harmonics. We suggest here alternative methods for approaching the time-resolved amplitudes of nonspherical modes, associated to each of these experimental cases: zonal mode only, sectoral mode only, tesseral mode only and a sectoral–zonal modes combination. These four cases represent the majority of cases encountered experimentally in the present work. Because quantitative information is required to assess the modal interaction responsible for streaming, the modal analysis differs from Fauconnier et al. (Reference Fauconnier, Béra and Inserra2020) by the addition of a weighting factor applied to modal amplitudes and specific to each modal degree
  $n$ and order
  $m$. It especially allows us to compensate for the information loss in elevation due to the single visualization from a top view. Otherwise, both methods are based on the same azimuthal decomposition.
In Fauconnier et al. (Reference Fauconnier, Béra and Inserra2020), the spectral splitting of nonspherical modes of a tethered bubble was evidenced and resulted in a recurrent coexistence of sectoral and zonal modes around the resonant radius, while the appearance of tesseral modes was privileged elsewhere. This modal behaviour is recovered in the observation of microstreaming in § 4. Also, for the sake of clarity, it should be pointed out that, unlike many works on bubble-induced streaming reporting translation bubble oscillations, each bubble encountered in this work experiences only radial oscillations and shape modes. No solid-body translation bubble motion is reported here, although we will occasionally refer to it for comparison with the literature. When oscillating on a tesseral mode  $m=1$, for instance, the bubble contour exhibits a seemingly time-dependent centroid that may indicate the presence of a translation oscillation. Such a translation motion can be induced by the lateral symmetry-breaking induced by having the transducer on one side of the water tank, in addition to the tethering of the bubble on the surface, as already observed by Tho et al. (Reference Tho, Manasseh and Ooi2007). However, we believe that this oscillatory motion of the centroid, as experienced in this work, has its origin in the bias induced by the projection of the three-dimensional tesseral mode on a plane, as already discussed in the case of axisymmetric modes in Cleve et al. (Reference Cleve, Guédra, Mauger, Inserra and Blanc-Benon2019). Moreover, tesseral modes are triggered at pressure close to the instability threshold of shape modes, and their top-view appearance displays shades of light that closely resemble the one we could expect numerically. All these arguments make us confident in the fact that translation motions are not predominantly triggered in our experiments.
4. Experimental microstreaming patterns
For all the investigated bubbles animated only by a spherical oscillation, no mean flow has ever been observed in our experiments (not shown). We recall that this radial oscillation occurs at the driving frequency, while all the nonspherical oscillations triggered at the bubble interface occur at the subharmonic of the driving frequency. Therefore, no interaction between the radial and any nonspherical oscillations can lead to streaming. Accordingly, we consider that the fluid flows investigated in the following are never, even partially, generated by the radial oscillation, and thus the radial mode is systematically excluded from our interpretations.
4.1. The ‘zonal mode only’ case
Zonal modes are widely studied in the literature because of the ease of triggering them experimentally for the case of free bubbles, and because of their comfortable axisymmetric shape that facilitates their mathematical study (Spelman & Lauga Reference Spelman and Lauga2017; Doinikov et al. Reference Doinikov, Cleve, Regnault, Mauger and Inserra2019a,Reference Doinikov, Cleve, Regnault, Mauger and Inserrab; Inserra et al. Reference Inserra, Regnault, Cleve, Mauger and Doinikov2020a,Reference Inserra, Regnault, Cleve, Mauger and Doinikovb). The experimental visualization of their axisymmetric dynamics and associated streaming is usually performed from a side view in a plane containing the bubble symmetry axis  $z$. The orientation of a free bubble axisymmetric deformation is strongly influenced by the geometry of the system under study, the presence or not of a boundary, or even the existence of an asymmetric forcing on the bubble interface. In the absence of a wall, the assurance of the positioning of the symmetry axis within the imaging focal plane can be ensured experimentally by controlling the direction of impact of two coalescing bubbles (Cleve et al. Reference Cleve, Guédra, Mauger, Inserra and Blanc-Benon2019). In that configuration of a free axisymmetric bubble, the theoretical predictions of streaming are solved (Inserra et al. Reference Inserra, Regnault, Cleve, Mauger and Doinikov2020a), and an example for the case of a self-interacting zonal mode of degree
  $n=4$ is given in figure 4(d). This microstreaming pattern is characterized by
  $2n$ vortices that develop in
  $(r,\theta )$ and show no dependency in azimuth.

Figure 4. Modal analysis and associated microstreaming pattern of a microbubble of equilibrium radius 84.3  $\mathrm {\mu }{\rm m}$ oscillating on a zonal mode of degree
  $n=4$. The information is structured as follows. (a) Snapshot series of the top-view contour display the microbubble at different instants along a complete subharmonic period of duration
  $2/f_0$. The red contour is a numerical reconstruction issued from the processed modal amplitudes displayed in (b). (b) Left: spectrum of the excited modes
  $n=4$, ‘
 $R$’ standing for the amplitude of the radial (volumetric) oscillation
  $R(t)$ as defined in (3.1). Right: temporal evolution of the normalized (norm.) amplitudes of the predominant radial and zonal oscillations. (c) The associated microstreaming pattern. (d) Theoretical prediction of the side-view microstreaming induced by the self-interaction of a zonal axisymmetric mode of degree
  $n=4$, issued by Inserra et al. (Reference Inserra, Regnault, Cleve, Mauger and Doinikov2020a).
When the bubble is attached to a wall, the orientation of the nonspherical bubble is also governed by the system geometry and gives a preference for the zonal mode deformation to develop following the symmetry axis  $z$ directed along the normal to the wall surface. The
  $z$-axis selection for shape mode triggering is similar to the case of free (far from boundaries) bubbles submitted to propagating ultrasound waves that define the symmetry axis of nonspherical oscillations (Versluis Reference Versluis2010). In the present study, whatever the investigated asymmetric modes are, the triggering of surface modes always appears to be dictated by the normal to the wall. The contrary would result in a seemingly asymmetric bubble interface from a top-view contour, even in the case of zonal harmonics. Such an observation was not experienced for all the investigated bubbles. This is consistent with previous experimental works dedicated to the dynamics of bubble asymmetric oscillations (Fauconnier et al. Reference Fauconnier, Béra and Inserra2020). As a consequence, from a top-view perspective, the silhouette of a bubble undergoing an axisymmetric (zonal) mode oscillates with a misleading spherical appearance and the microstreaming looks exclusively radial, since there exists no azimuthal dependence and the axisymmetric vortices are imperceptible, as illustrated in figures 4(a) and 4(c).
In a general way, differentiating several microstreaming scenarios and characterizing their interaction strength require a good approach to the bubble modal content, especially when more than one nonspherical mode exists. In the framework of this study, the amplitude of zonal modes is determined as follows. As a reminder, a bubble animated by a zonal mode only ( $m=0< n$) presents an oscillating shape devoid of nodal meridian. As a result, the top-view bubble silhouette is circular at any time, and measuring its amplitude is not straightforward. In addition, the longitudinal angle
  $\theta$ that maximizes the bubble silhouette
  $s(\phi,t) = r(\theta,\phi,t)\,\sin {\theta }$ is not constant with time. In this study, we refer to this particular angle as
  $\theta _m$. When observing the numerical side view of a bubble oscillating on a zonal mode of degree
  $n=4$ (figure 5a),
  $\theta _m$ varies in elevation along a subharmonic period. Moreover, this oscillation in elevation also depends on the modal degree
  $n$, as shown in figure 5(d) for cases of zonal modes of degrees
  $n=3$ to
  $n=6$. It oscillates around the equilibrium value
  ${\rm \pi} /2$ with a signature that is specific to the modal degree and especially its parity. Given that, the amplitude
  $a_{n0}(t)$ of the zonal mode can be approximated by decomposing the top-view bubble silhouette
  $s(\phi,t)$ on the spherical harmonic
  $Y_{n0}$:
 \begin{equation} a_{n0}(t) = \frac{\gamma_{n0}}{2 {\rm \pi}} \int_{0}^{2 {\rm \pi}} s(\phi,t) \,{\rm d}\phi, \end{equation}
Figure 5. Side views of a numerical bubble of equilibrium radius  $R_0 = 90\,\mathrm {\mu }{\rm m}$ oscillating on a zonal mode
  $Y_{40}$ of amplitude
  $a_{40}=30\,\mathrm {\mu }{\rm m}$ (a), a sectoral mode
  $Y_{44}$ of amplitude
  $a_{44}=30\,\mathrm {\mu }{\rm m}$ (b) and the combination of both modes (c). The represented angle
  $\theta _m$ is the longitudinal angle for which the bubble contour projection in the
  $(x,y)$ plane is maximal. (d) The temporal evolution of
  $\theta _m$ is observed along a complete subharmonic period for a zonal mode of degrees
  $n=3$ to
  $n=6$, with zonal amplitude
  $a_{n0} = 0.3 R_0$.
where
 \begin{equation} \gamma_{n0} = \left(f_{n0} P^*_{n0} \sin\theta^*_m \,\frac{s^*(\phi,t)}{R_0 + \tilde{a}_{n0} f_{n0} P^*_{n0}}\right)^{{-}1}, \end{equation}
with  $\theta ^*_m = \max (\theta _m)$,
  $P^*_{n0}$ the local maximum of the associated Legendre polynomial
  $P_{n0}(\cos \theta )$ that is the nearest to
  $\theta _m$,
 \begin{equation} \tilde{a}_{n0} = \frac{1}{2 T} \int_{0}^{2 T} \frac{1}{2 {\rm \pi}} \int_{0}^{2 {\rm \pi}} s(\phi,t)\ {\rm e}^{-{\rm i} {\rm \pi}f_0 t}\,{\rm d}\phi\,{\rm d}t, \end{equation}
and  $s^*(\phi,t)$ the maximal value reached by the bubble silhouette
  $s(\phi,t)$. This allows us to approach the amplitude of the zonal mode. In the experimental case illustrated in figure 4, the amplitude of the zonal mode is of the same order of magnitude as the amplitude of the radial oscillation, as detailed by the spectrum of the excited modes of figure 4(b). It goes along with the temporal evolution of the predominant radial and zonal oscillations refolded over two acoustic periods and expressed in normalized amplitudes. A numerical bubble is implemented from the experimental data issued by this modal decomposition, and its top-view contour is drawn in dashed red lines on the experimental snapshots of figure 4(a). This experimental bubble corresponds to a modal configuration of zonal harmonic
  $n=4$ similar to the theoretical case displayed in figure 4(d). Even if we cannot observe the axisymmetric recirculation loops in our top-view configuration, we can discern in the experimental video sequence that particles get regularly blurry as they move around the bubble, which confirms that particles come out of and into the focal plane, and that there does exist a dependence in elevation, such as figure 4(d) demonstrates. Remember that the comparison of the experimental streaming pattern with the theoretical one (figure 4d) is only meant to clarify the axisymmetry of the streaming pattern as observed from a top view. At this stage of the investigation, the wall-induced alteration of the streaming pattern cannot be assessed as it would require a double view (simultaneous top and side perspectives, by using a prism mirror for instance) in order to observe the bubble contour and induced flow. Such an investigation is beyond the scope of this work aiming at characterizing for the first time the streaming patterns induced by bubble asymmetric modes, as described in the next subsection.
4.2. The ‘sectoral mode only’ case
Sectoral modes have as many azimuthal deformation lobes as the modal degree  $n$ to which they belong. Because the number of nodal parallels of any spherical harmonic equals
  $n-m$, sectoral modes (
 $n=m$) are devoid of nodal parallels and have their only longitudinal displacement anti-node at the equator, as illustrated in figure 5(b), where they exhibit an azimuthal shape that corresponds to a
  $\cos (m \phi )$. This azimuthal shape is easily recognizable from a top-view observation, as shown in figures 6(a) and 6(d) for bubbles oscillating on a sectoral mode
  $n=3$ and
  $n=4$, respectively. The bubble's silhouette
  $s(\phi, t)$ from a top view exactly equals the bubble interface
  $r(\theta, \phi, t)$ at
  $\theta = {{\rm \pi} }/{2}$ :
 \begin{equation} s(\phi, t) = r\left(\frac{\rm \pi}{2},\phi,t\right) = R_0 + a_{00}(t) + a_{nn}(t) f_{nn}\,P_{nn}(0)\,{\rm e}^{{\rm i} n \phi}. \end{equation}
Figure 6. Modal analysis and associated microstreaming pattern of a microbubble of equilibrium radius 73.8  $\mathrm {\mu }{\rm m}$ oscillating on a sectoral mode
  $n=3$ (a–c) and a microbubble of equilibrium radius 88
  $\mathrm {\mu }{\rm m}$ oscillating on a sectoral mode
  $n=4$ (d–f). The information is structured similarly to that in figure 4.
By decomposing the top-view bubble silhouette  $s(\phi,t)$ on the spherical harmonic
  $Y_{nn}$, the amplitude
  $a_{nn}(t)$ of the sectoral mode is calculated as
 \begin{equation} a_{nn}(t) = \frac{\gamma_{nn}}{2 {\rm \pi}} \int_{0}^{2 {\rm \pi}} s(\phi,t)\,{\rm e}^{-{\rm i} n \phi} \,{\rm d}\phi, \end{equation}
where  $\gamma _{nn} = ( f_{nn}\,P_{nn}(0) )^{-1}$. When performing this modal decomposition on an experimental bubble animated by a sectoral mode
  $n=3$, it results in what is depicted in figure 6(b). The sectoral oscillation is three times greater than the radial one and reaches an amplitude of 15
  $\mathrm {\mu }{\rm m}$. It is worth noting that in the case of odd-order modes, an important misleading non-zero amplitude associated with a mode of order
  $m=1$ usually appears. This has been numerically confirmed to be an artefact issued from our calculation method of the biased bubble two-dimensional projection. It is demonstrated in figure 7, following a three-step procedure of analysis. First, figure 7(a) presents the result of our bubble contour modal analysis, revealing a sectoral mode of amplitude 30
  $\mathrm {\mu }{\rm m}$, but also a presumed artefact (a tesseral mode
  $m=1$) of amplitude 15
  $\mathrm {\mu }{\rm m}$. In a second stage, the exact same algorithm employed for the experimental bubble analysis is applied to an equivalent numerical bubble implemented without the presumed artefact. It turns out that an artefact (still a tesseral mode
  $m=1$) of same amplitude reappears (figure 7b). In a third stage of confirmation, the light shades of the top-view bubble are observed: in the absence of a tesseral mode, it is uniform (figure 7b), while in the presence of a tesseral mode, asymmetric shades of light appear (figure 7c). This therefore demonstrates that this misleading non-zero amplitude was indeed an artefact issued from our calculation method of the biased bubble two-dimensional projection.

Figure 7. Demonstration of the appearance of an unwanted artefact in the modal analysis, here applied to a bubble of radius 107.7  $\mathrm {\mu }{\rm m}$, oscillating on a sectoral mode of degree
  $n=5$. The information is structured as follows.
  $(a1)$ Appearance of an
  $m=1$ modal component (presumed artefact) in the spectrum.
  $(a2)$ Normalized dynamics of the predominant oscillatory components, the sectoral and radial oscillations.
  $(a3)$ The experimental snapshots match the top-view contour (in dashed red lines) of a numerical bubble implemented without the artefact. (b) The modal analysis with the exact same algorithm of an equivalent numerical bubble implemented without the presumed artefact makes the
  $m=1$ modal component reappear, confirming its existence as an artefact only. (c) Numerical snapshots (top and side views) of a bubble implemented with the artefact.
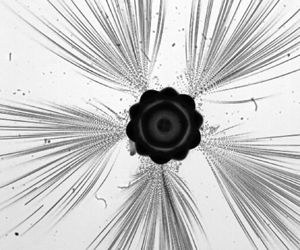
When a bubble is animated by a sectoral mode only, the single azimuthal streaming contribution that may exist in our configuration is due to the interaction of the sectoral mode with itself. It generates a streaming pattern that has a  $4n$-lobe flower shape, where lobes are assembled by pair. The same streaming signature is obtained in figure 6(f) in the case of a sectoral mode
  $n=4$. The pattern displays 16 lobes that are also arranged by pair. It should also be mentioned that in both cases, the rotational direction of the flow is such as to propel the particles away from the anti-nodes and to attract them back towards the nodes of displacement of the bubble interface. Each pair of recirculation loops is thus surrounded by areas of particles propelled with a positive radial velocity. This motion behaviour is outlined with red arrows in figure 6(c). Similar streaming signatures were also obtained for cases of sectoral modes of degrees
  $n=5$ and
  $n=6$.
According to our knowledge of microstreaming patterns induced by axisymmetric modes, these general observations can be interpreted as follows. The bubble interface motion of a sectoral mode from a top view is reminiscent of the interface motion of an axisymmetric mode of same degree visualized from a side view: they both present the same number of nodal lines, in elevation for axisymmetric modes, and in azimuth for sectoral modes. In conclusion, it could be argued that, just as the self-interaction of an axisymmetric mode of degree  $n$ presents
  $4n$ lobes of streaming around the bubble (Inserra et al. Reference Inserra, Regnault, Cleve, Mauger and Doinikov2020a), a bubble exclusively animated by a sectoral mode generates a streaming signature as a
  $4n$-lobe flower shape.
In elevation, sectoral modes are characterized by displacement nodes at the poles and displacement anti-nodes at the equator. From a side view, it resembles a dipole mode, an experimental case often reported in works investigating acoustic streaming, whether it concerns a free bubble (Davidson & Riley Reference Davidson and Riley1971; Longuet-Higgins Reference Longuet-Higgins1998; Doinikov et al. Reference Doinikov, Cleve, Regnault, Mauger and Inserra2019b) or a tethered one (Tho et al. Reference Tho, Manasseh and Ooi2007; Collis et al. Reference Collis, Manasseh, Liovic, Tho, Ooi, Petkovic-Duran and Zhu2010). The associated streaming pattern is characterized by the presence of four lobes of recirculation around the bubble. As qualitatively sketched in figure 8, such a streaming pattern could be expected in elevation around a bubble animated by a sectoral mode, though probably marked by a symmetry break in the lower hemisphere due to the presence of the wall. Above the bubble, the particles follow an anti-fountain-like motion. It seems reasonable to believe that the longitudinal components of streaming would be more influenced by the presence of the wall than the azimuthal ones, especially in the area located between the wall and the bubble equatorial plane. Also, in the case of a weakly mobile contact line, the literature reports the appearance of a vertical translation motion of the bubble, which may bring a new axisymmetric contribution to the global fluid flow (Marmottant & Hilgenfeldt Reference Marmottant and Hilgenfeldt2003). Lacking a comparable reference from the literature where bubble asymmetric modes inducing streaming are experienced in the absence of a wall, making a conclusion about the wall effect on the microstreaming is not straightforward. Anyway, important fluid flows are expected to develop in both azimuth and elevation dimensions, even though only the azimuthal part of the motion of particles located at the equator can be quantified from our experimental top view.

Figure 8. Artist's view of the microstreaming induced by a bubble oscillating on a sectoral mode of degree  $n=4$, represented from a three-dimensional (3-D) perspective (a) and from a top view (b). The colour map relates to the derivative of the fluid displacement with respect to the radial coordinate, from dark to light shades for streamlines having negative to positive radial velocities.
At last, because of a greater modal density of higher degree modes, the occurrence of sectoral modes only becomes scarcer when the bubble equilibrium radius and the associated modal degree increase. As a consequence, experimental occurrences of stable sectoral modes alone were less obvious for modal degrees higher than  $n=6$.
4.3. The ‘tesseral mode only’ case
Tesseral modes particularly appear preferentially for bubbles whose radii are far from the resonant radius, while zonal and sectoral modes give a preference to emerge close to the resonant radius, as displayed in figure 9 for modal degrees  $n=4$ and
  $n=5$. This gives a possibility for zonal and sectoral modes to exist simultaneously. In contrast, the coexistence of two different tesseral modes, or any other modes combination involving tesseral modes, was scarcely observed. Within the scope of this study, only the streaming patterns resulting from a self-interacting tesseral mode are analysed. The calculation of the modal amplitude of a tesseral mode
  $Y_{nm}$ is given by

Figure 9. Repartition of the experimental occurrences of nonspherical modes for bubbles whose equilibrium radius  $R_0$ is located around the resonant radius associated with the modal degrees
  $n=4$ (a) and
  $n=5$ (b), given by the red dashed vertical lines.
 \begin{equation} a_{nm}(t) = \frac{\gamma_{nm}}{2 {\rm \pi}} \int_{0}^{2 {\rm \pi}} s(\phi,t)\,{\rm e}^{-{\rm i} m \phi} \,{\rm d}\phi, \end{equation}
where
 \begin{equation} \gamma_{nm} = \left(f_{nm} P^*_{nm} \sin\theta^*_m \, \frac{s^*(\phi,t)}{R_0 + \tilde{a}_{nm} f_{nm} P^*_{nm}}\right)^{{-}1}. \end{equation}
 Tesseral modes also differ from zonal and sectoral modes by the presence in their modal deformations of nodal lines in both elevation and azimuth. For instance, each tesseral mode of order  $m=1$ (
 $m< n$) has two nodal meridians, regardless of the modal degree
  $n$ to which it belongs, but a number of
  $n-m$ nodal parallels that differ with its degree. In a microscope top-view configuration, the observation of the bubble and the induced particles motion is performed in a horizontal focal plane of finite thickness. From that perspective, at a given angle
  $\theta$, the bubble contour of any tesseral mode
  $1$ possesses two nodes and two anti-nodes of displacement. As a direct consequence all the self-interacting tesseral modes
  $m=1$ ever experienced in this work for
  $n=3$ to
  $n=6$ have always developed, from a top view, a microstreaming characterized by a
  $4$-lobe shape, as illustrated in figure 10(c). This is in line with the previous logic related to sectoral modes, where the number of lobes equals two times the number of nodal meridians. The particles are thus animated by a flow motion going away from the displacement anti-nodes and towards the displacement nodes of the bubble interface. An analogy can be drawn between such a tesseral mode
  $m=1$ observed in a horizontal focal plane and a solid-body translation oscillation without shape deformation. Such bubble translation motion is widely investigated in the literature and generally associated to quadrupole shape patterns (Longuet-Higgins Reference Longuet-Higgins1998; Collis et al. Reference Collis, Manasseh, Liovic, Tho, Ooi, Petkovic-Duran and Zhu2010; Doinikov et al. Reference Doinikov, Cleve, Regnault, Mauger and Inserra2019b). The resemblance of the induced microstreaming patterns is obvious. It should be noted that the high dispersion in the bubble dynamics in figure 10(b) results from the biased bubble projection in the
  $(x,y)$ plane. In particular, tesseral modes
  $m=1$ are susceptible to having their amplitude distorted by our analysis method, given that their top-view silhouette, barely deviating from sphericity, does not efficiently transcribe the modal deformation mostly developing in elevation. As a consequence, the smallness of this nonspherical oscillation (as given by the modal spectrum in figure 10b) results in an amplitude of the
  $m=1$ modal component that is overwhelmed by noise.

Figure 10. Modal analysis of the dynamics and associated microstreaming pattern of a microbubble of equilibrium radius 86.4  $\mathrm {\mu }{\rm m}$ oscillating on a tesseral mode of order
  $m=1$ (a–c) and a microbubble of equilibrium radius 102.6
  $\mathrm {\mu }{\rm m}$ oscillating on a tesseral mode of order
  $m=2$ (d–f). Both are generating a
  $4m$-lobe flower-shaped pattern. The information is structured similarly to that in figure 4.
Similarly, tesseral modes of order  $m=2$ possess four nodal meridians. It is expected that such a bubble oscillation would also generate a microstreaming characterized by
  $4m$ lobes, and this is exactly what is shown in figure 10(f), where eight lobes are clearly visible. Similarly to the tesseral mode
  $m=1$, the
  $4m$ recirculation loops are assembled two by two, each pair being located between two displacement nodes of the bubble interface and surrounded by region of dense streamlines associated with a fluid motion going towards the bubble interface. The bubble nonspherical mode here represented belongs to the modal degree
  $n=4$. We believe that as the presence of the wall facilitates the triggering of some asymmetric modes, it might in the same way inhibit others. This might be the reason why we have not experienced a self-interacting tesseral mode
  $m=2$ for all modal degrees
  $n$ that were investigated in this work.
As illustrated in figure 11, the microstreaming induced by tesseral modes of orders  $m=3$ and
  $m=4$ exhibits a similar signature:
  $4m$ lobes assembled by pair, with a great density of particles in the equatorial plane coming towards the bubble interface and more particularly towards the displacement nodes of the bubble interface. In addition, it appears that the recirculation loops become smaller as the modal order
  $m$ increases.

Figure 11. Modal analysis of the dynamics and associated microstreaming pattern of a microbubble of equilibrium radius 101.5  $\mathrm {\mu }{\rm m}$ oscillating on a tesseral mode of order
  $m=3$ (a–c) and a microbubble of equilibrium radius 118.8
  $\mathrm {\mu }{\rm m}$ oscillating on a tesseral mode of order
  $m=4$ (d–f). Both are generating a
  $4m$-lobe flower-shaped pattern. The information is structured similarly to that in figure 4.
4.4. The ‘sectoral and zonal modes combination’ case
By investigating the shape modes dynamics of a wall-attached bubble, Fauconnier et al. (Reference Fauconnier, Béra and Inserra2020) have evidenced the recurrent coexistence of sectoral and zonal modes around the resonant radius. The emergence of nonspherical bubble modes was investigated along an increasing pressure ramp, and the triggering of zonal and sectoral modes oscillating simultaneously was highlighted. In the present study, bubbles are driven at constant acoustic pressure, but the coexistence of zonal and sectoral modes is still frequently observed. As a reminder, microstreaming results from the interaction between two modes oscillating at the same frequency (Doinikov et al. Reference Doinikov, Cleve, Regnault, Mauger and Inserra2019a), as well as the self-interaction of a shape mode (Inserra et al. Reference Inserra, Regnault, Cleve, Mauger and Doinikov2020a). The microstreaming induced by a bubble oscillating predominantly on two parametrically excited shape modes (here the zonal and sectoral ones), in addition to the spherical oscillation (oscillating at the driving frequency), will lead to the second-order velocity field
 \begin{equation} \boldsymbol{v^{(2)}} \simeq \boldsymbol{v^{(2)}_{z-s}} + \boldsymbol{v^{(2)}_{z-z}} + \boldsymbol{v^{(2)}_{s-s}}, \end{equation}
where  $\boldsymbol {v^{(2)}_{z-s}}$ refers to the second-order velocity induced by the interaction of zonal and sectoral modes, and
  $\boldsymbol {v^{(2)}_{z-z}}$ (respectively
  $\boldsymbol {v^{(2)}_{s-s}}$) refers to the second-order velocity induced by the self-interacting zonal mode (respectively sectoral mode). The interaction between two modes would be the largest when they are in phase quadrature (Marmottant & Hilgenfeldt Reference Marmottant and Hilgenfeldt2003). As a result, depending on the phase and amplitude relations between zonal and sectoral modes, one or another contribution is likely to prevail on others. Capturing and measuring with accuracy the modal variables then becomes critical. When sectoral and zonal modes coexist, the calculation of the amplitude
  $a_{n0}(t)$ of the zonal mode is performed as in § 4.1, but the calculation of the amplitude
  $a_{nn}(t)$ of the sectoral mode requires some adjustments. The reason for that is the shift of the longitudinal position of the maximal displacement of the sectoral mode, as it does in the fourth and fifth schematics of figure 5(c). The amplitude
  $a_{nn}(t)$ is then normalized no longer by the associated Legendre polynomial at
  $\theta = {{\rm \pi} }/{2}$, but by the general expression
 \begin{equation} a_{nn}(t) = \frac{\gamma_{nn}}{2 {\rm \pi}} \int_{0}^{2 {\rm \pi}} s(\phi,t)\,{\rm e}^{-{\rm i} n \phi} \,{\rm d}\phi, \end{equation}
where
 \begin{equation} \gamma_{nn} = \left(f_{n0} P^*_{n0} \sin\theta^*_m \, \frac{s^*(\phi,t)}{R_0 + \tilde{a}_{nn} f_{nn} P^*_{nn}}\right)^{{-}1}. \end{equation}
 Figure 12 demonstrates the ability of our method for approaching the amplitudes of zonal and sectoral modes. The top-view observation of an experimental microbubble's silhouette of equilibrium radius 88.1  $\mathrm {\mu }{\rm m}$ allows not only the detection of the presence of radial, zonal and sectoral oscillations, but also an accurate quantification of their respective amplitude and relation of phase. In order to validate our method, a similar modal analysis has been performed on a numerical bubble's silhouette implemented from the obtained experimental parameters (
 $a_{00}$,
  $a_{40}$,
  $a_{44}$ and the relative phase shifts). Figure 12 shows that the modal amplitudes are accurately recovered (maximal error of 2
  $\mathrm {\mu }{\rm m}$), as it is the case for the phase shift.

Figure 12. Example of the result obtained with our modal analysis method, here applied to a bubble of radius 88.1  $\mathrm {\mu }{\rm m}$ oscillating simultaneously on a sectoral and a zonal mode of degree
  $n=4$. The information is structured as follows. (a) Snapshot series of the top-view contour displays the microbubble at different instants along a complete subharmonic period of duration
  $2/f_0$. The red contour is a numerical reconstruction issued from the processed modal amplitudes displayed in (b). (b) Snapshots of a numerical bubble, implemented with the parameters obtained from the modal analysis of the experimental bubble. (c) Spectrum of the excited modes
  $n=4$ of the experimental bubble (solid lines) and the numerical bubble (dashed lines), as a function of the modal order
  $m$, ‘
 $R$’ standing for the radial oscillation
  $(m=n=0)$. Temporal evolution of the normalized amplitudes of the predominant radial, zonal and sectoral oscillations refolded over two acoustic periods for the experimental bubble (d) and the numerical bubble (e).
Above the instability pressure threshold of a given degree  $n$, the occurrence of sectoral modes alone is scarcer than the simultaneous occurrence of coexisting sectoral and zonal modes, as demonstrated in figure 9. Fauconnier et al. (Reference Fauconnier, Béra and Inserra2020) demonstrated that sectoral and zonal modes of even degrees
  $n=4$ and
  $n=6$ have a preference to oscillate essentially in-phase, unlike modes of odd degrees
  $n=3$ and
  $n=5$, for which the phase shift is greater and may vary in a broader range. This behaviour is summed up in figure 13 for the whole set of experimental data employed in this work, each dot being a different microbubble simultaneously animated by a zonal and a sectoral mode. While the phase shift in the case of odd-degree modes is contained in the broad range [0.1
 ${\rm \pi}$ 0.5
 ${\rm \pi}$], it is recurrently constrained below 0.1
 ${\rm \pi}$ in the case of even-degree modes. Remember that the magnitude of the microstreaming interaction is governed by the phase shift between the two interacting modes (Longuet-Higgins Reference Longuet-Higgins1998; Marmottant & Hilgenfeldt Reference Marmottant and Hilgenfeldt2003). Following the work of Longuet-Higgins (Reference Longuet-Higgins1998), when a radial oscillation (of amplitude
  $\epsilon _0$) interacts with a translation oscillation (of amplitude
  $\epsilon _1$), the magnitude of the resulting flow is given by the so-called dipole strength
  $d_2$ =
  $\epsilon _0 \epsilon _1 R_0^2 \sin \Delta \varPhi$, where
  $\Delta \varPhi$ is the phase shift between the radial and translation oscillations. Accordingly, we can therefore expect the interaction of zonal and sectoral modes of even degrees to be weaker in comparison to that induced by odd degrees.

Figure 13. Distribution of the phase shift  $\Delta \varPhi$ between zonal and sectoral modes as a function of the bubble's equilibrium radius
  $R_0$, for degrees
  $n=3$ to
  $n=6$.
When a bubble oscillates simultaneously on a zonal and a sectoral mode of degree  $n=3$, two different scenarios of microstreaming stand out, as illustrated in figure 14. Both scenarios clearly differentiate themselves in the ability of the streaming flow to present or not recirculation loops in the visualized equatorial plane. In figure 14(c), a
  $2n$-lobe flower shape characterized by a fluid flow moving away from a displacement anti-node of the bubble interface and coming back towards another is observed. Actually, it is very likely that the particles are actually heading towards zonal-related nodes of displacement that are hidden at a different position in elevation. The progression from a sharp to a blurry appearance of particles throughout their looping circulation reinforces this hypothesis. This
  $2n$-lobe flower-shaped pattern contrasts with the one shown in figure 14(f), where particles are propelled from the bubble interface with an outward one-way motion. For degree
  $n=3$, this pattern resembles a star with three branches, and we refer to it as an
  $n$-pointed star shape. These two patterns result from a bubble exhibiting both a zonal and a sectoral oscillation, as shown in the modal analysis displayed in figures 14(b) and 14(e). Clearly, both the amplitudes of the nonspherical modes and their phase shifts differ, and so do the relative strengths of the interactions underlying the two presented patterns, as indicated in (4.8). For the bubble exhibiting a
  $2n$-lobe shape in figure 14(c), the pattern probably results from the threefold interaction described in (4.8), without predominance of one on another. However, due to the greater phase shift between zonal and sectoral modes in the case of the
  $n$-pointed star shape, the interaction between these two modes on the resulting pattern is probably predominant. It is worth noticing that this pattern looks like a zonal-induced microstreaming pattern (figure 4c, for instance), but here regularly interrupted with a spatial period
  $2 {\rm \pi}/ n$.

Figure 14. Modal analysis of the dynamics and associated microstreaming pattern of a microbubble of equilibrium radius 80.2  $\mathrm {\mu }{\rm m}$ oscillating on a sectoral mode and a zonal mode of degree
  $n=3$, generating a
  $2n$-lobe flower-shaped streaming pattern (a–c) and of a microbubble of equilibrium radius 75.4
  $\mathrm {\mu }{\rm m}$ oscillating on a sectoral mode and a zonal mode of degree
  $n=3$, generating an
  $n$-pointed star-shaped streaming pattern (d–f). The information is structured similarly to that in figure 4.
In order to explain how these two scenarios differ, figure 15(a) gives an overview of the experimental data where there is coexistence between a zonal mode and a sectoral mode of degree  $n=3$. The preferential occurrence of flower-shaped or star-shaped patterns is investigated as a function of the amplitudes of sectoral mode
  $a_{33}$, zonal mode
  $a_{30}$ and their phase shift
  $\Delta \varPhi$. At first glance, a preferential generation of flower shapes occurs when the sectoral amplitude is weak, regardless of the zonal amplitude. On the other hand, when the sectoral mode amplitudes become stronger, star-shaped patterns become predominant. For these patterns, the tracking particles are propelled with such a velocity that they are never steered back to the bubble interface and thus do not experience any recirculation loops. This observation is asserted by figure 15(b), where the propelling velocity of the particles measured at a distance
  $2R_0$ from the bubble centre is plotted as a function of the tripole strength
  $d_3 = a_{30} a_{33} R_0^2 \sin \Delta \varPhi$. This expression was inspired from the dipole strength as defined by Longuet-Higgins (Reference Longuet-Higgins1998) in the case of a translation bubble motion. Clearly, the generation of star-shaped patterns is associated with the highest magnitudes of tripole strength, while flower-shaped patterns are globally restricted to the lowest magnitudes. For the sake of transparency, it is worth mentioning that, due to some inadequate sets of data (lack of particles or slightly out of focus) for quantitatively measuring the velocity field, the number of experimental occurrences in figure 15(b) is reduced compared to the number contained in figure 15(a).

Figure 15. The preferential appearance of flower-shaped ( $\bullet$) or star-shaped (
 $\star$) patterns induced by a combination of sectoral and zonal modes of degree
  $n=3$ is investigated as a function of their phase shift
  $\Delta \varPhi$ and amplitudes
  $a_{33}$ and
  $a_{30}$ (a) as well as a function of their tripole strength
  $= a_{30} a_{33} R_0^2 \sin \Delta \varPhi$ correlated by the maximal velocity of propelled particles
  $Vr_{max}$ measured at a distance
  $r = 2R_0$ from the bubble barycentre, for which a linear regression is drawn in grey (b). Two particular red open markers represent the two selected cases of figure 14 and their positions in this tripole strength map. In each panel, a grey area delimits the region of appearance of star shapes.
Finally, based on the observation of figure 15(a), a correlation between phase shift and modal amplitudes, which highlights the modal competition of sectoral and zonal modes of degree  $n=3$ mentioned before, also deserves to be noted. As a matter of fact, the modal coexistence does not happen unconditionally – quite the contrary. The progressive rise in power of the sectoral mode conditions the zonal mode, provided that a phase shift operates and that the zonal mode suffers a reduction in its amplitude.
When  $n=5$, similar results come out. The same
  $2n$-lobe and
  $n$-pointed star-shaped patterns are observed predominantly. For the results presented here, identical magnitudes of the zonal oscillations are obtained for both cases. A stronger sectoral amplitude is, however, associated with the
  $n$-pointed star shape (figure 16f) in comparison to the lobe-type pattern (figure 16c). The global trend still goes in the direction of a preferential generation of star-shaped patterns when the sectoral mode dominates, regardless of the zonal amplitude. On the other hand, at weaker zonal and sectoral amplitudes, star-shaped patterns can arise only when the phase shift is sufficiently large. Similarly to the odd degree
  $n=3$, the occurrence of
  $n$-pointed star shapes and the associated maximal velocity of propelled particles is related to the amplitude of the quinquepole strength (not shown).

Figure 16. Modal analysis of the dynamics and associated microstreaming pattern of a microbubble of equilibrium radius 112.1  $\mathrm {\mu }{\rm m}$ oscillating on a sectoral mode and a zonal mode of degree
  $n=5$, generating a
  $2n$-lobe flower-shaped streaming pattern (a–c) and of a microbubble of equilibrium radius 110.2
  $\mathrm {\mu }{\rm m}$ oscillating on a sectoral mode and a zonal mode of degree
  $n=5$, generating an
  $n$-pointed star-shaped streaming pattern (d–f). The information is structured similarly to that in figure 4.
Sectoral and zonal modes of even degree  $n=4$ show an ease to coexist. They emerge and exist together without inhibiting each other (Fauconnier et al. Reference Fauconnier, Béra and Inserra2020). As a result, their phase shift is not as variable as it was for odd-degree modes (figure 13), and the microstreaming patterns are then less different and exclusively limited to
  $2n$-lobe flower shapes (figure 17). Despite this, we will see in figure 18 that we have yet to experience a great variability in the magnitudes of fluid velocity.

Figure 17. Modal analysis of the dynamics and associated microstreaming pattern of a microbubble of equilibrium radius 87.4  $\mathrm {\mu }{\rm m}$ oscillating on a sectoral and a zonal mode of degree
  $n=4$ generating a
  $2n$-lobe flower-shaped streaming pattern (a–c) and of a microbubble of equilibrium radius 87.7
  $\mathrm {\mu }{\rm m}$ oscillating on a sectoral and a zonal mode of degree
  $n=4$ generating a
  $2n$-lobe flower-shaped streaming pattern accompanied by the early stages of a star shape (d–f). The information is structured similarly to that in figure 4.

Figure 18. The preferential appearance of flower shapes ( $\bullet$) or flower shapes with early stages of star shapes (
 $\star$) induced by a combination of sectoral and zonal modes of degree
  $n=4$ is investigated as a function of their quadrupole strength
  $= a_{40} a_{44} R_0^2 \sin \Delta \varPhi$ correlated by the maximal velocity of propelled particles
  $Vr_{max}$ measured at a distance
  $r=2R_0$ from the bubble barycentre, for which a linear regression is drawn in grey. Two particular red open markers represent the two cases selected in figure 17 and their positions in this quadrupole strength map.
The two different scenarios illustrated in figure 17 are related to closely similar asymmetric modal amplitudes and phase shift between zonal and sectoral oscillations, and yet they display the two most opposite microstreaming patterns that we experienced for the case of degree  $n=4$. Since the interaction strength of even-degree zonal and sectoral modes is generally less than that of largely phase-shifted odd-degree modes, it results in flower-shaped patterns with early stages of star shapes instead of fully developed star-shaped patterns. When measuring the velocity of particles propelled by the bubble anti-nodes at a distance
  $2R_0$, clear differentiation occurs between the lobe-only patterns and the seemingly 4-pointed star shapes (figure 18). This differentiation occurs along the amplitude of the quadrupole strength
  $d_4= a_{40} a_{44} R_0^2 \sin \Delta \varPhi$. Again, confined flower-shaped patterns are clearly restricted at the lowest magnitudes of quadrupole strength (figure 17c). On the other hand, higher magnitudes of quadrupole strength seem to force the fluid flow to adopt more of an outward one-way motion (figure 17f).
Concerning sectoral and zonal modes of degree  $n=6$, the coexistence is also facilitated. Figure 13 evidenced a phase shift between modes always confined below
  $0.05 {\rm \pi}$. This translates into even less diversified streaming signatures than in the case of degree
  $n=4$. Not helped by a higher modal density, only a few rare cases of coexistence between zonal and sectoral modes absent from any other tesseral mode were experienced, an example of which is given in figure 19. This streaming pattern with 12 lobes summarizes all cases of interacting sectoral and zonal modes of degree
  $n=6$.

Figure 19. Modal analysis of the dynamics and associated microstreaming pattern of a microbubble of equilibrium radius 135.8  $\mathrm {\mu }{\rm m}$ oscillating on a sectoral mode and a zonal mode of degree
  $n=6$, generating a
  $2n$-lobe flower-shaped pattern. The information is structured similarly to that in figure 4.
Finally, we performed a particle tracking velocimetry analysis on every data set in which a zonal and a sectoral mode were coexisting and interacting, from  $n=3$ to
  $n=6$. This investigation arises from the desire to find the best ways of generating intense flows and reaching high streaming velocities. The result is mapped in figure 20, in which the flowing velocity of propelled particles is displayed as a function of their associated dimensionless
  $n$-pole strength
  $d_n = a_{nn} a_{n0} R_0^{-2} \sin \Delta \varPhi$. This overview demonstrates that interactions of zonal and sectoral modes of odd degree (
 $n=3$ and
  $n=5$) are more strongly excited than those of even degree (
 $n=4$ and
  $n=6$). As a consequence, important streaming velocities are facilitated for odd-degree modes, especially when the degree
  $n$ is small (
 $n=3$).

Figure 20. Overview of the streaming velocity of propelled particles, measured at a distance  $2R_0$ from the bubble barycentre, as a function of the dimensionless
  $n$-pole strength of interaction between zonal and sectoral modes, for modal degrees
  $n=3$ to
  $n=6$.
Basically, it appeared that the streaming resulting from the interaction of zonal and sectoral modes has a wider area of action and higher flow velocities than the streaming resulting from each mode taken separately, zonal only or sectoral only. This must be moderated since it is highly dependent on the modal degree and the strength of interaction of both modes, as demonstrated in figure 20. Besides, when regarding tesseral modes (§ 4.3), the area of action is also very dependent on the modal number  $m$, high values being associated with more confined recirculation loops, and conversely.
To be clear, if an objective is to achieve high intensity of streaming, then one may want to generate low-number modes: low-order tesseral modes or low-odd-degree combinations of sectoral and zonal modes. These configurations of bubble asymmetric modes induce the formation of high streaming velocities with privileged directivity, what could not be achieved by axisymmetric modes. We expect that asymmetric bubble oscillations may be beneficial to applications where enhanced intensity and directivity of microstreaming are required, such as ultrasound-mediated targeted drug delivery, for instance.
To sum up the results on streaming patterns, figure 21 gives an overview of the complete variety and classification of the microstreaming patterns induced by nonspherical modes of an ultrasound-driven wall-attached bubble, as they were experienced in this work. The four experimental cases are summarized here: self-interacting zonal, self-interacting sectoral, self-interacting tesseral and zonal–sectoral interacting combination. Although a self-interacting sectoral mode and a self-interacting tesseral mode of a same order  $m$ generate similar top-view streaming signatures and are represented in figure 21 with similar
  $4m$-lobe symbols, they can be differentiated by considering the sign of the fluid velocity at the equator, as represented with red arrows in figure 6(c) (for sectoral modes) and in figure 10(f) (for tesseral modes). In the case of sectoral modes, recirculation loops are assembled by pair with an inward motion, while in the case of tesseral modes, recirculation loops are assembled by pair with an outward motion. This feature is recurrent regardless of the modal degree to which each sectoral or tesseral mode is related. In addition, we observed that sectoral modes of a wall-attached bubble give rise to an anti-fountain-like behaviour of the surrounding fluid above the bubble, characterized with a negative radial velocity along the normal to the top wall surface (figure 8), which may differ in the case of tesseral modes.

Figure 21. Schematics of the complete variety of microstreaming patterns as we experienced them, from a top view. The given values of  $n$ are the degrees for which we experienced the microstreaming patterns as described.
5. Conclusion
The formation of specific microstreaming patterns induced by a wall-attached microbubble undergoing asymmetric shape modes is analysed with respect to the resolved dynamics. In our experimental set-up, each main class of spherical harmonics  $Y_{nm}(\theta, \phi )$ experiences zonal (
 $m = 0 < n$), sectoral (
 $n = m > 0$) and tesseral (
 $0 < m < n$) modes. The microstreaming induced by a bubble animated by a sectoral mode reveals a streaming signature characterized by a
  $4n$-lobe flower shape. Very similarly, self-interacting tesseral modes give rise to
  $4m$-lobe flower-shaped patterns. On the other hand, in a scenario staging the coexistence of sectoral and zonal modes, the microstreaming induced by the interaction of these two modes presents two kinds of patterns:
  $2n$-lobe flower shapes and
  $n$-pointed star shapes. The preferential emergence of one or another pattern of streaming is discussed on the basis of the modal amplitudes and phase shift between both shape modes. For modes of odd degrees
  $n=3$ and
  $n=5$, an important modal competition induces greater phase shifts and thus stronger modal interaction and more diverse shapes of streaming patterns than in the case of even degrees
  $n=4$ and
  $n=6$, where the modal coexistence is more facilitated. Globally, the amplitude of the sectoral mode, encouraged with a decisive phase shift, appears to have an important responsibility in the generation of a microstreaming signature characterized by a flower-shaped (weak
  $a_{33}$) or star-shaped (strong
  $a_{33}$) pattern around the bubble. Despite zonal and sectoral modes of even degree behaving less competitively and presenting weaker phase shift and thus modal interaction, the level of flow spreading of the always recurrent
  $2n$-lobe flower shape seems to be governed by the streaming strength and its capacity to reach high magnitudes of velocity and to propel particles located in the equatorial plane with an outward one-way motion. Both scenarios, the flower-shaped pattern and the star-shaped pattern, seem to have different areas of high-velocity activity, confined near the bubble or away from the bubble in front of the anti-nodes of the bubble interface displacement, respectively. Controlling the bubble's size and dynamics could make it possible to promote the generation of one or another sort of streaming pattern, hence the regulated generation of shear stresses on a nearby wall.
Table 2. Summary of the supplementary material. Each movie contains 400 images visualized at a frame rate of  $20\,{\rm images}\,{\rm s}^{-1}$.

Supplementary movies
Supplementary movies are summarized in table 2 and available online at https://doi.org/10.1017/jfm.2021.1089.
Acknowledgements
The authors would like to thank Professor A. Maksimov for his kind concern and helpful discussion.
Funding
This work was supported by the LabEx CeLyA of the University of Lyon (Lyon Acoustics Center, ANR-10-LABX-0060 / ANR-11-IDEX-0007).
Declaration of interests
The authors report no conflict of interest.


