


1 Introduction
In wall-bounded shear flows at low Reynolds number, the generation of turbulent skin friction is dominated by an interactive process in the near-wall region between two coherent structures: streaks and quasi-streamwise vortices (Kline et al.
Reference Kline, Reynolds, Schraub and Runstadler1967; Cantwell Reference Cantwell1981; Kim, Moin & Moser Reference Kim, Moin and Moser1987; Robinson Reference Robinson1991). This process has been found to be quasi-cyclic and is known as the ‘regeneration mechanism’ (Hamilton, Kim & Waleffe Reference Hamilton, Kim and Waleffe1995) or the ‘self-sustaining process’ (Waleffe Reference Waleffe1997) of near-wall coherent structures. In simple terms, the process proceeds as follows: near-wall quasi-streamwise vortices result in the formation of pairs of low- and high-speed streaks in the buffer layer via the lift-up effect; these streaks become unstable due to a normal-mode instability and/or transient growth (Hamilton et al.
Reference Hamilton, Kim and Waleffe1995; Schoppa & Hussain Reference Schoppa and Hussain2002; Cassinelli, de Giovanetti & Hwang Reference Cassinelli, de Giovanetti and Hwang2017); the quasi-streamwise vortices are then regenerated via nonlinear mechanisms, completing the cycle. By conducting numerical experiments in domains just larger than the spanwise spacing of the near-wall streaks involved in this self-sustaining process (Jiménez & Moin Reference Jiménez and Moin1991; Hamilton et al.
Reference Hamilton, Kim and Waleffe1995), it is possible to sustain and accurately resolve the near-wall coherent structures but not those further from the wall. Notably, Jiménez & Moin (Reference Jiménez and Moin1991) demonstrated that there is in fact a ‘minimal flow unit’, which fixes a streamwise and spanwise length constraint on the computational domain below which turbulence cannot be sustained:
 $\unicode[STIX]{x1D706}_{x}^{+}\simeq 250{-}350$
and
$\unicode[STIX]{x1D706}_{x}^{+}\simeq 250{-}350$
and
 $\unicode[STIX]{x1D706}_{z}^{+}\simeq 100$
, where
$\unicode[STIX]{x1D706}_{z}^{+}\simeq 100$
, where
 $\unicode[STIX]{x1D706}_{x}$
and
$\unicode[STIX]{x1D706}_{x}$
and
 $\unicode[STIX]{x1D706}_{z}$
are the streamwise and spanwise wavelengths of the minimal flow unit, respectively, and the superscript
$\unicode[STIX]{x1D706}_{z}$
are the streamwise and spanwise wavelengths of the minimal flow unit, respectively, and the superscript
 $^{+}$
denotes normalisation in viscous inner units. This finding demonstrates that the self-sustaining process near the wall occurs independently of the turbulent motions in the logarithmic and outer regions of the flow, and also confirms its large contribution to skin-friction drag, at least in low Reynolds number flows. (See also de Giovanetti, Hwang & Choi (Reference de Giovanetti, Hwang and Choi2016) for this issue at high Reynolds numbers.)
$^{+}$
denotes normalisation in viscous inner units. This finding demonstrates that the self-sustaining process near the wall occurs independently of the turbulent motions in the logarithmic and outer regions of the flow, and also confirms its large contribution to skin-friction drag, at least in low Reynolds number flows. (See also de Giovanetti, Hwang & Choi (Reference de Giovanetti, Hwang and Choi2016) for this issue at high Reynolds numbers.)
With this in mind, it was thought that a logical way to reduce the contribution of the near-wall self-sustaining process to turbulent skin friction generation would be to manipulate or eradicate the quasi-streamwise vortices, which are responsible for bringing high streamwise momentum fluid towards the wall. One such control method, known as opposition control, attempts to do this by actuating blowing and suction at the wall to counteract wall-normal velocity fluctuations in the near-wall region. This technique has been extensively tested by Choi, Moin & Kim (Reference Choi, Moin and Kim1994): its effects on turbulence statistics and structure are well understood, and it has been shown to result in drag reduction of up to 25 % at relatively low Reynolds numbers, based on the pressure gradient required to drive a constant mass flow rate. The linear analysis by Lim & Kim (Reference Lim and Kim2004) has further shown that opposition control significantly attenuates the transient growth of the streaks via the lift-up effect, which has since been confirmed by resolvent analysis (Luhar, Sharma & McKeon Reference Luhar, Sharma and Mckeon2014).
More recently, a great deal of work has been conducted on the analysis of transitional and turbulent flows from a dynamical systems perspective. Most of the canonical laminar flows are linearly stable around the onset of transition. For example, the laminar profile of pipe flow is linearly stable over all Reynolds numbers (e.g. Lessen, Sadler & Liu Reference Lessen, Sadler and Liu1968), as is that of plane Couette flow (Romanov Reference Romanov1973). In plane Poiseuille flow, the laminar profile is linearly stable up to a Reynolds number
 $Re\approx 5772$
, based on the half-channel height and laminar centreline velocity (Orszag Reference Orszag1971). However, this is considerably higher than the typical transitional Reynolds number. By considering turbulence as a dynamical system in a high-dimensional phase space (Eckhardt et al.
Reference Eckhardt, Schneider, Hof and Westerweel2007), a given turbulent flow will follow a trajectory prescribed by its initial conditions. In cases where the laminar profile is linearly stable, the laminar state forms a small local basin of attraction in phase space. However, it has been observed that, in certain cases, turbulence is in fact transient; the flow exhibits chaotic behaviour that may persist for some time, but can suddenly decay to the laminar profile. This has led to the idea that, in phase space, the turbulent state is a ‘chaotic saddle’ (Skufca, Yorke & Eckhardt Reference Skufca, Yorke and Eckhardt2006). In other words, it is an attractor in one sense, but has at least one unstable degree of freedom through which the flow can decay to the laminar solution. To add to this phase-space description of turbulent flows, it has been found that the chaotic saddle and laminar solution are separated in phase space by the ‘edge’ of turbulence (see Skufca et al.
Reference Skufca, Yorke and Eckhardt2006; Schneider, Eckhardt & Yorke Reference Schneider, Eckhardt and Yorke2007; Schneider et al.
Reference Schneider, Gibson, Lagha, de Lillo and Eckhardt2008).
$Re\approx 5772$
, based on the half-channel height and laminar centreline velocity (Orszag Reference Orszag1971). However, this is considerably higher than the typical transitional Reynolds number. By considering turbulence as a dynamical system in a high-dimensional phase space (Eckhardt et al.
Reference Eckhardt, Schneider, Hof and Westerweel2007), a given turbulent flow will follow a trajectory prescribed by its initial conditions. In cases where the laminar profile is linearly stable, the laminar state forms a small local basin of attraction in phase space. However, it has been observed that, in certain cases, turbulence is in fact transient; the flow exhibits chaotic behaviour that may persist for some time, but can suddenly decay to the laminar profile. This has led to the idea that, in phase space, the turbulent state is a ‘chaotic saddle’ (Skufca, Yorke & Eckhardt Reference Skufca, Yorke and Eckhardt2006). In other words, it is an attractor in one sense, but has at least one unstable degree of freedom through which the flow can decay to the laminar solution. To add to this phase-space description of turbulent flows, it has been found that the chaotic saddle and laminar solution are separated in phase space by the ‘edge’ of turbulence (see Skufca et al.
Reference Skufca, Yorke and Eckhardt2006; Schneider, Eckhardt & Yorke Reference Schneider, Eckhardt and Yorke2007; Schneider et al.
Reference Schneider, Gibson, Lagha, de Lillo and Eckhardt2008).
This dynamical systems approach was initiated by the discovery of nonlinear invariant solutions of the Navier–Stokes equations. These solutions can occur in various forms depending on the flow considered. Some examples include: stationary equilibrium solutions in plane Couette flow (Nagata Reference Nagata1990); travelling wave solutions in Poiseuille flow and pipe flow (Waleffe Reference Waleffe1998, Reference Waleffe2001, Reference Waleffe2003; Faisst & Eckhardt Reference Faisst and Eckhardt2003; Wedin & Kerswell Reference Wedin and Kerswell2004; Park & Graham Reference Park and Graham2015); and relative periodic orbits in Couette flow (Kawahara & Kida Reference Kawahara and Kida2001). Remarkably, these invariant solutions are typically composed of high- and low-speed streaks with a pair of alternating quasi-streamwise vortices, which resemble the coherent structures seen in experiments and fully developed simulations (Hamilton et al.
Reference Hamilton, Kim and Waleffe1995). Therefore, they have often been called ‘exact coherent structures’, and, in the present study, we shall use this term to refer to these various forms of invariant solutions, as we will be studying a pair of equilibrium states in plane Couette flow (Nagata Reference Nagata1990) and a periodic orbit in plane Poiseuille flow (see § 3.2). In phase space, the exact coherent structures are typically saddles, and it is believed that they are entangled via homoclinic and/or heteroclinic orbits (Halcrow et al.
Reference Halcrow, Gibson, Cvitanović and Viswanath2009; Kawahara, Uhlmann & van Veen Reference Kawahara, Uhlmann and van Veen2012). In this respect, it can be said that they represent the ‘skeleton’ of the turbulent trajectory in phase space (Gibson, Halcrow & Cvitanović Reference Gibson, Halcrow and Cvitanović2008). In plane Couette flow, the first kind of these exact coherent structures (Nagata Reference Nagata1990) occur in the form of a saddle-node bifurcation at a critical Reynolds number
 $Re\approx 128$
, based on the half-channel height and half the wall velocity difference (Waleffe Reference Waleffe2003; Wang, Gibson & Waleffe Reference Wang, Gibson and Waleffe2007). Below this Reynolds number, only the laminar solution exists. Above the critical Reynolds number, two additional solutions may be found: the upper-branch (higher drag) and lower-branch (lower drag) equilibria. On increasing the Reynolds number, the former evolves into a representation of the ‘full’ turbulent dynamics through a sequence of secondary bifurcations, whereas the latter sits on the edge state (Wang et al.
Reference Wang, Gibson and Waleffe2007; Gibson et al.
Reference Gibson, Halcrow and Cvitanović2008; Schneider et al.
Reference Schneider, Gibson, Lagha, de Lillo and Eckhardt2008; Kreilos & Eckhardt Reference Kreilos and Eckhardt2012).
$Re\approx 128$
, based on the half-channel height and half the wall velocity difference (Waleffe Reference Waleffe2003; Wang, Gibson & Waleffe Reference Wang, Gibson and Waleffe2007). Below this Reynolds number, only the laminar solution exists. Above the critical Reynolds number, two additional solutions may be found: the upper-branch (higher drag) and lower-branch (lower drag) equilibria. On increasing the Reynolds number, the former evolves into a representation of the ‘full’ turbulent dynamics through a sequence of secondary bifurcations, whereas the latter sits on the edge state (Wang et al.
Reference Wang, Gibson and Waleffe2007; Gibson et al.
Reference Gibson, Halcrow and Cvitanović2008; Schneider et al.
Reference Schneider, Gibson, Lagha, de Lillo and Eckhardt2008; Kreilos & Eckhardt Reference Kreilos and Eckhardt2012).
Given the new physical insight gained from this dynamical systems approach, it is tempting to design a novel flow control strategy by making use of the phase-space information. Stone, Waleffe & Graham (Reference Stone, Waleffe and Graham2002) and Li, Xi & Graham (Reference Li, Xi and Graham2006) have studied the effect of polymer additives on certain relative equilibrium states in Couette flow and Poiseuille flow, respectively. They observed that these solutions exhibit many of the same drag reduction phenomena seen in fully developed turbulent flows with polymer additives. Kawahara (Reference Kawahara2005) also demonstrated that timely spanwise rotation of the system in minimal Couette flow at a low Reynolds number can cause the turbulent state to pass through the edge state towards the laminar solution. However, it remains generally unclear how one would design a more practical flow control strategy based on the phase-space information alone. As a first step, the goal of the present study is to explore how a well-established flow control strategy would change a system’s phase-space dynamics. To this end, we consider opposition control, a well-known feedback control technique for near-wall turbulence, and apply it to two representative wall-bounded turbulent flows: plane Couette flow and plane Poiseuille flow. In particular, we carry out direct numerical simulations (DNS) in domains close to the minimal unit at low Reynolds numbers, aiming to answer the following questions: (i) Does opposition control affect the dynamics of the edge state of these flows, and, if so, how? (ii) How are the equilibrium solutions, often emerging in the form of upper- and lower-branch states, changed by the control, if at all? (iii) What impact does this control method have on the transient nature of turbulence (turbulence lifetimes), and how does this relate to the phase-space organisation of plane Couette and Poiseuille flow?
This paper is organised as follows. In § 2, we introduce the numerical methods of the present study, including the set-up of the direct numerical simulations. Then, in § 3, we present the results of these simulations and discuss how opposition control affects the phase-space dynamics of minimal plane Couette and Poiseuille flow. It is in this section that we demonstrate how the upper-branch equilibrium solution and mean turbulent state gradually approach the edge state in phase space as the control is applied, which is reflected in a significant change in the turbulence lifetimes of these flows. Finally, in § 4, we conclude this paper with a summary of its key findings.
Table 1. Simulation parameters in the present study. Here,
 $Re=U_{ref}h/\unicode[STIX]{x1D708}$
, where
$Re=U_{ref}h/\unicode[STIX]{x1D708}$
, where
 $U_{ref}=U_{w}$
for Couette flow and
$U_{ref}=U_{w}$
for Couette flow and
 $U_{ref}=U_{l}$
for Poiseuille flow. The friction Reynolds number is given by
$U_{ref}=U_{l}$
for Poiseuille flow. The friction Reynolds number is given by
 $Re_{\unicode[STIX]{x1D70F}}=u_{\unicode[STIX]{x1D70F}}h/\unicode[STIX]{x1D708}$
, where
$Re_{\unicode[STIX]{x1D70F}}=u_{\unicode[STIX]{x1D70F}}h/\unicode[STIX]{x1D708}$
, where
 $u_{\unicode[STIX]{x1D70F}}$
is the friction velocity.
$u_{\unicode[STIX]{x1D70F}}$
is the friction velocity.
2 Numerical methods
We consider the flow of a fluid with density
 $\unicode[STIX]{x1D70C}$
and kinematic viscosity
$\unicode[STIX]{x1D70C}$
and kinematic viscosity
 $\unicode[STIX]{x1D708}$
within a domain of dimension
$\unicode[STIX]{x1D708}$
within a domain of dimension
 $L_{x}\times L_{y}\times L_{z}$
, where
$L_{x}\times L_{y}\times L_{z}$
, where
 $x$
,
$x$
,
 $y$
and
$y$
and
 $z$
are the streamwise, wall-normal and spanwise directions, respectively. The corresponding velocity components are
$z$
are the streamwise, wall-normal and spanwise directions, respectively. The corresponding velocity components are
 $u$
,
$u$
,
 $v$
and
$v$
and
 $w$
, which are also used interchangeably with
$w$
, which are also used interchangeably with
 $u_{1}$
,
$u_{1}$
,
 $u_{2}$
and
$u_{2}$
and
 $u_{3}$
. The numerical simulations in the present study are carried out using the Navier–Stokes solver diablo (Bewley Reference Bewley2014), which has been validated for DNS (e.g. Hwang Reference Hwang2013). This code uses Fourier series with a 2/3 dealiasing rule in the streamwise and spanwise directions, and a second-order central difference scheme in the wall-normal direction. As mentioned above, both plane Couette and Poiseuille flows are considered in the present study. The simulation parameters are summarised in table 1, but the boundary conditions and choice of domain size and are explained below.
$u_{3}$
. The numerical simulations in the present study are carried out using the Navier–Stokes solver diablo (Bewley Reference Bewley2014), which has been validated for DNS (e.g. Hwang Reference Hwang2013). This code uses Fourier series with a 2/3 dealiasing rule in the streamwise and spanwise directions, and a second-order central difference scheme in the wall-normal direction. As mentioned above, both plane Couette and Poiseuille flows are considered in the present study. The simulation parameters are summarised in table 1, but the boundary conditions and choice of domain size and are explained below.
In the case of plane Couette flow, the size of the wall-normal domain is chosen to be
 $L_{y}=2h$
, which puts the lower wall at
$L_{y}=2h$
, which puts the lower wall at
 $y=0$
and the upper wall at
$y=0$
and the upper wall at
 $y=2h$
. The lower wall is set to be stationary and the upper wall slides downstream with velocity
$y=2h$
. The lower wall is set to be stationary and the upper wall slides downstream with velocity
 $2U_{w}$
. Since one of the main aims of this study is to compute the lower- and upper-branch equilibrium states in Couette flow that were originally found by Nagata (Reference Nagata1990), the streamwise and spanwise extent of the domain is chosen to be the same as in that study.
$2U_{w}$
. Since one of the main aims of this study is to compute the lower- and upper-branch equilibrium states in Couette flow that were originally found by Nagata (Reference Nagata1990), the streamwise and spanwise extent of the domain is chosen to be the same as in that study.
For plane Poiseuille flow,
 $L_{y}=h$
, and the lower and upper boundaries are at
$L_{y}=h$
, and the lower and upper boundaries are at
 $y=0$
and
$y=0$
and
 $y=h$
, respectively. The wall is located at the lower boundary, whereas the upper boundary represents the mid-channel plane through the application of a symmetric boundary condition, i.e.
$y=h$
, respectively. The wall is located at the lower boundary, whereas the upper boundary represents the mid-channel plane through the application of a symmetric boundary condition, i.e.
 $\unicode[STIX]{x2202}u/\unicode[STIX]{x2202}y=v=\unicode[STIX]{x2202}w/\unicode[STIX]{x2202}y=0$
. We note that this setting is intentionally introduced to prevent any complications arising from the interaction between structures in the lower and upper wall regions (Neelavara, Duguet & Lusseyran Reference Neelavara, Duguet and Lusseyran2017). The simulation of plane Poiseuille flow is performed by maintaining a constant bulk velocity
$\unicode[STIX]{x2202}u/\unicode[STIX]{x2202}y=v=\unicode[STIX]{x2202}w/\unicode[STIX]{x2202}y=0$
. We note that this setting is intentionally introduced to prevent any complications arising from the interaction between structures in the lower and upper wall regions (Neelavara, Duguet & Lusseyran Reference Neelavara, Duguet and Lusseyran2017). The simulation of plane Poiseuille flow is performed by maintaining a constant bulk velocity
 $U_{m}=(2/3)U_{l}$
, where
$U_{m}=(2/3)U_{l}$
, where
 $U_{l}$
is the centreline velocity of the corresponding laminar flow with the same mass flux. In this case, the streamwise and spanwise extent of the domain is chosen to be close to the ‘minimal unit’ found by Jiménez & Moin (Reference Jiménez and Moin1991), in order to resolve just one instance of the near-wall self-sustaining process and simplify the analysis of these structures.
$U_{l}$
is the centreline velocity of the corresponding laminar flow with the same mass flux. In this case, the streamwise and spanwise extent of the domain is chosen to be close to the ‘minimal unit’ found by Jiménez & Moin (Reference Jiménez and Moin1991), in order to resolve just one instance of the near-wall self-sustaining process and simplify the analysis of these structures.
2.1 Implementation of opposition control
Opposition control is applied at both the lower and upper walls for Couette flow, whereas it applied only at the lower wall for Poiseuille flow due to the symmetric boundary condition at the mid-channel plane. To implement the control, the wall-normal velocity at the wall is modified such that:
 $$\begin{eqnarray}v(x,0,z,t)=-\unicode[STIX]{x1D719}v(x,y_{d},z,t),\end{eqnarray}$$
where
 $\unicode[STIX]{x1D719}$
is the control amplitude and
$\unicode[STIX]{x1D719}$
is the control amplitude and
 $y_{d}$
is the detection plane height
$y_{d}$
is the detection plane height
 $y_{d}$
. Here,
$y_{d}$
. Here,
 $y_{d}$
is chosen to be
$y_{d}$
is chosen to be
 $y_{d}^{+}\approx 10$
since this is reported to be the most efficient detection plane height for drag reduction (Choi et al.
Reference Choi, Moin and Kim1994). The control amplitude
$y_{d}^{+}\approx 10$
since this is reported to be the most efficient detection plane height for drag reduction (Choi et al.
Reference Choi, Moin and Kim1994). The control amplitude
 $\unicode[STIX]{x1D719}$
is considered to vary as
$\unicode[STIX]{x1D719}$
is considered to vary as
 $0\leqslant \unicode[STIX]{x1D719}\leqslant 1$
in order to examine the effect of opposition control on the dynamics in phase space. The implementation of opposition control has also been verified against the results of Choi et al. (Reference Choi, Moin and Kim1994). For further details on the effects of varying the amplitude, phase and detection plane height of opposition control, the reader may refer to Chung & Talha (Reference Chung and Talha2011) and Luhar et al. (Reference Luhar, Sharma and Mckeon2014).
$0\leqslant \unicode[STIX]{x1D719}\leqslant 1$
in order to examine the effect of opposition control on the dynamics in phase space. The implementation of opposition control has also been verified against the results of Choi et al. (Reference Choi, Moin and Kim1994). For further details on the effects of varying the amplitude, phase and detection plane height of opposition control, the reader may refer to Chung & Talha (Reference Chung and Talha2011) and Luhar et al. (Reference Luhar, Sharma and Mckeon2014).
2.2 Computation of edge state and equilibria
To understand the phase-space dynamics associated with the application of opposition control, the edge state and equilibria are calculated. The edge state is obtained using the standard bisection technique (see e.g. Itano & Toh Reference Itano and Toh2001; Skufca et al. Reference Skufca, Yorke and Eckhardt2006). We introduce the turbulent fluctuation energy averaged over a given computational domain:
 $$\begin{eqnarray}(E_{uu},E_{vv},E_{ww})=\frac{1}{2V_{d}}\int _{\unicode[STIX]{x1D6FA}_{d}}({u^{\prime }}^{2},{v^{\prime }}^{2},{w^{\prime }}^{2})/U_{ref}^{2}\,\text{d}V,\end{eqnarray}$$
where
 $u^{\prime }$
,
$u^{\prime }$
,
 $v^{\prime }$
and
$v^{\prime }$
and
 $w^{\prime }$
are the velocity fluctuations in each coordinate direction,
$w^{\prime }$
are the velocity fluctuations in each coordinate direction,
 $U_{ref}=U_{w}$
in Couette flow and
$U_{ref}=U_{w}$
in Couette flow and
 $U_{ref}=U_{l}$
in Poiseuille flow,
$U_{ref}=U_{l}$
in Poiseuille flow,
 $\unicode[STIX]{x1D6FA}_{d}$
denotes the computational domain and
$\unicode[STIX]{x1D6FA}_{d}$
denotes the computational domain and
 $V_{d}$
is the volume of
$V_{d}$
is the volume of
 $\unicode[STIX]{x1D6FA}_{d}$
. The bisection is carried out based on the energy of the cross-streamwise velocity components (
$\unicode[STIX]{x1D6FA}_{d}$
. The bisection is carried out based on the energy of the cross-streamwise velocity components (
 $E_{vv}+E_{ww}$
). The invariant solutions examined in the present study are the pair of equilibrium states found by Nagata (Reference Nagata1990) in Couette flow (figure 4) and a relative periodic orbit embedded in the edge state of Poiseuille flow at
$E_{vv}+E_{ww}$
). The invariant solutions examined in the present study are the pair of equilibrium states found by Nagata (Reference Nagata1990) in Couette flow (figure 4) and a relative periodic orbit embedded in the edge state of Poiseuille flow at
 $Re=4200$
(figure 9; see also table 1). The details of the invariant solutions specific to Couette flow and Poiseuille flow are given in §§ 2.2.1 and 2.2.2, respectively.
$Re=4200$
(figure 9; see also table 1). The details of the invariant solutions specific to Couette flow and Poiseuille flow are given in §§ 2.2.1 and 2.2.2, respectively.
2.2.1 Computing the equilibrium states in Couette flow
The computation of the equilibrium states in Couette flow is performed using the Newton–Krylov–Hookstep method (see e.g. Viswanath Reference Viswanath2007, Reference Viswanath2009; Willis, Cvitanović & Avila Reference Willis, Cvitanović and Avila2013), using the edge state as an initial condition. The solver has been verified previously by Hwang, Willis & Cossu (Reference Hwang, Willis and Cossu2016), as well as in the present study. This method computes an invariant solution by allowing an initial guess to evolve over a time interval
 $T_{0}$
. The next step is to find the streamwise shift,
$T_{0}$
. The next step is to find the streamwise shift,
 $s_{x}$
, that minimises the relative error between the initial velocity field and the final velocity field at
$s_{x}$
, that minimises the relative error between the initial velocity field and the final velocity field at
 $t=T_{0}$
. Here, the relative error is defined as the normalised residual of the initial guess and final, shifted velocity field. The initial guess is then improved, and the solver iterates through this process until the relative error is below a threshold value. For an equilibrium state such as the solutions in Nagata (Reference Nagata1990), the time interval
$t=T_{0}$
. Here, the relative error is defined as the normalised residual of the initial guess and final, shifted velocity field. The initial guess is then improved, and the solver iterates through this process until the relative error is below a threshold value. For an equilibrium state such as the solutions in Nagata (Reference Nagata1990), the time interval
 $T_{0}$
can be chosen arbitrarily. In the present study,
$T_{0}$
can be chosen arbitrarily. In the present study,
 $T_{0}=10h/U_{w}$
is used and the maximum relative error is
$T_{0}=10h/U_{w}$
is used and the maximum relative error is
 $r=10^{-6}$
or lower.
$r=10^{-6}$
or lower.
The eigenvalues of the computed equilibrium states are also examined by implementing Arnoldi iteration. The Arnoldi iteration computes the Krylov subspace of the Navier–Stokes equations linearised around the equilibrium state of interest. An orthogonal basis of the Krylov subspace is then found, the eigenvalues of which are typically a good approximation for the largest eigenvalues of the equilibrium state.
2.2.2 Computing the periodic edge state in Poiseuille flow
In the case of Poiseuille flow, the simulations are performed in the subspace of shift–reflect symmetry:
 $$\begin{eqnarray}[u,v,w,p](x,y,z)=[u,v,-w,p](x-L_{x}/2,y,-z),\end{eqnarray}$$
where
 $p$
is the pressure. We note that imposing this symmetry reduces the dimension of the state space in Poiseuille flow but does not significantly distort the dynamics and statistics of the turbulent state (Hwang et al.
Reference Hwang, Willis and Cossu2016). This is because the symmetry (2.3) is designed to capture the fundamental ‘sinuous’ mode of streak instability, which has been understood to be the dominant mechanism of streak breakdown in the near-wall self-sustaining process (Hamilton et al.
Reference Hamilton, Kim and Waleffe1995). As an aside, this process has been found to occur at a streamwise wavelength
$p$
is the pressure. We note that imposing this symmetry reduces the dimension of the state space in Poiseuille flow but does not significantly distort the dynamics and statistics of the turbulent state (Hwang et al.
Reference Hwang, Willis and Cossu2016). This is because the symmetry (2.3) is designed to capture the fundamental ‘sinuous’ mode of streak instability, which has been understood to be the dominant mechanism of streak breakdown in the near-wall self-sustaining process (Hamilton et al.
Reference Hamilton, Kim and Waleffe1995). As an aside, this process has been found to occur at a streamwise wavelength
 $\unicode[STIX]{x1D706}_{x}^{+}\approx 300$
(Schoppa & Hussain Reference Schoppa and Hussain2002; Cassinelli et al.
Reference Cassinelli, de Giovanetti and Hwang2017), which is of the same order as the streamwise domain length,
$\unicode[STIX]{x1D706}_{x}^{+}\approx 300$
(Schoppa & Hussain Reference Schoppa and Hussain2002; Cassinelli et al.
Reference Cassinelli, de Giovanetti and Hwang2017), which is of the same order as the streamwise domain length,
 $L_{x}^{+}$
, used here. The main difference caused by the imposition of the symmetry (2.3) is that the edge state at the Reynolds number considered here is changed from a chaotic state to a time-periodic one due to the lower dimensionality of the system. However, this relative periodic solution should still lie on the edge of turbulence because it belongs to the subspace of the edge of turbulence characterised by (2.3). This symmetry also allows the edge state to be computed at relatively high Reynolds number (
$L_{x}^{+}$
, used here. The main difference caused by the imposition of the symmetry (2.3) is that the edge state at the Reynolds number considered here is changed from a chaotic state to a time-periodic one due to the lower dimensionality of the system. However, this relative periodic solution should still lie on the edge of turbulence because it belongs to the subspace of the edge of turbulence characterised by (2.3). This symmetry also allows the edge state to be computed at relatively high Reynolds number (
 $Re_{\unicode[STIX]{x1D70F}}\simeq 180$
), while avoiding technical complications originating from the chaotic edge state. This higher Reynolds number ensures that there is a separation of scales between the very large-scale motions Hwang (Reference Hwang2015) and the near-wall structures of the self-sustaining process (
$Re_{\unicode[STIX]{x1D70F}}\simeq 180$
), while avoiding technical complications originating from the chaotic edge state. This higher Reynolds number ensures that there is a separation of scales between the very large-scale motions Hwang (Reference Hwang2015) and the near-wall structures of the self-sustaining process (
 $\unicode[STIX]{x1D706}_{z}^{+}\simeq 100$
) at least to some extent. As such, it is possible to study the near-wall structures (i.e. the structures on which opposition control was originally designed to act), reasonably well separated from the outer larger ones.
$\unicode[STIX]{x1D706}_{z}^{+}\simeq 100$
) at least to some extent. As such, it is possible to study the near-wall structures (i.e. the structures on which opposition control was originally designed to act), reasonably well separated from the outer larger ones.
The relative periodic orbit sitting on the edge of turbulence in Poiseuille flow is computed with the bisection method described above. The periodicity of this orbit is found to be very long (
 $T\simeq 2000h/U_{l}$
; see figure 5) and is very similar to those observed in an asymptotic suction boundary layer (Kreilos et al.
Reference Kreilos, Veble, Schneider and Eckhardt2013) and in Poiseuille flow with a different computational domain (Zammert & Eckhardt Reference Zammert and Eckhardt2014). Such a periodic orbit has been understood to be the result of a saddle-node infinite-period (SNIPER) bifurcation. This involves the collision of the related upper- and lower-branch equilibrium states and their subsequent disappearance, along with the appearance of very long periodicity in the orbit (Kreilos et al.
Reference Kreilos, Veble, Schneider and Eckhardt2013). Therefore, computation of the equilibrium states from such an edge state has not been attempted and the focus in Poiseuille flow is given to understanding the change in dynamics of the periodic orbit in the presence of opposition control.
$T\simeq 2000h/U_{l}$
; see figure 5) and is very similar to those observed in an asymptotic suction boundary layer (Kreilos et al.
Reference Kreilos, Veble, Schneider and Eckhardt2013) and in Poiseuille flow with a different computational domain (Zammert & Eckhardt Reference Zammert and Eckhardt2014). Such a periodic orbit has been understood to be the result of a saddle-node infinite-period (SNIPER) bifurcation. This involves the collision of the related upper- and lower-branch equilibrium states and their subsequent disappearance, along with the appearance of very long periodicity in the orbit (Kreilos et al.
Reference Kreilos, Veble, Schneider and Eckhardt2013). Therefore, computation of the equilibrium states from such an edge state has not been attempted and the focus in Poiseuille flow is given to understanding the change in dynamics of the periodic orbit in the presence of opposition control.
3 Results and discussion
3.1 The effect of opposition control on the equilibrium states in Couette flow
First, we discuss the behaviour of the edge state in Couette flow at
 $Re=400$
(see table 1) with opposition control. The bisection method is implemented to compute the edge state at five different control amplitudes
$Re=400$
(see table 1) with opposition control. The bisection method is implemented to compute the edge state at five different control amplitudes
 $\unicode[STIX]{x1D719}=0.0,0.1,0.2,0.5$
and
$\unicode[STIX]{x1D719}=0.0,0.1,0.2,0.5$
and
 $1.0$
. This results in a steady and statistically stationary edge state for all values of
$1.0$
. This results in a steady and statistically stationary edge state for all values of
 $\unicode[STIX]{x1D719}$
that changes very little as the control amplitude is increased. In particular, we see a reduction in the measured friction Reynolds number of less than 0.5 % from
$\unicode[STIX]{x1D719}$
that changes very little as the control amplitude is increased. In particular, we see a reduction in the measured friction Reynolds number of less than 0.5 % from
 $Re_{\unicode[STIX]{x1D70F}}=23.3$
at
$Re_{\unicode[STIX]{x1D70F}}=23.3$
at
 $\unicode[STIX]{x1D719}=0.0$
to
$\unicode[STIX]{x1D719}=0.0$
to
 $Re_{\unicode[STIX]{x1D70F}}=23.2$
at
$Re_{\unicode[STIX]{x1D70F}}=23.2$
at
 $\unicode[STIX]{x1D719}=1.0$
. The edge states for the five control amplitudes are then used as initial guesses for the Newton–Krylov–Hookstep solver so that the corresponding lower-branch equilibria may be found. In each case, it is found that the solution quickly converges to a lower-branch equilibrium state that is the same as the edge state used as the initial guess. We then reduce the Reynolds number gradually for each value of
$\unicode[STIX]{x1D719}=1.0$
. The edge states for the five control amplitudes are then used as initial guesses for the Newton–Krylov–Hookstep solver so that the corresponding lower-branch equilibria may be found. In each case, it is found that the solution quickly converges to a lower-branch equilibrium state that is the same as the edge state used as the initial guess. We then reduce the Reynolds number gradually for each value of
 $\unicode[STIX]{x1D719}$
and compute the lower-branch equilibrium solution down to the bifurcation point at
$\unicode[STIX]{x1D719}$
and compute the lower-branch equilibrium solution down to the bifurcation point at
 $Re=Re_{crit}$
. Finally, this is further continued onto the upper-branch solution back up to
$Re=Re_{crit}$
. Finally, this is further continued onto the upper-branch solution back up to
 $Re=400$
.
$Re=400$
.
Figure 1 shows the effect of opposition control on the
 $C_{f}$
–
$C_{f}$
–
 $Re$
bifurcation diagram for the equilibrium solutions, where
$Re$
bifurcation diagram for the equilibrium solutions, where
 $C_{f}=2(Re_{\unicode[STIX]{x1D70F}}/Re)^{2}$
is the skin-friction coefficient. Three points of note are immediately clear: (i) for
$C_{f}=2(Re_{\unicode[STIX]{x1D70F}}/Re)^{2}$
is the skin-friction coefficient. Three points of note are immediately clear: (i) for
 $Re>150$
, increasing the control amplitude has a negligible effect on the drag of the lower-branch solution; (ii) the critical Reynolds number increases noticeably from
$Re>150$
, increasing the control amplitude has a negligible effect on the drag of the lower-branch solution; (ii) the critical Reynolds number increases noticeably from
 $Re_{crit}|_{\unicode[STIX]{x1D719}=0}\approx 128$
to
$Re_{crit}|_{\unicode[STIX]{x1D719}=0}\approx 128$
to
 $Re_{crit}|_{\unicode[STIX]{x1D719}=1}\approx 147$
(an increase of 15 %); (iii) the upper-branch equilibrium solutions see a large drop in
$Re_{crit}|_{\unicode[STIX]{x1D719}=1}\approx 147$
(an increase of 15 %); (iii) the upper-branch equilibrium solutions see a large drop in
 $C_{f}$
for all values of
$C_{f}$
for all values of
 $Re$
as the control is applied, including a substantial reduction of 29 % at
$Re$
as the control is applied, including a substantial reduction of 29 % at
 $Re=400$
for
$Re=400$
for
 $\unicode[STIX]{x1D719}=1.0$
. More specific data from the bifurcation diagram are presented in table 2 for reference. The physical significance of this increase in critical Reynolds number would be to delay transition, because it is the Reynolds number below which only the laminar solution exists. As an aside, in table 2 we see that the skin-friction coefficient of the mean turbulent state falls by 25 % (as also shown in figure 1), which supports the notion that the turbulent trajectory is organised around the upper-branch equilibrium solution in phase space. In other words, if the upper-branch solution is pulled closer to the lower-branch solution in phase space by opposition control, then so too should the mean turbulent state. As we will see later, this result is significant because it explains why we observe opposition control to have such a large effect on turbulence lifetimes (see § 3.3.2).
$\unicode[STIX]{x1D719}=1.0$
. More specific data from the bifurcation diagram are presented in table 2 for reference. The physical significance of this increase in critical Reynolds number would be to delay transition, because it is the Reynolds number below which only the laminar solution exists. As an aside, in table 2 we see that the skin-friction coefficient of the mean turbulent state falls by 25 % (as also shown in figure 1), which supports the notion that the turbulent trajectory is organised around the upper-branch equilibrium solution in phase space. In other words, if the upper-branch solution is pulled closer to the lower-branch solution in phase space by opposition control, then so too should the mean turbulent state. As we will see later, this result is significant because it explains why we observe opposition control to have such a large effect on turbulence lifetimes (see § 3.3.2).

Figure 1.
 $C_{f}$
–
$C_{f}$
–
 $Re$
bifurcation diagram of the equilibrium solutions in Couette flow for
$Re$
bifurcation diagram of the equilibrium solutions in Couette flow for
 $\unicode[STIX]{x1D719}=0.0,0.1,0.2,0.5,1.0$
. The triangle and cross symbols correspond to the mean turbulent state at
$\unicode[STIX]{x1D719}=0.0,0.1,0.2,0.5,1.0$
. The triangle and cross symbols correspond to the mean turbulent state at
 $Re=400$
for
$Re=400$
for
 $\unicode[STIX]{x1D719}=0.0$
and
$\unicode[STIX]{x1D719}=0.0$
and
 $\unicode[STIX]{x1D719}=1.0$
, respectively.
$\unicode[STIX]{x1D719}=1.0$
, respectively.
Table 2. Parameters relating to the
 $C_{f}$
–
$C_{f}$
–
 $Re$
bifurcation diagram (figure 1).
$Re$
bifurcation diagram (figure 1).
 $C_{f,l}$
and
$C_{f,l}$
and
 $C_{f,u}$
denote the skin friction coefficient of the lower- and upper-branch solutions, respectively, and
$C_{f,u}$
denote the skin friction coefficient of the lower- and upper-branch solutions, respectively, and
 $C_{f,t}$
is that of the mean turbulent state. The skin-friction coefficients reported here are the values at
$C_{f,t}$
is that of the mean turbulent state. The skin-friction coefficients reported here are the values at
 $Re=400$
.
$Re=400$
.

The mean streamwise velocity profiles of the upper- and lower-branch solutions and mean turbulent state at
 $Re=400$
are plotted in figure 2 for
$Re=400$
are plotted in figure 2 for
 $\unicode[STIX]{x1D719}=0.0$
and 1.0. The profiles for the upper-branch solution and mean turbulent state are noticeably similar (figure 2
$\unicode[STIX]{x1D719}=0.0$
and 1.0. The profiles for the upper-branch solution and mean turbulent state are noticeably similar (figure 2
 $a$
). The lower-branch solution, on the other hand, exhibits a profile much closer to that of the laminar state. Analysis of the
$a$
). The lower-branch solution, on the other hand, exhibits a profile much closer to that of the laminar state. Analysis of the
 $U^{+}$
profile very near the wall (figure 2
$U^{+}$
profile very near the wall (figure 2
 $b$
) highlights this point further and also shows how little the control affects the lower-branch solution. However, the
$b$
) highlights this point further and also shows how little the control affects the lower-branch solution. However, the
 $U^{+}$
profiles of the upper-branch solution and mean turbulent state are pulled closer to that of the lower-branch solution when the control is applied.
$U^{+}$
profiles of the upper-branch solution and mean turbulent state are pulled closer to that of the lower-branch solution when the control is applied.
In figure 3, we plot the second-order statistics normalised by
 $U_{w}$
and
$U_{w}$
and
 $u_{\unicode[STIX]{x1D70F}}$
in outer and inner coordinates, respectively. What we first see in the case of the lower-branch solution, whose profile is again hardly modified by the control, is that it is dominated by streamwise velocity fluctuations (figure 3
a–c). Since opposition control acts on the
$u_{\unicode[STIX]{x1D70F}}$
in outer and inner coordinates, respectively. What we first see in the case of the lower-branch solution, whose profile is again hardly modified by the control, is that it is dominated by streamwise velocity fluctuations (figure 3
a–c). Since opposition control acts on the
 $v$
fluctuations near the wall, this would explain why we see almost no reduction in the drag of the lower-branch solution, even at large control amplitudes. On the contrary, in the case of the fully developed state and the upper-branch solution, the wall-normal fluctuations are more significant. As a result, as the control is applied, the fluctuations of all the velocity components, when normalised by
$v$
fluctuations near the wall, this would explain why we see almost no reduction in the drag of the lower-branch solution, even at large control amplitudes. On the contrary, in the case of the fully developed state and the upper-branch solution, the wall-normal fluctuations are more significant. As a result, as the control is applied, the fluctuations of all the velocity components, when normalised by
 $U_{w}$
, are more significantly reduced (figure 3
a–c). Since
$U_{w}$
, are more significantly reduced (figure 3
a–c). Since
 $U_{w}$
is a constant, what this demonstrates is that opposition control reduces the absolute magnitude of the velocity fluctuations for the upper-branch solution and mean turbulent state. However, this results in a reduction in skin friction drag and corresponds to a lower value of
$U_{w}$
is a constant, what this demonstrates is that opposition control reduces the absolute magnitude of the velocity fluctuations for the upper-branch solution and mean turbulent state. However, this results in a reduction in skin friction drag and corresponds to a lower value of
 $u_{\unicode[STIX]{x1D70F}}$
. Therefore, when the velocity fluctuations are normalised by
$u_{\unicode[STIX]{x1D70F}}$
. Therefore, when the velocity fluctuations are normalised by
 $u_{\unicode[STIX]{x1D70F}}$
, the difference between the controlled and uncontrolled cases is much less pronounced (figure 3
d–f). It is also interesting to note that the profiles of the upper-branch solution and mean turbulent state are modified in similar ways by the control, while the lower-branch solution remains practically unchanged.
$u_{\unicode[STIX]{x1D70F}}$
, the difference between the controlled and uncontrolled cases is much less pronounced (figure 3
d–f). It is also interesting to note that the profiles of the upper-branch solution and mean turbulent state are modified in similar ways by the control, while the lower-branch solution remains practically unchanged.

Figure 2. Mean velocity profile for Couette flow with
 $\unicode[STIX]{x1D719}=0.0$
(solid lines) and
$\unicode[STIX]{x1D719}=0.0$
(solid lines) and
 $\unicode[STIX]{x1D719}=1.0$
(dash-dotted lines) at
$\unicode[STIX]{x1D719}=1.0$
(dash-dotted lines) at
 $Re=400$
: (a)
$Re=400$
: (a)
 $U(y/h)/U_{w}$
; (b)
$U(y/h)/U_{w}$
; (b)
 $U^{+}(y^{+})$
. Here, black lines, fully developed simulations; green lines, upper-branch equilibrium solution; red lines, lower-branch equilibrium solution.
$U^{+}(y^{+})$
. Here, black lines, fully developed simulations; green lines, upper-branch equilibrium solution; red lines, lower-branch equilibrium solution.

Figure 3. Root mean squared (r.m.s.) velocity profiles for Couette flow with
 $\unicode[STIX]{x1D719}=0.0$
(solid lines) and
$\unicode[STIX]{x1D719}=0.0$
(solid lines) and
 $\unicode[STIX]{x1D719}=1.0$
(dash-dotted lines) at
$\unicode[STIX]{x1D719}=1.0$
(dash-dotted lines) at
 $Re=400$
: (a–c)
$Re=400$
: (a–c)
 $u_{i,rms}(y/h)/U_{w}$
; (d–f)
$u_{i,rms}(y/h)/U_{w}$
; (d–f)
 $u_{i,rms}^{+}(y^{+})$
. Here, black lines, fully developed simulations; green lines, upper-branch equilibrium solution; red lines, lower-branch equilibrium solution.
$u_{i,rms}^{+}(y^{+})$
. Here, black lines, fully developed simulations; green lines, upper-branch equilibrium solution; red lines, lower-branch equilibrium solution.
The upper- and lower-branch equilibrium solutions are visualised in figure 4 for
 $\unicode[STIX]{x1D719}=0.0$
and 1.0 at
$\unicode[STIX]{x1D719}=0.0$
and 1.0 at
 $Re=400$
. In general, the solutions consists of a quasi-streamwise vortex at the domain centre (indicated by the regions of positive and negative
$Re=400$
. In general, the solutions consists of a quasi-streamwise vortex at the domain centre (indicated by the regions of positive and negative
 ${v^{\prime }}^{+}$
), which results in a pair of low- and high-speed streaks (indicated by the tube-like isosurfaces of
${v^{\prime }}^{+}$
), which results in a pair of low- and high-speed streaks (indicated by the tube-like isosurfaces of
 ${u^{\prime }}^{+}$
). In the lower-branch solution, these are centred approximately at
${u^{\prime }}^{+}$
). In the lower-branch solution, these are centred approximately at
 $y/h=1$
(figure 4
a,b). However, the stronger vortex in the upper-branch solution (figure 4
c,d) results in narrower low-speed streaks located closer to the wall. This difference in the location of the streaks is also indicated in figure 3(a) by the
$y/h=1$
(figure 4
a,b). However, the stronger vortex in the upper-branch solution (figure 4
c,d) results in narrower low-speed streaks located closer to the wall. This difference in the location of the streaks is also indicated in figure 3(a) by the
 $y$
-location of the maxima in
$y$
-location of the maxima in
 $u_{rms}$
in each case. The visualisation of the lower-branch solution shows that there is no noticeable change in the size of the streaks when the control is applied, however there is a very slight reduction in
$u_{rms}$
in each case. The visualisation of the lower-branch solution shows that there is no noticeable change in the size of the streaks when the control is applied, however there is a very slight reduction in
 $u_{rms}$
across the wall-normal domain (figure 3
a). On the other hand, the size of the streaks and quasi-streamwise vortex in the upper-branch solution is significantly reduced by the control, in agreement with the more significant change in
$u_{rms}$
across the wall-normal domain (figure 3
a). On the other hand, the size of the streaks and quasi-streamwise vortex in the upper-branch solution is significantly reduced by the control, in agreement with the more significant change in
 $u_{rms}$
and
$u_{rms}$
and
 $v_{rms}$
(figure 3
a,b).
$v_{rms}$
(figure 3
a,b).

Figure 4. Flow visualisation of the (a,b) lower-branch and (c,d) upper-branch equilibrium solutions in Couette flow at
 $Re=400$
without and with control: (a,c)
$Re=400$
without and with control: (a,c)
 $\unicode[STIX]{x1D719}=0.0$
; (b,d)
$\unicode[STIX]{x1D719}=0.0$
; (b,d)
 $\unicode[STIX]{x1D719}=1.0$
. In (a,b), the blue and cyan isosurfaces indicate
$\unicode[STIX]{x1D719}=1.0$
. In (a,b), the blue and cyan isosurfaces indicate
 ${u^{\prime }}^{+}=Re_{\unicode[STIX]{x1D70F},l}\pm 7.50$
, while the red and green ones indicate
${u^{\prime }}^{+}=Re_{\unicode[STIX]{x1D70F},l}\pm 7.50$
, while the red and green ones indicate
 ${v^{\prime }}^{+}=\pm 0.18$
. In (c,d), the blue and cyan isosurfaces indicate
${v^{\prime }}^{+}=\pm 0.18$
. In (c,d), the blue and cyan isosurfaces indicate
 ${u^{\prime }}^{+}=Re_{\unicode[STIX]{x1D70F},u}\pm 4.25$
, while the red and green ones indicate
${u^{\prime }}^{+}=Re_{\unicode[STIX]{x1D70F},u}\pm 4.25$
, while the red and green ones indicate
 ${v^{\prime }}^{+}=\pm 1.2$
.
${v^{\prime }}^{+}=\pm 1.2$
.
 $Re_{\unicode[STIX]{x1D70F},l}$
and
$Re_{\unicode[STIX]{x1D70F},l}$
and
 $Re_{\unicode[STIX]{x1D70F},u}$
are the friction Reynolds numbers of the corresponding lower-branch and upper-branch equilibrium solutions, respectively.
$Re_{\unicode[STIX]{x1D70F},u}$
are the friction Reynolds numbers of the corresponding lower-branch and upper-branch equilibrium solutions, respectively.
3.2 The effect of opposition control on the periodic edge state in Poiseuille flow
We then proceed to compute the edge state for plane Poiseuille flow in a domain close to the minimal unit at
 $Re=4200$
(see table 1) with the same five control amplitudes
$Re=4200$
(see table 1) with the same five control amplitudes
 $\unicode[STIX]{x1D719}=0.0,0.1,0.2,0.5$
and 1.0. This time, however, we enforce the shift–reflect symmetry constraint (2.3) on the flow, as discussed in § 2.2.2. The resulting edge state is a periodic orbit for all five control amplitudes, the behaviour of which changes as the control amplitude is increased. The temporal evolution of the streamwise turbulent fluctuation energy,
$\unicode[STIX]{x1D719}=0.0,0.1,0.2,0.5$
and 1.0. This time, however, we enforce the shift–reflect symmetry constraint (2.3) on the flow, as discussed in § 2.2.2. The resulting edge state is a periodic orbit for all five control amplitudes, the behaviour of which changes as the control amplitude is increased. The temporal evolution of the streamwise turbulent fluctuation energy,
 $E_{uu}$
, of the edge state is shown in figure 5 for each value of
$E_{uu}$
, of the edge state is shown in figure 5 for each value of
 $\unicode[STIX]{x1D719}$
, along with its trajectory projected onto
$\unicode[STIX]{x1D719}$
, along with its trajectory projected onto
 $E_{uu}$
–
$E_{uu}$
–
 $E_{vv}$
phase space. We will show later that these orbits are in fact noticeably similar to the self-sustaining process (see figure 9), as also found by Zammert & Eckhardt (Reference Zammert and Eckhardt2014). This representation of the periodic orbit of the edge state (figure 5) is motivated by the fact that the qualitative behaviour of the near-wall streaks and quasi-streamwise vortices is relatively well described by the temporal evolution of
$E_{vv}$
phase space. We will show later that these orbits are in fact noticeably similar to the self-sustaining process (see figure 9), as also found by Zammert & Eckhardt (Reference Zammert and Eckhardt2014). This representation of the periodic orbit of the edge state (figure 5) is motivated by the fact that the qualitative behaviour of the near-wall streaks and quasi-streamwise vortices is relatively well described by the temporal evolution of
 $E_{uu}$
and
$E_{uu}$
and
 $E_{vv}$
, respectively (see e.g. Hwang et al.
Reference Hwang, Willis and Cossu2016).
$E_{vv}$
, respectively (see e.g. Hwang et al.
Reference Hwang, Willis and Cossu2016).

Figure 5. Periodic orbits of the edge state for Poiseuille flow for various control amplitudes: (a,c,e,g,i)
 $E_{uu}$
against
$E_{uu}$
against
 $(t-t_{0})U_{l}/h$
, where
$(t-t_{0})U_{l}/h$
, where
 $t_{0}$
is the time of the initial velocity field; (b,d,f,h,j)
$t_{0}$
is the time of the initial velocity field; (b,d,f,h,j)
 $E_{uu}$
versus
$E_{uu}$
versus
 $E_{vv}$
. (a,c,e,g,i) correspond to
$E_{vv}$
. (a,c,e,g,i) correspond to
 $\unicode[STIX]{x1D719}=0.0,0.1,0.2,0.5,1.0$
, respectively; likewise for (b,d,f,h,j).
$\unicode[STIX]{x1D719}=0.0,0.1,0.2,0.5,1.0$
, respectively; likewise for (b,d,f,h,j).
In general, for each value of
 $\unicode[STIX]{x1D719}$
we see an interval of slowly decreasing
$\unicode[STIX]{x1D719}$
we see an interval of slowly decreasing
 $E_{uu}$
, which is then followed by an interval of rapid oscillations (figure 5
a,c,e,g,i). Note that in the no-control case (figure 5
a), there is a very short interval among these oscillations where
$E_{uu}$
, which is then followed by an interval of rapid oscillations (figure 5
a,c,e,g,i). Note that in the no-control case (figure 5
a), there is a very short interval among these oscillations where
 $E_{uu}$
varies more slowly (marked by the dotted line at
$E_{uu}$
varies more slowly (marked by the dotted line at
 $(t-t_{0})U_{l}/h=2050$
, where
$(t-t_{0})U_{l}/h=2050$
, where
 $t_{0}$
is the time of the initial velocity field). As the control amplitude is increased, the extent of this oscillatory behaviour is dramatically reduced, even for values as low as
$t_{0}$
is the time of the initial velocity field). As the control amplitude is increased, the extent of this oscillatory behaviour is dramatically reduced, even for values as low as
 $\unicode[STIX]{x1D719}=0.1$
(figure 5
c). We also observe that the long interval of slowly decreasing
$\unicode[STIX]{x1D719}=0.1$
(figure 5
c). We also observe that the long interval of slowly decreasing
 $E_{uu}$
gets shorter and the very short interval just mentioned becomes longer. This continues until
$E_{uu}$
gets shorter and the very short interval just mentioned becomes longer. This continues until
 $\unicode[STIX]{x1D719}=0.5$
(figure 5
g), at which point the two intervals are the same length. The periods of the orbits for each control amplitude are presented in table 3. The period,
$\unicode[STIX]{x1D719}=0.5$
(figure 5
g), at which point the two intervals are the same length. The periods of the orbits for each control amplitude are presented in table 3. The period,
 $T$
, gradually decreases as the control amplitude is increased, up to
$T$
, gradually decreases as the control amplitude is increased, up to
 $\unicode[STIX]{x1D719}=0.5$
. After this point, we actually observe an increase in the period of the orbit of 10 % between
$\unicode[STIX]{x1D719}=0.5$
. After this point, we actually observe an increase in the period of the orbit of 10 % between
 $\unicode[STIX]{x1D719}=0.5$
and
$\unicode[STIX]{x1D719}=0.5$
and
 $\unicode[STIX]{x1D719}=1.0$
(figure 5
i). Essentially, what we see is that each period of the edge state without control consists of two distinct phases that last for different lengths of time: the first is a long interval of slowly decreasing
$\unicode[STIX]{x1D719}=1.0$
(figure 5
i). Essentially, what we see is that each period of the edge state without control consists of two distinct phases that last for different lengths of time: the first is a long interval of slowly decreasing
 $E_{uu}$
followed by rapid oscillations; the second is a much shorter interval of relatively slow-varying
$E_{uu}$
followed by rapid oscillations; the second is a much shorter interval of relatively slow-varying
 $E_{uu}$
followed, again, by rapid oscillations. These two distinct phases are then manipulated by the control until they exhibit identical behaviour at approximately
$E_{uu}$
followed, again, by rapid oscillations. These two distinct phases are then manipulated by the control until they exhibit identical behaviour at approximately
 $\unicode[STIX]{x1D719}=0.5$
. This is strongly indicative of a period-halving bifurcation, which is supported further by the fact that
$\unicode[STIX]{x1D719}=0.5$
. This is strongly indicative of a period-halving bifurcation, which is supported further by the fact that
 $T|_{\unicode[STIX]{x1D719}=0.2}=2T|_{\unicode[STIX]{x1D719}=0.5}$
. Since period-halving bifurcations are associated with a system becoming less chaotic, we can say that the effect of opposition control is to regularise the edge state in plane Poiseuille flow. In this paper, the term ‘regularise’ refers to a system (or process) changing such that it exhibits less chaotic behaviour.
$T|_{\unicode[STIX]{x1D719}=0.2}=2T|_{\unicode[STIX]{x1D719}=0.5}$
. Since period-halving bifurcations are associated with a system becoming less chaotic, we can say that the effect of opposition control is to regularise the edge state in plane Poiseuille flow. In this paper, the term ‘regularise’ refers to a system (or process) changing such that it exhibits less chaotic behaviour.
Table 3. Parameters relating to the periodic orbit of the edge state in Poiseuille flow at
 $Re=4200$
. Here,
$Re=4200$
. Here,
 $T$
is the period of the orbit and
$T$
is the period of the orbit and
 $C_{f,e}$
is its mean skin-friction coefficient. The skin-friction coefficient of the mean turbulent state,
$C_{f,e}$
is its mean skin-friction coefficient. The skin-friction coefficient of the mean turbulent state,
 $C_{f,t}$
, is also included for reference.
$C_{f,t}$
, is also included for reference.

We demonstrate this further by analysing the change in projection of the orbits onto
 $E_{uu}$
–
$E_{uu}$
–
 $E_{vv}$
phase space when the control is applied (figure 5
b,d,f,h,j). For
$E_{vv}$
phase space when the control is applied (figure 5
b,d,f,h,j). For
 $\unicode[STIX]{x1D719}=0.0$
, we see a relatively chaotic periodic trajectory (figure 5
b). This has already become considerably more ordered by
$\unicode[STIX]{x1D719}=0.0$
, we see a relatively chaotic periodic trajectory (figure 5
b). This has already become considerably more ordered by
 $\unicode[STIX]{x1D719}=0.1$
(figure 5
d) and the two different phases of the orbit have now started to overlap in the
$\unicode[STIX]{x1D719}=0.1$
(figure 5
d) and the two different phases of the orbit have now started to overlap in the
 $E_{uu}$
–
$E_{uu}$
–
 $E_{vv}$
plane. By
$E_{vv}$
plane. By
 $\unicode[STIX]{x1D719}=0.2$
(figure 5
$\unicode[STIX]{x1D719}=0.2$
(figure 5
 $f$
), there are still two phases to the orbit, but they are much closer together. The period-halving bifurcation, however, has clearly taken place by
$f$
), there are still two phases to the orbit, but they are much closer together. The period-halving bifurcation, however, has clearly taken place by
 $\unicode[STIX]{x1D719}=0.5$
(figure 5
h), since now the orbit has just one distinct and very regular phase. Only a very subtle change to the trajectory is seen between
$\unicode[STIX]{x1D719}=0.5$
(figure 5
h), since now the orbit has just one distinct and very regular phase. Only a very subtle change to the trajectory is seen between
 $\unicode[STIX]{x1D719}=0.5$
and
$\unicode[STIX]{x1D719}=0.5$
and
 $\unicode[STIX]{x1D719}=1.0$
(figure 5
j), indicating that the effect of the bifurcation on the edge state’s dynamics is well established before this point, i.e. at
$\unicode[STIX]{x1D719}=1.0$
(figure 5
j), indicating that the effect of the bifurcation on the edge state’s dynamics is well established before this point, i.e. at
 $\unicode[STIX]{x1D719}=0.5$
.
$\unicode[STIX]{x1D719}=0.5$
.
It is also interesting to note how the trajectories of the edge state occupy very similar regions of the
 $E_{uu}$
–
$E_{uu}$
–
 $E_{vv}$
plane for all control amplitudes, which is also observed for the lower-branch equilibrium solutions in Couette flow in the
$E_{vv}$
plane for all control amplitudes, which is also observed for the lower-branch equilibrium solutions in Couette flow in the
 $C_{f}$
–
$C_{f}$
–
 $Re$
bifurcation diagram (see figure 1). In fact, there is almost no change in the time-averaged skin-friction coefficient of the edge state in plane Poiseuille flow when the control is applied (table 3). This is again similar to the results for Couette flow above, where we see a negligible change in the measured
$Re$
bifurcation diagram (see figure 1). In fact, there is almost no change in the time-averaged skin-friction coefficient of the edge state in plane Poiseuille flow when the control is applied (table 3). This is again similar to the results for Couette flow above, where we see a negligible change in the measured
 $C_{f}$
of the lower-branch solution. For the mean turbulent state in Poiseuille flow, on the other hand, we see a significant reduction in
$C_{f}$
of the lower-branch solution. For the mean turbulent state in Poiseuille flow, on the other hand, we see a significant reduction in
 $C_{f}$
of approximately 17 % (table 3).
$C_{f}$
of approximately 17 % (table 3).
It should be said that Choi et al. (Reference Choi, Moin and Kim1994) report a reduction in
 $C_{f}$
of approximately 24 %, which differs somewhat from the value presented here. Their simulations were conducted at the same Reynolds number as the present study, but in channels with both upper and lower walls and in domains of considerably larger streamwise and spanwise extent. This discrepancy is, therefore, consistent with the smaller domain size and symmetric boundary condition at
$C_{f}$
of approximately 24 %, which differs somewhat from the value presented here. Their simulations were conducted at the same Reynolds number as the present study, but in channels with both upper and lower walls and in domains of considerably larger streamwise and spanwise extent. This discrepancy is, therefore, consistent with the smaller domain size and symmetric boundary condition at
 $y=h$
in our simulations.
$y=h$
in our simulations.

Figure 6. Mean velocity profile for Poiseuille flow with
 $\unicode[STIX]{x1D719}=0.0$
(solid lines) and
$\unicode[STIX]{x1D719}=0.0$
(solid lines) and
 $\unicode[STIX]{x1D719}=1.0$
(dash-dotted lines) at
$\unicode[STIX]{x1D719}=1.0$
(dash-dotted lines) at
 $Re=4200$
: (a)
$Re=4200$
: (a)
 $U(y/h)/U_{l}$
; (b)
$U(y/h)/U_{l}$
; (b)
 $U^{+}(y^{+})$
. Here, black lines, fully developed simulations; red lines, periodic orbit of the edge state.
$U^{+}(y^{+})$
. Here, black lines, fully developed simulations; red lines, periodic orbit of the edge state.

Figure 7. Root mean squared velocity profiles for Poiseuille flow with
 $\unicode[STIX]{x1D719}=0.0$
(solid lines) and
$\unicode[STIX]{x1D719}=0.0$
(solid lines) and
 $\unicode[STIX]{x1D719}=1.0$
(dash-dotted lines) at
$\unicode[STIX]{x1D719}=1.0$
(dash-dotted lines) at
 $Re=4200$
: (a–c)
$Re=4200$
: (a–c)
 $u_{i,rms}(y/h)/U_{l}$
; (d–f)
$u_{i,rms}(y/h)/U_{l}$
; (d–f)
 $u_{i,rms}^{+}(y^{+})$
. Here, black lines, fully developed simulations; red lines, periodic orbit of the edge state.
$u_{i,rms}^{+}(y^{+})$
. Here, black lines, fully developed simulations; red lines, periodic orbit of the edge state.
In figure 6, we plot the mean streamwise velocity profiles of the turbulent state and edge state in both inner and outer units for
 $\unicode[STIX]{x1D719}=0.0$
and 1.0. Their second-order statistics are also plotted in figure 7. As can be expected, there are many similarities in the change in behaviour of the mean turbulent state near the wall for Couette flow and Poiseuille flow (see figure 2 and figure 3). However, we also see many similarities in the effect of the control on the edge state in both flows. For example, their
$\unicode[STIX]{x1D719}=0.0$
and 1.0. Their second-order statistics are also plotted in figure 7. As can be expected, there are many similarities in the change in behaviour of the mean turbulent state near the wall for Couette flow and Poiseuille flow (see figure 2 and figure 3). However, we also see many similarities in the effect of the control on the edge state in both flows. For example, their
 $U^{+}$
profiles are hardly changed by the control (compare figure 6
b with figure 2
b). In Poiseuille flow, the root mean squared velocity fluctuations of the edge state are modified slightly but are also not suppressed to any great extent (figure 7
a–c). Another similarity is that the edge state in plane Poiseuille flow is likewise dominated by streamwise velocity fluctuations (figure 7
d–f). As mentioned above, this explains the lack of drag reduction when the control is applied. Therefore, even though the temporal dynamics of the edge state in plane Poiseuille flow is altered significantly via a period-halving bifurcation, the fact that its mean statistics are not modified to any great extent suggests that, on average, it would not move significantly in phase space as the control amplitude is increased (see also § 3.3.1).
$U^{+}$
profiles are hardly changed by the control (compare figure 6
b with figure 2
b). In Poiseuille flow, the root mean squared velocity fluctuations of the edge state are modified slightly but are also not suppressed to any great extent (figure 7
a–c). Another similarity is that the edge state in plane Poiseuille flow is likewise dominated by streamwise velocity fluctuations (figure 7
d–f). As mentioned above, this explains the lack of drag reduction when the control is applied. Therefore, even though the temporal dynamics of the edge state in plane Poiseuille flow is altered significantly via a period-halving bifurcation, the fact that its mean statistics are not modified to any great extent suggests that, on average, it would not move significantly in phase space as the control amplitude is increased (see also § 3.3.1).
This can be assessed further by plotting the evolution in time of
 $E_{uu}$
and
$E_{uu}$
and
 $E_{vv}$
for
$E_{vv}$
for
 $\unicode[STIX]{x1D719}=0.0$
and 1.0 (figure 8). We see that the oscillatory behaviour of
$\unicode[STIX]{x1D719}=0.0$
and 1.0 (figure 8). We see that the oscillatory behaviour of
 $E_{uu}$
during streak breakdown is also accompanied by oscillations in
$E_{uu}$
during streak breakdown is also accompanied by oscillations in
 $E_{vv}$
. For
$E_{vv}$
. For
 $\unicode[STIX]{x1D719}=1.0$
, these oscillations are noticeably damped (figure 8
b,d) and, as discussed above, the period of the orbit is reduced considerably. Despite this, the qualitative temporal evolution of
$\unicode[STIX]{x1D719}=1.0$
, these oscillations are noticeably damped (figure 8
b,d) and, as discussed above, the period of the orbit is reduced considerably. Despite this, the qualitative temporal evolution of
 $E_{uu}$
during one complete orbit is not significantly different for
$E_{uu}$
during one complete orbit is not significantly different for
 $\unicode[STIX]{x1D719}=0.0$
and 1.0 (figure 8
a,b). However,
$\unicode[STIX]{x1D719}=0.0$
and 1.0 (figure 8
a,b). However,
 $E_{vv}$
becomes more regular and remains almost constant for some time (figure 8
c,d). In terms of turbulent fluctuation energy, the streaks (which are characterised by
$E_{vv}$
becomes more regular and remains almost constant for some time (figure 8
c,d). In terms of turbulent fluctuation energy, the streaks (which are characterised by
 $E_{uu}$
) are the dominant flow feature in the edge state. Since opposition control does not greatly affect their average behaviour, this supports the idea that the edge state does not move in phase space when the control is applied.
$E_{uu}$
) are the dominant flow feature in the edge state. Since opposition control does not greatly affect their average behaviour, this supports the idea that the edge state does not move in phase space when the control is applied.

Figure 8. Evolution of (a,b)
 $E_{uu}$
and (c,d)
$E_{uu}$
and (c,d)
 $E_{vv}$
in time for the periodic edge state in Poiseuille flow: (a,c)
$E_{vv}$
in time for the periodic edge state in Poiseuille flow: (a,c)
 $\unicode[STIX]{x1D719}=0.0$
; (b,d)
$\unicode[STIX]{x1D719}=0.0$
; (b,d)
 $\unicode[STIX]{x1D719}=1.0$
. The point symbols in (a,b) correspond to the flow fields visualised in figure 9.
$\unicode[STIX]{x1D719}=1.0$
. The point symbols in (a,b) correspond to the flow fields visualised in figure 9.
In figure 9, the periodic orbits without control (
 $\unicode[STIX]{x1D719}=0.0$
) and with control (
$\unicode[STIX]{x1D719}=0.0$
) and with control (
 $\unicode[STIX]{x1D719}=1.0$
) are visualised by taking eight snapshots of the flow in each case. In this figure, the isosurfaces of negative
$\unicode[STIX]{x1D719}=1.0$
) are visualised by taking eight snapshots of the flow in each case. In this figure, the isosurfaces of negative
 ${u^{\prime }}^{+}$
and
${u^{\prime }}^{+}$
and
 ${v^{\prime }}^{+}$
denote low-speed streaks and quasi-streamwise vortices, respectively. The flow fields are chosen at roughly analogous points in the two orbits (see point symbols in figure 8
a,b). It is clear that the qualitative flow structure is very similar for both orbits; compare for example the flow visualisations at the point of streak breakdown (figure 9
d,l). From the figure, we can also see that the periodic orbit exhibits some of same visual features as the self-sustaining process, something that has been observed previously in other studies (see e.g. Zammert & Eckhardt Reference Zammert and Eckhardt2014). Take for instance the case of
${v^{\prime }}^{+}$
denote low-speed streaks and quasi-streamwise vortices, respectively. The flow fields are chosen at roughly analogous points in the two orbits (see point symbols in figure 8
a,b). It is clear that the qualitative flow structure is very similar for both orbits; compare for example the flow visualisations at the point of streak breakdown (figure 9
d,l). From the figure, we can also see that the periodic orbit exhibits some of same visual features as the self-sustaining process, something that has been observed previously in other studies (see e.g. Zammert & Eckhardt Reference Zammert and Eckhardt2014). Take for instance the case of
 $\unicode[STIX]{x1D719}=0.0$
(figure 9
a–h): in figure 9(a), we see a well-defined low-speed streak that has formed across the spanwise-periodic boundary condition and its corresponding quasi-streamwise vortex in the domain centre; the streak slowly becomes smaller and more meandering, which is indicative of streak instability (figure 9
b,c); next, the streak and vortex break down, at which point the streak is seen to reside briefly in the centre of the domain (figure 9
d,e); the streak and vortex, however, quickly reform in their original locations (figure 9
f,g); and, in figure 9(h), the cycle starts again. A very similar process can be observed for
$\unicode[STIX]{x1D719}=0.0$
(figure 9
a–h): in figure 9(a), we see a well-defined low-speed streak that has formed across the spanwise-periodic boundary condition and its corresponding quasi-streamwise vortex in the domain centre; the streak slowly becomes smaller and more meandering, which is indicative of streak instability (figure 9
b,c); next, the streak and vortex break down, at which point the streak is seen to reside briefly in the centre of the domain (figure 9
d,e); the streak and vortex, however, quickly reform in their original locations (figure 9
f,g); and, in figure 9(h), the cycle starts again. A very similar process can be observed for
 $\unicode[STIX]{x1D719}=1.0$
. The main difference in the periodic orbit with
$\unicode[STIX]{x1D719}=1.0$
. The main difference in the periodic orbit with
 $\unicode[STIX]{x1D719}=1.0$
is that the high-frequency event after the interval of slowly decreasing
$\unicode[STIX]{x1D719}=1.0$
is that the high-frequency event after the interval of slowly decreasing
 $E_{uu}$
and
$E_{uu}$
and
 $E_{vv}$
that is present for
$E_{vv}$
that is present for
 $\unicode[STIX]{x1D719}=0.0$
is damped significantly by the control (see figure 8). At the start of this high-frequency event (which takes place between figures 9
d and 9
e), the streak and vortex break down. They then briefly reform, rapidly break down, and then finally reform again at the start of the next period. This brief interval in which we temporarily observe a second streak and vortex is the same interval that we note above gets longer as the control amplitude is increased (see dotted line in figure 5
a). Therefore, this suggests that the control stabilises the second streak, allows it to persist for a longer time and then damps its eventual breakdown. As mentioned before, this continues until approximately
$\unicode[STIX]{x1D719}=0.0$
is damped significantly by the control (see figure 8). At the start of this high-frequency event (which takes place between figures 9
d and 9
e), the streak and vortex break down. They then briefly reform, rapidly break down, and then finally reform again at the start of the next period. This brief interval in which we temporarily observe a second streak and vortex is the same interval that we note above gets longer as the control amplitude is increased (see dotted line in figure 5
a). Therefore, this suggests that the control stabilises the second streak, allows it to persist for a longer time and then damps its eventual breakdown. As mentioned before, this continues until approximately
 $\unicode[STIX]{x1D719}=0.5$
, at which point both sets of streaks and vortices undergo exactly the same process.
$\unicode[STIX]{x1D719}=0.5$
, at which point both sets of streaks and vortices undergo exactly the same process.
Even though the above behaviour is qualitatively similar to the self-sustaining process, there are some important differences. Firstly, as shown in figure 7, the strength of the
 $v$
and
$v$
and
 $w$
fluctuations of the fully developed simulations are much higher than that of the edge state. This is why the edge state is only regularised by the control rather than suppressed by it, which is the case for the self-sustaining process (Lim & Kim Reference Lim and Kim2004). Finally, it should be noted that streak instability and breakdown in the turbulent state occur over a much shorter time than the very long periods of instability observed in the edge state here (Hwang & Bengana Reference Hwang and Bengana2016).
$w$
fluctuations of the fully developed simulations are much higher than that of the edge state. This is why the edge state is only regularised by the control rather than suppressed by it, which is the case for the self-sustaining process (Lim & Kim Reference Lim and Kim2004). Finally, it should be noted that streak instability and breakdown in the turbulent state occur over a much shorter time than the very long periods of instability observed in the edge state here (Hwang & Bengana Reference Hwang and Bengana2016).

Figure 9. Flow visualisation of the edge state in Poiseuille flow for (a–h)
 $\unicode[STIX]{x1D719}=0.0$
and (i–p)
$\unicode[STIX]{x1D719}=0.0$
and (i–p)
 $\unicode[STIX]{x1D719}=1.0$
: (a–h) correspond to the eight points highlighted in figure 8(a); (i–p) correspond to those in figure 8(b). The cyan isosurfaces indicate
$\unicode[STIX]{x1D719}=1.0$
: (a–h) correspond to the eight points highlighted in figure 8(a); (i–p) correspond to those in figure 8(b). The cyan isosurfaces indicate
 ${u^{\prime }}^{+}=-3$
, while the red isosurfaces indicate
${u^{\prime }}^{+}=-3$
, while the red isosurfaces indicate
 ${v^{\prime }}^{+}=-0.22$
.
${v^{\prime }}^{+}=-0.22$
.
3.3 Phase-space dynamics and lifetimes statistics with opposition control
3.3.1 Phase-space dynamics of Couette and Poiseuille flow
We will now discuss how opposition control affects the overall phase-space dynamics of Couette flow and Poiseuille flow. We have already alluded to this in § 3.1, where we comment on the movement of the upper- and lower-branch equilibrium solutions in Couette flow in the
 $C_{f}$
–
$C_{f}$
–
 $Re$
diagram (figure 1), and in § 3.2, where we discuss the change in the temporal dynamics of the edge state in plane Poiseuille flow in the
$Re$
diagram (figure 1), and in § 3.2, where we discuss the change in the temporal dynamics of the edge state in plane Poiseuille flow in the
 $E_{uu}$
–
$E_{uu}$
–
 $E_{vv}$
plane (figure 5) as the control is applied. The key point is that it would appear that the edge state and lower-branch solutions move very little in phase space, whereas the upper-branch solution and mean turbulent state move considerably.
$E_{vv}$
plane (figure 5) as the control is applied. The key point is that it would appear that the edge state and lower-branch solutions move very little in phase space, whereas the upper-branch solution and mean turbulent state move considerably.
We investigate this further by projecting both systems onto two simple phase portraits:
 $(I,D)$
space and
$(I,D)$
space and
 $(E_{uu},E_{vv})$
space.
$(E_{uu},E_{vv})$
space.
 $I$
and
$I$
and
 $D$
are the energy input and dissipation of the system, respectively. In Couette flow, the energy input is defined as
$D$
are the energy input and dissipation of the system, respectively. In Couette flow, the energy input is defined as
 $$\begin{eqnarray}\displaystyle I & = & \displaystyle \frac{\unicode[STIX]{x1D708}U_{w}}{V_{d}}\int _{0}^{L_{x}}\int _{0}^{L_{z}}\left.\frac{\unicode[STIX]{x2202}u}{\unicode[STIX]{x2202}y}\right|_{y=0}+\left.\frac{\unicode[STIX]{x2202}u}{\unicode[STIX]{x2202}y}\right|_{y=2h}\,\text{d}x\,\text{d}z\nonumber\\ \displaystyle & & \displaystyle +\,\frac{1}{V_{d}}\int _{0}^{L_{x}}\int _{0}^{L_{z}}\left.\left(vp+\frac{v^{3}}{2}\right)\right|_{y=0}-\left.\left(vp+\frac{v^{3}}{2}\right)\right|_{y=2h}\,\text{d}x\,\text{d}z,\end{eqnarray}$$
while, in plane Poiseuille flow with a symmetric boundary condition at
 $y=h$
, it is given by
$y=h$
, it is given by
 $$\begin{eqnarray}I=\frac{\unicode[STIX]{x1D708}U_{m}}{V_{d}}\int _{0}^{L_{x}}\int _{0}^{L_{z}}\left.\frac{\unicode[STIX]{x2202}u}{\unicode[STIX]{x2202}y}\right|_{y=0}\,\text{d}x\,\text{d}z+\frac{1}{V_{d}}\int _{0}^{L_{x}}\int _{0}^{L_{z}}\left.\left(vp+\frac{v^{3}}{2}\right)\right|_{y=0}\,\text{d}x\,\text{d}z.\end{eqnarray}$$
In both cases, the dissipation is given by
 $$\begin{eqnarray}D=\frac{\unicode[STIX]{x1D708}}{V_{d}}\int _{\unicode[STIX]{x1D6FA}_{d}}\frac{\unicode[STIX]{x2202}u_{i}}{\unicode[STIX]{x2202}x_{j}}\frac{\unicode[STIX]{x2202}u_{i}}{\unicode[STIX]{x2202}x_{j}}\,\text{d}V\end{eqnarray}$$
for
 $j=1,2,3$
, where
$j=1,2,3$
, where
 $x_{1}$
,
$x_{1}$
,
 $x_{2}$
and
$x_{2}$
and
 $x_{3}$
are
$x_{3}$
are
 $x$
,
$x$
,
 $y$
and
$y$
and
 $z$
, respectively. We note that the second term in the right-hand side of each of (3.1a
) and (3.1b
) is the energy input by opposition control, and its contribution is found to be typically less than only a few per cent of the total energy input for all the states examined. If we define the total energy of the system as
$z$
, respectively. We note that the second term in the right-hand side of each of (3.1a
) and (3.1b
) is the energy input by opposition control, and its contribution is found to be typically less than only a few per cent of the total energy input for all the states examined. If we define the total energy of the system as
 $E=[1/(2V_{d})]\int _{\unicode[STIX]{x1D6FA}_{d}}u_{i}u_{i}\,\text{d}V$
,
$E=[1/(2V_{d})]\int _{\unicode[STIX]{x1D6FA}_{d}}u_{i}u_{i}\,\text{d}V$
,
 $I$
and
$I$
and
 $D$
must satisfy
$D$
must satisfy
 $\text{d}E/\text{d}t=I-D$
and their long-term averages must be equal in wall-bounded shear flows. Here, it is not difficult to realise that
$\text{d}E/\text{d}t=I-D$
and their long-term averages must be equal in wall-bounded shear flows. Here, it is not difficult to realise that
 $I$
is basically the sum of the instantaneous skin friction (especially for Poiseuille flow, where the mass flux in the simulations is constant). Therefore, both
$I$
is basically the sum of the instantaneous skin friction (especially for Poiseuille flow, where the mass flux in the simulations is constant). Therefore, both
 $I$
and
$I$
and
 $D$
, when averaged in time, should be representative of the time-averaged skin friction.
$D$
, when averaged in time, should be representative of the time-averaged skin friction.

Figure 10. Phase portrait of Couette flow at
 $Re=400$
with
$Re=400$
with
 $\unicode[STIX]{x1D719}=0.0$
(dotted lines/open symbols) and
$\unicode[STIX]{x1D719}=0.0$
(dotted lines/open symbols) and
 $\unicode[STIX]{x1D719}=1.0$
(solid lines/closed symbols):
$\unicode[STIX]{x1D719}=1.0$
(solid lines/closed symbols):
 $(a)$
$(a)$
 $I/I_{l,ref}$
versus
$I/I_{l,ref}$
versus
 $D/D_{l,ref}$
, where
$D/D_{l,ref}$
, where
 $I_{l,ref}$
and
$I_{l,ref}$
and
 $D_{l,ref}$
are the corresponding energy input and dissipation of the uncontrolled laminar flow at the same Reynolds number; (b)
$D_{l,ref}$
are the corresponding energy input and dissipation of the uncontrolled laminar flow at the same Reynolds number; (b)
 $E_{uu}$
versus
$E_{uu}$
versus
 $E_{vv}$
. Here, cyan lines, fully developed simulations; circles, mean turbulent state; diamonds, upper-branch equilibrium solution; triangles, lower-branch equilibrium solution.
$E_{vv}$
. Here, cyan lines, fully developed simulations; circles, mean turbulent state; diamonds, upper-branch equilibrium solution; triangles, lower-branch equilibrium solution.
In figure 10, we show the
 $I$
–
$I$
–
 $D$
and
$D$
and
 $E_{uu}$
–
$E_{uu}$
–
 $E_{vv}$
phase portraits of Couette flow. The upper- and lower-branch equilibrium solutions, the mean turbulent state, and a typical turbulent trajectory are plotted for
$E_{vv}$
phase portraits of Couette flow. The upper- and lower-branch equilibrium solutions, the mean turbulent state, and a typical turbulent trajectory are plotted for
 $\unicode[STIX]{x1D719}=0.0$
and
$\unicode[STIX]{x1D719}=0.0$
and
 $\unicode[STIX]{x1D719}=1.0$
. It is not surprising then that the lower-branch solution does not move in
$\unicode[STIX]{x1D719}=1.0$
. It is not surprising then that the lower-branch solution does not move in
 $I$
–
$I$
–
 $D$
phase space when the control is applied (figure 10
a), since very little reduction in skin friction is observed. The upper-branch equilibrium solution and mean turbulent state, however, move much closer to the edge state. Note also that the turbulent trajectory occupies a smaller region in phase space when the control is applied; the r.m.s. fluctuations of
$D$
phase space when the control is applied (figure 10
a), since very little reduction in skin friction is observed. The upper-branch equilibrium solution and mean turbulent state, however, move much closer to the edge state. Note also that the turbulent trajectory occupies a smaller region in phase space when the control is applied; the r.m.s. fluctuations of
 $I$
and
$I$
and
 $D$
are reduced by approximately 45 % and 27 %, respectively. Furthermore, in
$D$
are reduced by approximately 45 % and 27 %, respectively. Furthermore, in
 $E_{uu}$
–
$E_{uu}$
–
 $E_{vv}$
phase space (figure 10
b), we see a similar situation: the lower-branch solution moves very little, and the upper-branch solution and mean turbulent state move much closer to the origin when the control is applied. The slight increase in
$E_{vv}$
phase space (figure 10
b), we see a similar situation: the lower-branch solution moves very little, and the upper-branch solution and mean turbulent state move much closer to the origin when the control is applied. The slight increase in
 $E_{vv}$
in the case of the lower-branch solution with
$E_{vv}$
in the case of the lower-branch solution with
 $\unicode[STIX]{x1D719}=1.0$
is due to the fact that the control imparts energy on the flow through blowing and suction of wall-normal velocity at the wall, as can be seen from (3.1a
), but does not cause a reduction in
$\unicode[STIX]{x1D719}=1.0$
is due to the fact that the control imparts energy on the flow through blowing and suction of wall-normal velocity at the wall, as can be seen from (3.1a
), but does not cause a reduction in
 $v$
velocity fluctuations near the wall (figure 3). As discussed previously, this explains why there is no noticeable decrease in drag (table 2) and ultimately results in an increase in
$v$
velocity fluctuations near the wall (figure 3). As discussed previously, this explains why there is no noticeable decrease in drag (table 2) and ultimately results in an increase in
 $E_{vv}$
. However, in the case of the upper-branch solution and turbulent state, which see a significant decrease in drag, the energy input from the control is outweighed by the subsequent reduction in
$E_{vv}$
. However, in the case of the upper-branch solution and turbulent state, which see a significant decrease in drag, the energy input from the control is outweighed by the subsequent reduction in
 $v$
velocity fluctuations near the wall, which results in a net decrease in
$v$
velocity fluctuations near the wall, which results in a net decrease in
 $E_{vv}$
.
$E_{vv}$
.
Figure 11 shows the
 $I$
–
$I$
–
 $D$
and
$D$
and
 $E_{uu}$
–
$E_{uu}$
–
 $E_{vv}$
phase portraits of plane Poiseuille flow with and without control. The edge state, which consists of a periodic orbit in this case (see § 3.2), is plotted, along with its mean location in phase space. Again, we also plot the mean turbulent state and a typical turbulent trajectory. The change in behaviour of the system in
$E_{vv}$
phase portraits of plane Poiseuille flow with and without control. The edge state, which consists of a periodic orbit in this case (see § 3.2), is plotted, along with its mean location in phase space. Again, we also plot the mean turbulent state and a typical turbulent trajectory. The change in behaviour of the system in
 $I$
–
$I$
–
 $D$
space when the control is applied (figure 11
a) is similar to that of Couette flow (see figure 10
a): the mean location of the edge state moves very slightly, but the mean turbulent state moves much closer to it. We also observe that the turbulent trajectory again occupies a smaller region of phase space and that the mean turbulent state is manipulated more than the edge state by the control in
$D$
space when the control is applied (figure 11
a) is similar to that of Couette flow (see figure 10
a): the mean location of the edge state moves very slightly, but the mean turbulent state moves much closer to it. We also observe that the turbulent trajectory again occupies a smaller region of phase space and that the mean turbulent state is manipulated more than the edge state by the control in
 $E_{uu}$
–
$E_{uu}$
–
 $E_{vv}$
phase space (figure 11
b). For the turbulent state in Poiseuille flow with
$E_{vv}$
phase space (figure 11
b). For the turbulent state in Poiseuille flow with
 $\unicode[STIX]{x1D719}=1.0$
, the r.m.s. fluctuations of
$\unicode[STIX]{x1D719}=1.0$
, the r.m.s. fluctuations of
 $I$
and
$I$
and
 $D$
fall by 49 % and 39 %, respectively, when compared to the turbulent state with
$D$
fall by 49 % and 39 %, respectively, when compared to the turbulent state with
 $\unicode[STIX]{x1D719}=0.0$
.
$\unicode[STIX]{x1D719}=0.0$
.
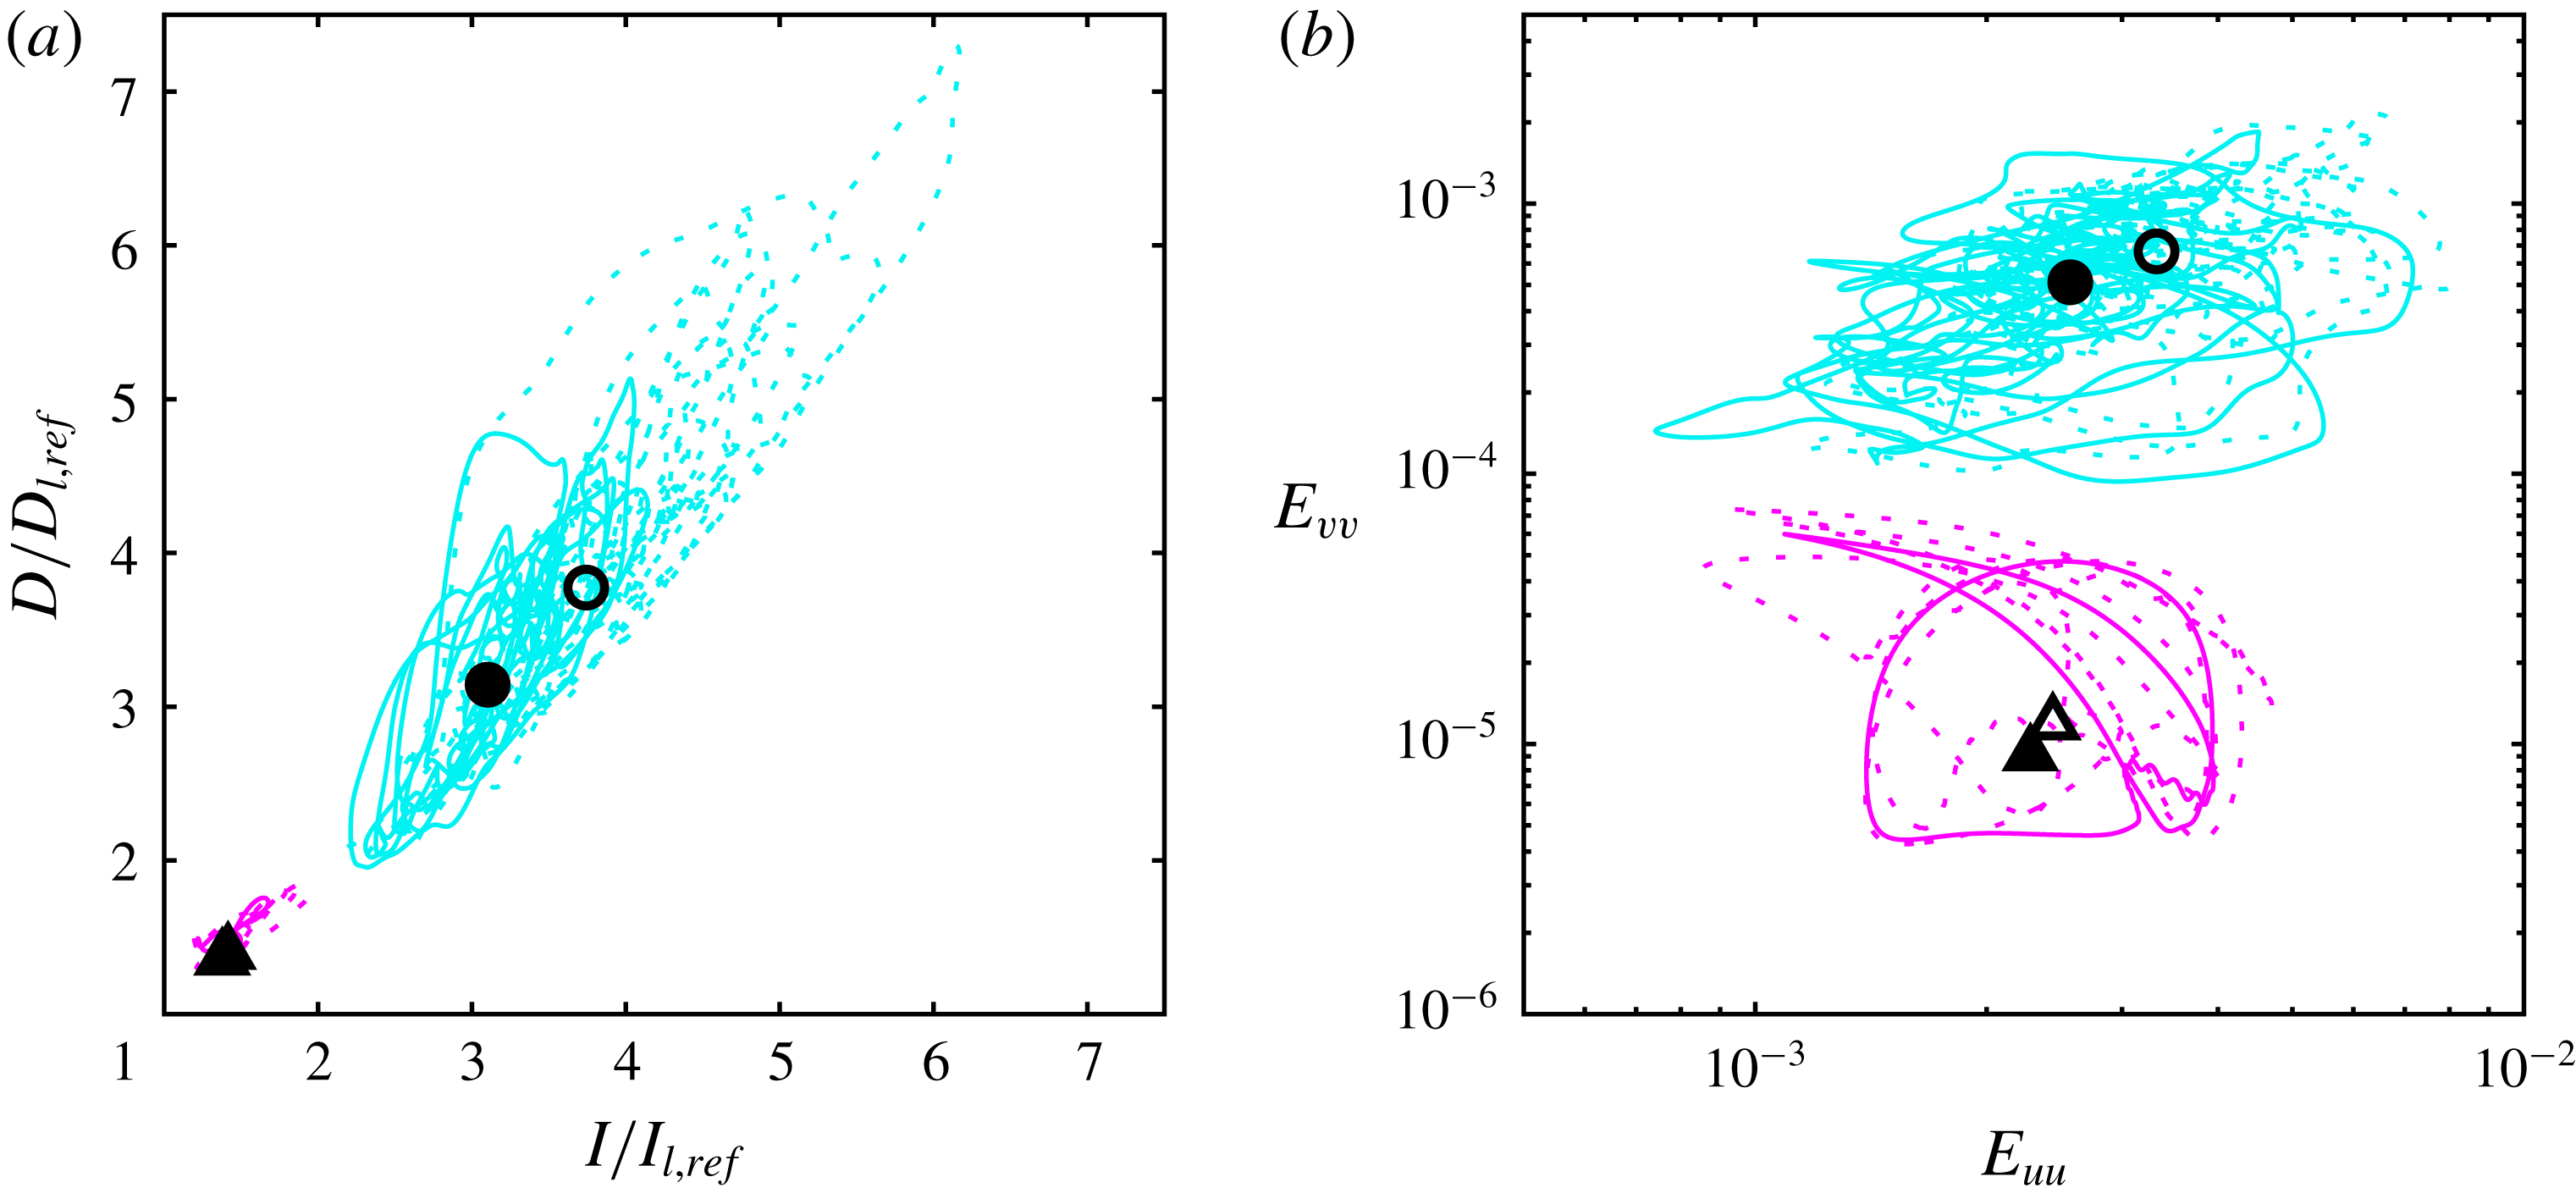
Figure 11. Phase portrait of Poiseuille flow at
 $Re=4200$
with
$Re=4200$
with
 $\unicode[STIX]{x1D719}=0.0$
(dotted lines/open symbols) and
$\unicode[STIX]{x1D719}=0.0$
(dotted lines/open symbols) and
 $\unicode[STIX]{x1D719}=1.0$
(solid lines/closed symbols): (a)
$\unicode[STIX]{x1D719}=1.0$
(solid lines/closed symbols): (a)
 $I/I_{l,ref}$
versus
$I/I_{l,ref}$
versus
 $D/D_{l,ref}$
, where
$D/D_{l,ref}$
, where
 $I_{l,ref}$
and
$I_{l,ref}$
and
 $D_{l,ref}$
are the corresponding energy input and dissipation of the uncontrolled laminar flow at the same Reynolds number; (b)
$D_{l,ref}$
are the corresponding energy input and dissipation of the uncontrolled laminar flow at the same Reynolds number; (b)
 $E_{uu}$
versus
$E_{uu}$
versus
 $E_{vv}$
. Here, cyan lines, fully developed simulations; magenta lines, edge state; circles, mean turbulent state; triangles, mean of the edge state.
$E_{vv}$
. Here, cyan lines, fully developed simulations; magenta lines, edge state; circles, mean turbulent state; triangles, mean of the edge state.
As discussed above, the upper-branch equilibrium solution is an element forming the ‘skeleton’ of the turbulent trajectory in phase space. These equilibria are unstable by nature. In both plane Couette flow and Poiseuille flow, we see that not only does the mean turbulent state move closer to the edge state but also the fluctuations in
 $I$
and
$I$
and
 $D$
about this mean are noticeably reduced. This suggests that the stability of the upper-branch solution is also modified in some way by the control such that it may become less ‘repelling’ in phase space. In order to analyse this, we examine the eigenvalues of the equilibrium solutions, which are computed by Arnoldi iteration (see § 2.2.1). Figure 12 shows how the eigenvalues of the lower- and upper-branch solutions change when the control is applied. Firstly, as we would expect, the eigenvalues for the lower-branch solution (figure 12
a) are modified very little. In particular, the one unstable eigenvalue is not modified at all. For the upper-branch solution (figure 12
b), we see a much more significant change in the eigenvalues and the real part of the leading unstable eigenvalue is reduced by almost a half. This implies that the repelling strength of the upper-branch solution is indeed reduced by the control as the turbulent trajectory approaches it in phase space. Therefore, this would explain why we observe a significant reduction in
$D$
about this mean are noticeably reduced. This suggests that the stability of the upper-branch solution is also modified in some way by the control such that it may become less ‘repelling’ in phase space. In order to analyse this, we examine the eigenvalues of the equilibrium solutions, which are computed by Arnoldi iteration (see § 2.2.1). Figure 12 shows how the eigenvalues of the lower- and upper-branch solutions change when the control is applied. Firstly, as we would expect, the eigenvalues for the lower-branch solution (figure 12
a) are modified very little. In particular, the one unstable eigenvalue is not modified at all. For the upper-branch solution (figure 12
b), we see a much more significant change in the eigenvalues and the real part of the leading unstable eigenvalue is reduced by almost a half. This implies that the repelling strength of the upper-branch solution is indeed reduced by the control as the turbulent trajectory approaches it in phase space. Therefore, this would explain why we observe a significant reduction in
 $I$
and
$I$
and
 $D$
fluctuations in both Couette flow and Poiseuille flow for the
$D$
fluctuations in both Couette flow and Poiseuille flow for the
 $\unicode[STIX]{x1D719}=1.0$
case. The number of unstable eigenvalues with and without control could also be related to the reduction in
$\unicode[STIX]{x1D719}=1.0$
case. The number of unstable eigenvalues with and without control could also be related to the reduction in
 $I$
and
$I$
and
 $D$
fluctuations of the turbulent state. Fewer unstable eigenvalues would imply fewer possible trajectories away from the upper-branch solution, which could also cause a reduction in the
$D$
fluctuations of the turbulent state. Fewer unstable eigenvalues would imply fewer possible trajectories away from the upper-branch solution, which could also cause a reduction in the
 $I$
and
$I$
and
 $D$
fluctuations. For
$D$
fluctuations. For
 $\unicode[STIX]{x1D719}=0.0$
there is one real unstable eigenvalue and ten complex conjugate pairs of unstable eigenvalues for the upper-branch equilibrium solution, whereas for
$\unicode[STIX]{x1D719}=0.0$
there is one real unstable eigenvalue and ten complex conjugate pairs of unstable eigenvalues for the upper-branch equilibrium solution, whereas for
 $\unicode[STIX]{x1D719}=1.0$
there are just ten complex conjugate pairs of unstable eigenvalues. Therefore, this is clearly only a weak effect. As a final point, in figure 13, we plot the change in the eigenvalues of the upper-branch solution without control as the Reynolds number is reduced from
$\unicode[STIX]{x1D719}=1.0$
there are just ten complex conjugate pairs of unstable eigenvalues. Therefore, this is clearly only a weak effect. As a final point, in figure 13, we plot the change in the eigenvalues of the upper-branch solution without control as the Reynolds number is reduced from
 $Re=400$
to 300 and note that the leading unstable eigenvalues also reduce in magnitude. This similarity suggests that the control also somewhat regularises the behaviour of the turbulent trajectory in phase space as well as the edge state.
$Re=400$
to 300 and note that the leading unstable eigenvalues also reduce in magnitude. This similarity suggests that the control also somewhat regularises the behaviour of the turbulent trajectory in phase space as well as the edge state.

Figure 12. Eigenspectra of equilibrium solutions of Couette flow at
 $Re=400$
with
$Re=400$
with
 $\unicode[STIX]{x1D719}=0.0$
(open symbols) and
$\unicode[STIX]{x1D719}=0.0$
(open symbols) and
 $\unicode[STIX]{x1D719}=1.0$
(closed symbols): (a) lower-branch solution; (b) upper-branch solution. In each case, the 20 most unstable eigenvalues are shown.
$\unicode[STIX]{x1D719}=1.0$
(closed symbols): (a) lower-branch solution; (b) upper-branch solution. In each case, the 20 most unstable eigenvalues are shown.

Figure 13. Eigenspectra of upper-branch equilibrium solution of Couette flow at
 $Re=400$
(open symbols) and
$Re=400$
(open symbols) and
 $Re=300$
(closed symbols) with
$Re=300$
(closed symbols) with
 $\unicode[STIX]{x1D719}=0.0$
for comparison with figure 12. In each case, the 20 most unstable eigenvalues are shown.
$\unicode[STIX]{x1D719}=0.0$
for comparison with figure 12. In each case, the 20 most unstable eigenvalues are shown.
3.3.2 Lifetime statistics of Couette and Poiseuille flow
Thus far, we have observed that the upper-branch equilibrium solution and mean turbulent state gradually approach the edge state as the control amplitude is increased. We note that this observation is made only with two simple state-space projections (i.e. the
 $I$
–
$I$
–
 $D$
and
$D$
and
 $E_{uu}$
–
$E_{uu}$
–
 $E_{vv}$
phase spaces). Given the very high-dimensional nature of the present systems, these projections are evidently not ideal, and, as such, it may be possible to define a better, higher-dimensional state-space projection or relevant measure of the distance between two states. However, it should also be pointed out that the introduction of another state-space projection does not necessarily provide any new physical insight into the dynamics of the turbulent state, because the choice of any such projection would contain a certain degree of ‘arbitrariness’. For this reason, here, we aim to study the statistical features of turbulence that would be directly relevant to the physical implication of the reduced distance between the turbulent state and the edge of turbulence.
$E_{vv}$
phase spaces). Given the very high-dimensional nature of the present systems, these projections are evidently not ideal, and, as such, it may be possible to define a better, higher-dimensional state-space projection or relevant measure of the distance between two states. However, it should also be pointed out that the introduction of another state-space projection does not necessarily provide any new physical insight into the dynamics of the turbulent state, because the choice of any such projection would contain a certain degree of ‘arbitrariness’. For this reason, here, we aim to study the statistical features of turbulence that would be directly relevant to the physical implication of the reduced distance between the turbulent state and the edge of turbulence.
Since the edge of turbulence is not compact in phase space, the reduced distance in phase space between the turbulent state and the edge state observed in the previous sections indicates that opposition control may increase the probability of escaping from the turbulent state, which takes the form of a chaotic saddle. In other words, the control may increase the probability of laminarisation. Therefore, the final step in the present study is to assess how opposition control alters the turbulence lifetime statistics of Couette flow and Poiseuille flow, bearing in mind the change in their phase-space dynamics. We generate 100 different turbulent flow fields for both Couette flow and Poiseuille flow by running long simulations at a slightly elevated Reynolds number (
 $Re=415$
for Couette flow and
$Re=415$
for Couette flow and
 $Re=4350$
for Poiseuille flow) and then taking snapshots of the flow field at regular intervals. In each case, these 100 flow fields are used as initial conditions for a turbulence lifetime study at the nominal Reynolds numbers given in table 1. The temporal evolution of the initial conditions are tracked up to
$Re=4350$
for Poiseuille flow) and then taking snapshots of the flow field at regular intervals. In each case, these 100 flow fields are used as initial conditions for a turbulence lifetime study at the nominal Reynolds numbers given in table 1. The temporal evolution of the initial conditions are tracked up to
 $t=5000h/U_{ref}$
for the five different control amplitudes
$t=5000h/U_{ref}$
for the five different control amplitudes
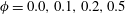 $\unicode[STIX]{x1D719}=0.0,0.1,0.2,0.5$
and 1.0. We then determine the time it takes for each flow field to decay to the laminar solution (if at all) by defining a threshold of the cross-flow turbulent fluctuation energy below which turbulence cannot be recovered. In other words, the lifetime of a given initial condition is defined as the time taken for the flow to satisfy
$\unicode[STIX]{x1D719}=0.0,0.1,0.2,0.5$
and 1.0. We then determine the time it takes for each flow field to decay to the laminar solution (if at all) by defining a threshold of the cross-flow turbulent fluctuation energy below which turbulence cannot be recovered. In other words, the lifetime of a given initial condition is defined as the time taken for the flow to satisfy
 $(E_{vv}+E_{ww})<\unicode[STIX]{x1D716}$
. We choose
$(E_{vv}+E_{ww})<\unicode[STIX]{x1D716}$
. We choose
 $\unicode[STIX]{x1D716}=10^{-4}$
and
$\unicode[STIX]{x1D716}=10^{-4}$
and
 $10^{-5}$
for Couette flow and Poiseuille flow, respectively. It is then possible to compute the probability of turbulence as a function of time for each value of
$10^{-5}$
for Couette flow and Poiseuille flow, respectively. It is then possible to compute the probability of turbulence as a function of time for each value of
 $\unicode[STIX]{x1D719}$
. This is defined as the fraction of the 100 initial flow fields that remain turbulent at a given time instant up to
$\unicode[STIX]{x1D719}$
. This is defined as the fraction of the 100 initial flow fields that remain turbulent at a given time instant up to
 $t=5000h/U_{ref}$
.
$t=5000h/U_{ref}$
.
The results are plotted on semi-logarithmic axes in figure 14 for both flows. For the
 $\unicode[STIX]{x1D719}=0.0$
case in both Couette flow (figure 14
a) and Poiseuille flow (figure 14
b), we see an initial region that depends on the nature of the initial conditions, followed by an approximately exponential distribution that is characteristic of turbulence lifetimes (Eckhardt et al.
Reference Eckhardt, Schneider, Hof and Westerweel2007). This verifies that the sample of 100 initial conditions used in this turbulence lifetimes study is sufficiently large and varied in each case. The first point to note is that the control has a very similar effect on the lifetime statistics of both flows: in general, as the control amplitude is increased, the probability of turbulence at a given time decreases. This change is small for lower amplitudes of control and more pronounced at
$\unicode[STIX]{x1D719}=0.0$
case in both Couette flow (figure 14
a) and Poiseuille flow (figure 14
b), we see an initial region that depends on the nature of the initial conditions, followed by an approximately exponential distribution that is characteristic of turbulence lifetimes (Eckhardt et al.
Reference Eckhardt, Schneider, Hof and Westerweel2007). This verifies that the sample of 100 initial conditions used in this turbulence lifetimes study is sufficiently large and varied in each case. The first point to note is that the control has a very similar effect on the lifetime statistics of both flows: in general, as the control amplitude is increased, the probability of turbulence at a given time decreases. This change is small for lower amplitudes of control and more pronounced at
 $\unicode[STIX]{x1D719}=1.0$
. Interestingly, the effect of increasing the control amplitude is similar to the effect of decreasing the Reynolds number, indicating again that opposition control regularises the turbulent state as well as reducing its drag. It would seem, therefore, that this progressive decrease in turbulence lifetimes is related to the gradual approach of the upper-branch equilibrium solution and mean turbulent state towards the edge state in phase space as the control amplitude is increased.
$\unicode[STIX]{x1D719}=1.0$
. Interestingly, the effect of increasing the control amplitude is similar to the effect of decreasing the Reynolds number, indicating again that opposition control regularises the turbulent state as well as reducing its drag. It would seem, therefore, that this progressive decrease in turbulence lifetimes is related to the gradual approach of the upper-branch equilibrium solution and mean turbulent state towards the edge state in phase space as the control amplitude is increased.

Figure 14. Probability of turbulence as a function of time for various control amplitudes: (a) Couette flow at
 $Re=400$
; (b) Poiseuille flow at
$Re=400$
; (b) Poiseuille flow at
 $Re=4200$
.
$Re=4200$
.

Figure 15. Variation of (a)
 $\unicode[STIX]{x0394}D_{1}$
and (b)
$\unicode[STIX]{x0394}D_{1}$
and (b)
 $\unicode[STIX]{x0394}D_{2}$
with
$\unicode[STIX]{x0394}D_{2}$
with
 $\unicode[STIX]{x1D719}$
. Here, circles, Couette flow at
$\unicode[STIX]{x1D719}$
. Here, circles, Couette flow at
 $Re=400$
; triangles, Poiseuille flow at
$Re=400$
; triangles, Poiseuille flow at
 $Re=4200$
:
$Re=4200$
:
 $\unicode[STIX]{x0394}D_{1}$
and
$\unicode[STIX]{x0394}D_{1}$
and
 $\unicode[STIX]{x0394}D_{2}$
are defined by (3.2a
) and (3.2b
), respectively.
$\unicode[STIX]{x0394}D_{2}$
are defined by (3.2a
) and (3.2b
), respectively.
At first glance, it might seem obvious that this would increase the likelihood of the turbulent trajectory passing through the edge state and decaying to the laminar solution. However, as discussed in § 3.3.1, the fluctuations of the turbulent state about its mean in the
 $I$
–
$I$
–
 $D$
plane seem also to be reduced by the control, which would actually reduce the probability of the solution passing through the edge state (or increase the probability of turbulence in time). Therefore, we further investigate this by calculating the distance between the turbulent trajectory and the edge state in terms of the dissipation,
$D$
plane seem also to be reduced by the control, which would actually reduce the probability of the solution passing through the edge state (or increase the probability of turbulence in time). Therefore, we further investigate this by calculating the distance between the turbulent trajectory and the edge state in terms of the dissipation,
 $D$
. We define two parameters:
$D$
. We define two parameters:
 $$\begin{eqnarray}\unicode[STIX]{x0394}D_{1}=D_{mean}-D_{edge},\end{eqnarray}$$
where
 $D_{mean}$
is the mean dissipation of the turbulent state and
$D_{mean}$
is the mean dissipation of the turbulent state and
 $D_{edge}$
is the mean dissipation of the edge state, and
$D_{edge}$
is the mean dissipation of the edge state, and
 $$\begin{eqnarray}\unicode[STIX]{x0394}D_{2}=(D_{mean}-D_{rms})-D_{edge},\end{eqnarray}$$
where
 $D_{rms}$
is the root mean squared fluctuation of the dissipation of the turbulent state. The expression (3.2a
) corresponds to the distance in
$D_{rms}$
is the root mean squared fluctuation of the dissipation of the turbulent state. The expression (3.2a
) corresponds to the distance in
 $D$
space between the mean turbulent state and the edge state. As we have seen (figure 10
a; figure 11
a), this should decrease on increasing
$D$
space between the mean turbulent state and the edge state. As we have seen (figure 10
a; figure 11
a), this should decrease on increasing
 $\unicode[STIX]{x1D719}$
. By taking into account the magnitude of the fluctuations of the turbulent state about its mean, equation (3.2b
) is therefore a representation of the shortest possible distance in
$\unicode[STIX]{x1D719}$
. By taking into account the magnitude of the fluctuations of the turbulent state about its mean, equation (3.2b
) is therefore a representation of the shortest possible distance in
 $D$
space between the edge state and the turbulent trajectory. This gives a more complete description of the actual proximity of the two states in phase space.
$D$
space between the edge state and the turbulent trajectory. This gives a more complete description of the actual proximity of the two states in phase space.
In figure 15, we show the variation in
 $\unicode[STIX]{x0394}D_{1}$
and
$\unicode[STIX]{x0394}D_{1}$
and
 $\unicode[STIX]{x0394}D_{2}$
with the control amplitude for Couette flow and Poiseuille flow. What we see is that both
$\unicode[STIX]{x0394}D_{2}$
with the control amplitude for Couette flow and Poiseuille flow. What we see is that both
 $\unicode[STIX]{x0394}D_{1}$
and
$\unicode[STIX]{x0394}D_{1}$
and
 $\unicode[STIX]{x0394}D_{2}$
decrease considerably as the control amplitude is increased. This verifies that not only does the turbulent trajectory reside closer to the edge state on average for larger
$\unicode[STIX]{x0394}D_{2}$
decrease considerably as the control amplitude is increased. This verifies that not only does the turbulent trajectory reside closer to the edge state on average for larger
 $\unicode[STIX]{x1D719}$
, but also that the shortest distance between the two states is significantly reduced. This occurs despite the fluctuations being damped by the control and explains more precisely why the probability of turbulence decreases as the control amplitude increases.
$\unicode[STIX]{x1D719}$
, but also that the shortest distance between the two states is significantly reduced. This occurs despite the fluctuations being damped by the control and explains more precisely why the probability of turbulence decreases as the control amplitude increases.
4 Concluding remarks
The main findings of the present study are now summarised:
(i) We investigate the effect of opposition control on the upper- and lower-branch equilibrium solutions (exact coherent structures) in Couette flow at
 $Re=400$
and find that the mean turbulence statistics and drag of the lower-branch solution are hardly modified. This is due to the lower-branch solution, which was extracted from the edge state in this case, being dominated by streamwise velocity fluctuations. On the other hand, the upper-branch solution is manipulated considerably by the control, and we observe a 29 % reduction in its measured
$C_{f}$
and considerable changes in its first- and second-order statistics. The result of this is that as the control amplitude is increased, the upper-branch solution is brought closer to the edge state.
$Re=400$
and find that the mean turbulence statistics and drag of the lower-branch solution are hardly modified. This is due to the lower-branch solution, which was extracted from the edge state in this case, being dominated by streamwise velocity fluctuations. On the other hand, the upper-branch solution is manipulated considerably by the control, and we observe a 29 % reduction in its measured
$C_{f}$
and considerable changes in its first- and second-order statistics. The result of this is that as the control amplitude is increased, the upper-branch solution is brought closer to the edge state.(ii) Similarly, the edge state in Poiseuille flow at
$Re=4200$
is changed very little by the control and sees almost no reduction in drag. However, its periodic orbit, which exhibits a notable likeness to the near-wall self-sustaining process, is regularised as the control amplitude is increased and undergoes a period-halving bifurcation at a control amplitude of
$\unicode[STIX]{x1D719}=0.5$
.(iii) In accordance with the idea that the upper-branch equilibrium solution acts as an element forming the ‘skeleton’ of the turbulent solution trajectory in phase space, the mean turbulent state also moves gradually towards the edge state as the control amplitude is increased in both flows. We also observe that fluctuations of the turbulent trajectory in
$I$
–
$D$
phase space are noticeably reduced, which is shown to be related to a reduction in magnitude of the leading unstable eigenvalues of the upper-branch solution. Consequently, there is a reduction in the repelling strength of the upper-branch solution and this suggests that the turbulent state is also regularised by the control.(iv) Opposition control also causes a significant reduction in turbulence lifetimes, particularly at high amplitudes, which is a direct result of the movement in phase space of the upper-branch solution and mean turbulent state towards the edge state. Even though the magnitude of the fluctuations of the turbulent trajectory in
$I$
–
$D$
space are damped by the control, reducing their separation in phase space still increases the likelihood of the turbulent solution trajectory passing through the edge state and decaying to the laminar state.(v) Finally, and importantly, the bifurcation Reynolds number in Couette flow, below which only the laminar solution exists, sees a considerable increase from
$Re_{crit}\simeq 128$
without control to
$Re_{crit}\simeq 147$
for
$\unicode[STIX]{x1D719}=1.0$
. This demonstrates that opposition control is also very effective at delaying transition.


To conclude, it is very clear that opposition control has a significant impact on the phase-space dynamics in both Couette flow and Poiseuille flow. As well as reducing drag, it decreases turbulence lifetimes, reduces fluctuations of the turbulent state in phase space, and delays transition. This all takes place without significantly manipulating the edge state. Interestingly, this phenomenon has also been observed in the case of polymer drag reduction in channel flow: Xi & Graham (Reference Xi and Graham2012) and Xi & Bai (Reference Xi and Bai2016) show that the mean flow statistics and drag of the edge state in plane Poiseuille flow do not change when the viscoelastic effects of polymer additives are modelled in their simulations. As well as this, Li & Graham (Reference Li and Graham2007) report that the bifurcation Reynolds number for the exact coherent solutions in Poiseuille flow increases significantly as a result of polymer drag reduction, as is the case for the equilibrium solutions considered here in Couette flow. These remarkable similarities between two entirely different drag reduction methods suggest that this could be a common characteristic of flow control techniques in general, but this would require further investigation. Finally, the findings of the present work could be reinforced by studying the effect of opposition control on other more complex flow geometries from a similar phase-space perspective.
Acknowledgements
We are very grateful to Dr A. Willis for the development of the code we used and to Professor B. Eckhardt for a useful suggestion on figure 15. Y.H. was supported by the Engineering and Physical Sciences Research Council (EPSRC) in the UK (EP/N019342/1).


