


1 Introduction
Vortex shedding in the wake of an elastically mounted bluff body may result in its vibration. This phenomenon is referred to as vortex-induced vibration (VIV). A circular cylinder is typically used as a canonical shape for the bluff body in most VIV studies. More often than not, the elastic support is modelled as a linear spring and the cylinder is constrained to move in the transverse direction only (henceforth referred to as
 $Y$
-only oscillation). For a comprehensive review on the various aspects of VIV, the interested reader is referred to articles by Sarpkaya (Reference Sarpkaya2004), Williamson & Govardhan (Reference Williamson and Govardhan2004) and Bearman (Reference Bearman2011).
$Y$
-only oscillation). For a comprehensive review on the various aspects of VIV, the interested reader is referred to articles by Sarpkaya (Reference Sarpkaya2004), Williamson & Govardhan (Reference Williamson and Govardhan2004) and Bearman (Reference Bearman2011).
The response of the fluid–structure system during VIV depends on several flow and structural parameters that are usually expressed in non-dimensional form: for example, Reynolds number, mass ratio and reduced speed. The Reynolds number (
 $Re$
) is based on the free-stream speed (
$Re$
) is based on the free-stream speed (
 $U$
) and diameter of the circular cylinder (
$U$
) and diameter of the circular cylinder (
 $D$
). The mass ratio (
$D$
). The mass ratio (
 $m^{\ast }$
) is the ratio between the mass of the oscillating structure and the mass of the fluid displaced by it. The reduced speed (
$m^{\ast }$
) is the ratio between the mass of the oscillating structure and the mass of the fluid displaced by it. The reduced speed (
 $U^{\ast }$
) is defined as
$U^{\ast }$
) is defined as
 $U/f_{n}D$
, where
$U/f_{n}D$
, where
 $f_{n}$
is the natural frequency of the oscillator. If the natural frequency of the structure is close to the vortex shedding frequency then synchronization/lock-in/resonance can occur in the fluid–structure system, wherein the structure experiences a relatively large amplitude of oscillation (Khalak & Williamson Reference Khalak and Williamson1999). Typically, lock-in occurs over a range of
$f_{n}$
is the natural frequency of the oscillator. If the natural frequency of the structure is close to the vortex shedding frequency then synchronization/lock-in/resonance can occur in the fluid–structure system, wherein the structure experiences a relatively large amplitude of oscillation (Khalak & Williamson Reference Khalak and Williamson1999). Typically, lock-in occurs over a range of
 $U^{\ast }$
. Outside this range, the fluid and structure are desynchronized. For moderate mass-ratio systems and at low
$U^{\ast }$
. Outside this range, the fluid and structure are desynchronized. For moderate mass-ratio systems and at low
 $Re$
, the response curve within the lock-in has two branches: the initial and the lower (Singh & Mittal Reference Singh and Mittal2005). In the large-
$Re$
, the response curve within the lock-in has two branches: the initial and the lower (Singh & Mittal Reference Singh and Mittal2005). In the large-
 $Re$
regime, an additional branch called the upper branch is observed (Khalak & Williamson Reference Khalak and Williamson1999; Govardhan & Williamson Reference Govardhan and Williamson2000; Navrose & Mittal Reference Mittal2013; Zhao et al.
Reference Zhao, Leontini, Lo Jacono and Sheridan2014). The peak amplitude of transverse oscillation in the large-
$Re$
regime, an additional branch called the upper branch is observed (Khalak & Williamson Reference Khalak and Williamson1999; Govardhan & Williamson Reference Govardhan and Williamson2000; Navrose & Mittal Reference Mittal2013; Zhao et al.
Reference Zhao, Leontini, Lo Jacono and Sheridan2014). The peak amplitude of transverse oscillation in the large-
 $Re$
regime is higher than that in the low-
$Re$
regime is higher than that in the low-
 $Re$
regime (Williamson & Govardhan Reference Williamson and Govardhan2004). With a decrease in
$Re$
regime (Williamson & Govardhan Reference Williamson and Govardhan2004). With a decrease in
 $m^{\ast }$
, the width of the lock-in regime increases, and below a critical
$m^{\ast }$
, the width of the lock-in regime increases, and below a critical
 $m^{\ast }$
the regime of synchronization extends to infinite reduced speed (Govardhan & Williamson Reference Govardhan and Williamson2002; Ryan, Thompson & Hourigan Reference Ryan, Thompson and Hourigan2005; Navrose & Mittal Reference Mittal2017).
$m^{\ast }$
the regime of synchronization extends to infinite reduced speed (Govardhan & Williamson Reference Govardhan and Williamson2002; Ryan, Thompson & Hourigan Reference Ryan, Thompson and Hourigan2005; Navrose & Mittal Reference Mittal2017).
Compared to
 $Y$
-only oscillation, the VIV set-up where the cylinder is free to oscillate in both streamwise and transverse directions (
$Y$
-only oscillation, the VIV set-up where the cylinder is free to oscillate in both streamwise and transverse directions (
 $XY$
-oscillation) has been relatively less explored, especially beyond the laminar flow regime. Jauvtis & Williamson (Reference Jauvtis and Williamson2004) carried out experiments with
$XY$
-oscillation) has been relatively less explored, especially beyond the laminar flow regime. Jauvtis & Williamson (Reference Jauvtis and Williamson2004) carried out experiments with
 $XY$
-oscillation for different values of
$XY$
-oscillation for different values of
 $m^{\ast }$
. The natural frequencies of the oscillator in the transverse and streamwise directions in their work were kept the same. They observed that for
$m^{\ast }$
. The natural frequencies of the oscillator in the transverse and streamwise directions in their work were kept the same. They observed that for
 $m^{\ast }\gtrsim 6.0$
,
$m^{\ast }\gtrsim 6.0$
,
 $Y$
-only and
$Y$
-only and
 $XY$
-oscillation are similar in terms of the number of response branches, peak amplitude of transverse oscillation and vortex shedding modes. In the present work, we investigate the transition between the various branches of the cylinder response and desynchronization regimes for a cylinder undergoing
$XY$
-oscillation are similar in terms of the number of response branches, peak amplitude of transverse oscillation and vortex shedding modes. In the present work, we investigate the transition between the various branches of the cylinder response and desynchronization regimes for a cylinder undergoing
 $XY$
-oscillation. The results are compared to those from earlier studies for
$XY$
-oscillation. The results are compared to those from earlier studies for
 $Y$
-only oscillation to bring out the effect of
$Y$
-only oscillation to bring out the effect of
 $XY$
-oscillation over the
$XY$
-oscillation over the
 $Y$
-only vibration in modifying the transition.
$Y$
-only vibration in modifying the transition.
2 Problem description, numerical details and mesh convergence
The flow is modelled using the incompressible Navier–Stokes equations in primitive variable form. The cylinder is mounted on an elastic support that is modelled by two identical springs, one each in the streamwise (
 $X$
) and transverse (
$X$
) and transverse (
 $Y$
) directions. To encourage large-amplitude oscillation, the structural damping coefficient is set to zero. The details of the equations as well as their finite-element formulation can be found in the article by Prasanth & Mittal (Reference Prasanth and Mittal2008). The oscillator has been designed such that
$Y$
) directions. To encourage large-amplitude oscillation, the structural damping coefficient is set to zero. The details of the equations as well as their finite-element formulation can be found in the article by Prasanth & Mittal (Reference Prasanth and Mittal2008). The oscillator has been designed such that
 $Re$
varies linearly with the reduced speed as
$Re$
varies linearly with the reduced speed as
 $Re=678U^{\ast }$
. This approach is akin to that usually employed in experiments and has been used for low-
$Re=678U^{\ast }$
. This approach is akin to that usually employed in experiments and has been used for low-
 $Re$
VIV computations (Prasanth & Mittal Reference Prasanth and Mittal2008; Navrose et al.
Reference Yogeswaran, Sen and Mittal2014). The design of the oscillator ensures that the peak amplitude of cylinder oscillation in the transverse direction occurs for similar combinations of
$Re$
VIV computations (Prasanth & Mittal Reference Prasanth and Mittal2008; Navrose et al.
Reference Yogeswaran, Sen and Mittal2014). The design of the oscillator ensures that the peak amplitude of cylinder oscillation in the transverse direction occurs for similar combinations of
 $Re$
and
$Re$
and
 $U^{\ast }$
as in the experiments by Govardhan & Williamson (Reference Govardhan and Williamson2006). The span of the cylinder is
$U^{\ast }$
as in the experiments by Govardhan & Williamson (Reference Govardhan and Williamson2006). The span of the cylinder is
 $4D$
. The mass ratio for all the simulations is
$4D$
. The mass ratio for all the simulations is
 $m^{\ast }=10.0$
.
$m^{\ast }=10.0$
.
The computational domain and finite-element mesh are the same as that in our earlier work (Navrose & Mittal Reference Mittal2013). The cylinder spans the entire extent of the hexahedral computational domain along the
 $z$
-axis. The upstream and downstream boundaries are located at
$z$
-axis. The upstream and downstream boundaries are located at
 $10D$
and
$10D$
and
 $25.5D$
, respectively, from the axis of the cylinder and the blockage is 5 %. The adequacy of the extent of the domain was demonstrated by Prasanth & Mittal (Reference Prasanth and Mittal2008). The 3-D finite element mesh is generated by stacking 51 slices of a two-dimensional (2-D) mesh along the span. A special mesh moving scheme is utilized to account for the motion of the cylinder. The mesh near the cylinder moves along with it like a rigid body, while the outer boundary remains fixed (Prasanth & Mittal Reference Prasanth and Mittal2008; Navrose & Mittal Reference Mittal2013, Reference Mittal2017).
$25.5D$
, respectively, from the axis of the cylinder and the blockage is 5 %. The adequacy of the extent of the domain was demonstrated by Prasanth & Mittal (Reference Prasanth and Mittal2008). The 3-D finite element mesh is generated by stacking 51 slices of a two-dimensional (2-D) mesh along the span. A special mesh moving scheme is utilized to account for the motion of the cylinder. The mesh near the cylinder moves along with it like a rigid body, while the outer boundary remains fixed (Prasanth & Mittal Reference Prasanth and Mittal2008; Navrose & Mittal Reference Mittal2013, Reference Mittal2017).
A no-slip condition is applied to the velocity on the surface of the cylinder. Free-stream values are assigned for the velocity at the upstream boundary. The stress vector is set to zero at the downstream boundary. On the other boundaries, the normal component of the velocity and tangential component of the stress vector in the two directions are prescribed a zero value. The location of the cylinder, its velocity and the boundary conditions are updated at each nonlinear iteration of the time marching solution process.
Table 1.
 $U^{\ast }=10$
(
$U^{\ast }=10$
(
 $Re=6780$
) flow past a freely vibrating cylinder: mesh convergence study.
$Re=6780$
) flow past a freely vibrating cylinder: mesh convergence study.
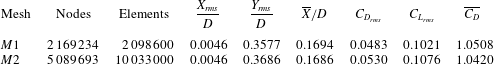
Details of the mesh-
 $M1$
used for the computations are listed in table 1. A finer mesh (
$M1$
used for the computations are listed in table 1. A finer mesh (
 $M2$
) is used to check the adequacy of the spatial resolution of mesh
$M2$
) is used to check the adequacy of the spatial resolution of mesh
 $M1$
. The test is carried out for
$M1$
. The test is carried out for
 $U^{\ast }=10.0$
(
$U^{\ast }=10.0$
(
 $Re=6780$
). Table 1 summarizes the response of the cylinder and aerodynamic coefficients obtained with the two meshes. The solutions from the two meshes are in good agreement and confirm the adequacy of mesh
$Re=6780$
). Table 1 summarizes the response of the cylinder and aerodynamic coefficients obtained with the two meshes. The solutions from the two meshes are in good agreement and confirm the adequacy of mesh
 $M1$
.
$M1$
.
3 Results
3.1 Overview of cylinder response
Figure 1(a) shows the variation of peak amplitude of transverse oscillation of the cylinder (
 $A_{y}^{\ast }$
) with
$A_{y}^{\ast }$
) with
 $U^{\ast }$
(and
$U^{\ast }$
(and
 $Re$
). In the regime where intermittency is observed between two states,
$Re$
). In the regime where intermittency is observed between two states,
 $A_{y}^{\ast }$
for each state is obtained separately by segregating the time history corresponding to the respective states. Hence, for each
$A_{y}^{\ast }$
for each state is obtained separately by segregating the time history corresponding to the respective states. Hence, for each
 $U^{\ast }$
within the intermittent regime, two data points are shown in figure 1(a). It is observed that the fluid–structure system is in the state of lock-in/synchronization for
$U^{\ast }$
within the intermittent regime, two data points are shown in figure 1(a). It is observed that the fluid–structure system is in the state of lock-in/synchronization for
 $4.0\leqslant U^{\ast }\leqslant 10.4$
(
$4.0\leqslant U^{\ast }\leqslant 10.4$
(
 $2700\lesssim Re\lesssim 7050$
), wherein the cylinder exhibits a relatively large amplitude of oscillation. The regime of desynchronization in terms of
$2700\lesssim Re\lesssim 7050$
), wherein the cylinder exhibits a relatively large amplitude of oscillation. The regime of desynchronization in terms of
 $U^{\ast }$
, prior to and beyond the lock-in regime, is denoted respectively by
$U^{\ast }$
, prior to and beyond the lock-in regime, is denoted respectively by
 $DS(I)$
and
$DS(I)$
and
 $DS(II)$
in the figure. Within the lock-in region, three regimes are identified: initial excitation branch (
$DS(II)$
in the figure. Within the lock-in region, three regimes are identified: initial excitation branch (
 $IB$
), intermittent regime and lower branch (
$IB$
), intermittent regime and lower branch (
 $LB$
). The two branches –
$LB$
). The two branches –
 $IB$
and
$IB$
and
 $LB$
are named based on the similarity of the transverse cylinder response in the present work and earlier
$LB$
are named based on the similarity of the transverse cylinder response in the present work and earlier
 $Y$
-only vibration studies (Khalak & Williamson Reference Khalak and Williamson1999; Govardhan & Williamson Reference Govardhan and Williamson2000; Williamson & Govardhan Reference Williamson and Govardhan2004; Zhao et al.
Reference Zhao, Leontini, Lo Jacono and Sheridan2014).
$Y$
-only vibration studies (Khalak & Williamson Reference Khalak and Williamson1999; Govardhan & Williamson Reference Govardhan and Williamson2000; Williamson & Govardhan Reference Williamson and Govardhan2004; Zhao et al.
Reference Zhao, Leontini, Lo Jacono and Sheridan2014).
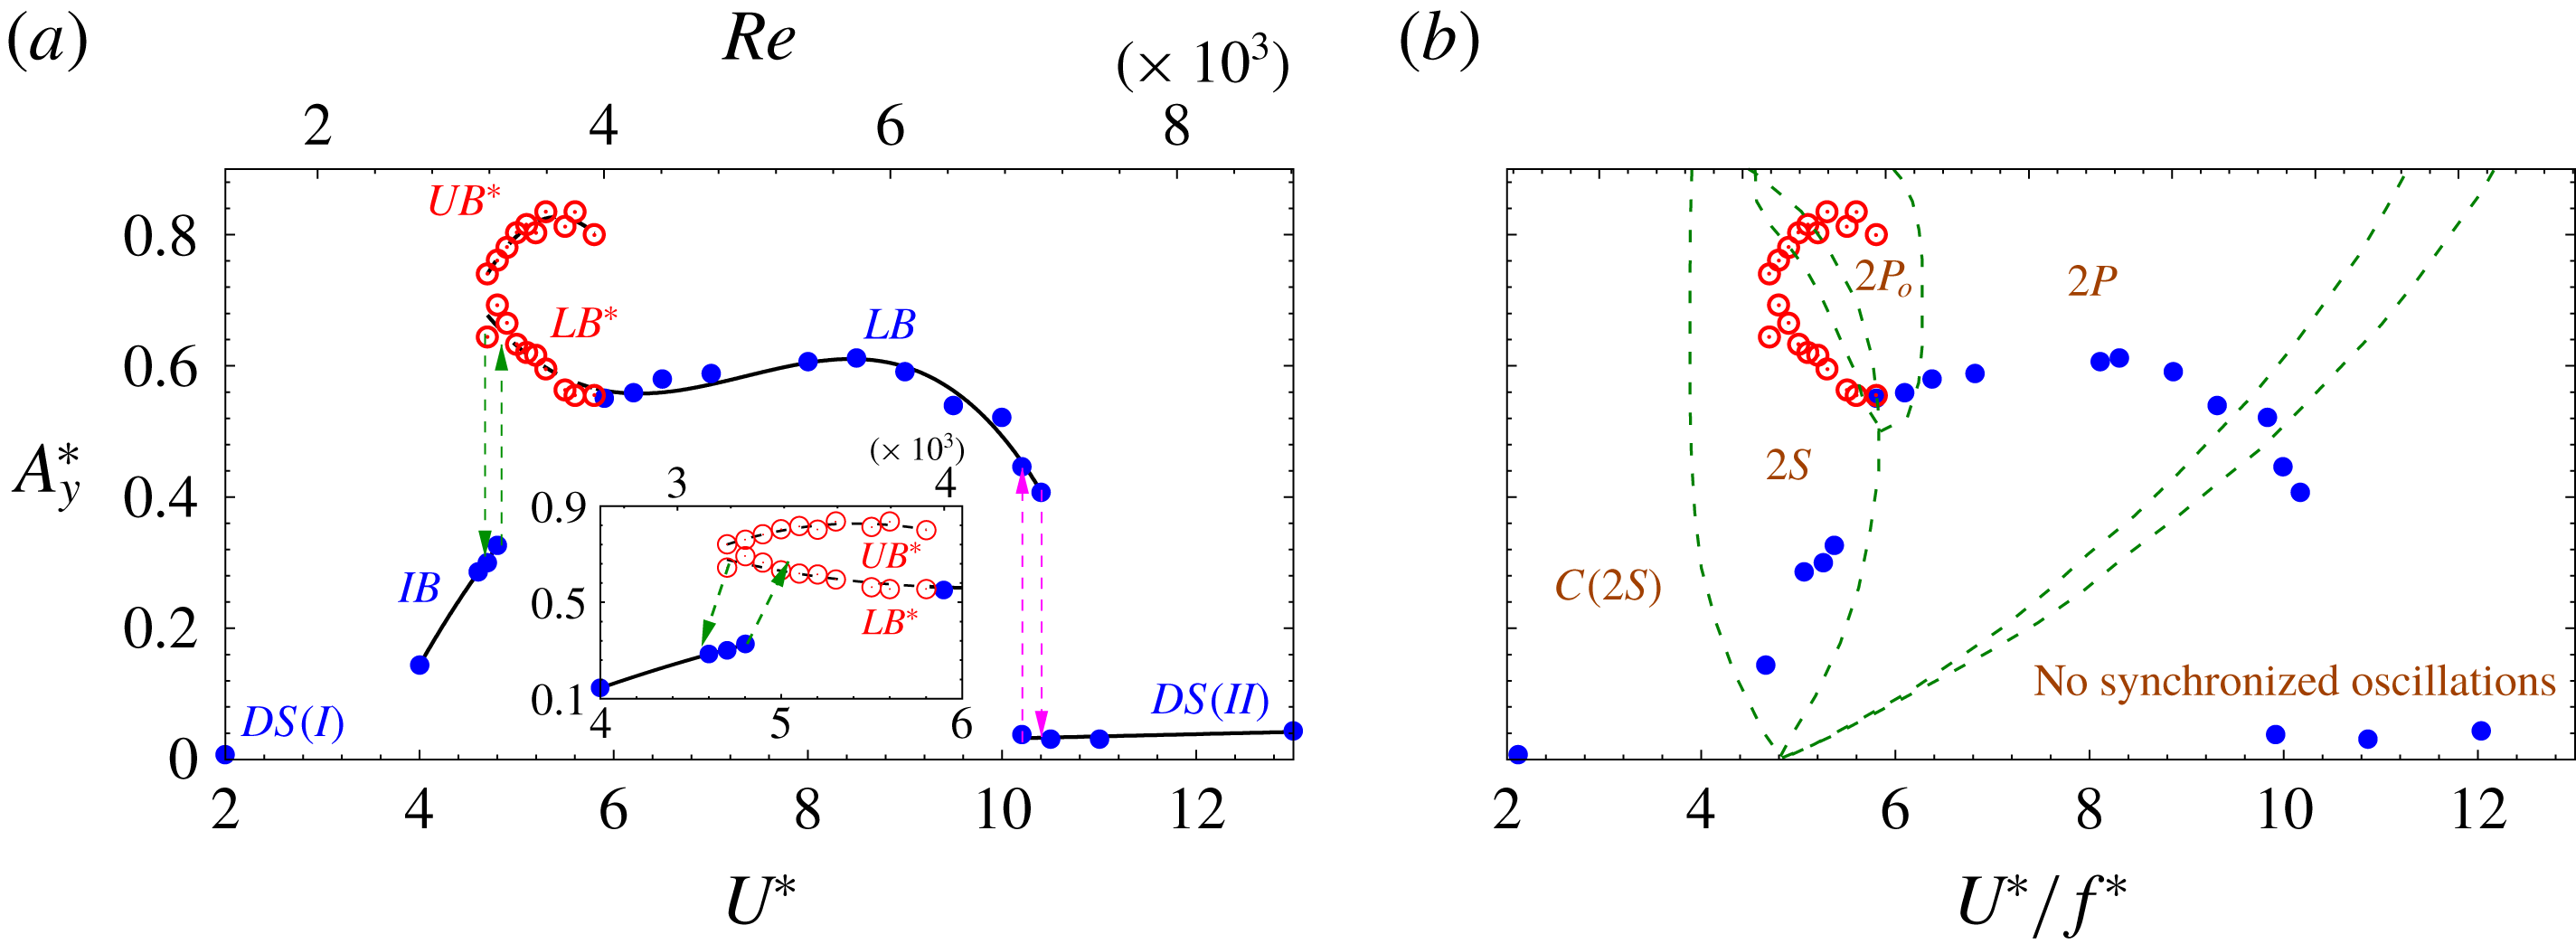
Figure 1. Flow past a freely vibrating cylinder: (a) variation of the amplitude of the cylinder oscillation in the transverse direction with
 $U^{\ast }$
(and
$U^{\ast }$
(and
 $Re$
) and (b) superimposition of free-vibration data on the map of vortex shedding regimes derived by Williamson & Roshko (Reference Williamson and Roshko1988). The data points in the regime of intermittency are shown using hollow (red) circles. Other data points are shown via filled (blue) circles. The different branches of the cylinder response, intermittent states and desynchronization regimes are marked in (a). The broken lines, with arrow heads, show hysteresis in the cylinder response with respect to increasing and decreasing
$Re$
) and (b) superimposition of free-vibration data on the map of vortex shedding regimes derived by Williamson & Roshko (Reference Williamson and Roshko1988). The data points in the regime of intermittency are shown using hollow (red) circles. Other data points are shown via filled (blue) circles. The different branches of the cylinder response, intermittent states and desynchronization regimes are marked in (a). The broken lines, with arrow heads, show hysteresis in the cylinder response with respect to increasing and decreasing
 $U^{\ast }$
. The inset of (a) shows a close-up view of the cylinder response near the transition between
$U^{\ast }$
. The inset of (a) shows a close-up view of the cylinder response near the transition between
 $IB$
and the intermittent regime.
$IB$
and the intermittent regime.
Khalak & Williamson (Reference Khalak and Williamson1999), in their experiments, observed that the fluid–structure system exhibits a hysteretic response near the lower-
 $U^{\ast }$
end of the lock-in regime:
$U^{\ast }$
end of the lock-in regime:
 $A_{y}^{\ast }$
obtained via the increasing-
$A_{y}^{\ast }$
obtained via the increasing-
 $U^{\ast }$
approach in the hysteretic regime is lower than that obtained via the decreasing-
$U^{\ast }$
approach in the hysteretic regime is lower than that obtained via the decreasing-
 $U^{\ast }$
approach. In the increasing-
$U^{\ast }$
approach. In the increasing-
 $U^{\ast }$
approach,
$U^{\ast }$
approach,
 $U^{\ast }$
was increased in small increments starting from regime
$U^{\ast }$
was increased in small increments starting from regime
 $DS(I)$
up to regime
$DS(I)$
up to regime
 $DS(II)$
. In the decreasing-
$DS(II)$
. In the decreasing-
 $U^{\ast }$
approach,
$U^{\ast }$
approach,
 $U^{\ast }$
was decreased in small decrements starting from regime
$U^{\ast }$
was decreased in small decrements starting from regime
 $DS(II)$
up to
$DS(II)$
up to
 $DS(I)$
. We have adopted the same two approaches in the present work. In the increasing (decreasing)-
$DS(I)$
. We have adopted the same two approaches in the present work. In the increasing (decreasing)-
 $U^{\ast }$
approach, the increment (decrement) in
$U^{\ast }$
approach, the increment (decrement) in
 $U^{\ast }$
is carried out by using the fully developed solution for lower (higher)
$U^{\ast }$
is carried out by using the fully developed solution for lower (higher)
 $U^{\ast }$
as the initial condition for the next reduced speed. After the initial transient stage, the simulation for each
$U^{\ast }$
as the initial condition for the next reduced speed. After the initial transient stage, the simulation for each
 $U^{\ast }$
is run for at least 100 cycles of cylinder oscillation in the transverse direction. It is observed that with the increasing-
$U^{\ast }$
is run for at least 100 cycles of cylinder oscillation in the transverse direction. It is observed that with the increasing-
 $U^{\ast }$
approach, the response of the system first shifts from
$U^{\ast }$
approach, the response of the system first shifts from
 $DS(I)$
to
$DS(I)$
to
 $IB$
, and then jumps at
$IB$
, and then jumps at
 $U^{\ast }=4.9$
to intermittent switching between high- (
$U^{\ast }=4.9$
to intermittent switching between high- (
 $UB^{\ast }$
) and low-amplitude state (
$UB^{\ast }$
) and low-amplitude state (
 $LB^{\ast }$
) in the transverse response of the cylinder (see the inset of figure 1
a). The asterisk is used in the names to distinguish them from the upper branch (
$LB^{\ast }$
) in the transverse response of the cylinder (see the inset of figure 1
a). The asterisk is used in the names to distinguish them from the upper branch (
 $UB$
) and lower branch (
$UB$
) and lower branch (
 $LB$
) response reported in experiments (Khalak & Williamson Reference Khalak and Williamson1999; Govardhan & Williamson Reference Govardhan and Williamson2000; Williamson & Govardhan Reference Williamson and Govardhan2004). The
$LB$
) response reported in experiments (Khalak & Williamson Reference Khalak and Williamson1999; Govardhan & Williamson Reference Govardhan and Williamson2000; Williamson & Govardhan Reference Williamson and Govardhan2004). The
 $UB$
and
$UB$
and
 $LB$
response, as observed in experiments, can exist either in isolation, or there can be intermittent switching between the two. The
$LB$
response, as observed in experiments, can exist either in isolation, or there can be intermittent switching between the two. The
 $UB^{\ast }$
and
$UB^{\ast }$
and
 $LB^{\ast }$
response, on the other hand, exist only via intermittent switching between the two. The experiments show that the response first jumps from
$LB^{\ast }$
response, on the other hand, exist only via intermittent switching between the two. The experiments show that the response first jumps from
 $IB$
to the upper branch (
$IB$
to the upper branch (
 $UB$
), and is followed by intermittent switching between
$UB$
), and is followed by intermittent switching between
 $UB$
and
$UB$
and
 $LB$
at a later
$LB$
at a later
 $U^{\ast }$
(Khalak & Williamson Reference Khalak and Williamson1999; Govardhan & Williamson Reference Govardhan and Williamson2000; Williamson & Govardhan Reference Williamson and Govardhan2004). We attribute this difference between computational and experimental results to the fact that experiments have been carried out for
$U^{\ast }$
(Khalak & Williamson Reference Khalak and Williamson1999; Govardhan & Williamson Reference Govardhan and Williamson2000; Williamson & Govardhan Reference Williamson and Govardhan2004). We attribute this difference between computational and experimental results to the fact that experiments have been carried out for
 $Y$
-only oscillation, while in the present study, the cylinder is free to undergo both transverse and streamwise oscillations. The intermittent behaviour in
$Y$
-only oscillation, while in the present study, the cylinder is free to undergo both transverse and streamwise oscillations. The intermittent behaviour in
 $XY$
-oscillation is observed up to
$XY$
-oscillation is observed up to
 $U^{\ast }=5.8$
(inset of figure 1
a). Thereafter, only the
$U^{\ast }=5.8$
(inset of figure 1
a). Thereafter, only the
 $LB$
response is observed up to
$LB$
response is observed up to
 $U^{\ast }=10.4$
, and beyond that the response jumps to
$U^{\ast }=10.4$
, and beyond that the response jumps to
 $DS(II)$
. The peak amplitude of cylinder oscillation occurs within the intermittent regime at
$DS(II)$
. The peak amplitude of cylinder oscillation occurs within the intermittent regime at
 $U^{\ast }=5.3$
. The peak value is in good agreement with experimental results of
$U^{\ast }=5.3$
. The peak value is in good agreement with experimental results of
 $Y$
-only oscillation for low-
$Y$
-only oscillation for low-
 $m^{\ast }\unicode[STIX]{x1D701}$
and a similar range of
$m^{\ast }\unicode[STIX]{x1D701}$
and a similar range of
 $Re$
(Govardhan & Williamson Reference Govardhan and Williamson2000, Reference Govardhan and Williamson2006).
$Re$
(Govardhan & Williamson Reference Govardhan and Williamson2000, Reference Govardhan and Williamson2006).
With the decreasing-
 $U^{\ast }$
approach, hysteresis is observed in the cylinder response near the higher-
$U^{\ast }$
approach, hysteresis is observed in the cylinder response near the higher-
 $U^{\ast }$
end of the lock-in regime; the jump from
$U^{\ast }$
end of the lock-in regime; the jump from
 $DS(II)$
to
$DS(II)$
to
 $LB$
occurs at
$LB$
occurs at
 $U^{\ast }=10.2$
, in contrast to the jump from
$U^{\ast }=10.2$
, in contrast to the jump from
 $LB$
to
$LB$
to
 $DS(II)$
which takes place at
$DS(II)$
which takes place at
 $U^{\ast }=10.4$
. A hysteretic response is also observed near the lower-
$U^{\ast }=10.4$
. A hysteretic response is also observed near the lower-
 $U^{\ast }$
end of the lock-in regime, where the intermittent switching between
$U^{\ast }$
end of the lock-in regime, where the intermittent switching between
 $UB^{\ast }$
and
$UB^{\ast }$
and
 $LB^{\ast }$
with the decreasing-
$LB^{\ast }$
with the decreasing-
 $U^{\ast }$
approach extends up to
$U^{\ast }$
approach extends up to
 $U^{\ast }=4.7$
. Singh & Mittal (Reference Singh and Mittal2005) showed that in the laminar flow regime, the hysteretic response occurs near both the ends of the lock-in regime. It can, therefore, be concluded that the hysteretic response at the two ends of the lock-in regime in free vibration of a circular cylinder is common to both the low- and subcritical-
$U^{\ast }=4.7$
. Singh & Mittal (Reference Singh and Mittal2005) showed that in the laminar flow regime, the hysteretic response occurs near both the ends of the lock-in regime. It can, therefore, be concluded that the hysteretic response at the two ends of the lock-in regime in free vibration of a circular cylinder is common to both the low- and subcritical-
 $Re$
flow regimes. Following the nomenclature used for the low-
$Re$
flow regimes. Following the nomenclature used for the low-
 $Re$
flow regime, we refer to hysteresis near the lower- and higher-
$Re$
flow regime, we refer to hysteresis near the lower- and higher-
 $U^{\ast }$
end of the lock-in regime as primary and secondary hysteresis, respectively. The widths of the primary and secondary hystereses in the present work are found to be the same and are equal to
$U^{\ast }$
end of the lock-in regime as primary and secondary hysteresis, respectively. The widths of the primary and secondary hystereses in the present work are found to be the same and are equal to
 $\unicode[STIX]{x0394}U^{\ast }=0.2$
. This is larger than the corresponding widths reported in the laminar regime (Singh & Mittal Reference Singh and Mittal2005). Below
$\unicode[STIX]{x0394}U^{\ast }=0.2$
. This is larger than the corresponding widths reported in the laminar regime (Singh & Mittal Reference Singh and Mittal2005). Below
 $U^{\ast }=4.7$
, the response moves to
$U^{\ast }=4.7$
, the response moves to
 $IB$
, and with further decrease in
$IB$
, and with further decrease in
 $U^{\ast }$
, the fluid–structure system reaches a desynchronized state.
$U^{\ast }$
, the fluid–structure system reaches a desynchronized state.
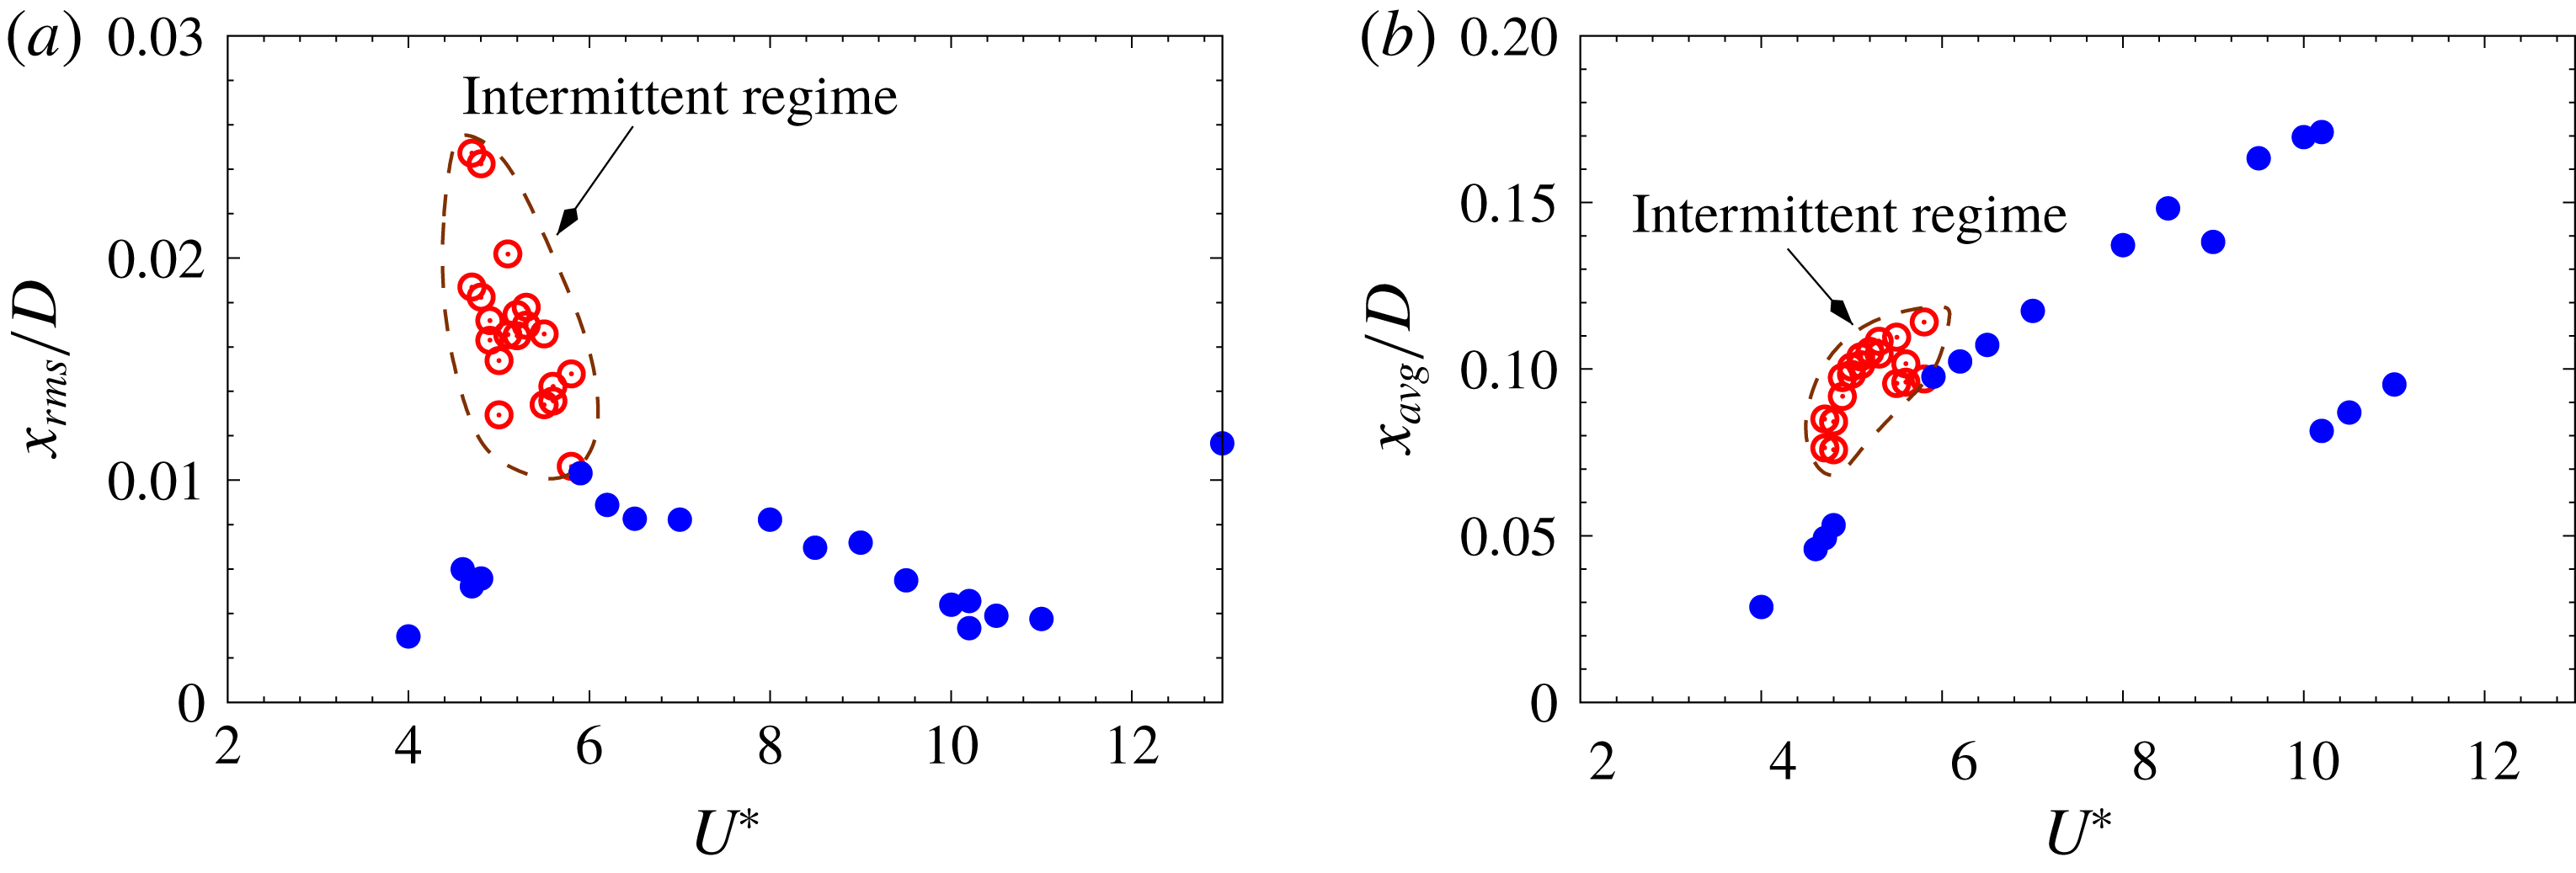
Figure 2. Flow past a freely vibrating cylinder: variation of (a) the root mean square of the streamwise oscillation and (b) the time-averaged streamwise location with reduced speed. The data points for the intermittent regime are shown using hollow (red) circles, and are enclosed within a broken closed curve in the two plots.
Figure 1(a) brings out an interesting feature of free vibration that is possibly being reported for the first time. For
 $4.7\leqslant U^{\ast }\leqslant 4.9$
, the response may belong to either
$4.7\leqslant U^{\ast }\leqslant 4.9$
, the response may belong to either
 $IB$
or intermittently switch between high- and low-amplitude states. With the increasing-
$IB$
or intermittently switch between high- and low-amplitude states. With the increasing-
 $U^{\ast }$
approach, the response belongs to
$U^{\ast }$
approach, the response belongs to
 $IB$
, while it switches intermittently between
$IB$
, while it switches intermittently between
 $UB^{\ast }$
and
$UB^{\ast }$
and
 $LB^{\ast }$
for the decreasing-
$LB^{\ast }$
for the decreasing-
 $U^{\ast }$
approach. Figure 2(a) shows the variation of the root mean square (r.m.s.) of the streamwise displacement with
$U^{\ast }$
approach. Figure 2(a) shows the variation of the root mean square (r.m.s.) of the streamwise displacement with
 $U^{\ast }$
. The streamwise fluctuation within the lock-in regime is found to be higher than in the desynchronization regime. The peak r.m.s. value is nearly three times that in the laminar flow regime (Singh & Mittal Reference Singh and Mittal2005). Further, unlike the laminar regime, where the peak r.m.s. value occurs near the higher-
$U^{\ast }$
. The streamwise fluctuation within the lock-in regime is found to be higher than in the desynchronization regime. The peak r.m.s. value is nearly three times that in the laminar flow regime (Singh & Mittal Reference Singh and Mittal2005). Further, unlike the laminar regime, where the peak r.m.s. value occurs near the higher-
 $U^{\ast }$
end of the lock-in regime, it occurs in the intermittent regime towards the lower-
$U^{\ast }$
end of the lock-in regime, it occurs in the intermittent regime towards the lower-
 $U^{\ast }$
end of the lock-in regime for subcritical-
$U^{\ast }$
end of the lock-in regime for subcritical-
 $Re$
. The time-averaged streamwise displacement (figure 2
b) increases with
$Re$
. The time-averaged streamwise displacement (figure 2
b) increases with
 $U^{\ast }$
in the lock-in regime, with a discernible jump near the two ends of the intermittent regime.
$U^{\ast }$
in the lock-in regime, with a discernible jump near the two ends of the intermittent regime.
3.2 Initial branch:
 $4.0\leqslant U^{\ast }\leqslant 4.9$

Figure 3 shows the time histories of cylinder displacement and aerodynamic coefficients for a typical
 $IB$
response. The corresponding frequency spectra are shown alongside the time histories. It is observed that the time signal for the transverse displacement and the lift coefficient is strongly modulated. This is in agreement with earlier experimental findings for
$IB$
response. The corresponding frequency spectra are shown alongside the time histories. It is observed that the time signal for the transverse displacement and the lift coefficient is strongly modulated. This is in agreement with earlier experimental findings for
 $Y$
-only oscillation (Khalak & Williamson Reference Khalak and Williamson1999; Govardhan & Williamson Reference Govardhan and Williamson2000). The most dominant frequency in the two signals, identified as the frequency with the highest power in the corresponding frequency spectrum, is the same and equal to the vortex shedding frequency. The fluid–structure system, therefore, is in a state of lock-in/synchronization. We denote the common fluid–structure frequency as
$Y$
-only oscillation (Khalak & Williamson Reference Khalak and Williamson1999; Govardhan & Williamson Reference Govardhan and Williamson2000). The most dominant frequency in the two signals, identified as the frequency with the highest power in the corresponding frequency spectrum, is the same and equal to the vortex shedding frequency. The fluid–structure system, therefore, is in a state of lock-in/synchronization. We denote the common fluid–structure frequency as
 $F_{y}$
. It is close to the natural frequency of the oscillator. For the flow past a non-oscillating cylinder, the frequency of the drag coefficient is twice the vortex shedding frequency. This is because of the spatio(transverse)-temporal symmetry of the flow past the cylinder (Blackburn, Marques & Lopez Reference Blackburn, Marques and Lopez2005). Since the VIV set-up in the present work is symmetric in the transverse direction, it is expected that the spatio-temporal symmetry of the flow will be preserved. Consequently, the frequency of the drag coefficient and the streamwise oscillation is expected to be
$F_{y}$
. It is close to the natural frequency of the oscillator. For the flow past a non-oscillating cylinder, the frequency of the drag coefficient is twice the vortex shedding frequency. This is because of the spatio(transverse)-temporal symmetry of the flow past the cylinder (Blackburn, Marques & Lopez Reference Blackburn, Marques and Lopez2005). Since the VIV set-up in the present work is symmetric in the transverse direction, it is expected that the spatio-temporal symmetry of the flow will be preserved. Consequently, the frequency of the drag coefficient and the streamwise oscillation is expected to be
 $2F_{y}$
. The frequency spectrum of
$2F_{y}$
. The frequency spectrum of
 $C_{D}$
shows that the most dominant frequency is indeed
$C_{D}$
shows that the most dominant frequency is indeed
 $2F_{y}$
. On the other hand, the frequency spectrum of the streamwise displacement shows two peaks. One at
$2F_{y}$
. On the other hand, the frequency spectrum of the streamwise displacement shows two peaks. One at
 $2F_{y}$
, and the other, which is the dominant of the two, at a frequency close to
$2F_{y}$
, and the other, which is the dominant of the two, at a frequency close to
 $F_{y}$
. Hence, the most dominant frequency for streamwise and transverse oscillation is nearly the same. This is also evident in figure 4(a), which shows the streamwise and transverse displacements during three cycles of transverse oscillation of the cylinder. Further, as figure 3(c) shows, the motion of the cylinder in the streamwise direction is not symmetric about the mean streamwise position. These observations suggest that, compared to
$F_{y}$
. Hence, the most dominant frequency for streamwise and transverse oscillation is nearly the same. This is also evident in figure 4(a), which shows the streamwise and transverse displacements during three cycles of transverse oscillation of the cylinder. Further, as figure 3(c) shows, the motion of the cylinder in the streamwise direction is not symmetric about the mean streamwise position. These observations suggest that, compared to
 $Y$
-only, there is a loss in the spatio-temporal symmetry of the
$Y$
-only, there is a loss in the spatio-temporal symmetry of the
 $XY$
-oscillating system. If the cylinder is constrained to move only in the streamwise direction, the frequency of streamwise oscillation is twice the vortex shedding frequency (Bourguet & Lo Jacono Reference Bourguet and Lo Jacono2015), and the spatio-temporal symmetry is maintained. Therefore, the matching of the dominant frequency of streamwise and transverse oscillations on
$XY$
-oscillating system. If the cylinder is constrained to move only in the streamwise direction, the frequency of streamwise oscillation is twice the vortex shedding frequency (Bourguet & Lo Jacono Reference Bourguet and Lo Jacono2015), and the spatio-temporal symmetry is maintained. Therefore, the matching of the dominant frequency of streamwise and transverse oscillations on
 $IB$
is attributed to the coupling between the motion in the two directions.
$IB$
is attributed to the coupling between the motion in the two directions.

Figure 3. Flow past a freely vibrating cylinder for
 $U^{\ast }=4.7$
obtained via the increasing-
$U^{\ast }=4.7$
obtained via the increasing-
 $U^{\ast }$
approach: time history of (a) cylinder displacement in the transverse direction, (b) lift coefficient, (c) cylinder displacement in the streamwise direction and (d) drag coefficient. The corresponding frequency spectrum is shown alongside the time histories (PSD: power spectral density).
$U^{\ast }$
approach: time history of (a) cylinder displacement in the transverse direction, (b) lift coefficient, (c) cylinder displacement in the streamwise direction and (d) drag coefficient. The corresponding frequency spectrum is shown alongside the time histories (PSD: power spectral density).

Figure 4. Flow past a freely vibrating cylinder: comparison of time histories of streamwise and transverse displacement of the cylinder for (a)
 $U^{\ast }=4.7$
and (b)
$U^{\ast }=4.7$
and (b)
 $U^{\ast }=8.0$
.
$U^{\ast }=8.0$
.
Williamson & Roshko (Reference Williamson and Roshko1988) studied forced transverse (
 $Y$
-only) vibration of a circular cylinder in uniform flow and presented a map showing the co-relation between the vortex shedding pattern, and amplitude and frequency of cylinder oscillation. The free-vibration data obtained from the present computations superimposed on the Williamson–Roshko map is shown in figure 1(b). In the original map, the frequency of cylinder oscillation is non-dimensionalized with the frequency of vortex shedding associated with a stationary cylinder. In the present work, the non-dimensionalization is carried out using the free-stream speed and diameter of the cylinder. It is observed that the data points for
$Y$
-only) vibration of a circular cylinder in uniform flow and presented a map showing the co-relation between the vortex shedding pattern, and amplitude and frequency of cylinder oscillation. The free-vibration data obtained from the present computations superimposed on the Williamson–Roshko map is shown in figure 1(b). In the original map, the frequency of cylinder oscillation is non-dimensionalized with the frequency of vortex shedding associated with a stationary cylinder. In the present work, the non-dimensionalization is carried out using the free-stream speed and diameter of the cylinder. It is observed that the data points for
 $IB$
lie in the region of the
$IB$
lie in the region of the
 $2S$
mode on the Williamson–Roshko map. In the
$2S$
mode on the Williamson–Roshko map. In the
 $2S$
mode, two counter-rotating vortices of similar strength are shed per cycle of cylinder oscillation. We study the flow field to compare the results from the
$2S$
mode, two counter-rotating vortices of similar strength are shed per cycle of cylinder oscillation. We study the flow field to compare the results from the
 $XY$
free oscillation with the Williamson–Roshko map. Figure 5(a) shows the span-averaged flow, in terms of spanwise vorticity, at three time instants during the motion of the cylinder from the highest to lowest transverse position. Also tracked in the figure is the release and convection of the counterclockwise (CCW) vortex from the lower surface of the cylinder. A similar activity, with respect to the clockwise (CW) vortex released from the upper surface, occurs in the next half of the cycle of cylinder motion. Hence, in each cycle of cylinder motion, one CCW and a CW vortex is shed in the wake. The vortex shedding mode, therefore, is
$XY$
free oscillation with the Williamson–Roshko map. Figure 5(a) shows the span-averaged flow, in terms of spanwise vorticity, at three time instants during the motion of the cylinder from the highest to lowest transverse position. Also tracked in the figure is the release and convection of the counterclockwise (CCW) vortex from the lower surface of the cylinder. A similar activity, with respect to the clockwise (CW) vortex released from the upper surface, occurs in the next half of the cycle of cylinder motion. Hence, in each cycle of cylinder motion, one CCW and a CW vortex is shed in the wake. The vortex shedding mode, therefore, is
 $2S$
and in excellent agreement with the Williamson–Roshko map.
$2S$
and in excellent agreement with the Williamson–Roshko map.
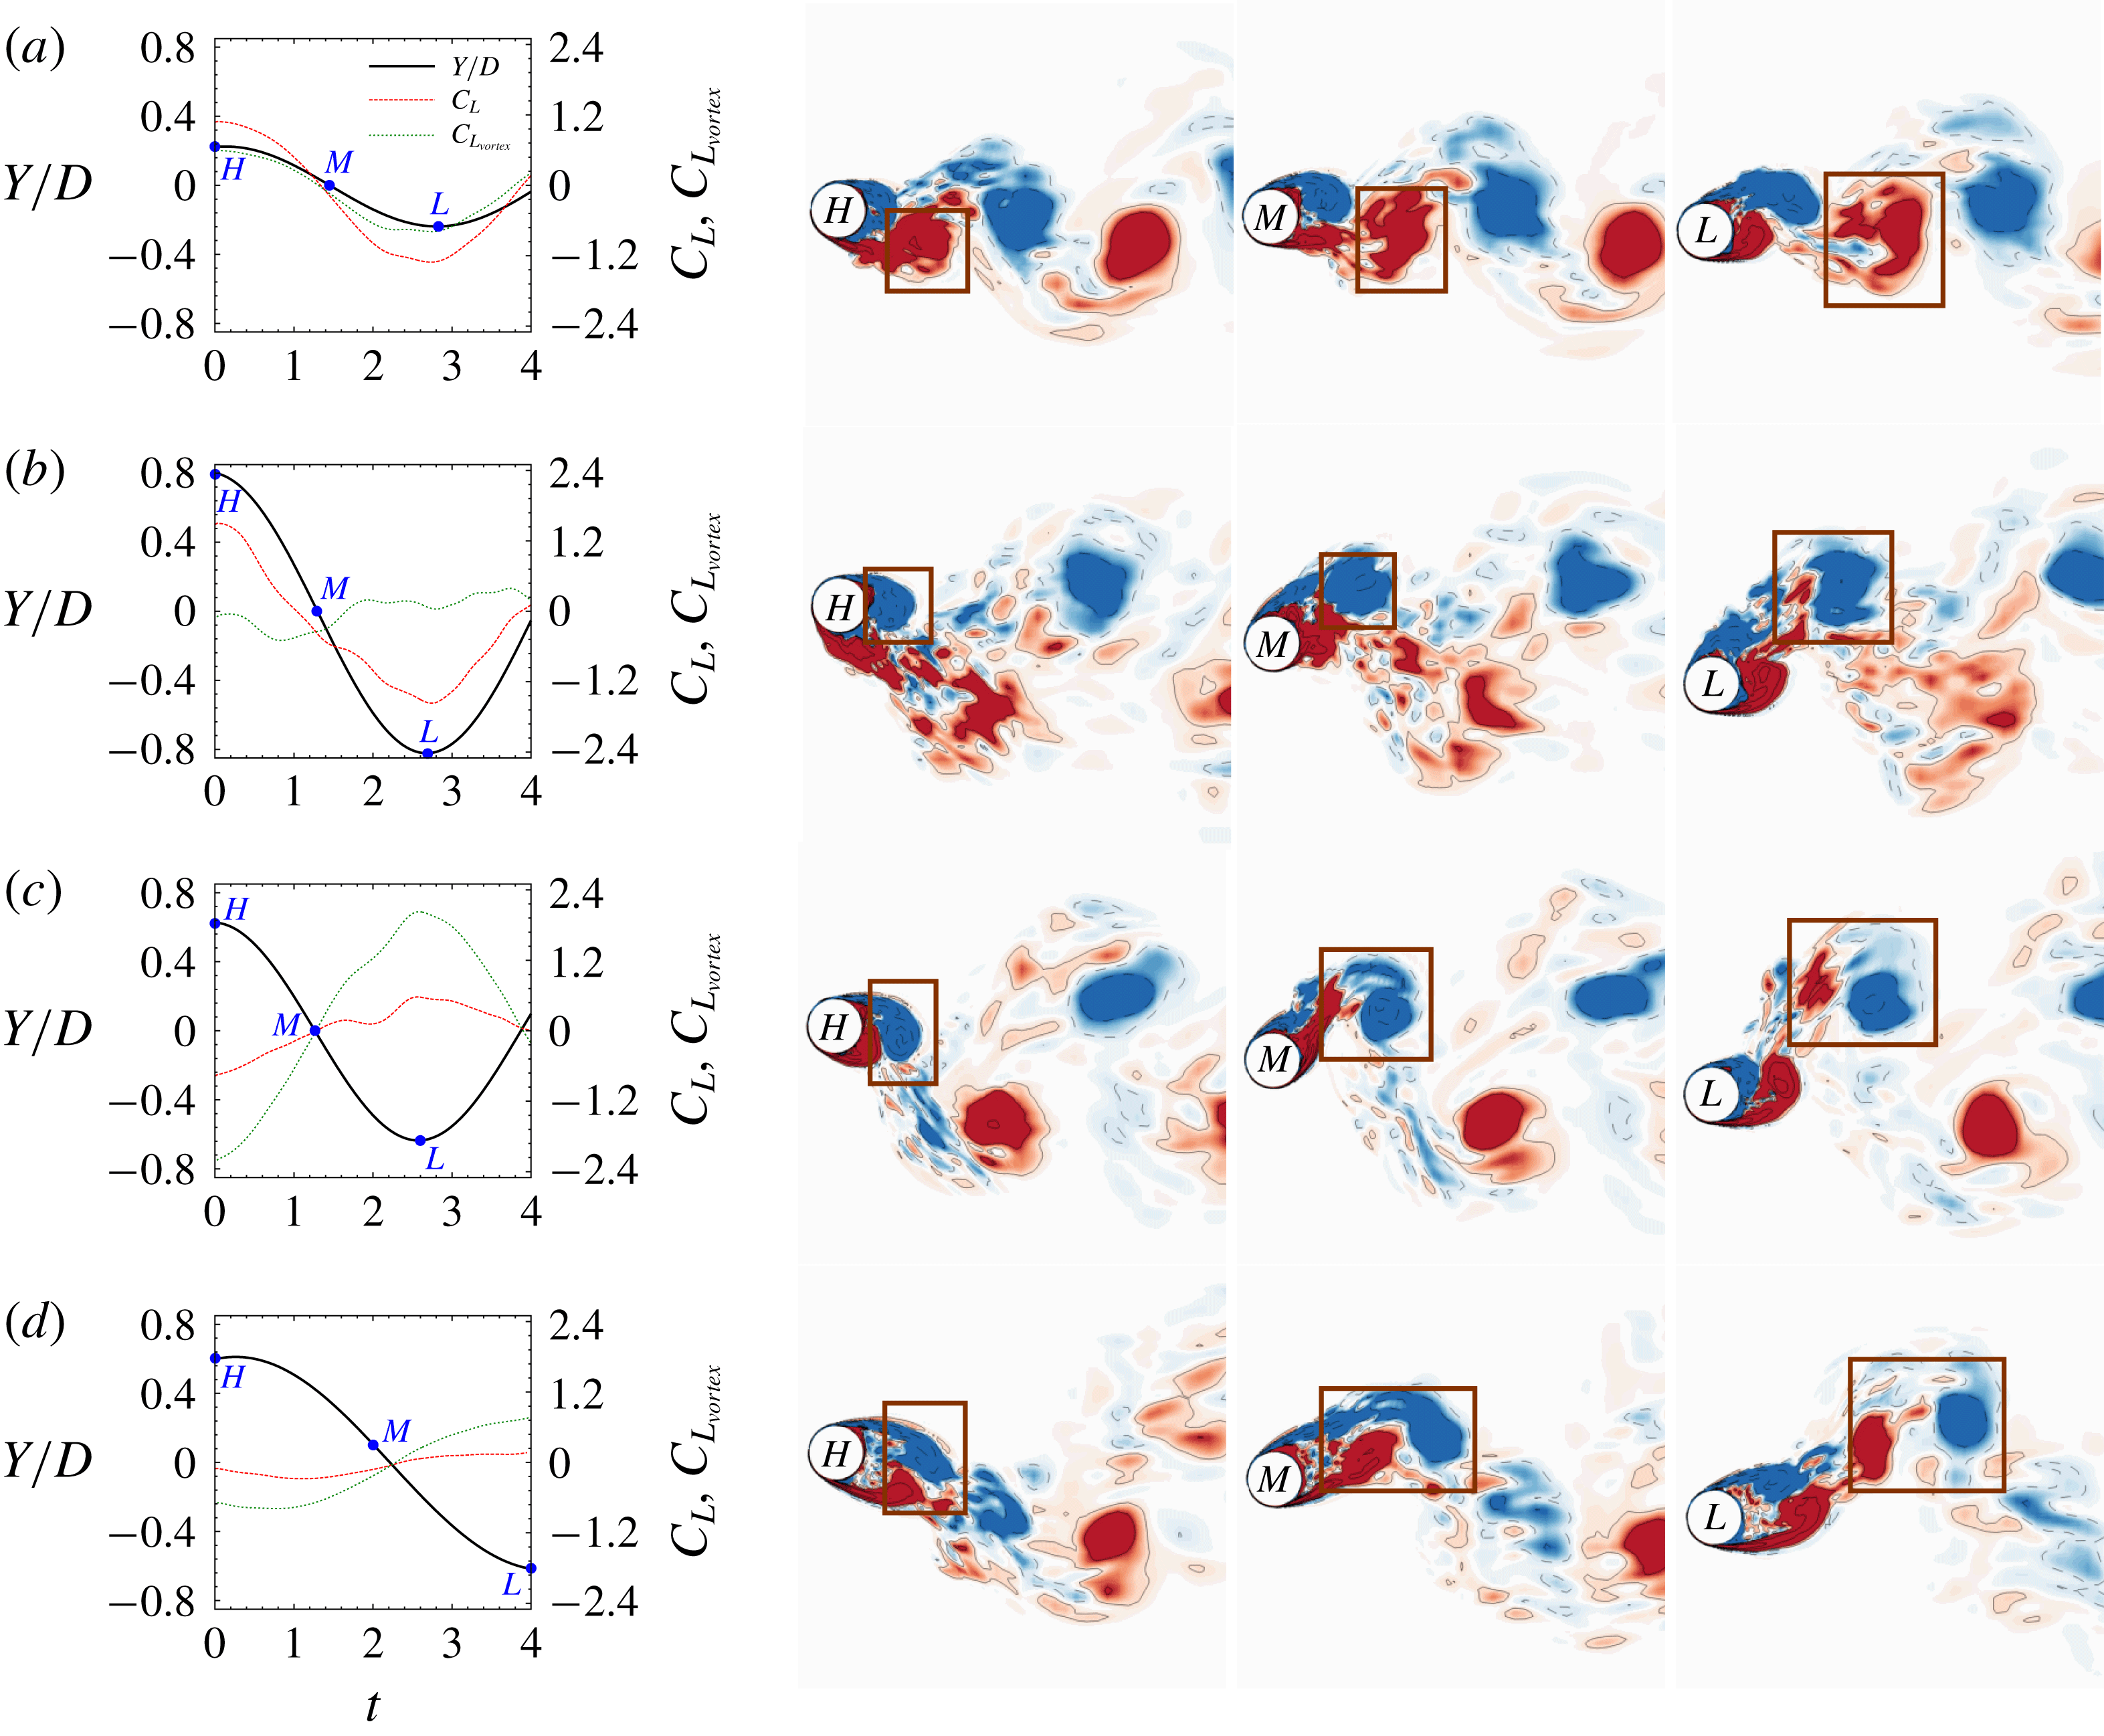
Figure 5. Flow past a freely vibrating cylinder for (a)
 $U^{\ast }=4.7$
(
$U^{\ast }=4.7$
(
 $IB$
response), (b)
$IB$
response), (b)
 $U^{\ast }=5.3$
(
$U^{\ast }=5.3$
(
 $UB^{\ast }$
response during intermittency), (c)
$UB^{\ast }$
response during intermittency), (c)
 $U^{\ast }=5.3$
(
$U^{\ast }=5.3$
(
 $LB^{\ast }$
response during intermittency) and (d)
$LB^{\ast }$
response during intermittency) and (d)
 $U^{\ast }=8.0$
(
$U^{\ast }=8.0$
(
 $LB$
response). The line plot shows the time histories of the cylinder transverse displacement,
$LB$
response). The line plot shows the time histories of the cylinder transverse displacement,
 $C_{L}$
and
$C_{L}$
and
 $C_{L_{vortex}}$
as the cylinder descends from its highest to lowest transverse location, while the remaining columns show the instantaneous span-averaged spanwise vorticity near the highest (
$C_{L_{vortex}}$
as the cylinder descends from its highest to lowest transverse location, while the remaining columns show the instantaneous span-averaged spanwise vorticity near the highest (
 $H$
), mean (
$H$
), mean (
 $M$
) and lowest (
$M$
) and lowest (
 $L$
) transverse position of the cylinder. These locations as well as the corresponding time instants are marked on the curve for transverse displacement in the line plot. For each case, a certain flow structure is tracked via a rectangular frame.
$L$
) transverse position of the cylinder. These locations as well as the corresponding time instants are marked on the curve for transverse displacement in the line plot. For each case, a certain flow structure is tracked via a rectangular frame.
3.3 Intermittency between
$UB^{\ast }$
and
$LB^{\ast }$
:
$4.7\leqslant U^{\ast }\leqslant 5.8$


Figure 6 shows the time histories of the cylinder displacement and aerodynamic coefficients for three values of reduced speed:
 $U^{\ast }=4.7$
(obtained via the decreasing-
$U^{\ast }=4.7$
(obtained via the decreasing-
 $U^{\ast }$
approach) and 5.5 are, respectively, near the lower- and higher-
$U^{\ast }$
approach) and 5.5 are, respectively, near the lower- and higher-
 $U^{\ast }$
end of the intermittent regime, while
$U^{\ast }$
end of the intermittent regime, while
 $U^{\ast }=5.1$
is in the middle of it. In
$U^{\ast }=5.1$
is in the middle of it. In
 $Y$
-only oscillation, the
$Y$
-only oscillation, the
 $UB$
and
$UB$
and
 $LB$
response for a given
$LB$
response for a given
 $U^{\ast }$
differ in the amplitude of cylinder oscillation; compared to
$U^{\ast }$
differ in the amplitude of cylinder oscillation; compared to
 $LB$
,
$LB$
,
 $UB$
is associated with higher amplitude (Khalak & Williamson Reference Khalak and Williamson1999; Govardhan & Williamson Reference Govardhan and Williamson2000; Williamson & Govardhan Reference Williamson and Govardhan2004). In
$UB$
is associated with higher amplitude (Khalak & Williamson Reference Khalak and Williamson1999; Govardhan & Williamson Reference Govardhan and Williamson2000; Williamson & Govardhan Reference Williamson and Govardhan2004). In
 $XY$
-oscillation, though the
$XY$
-oscillation, though the
 $UB^{\ast }$
and
$UB^{\ast }$
and
 $LB^{\ast }$
responses are generally well separated in terms of the transverse amplitude of the cylinder oscillation, they have similar values near the lower-
$LB^{\ast }$
responses are generally well separated in terms of the transverse amplitude of the cylinder oscillation, they have similar values near the lower-
 $U^{\ast }$
end of the intermittent regime (inset of figure 1
a). In this situation, intermittent behaviour is more apparent in the aerodynamic coefficients and streamwise response. Khalak & Williamson (Reference Khalak and Williamson1999) observed in their experiments that, during intermittency, the higher amplitude response (
$U^{\ast }$
end of the intermittent regime (inset of figure 1
a). In this situation, intermittent behaviour is more apparent in the aerodynamic coefficients and streamwise response. Khalak & Williamson (Reference Khalak and Williamson1999) observed in their experiments that, during intermittency, the higher amplitude response (
 $UB$
) is associated with a higher value of mean drag. We use their finding to separate the
$UB$
) is associated with a higher value of mean drag. We use their finding to separate the
 $UB^{\ast }$
and
$UB^{\ast }$
and
 $LB^{\ast }$
responses in the time histories for
$LB^{\ast }$
responses in the time histories for
 $U^{\ast }=4.7$
. To this end, the average value of drag coefficient over each cycle of cylinder oscillation in the transverse direction (
$U^{\ast }=4.7$
. To this end, the average value of drag coefficient over each cycle of cylinder oscillation in the transverse direction (
 $\widetilde{C_{D}}$
) is calculated. Its variation with time is shown by the thick red line atop the time history of
$\widetilde{C_{D}}$
) is calculated. Its variation with time is shown by the thick red line atop the time history of
 $C_{D}$
in figure 6(c). The intermittent switching between
$C_{D}$
in figure 6(c). The intermittent switching between
 $UB^{\ast }$
and
$UB^{\ast }$
and
 $LB^{\ast }$
is evident in the relatively large decrease/increase in
$LB^{\ast }$
is evident in the relatively large decrease/increase in
 $\widetilde{C_{D}}$
. The time intervals during which the response is associated with
$\widetilde{C_{D}}$
. The time intervals during which the response is associated with
 $UB^{\ast }$
is shaded in figure 6. It is observed that the amplitude of the streamwise displacement and cycle-averaged mean value of the streamwise displacement is higher for
$UB^{\ast }$
is shaded in figure 6. It is observed that the amplitude of the streamwise displacement and cycle-averaged mean value of the streamwise displacement is higher for
 $UB^{\ast }$
than
$UB^{\ast }$
than
 $LB^{\ast }$
. For
$LB^{\ast }$
. For
 $U^{\ast }=4.7$
, the amplitude of the lift coefficient for
$U^{\ast }=4.7$
, the amplitude of the lift coefficient for
 $UB^{\ast }$
is found to be lower than for
$UB^{\ast }$
is found to be lower than for
 $LB^{\ast }$
.
$LB^{\ast }$
.
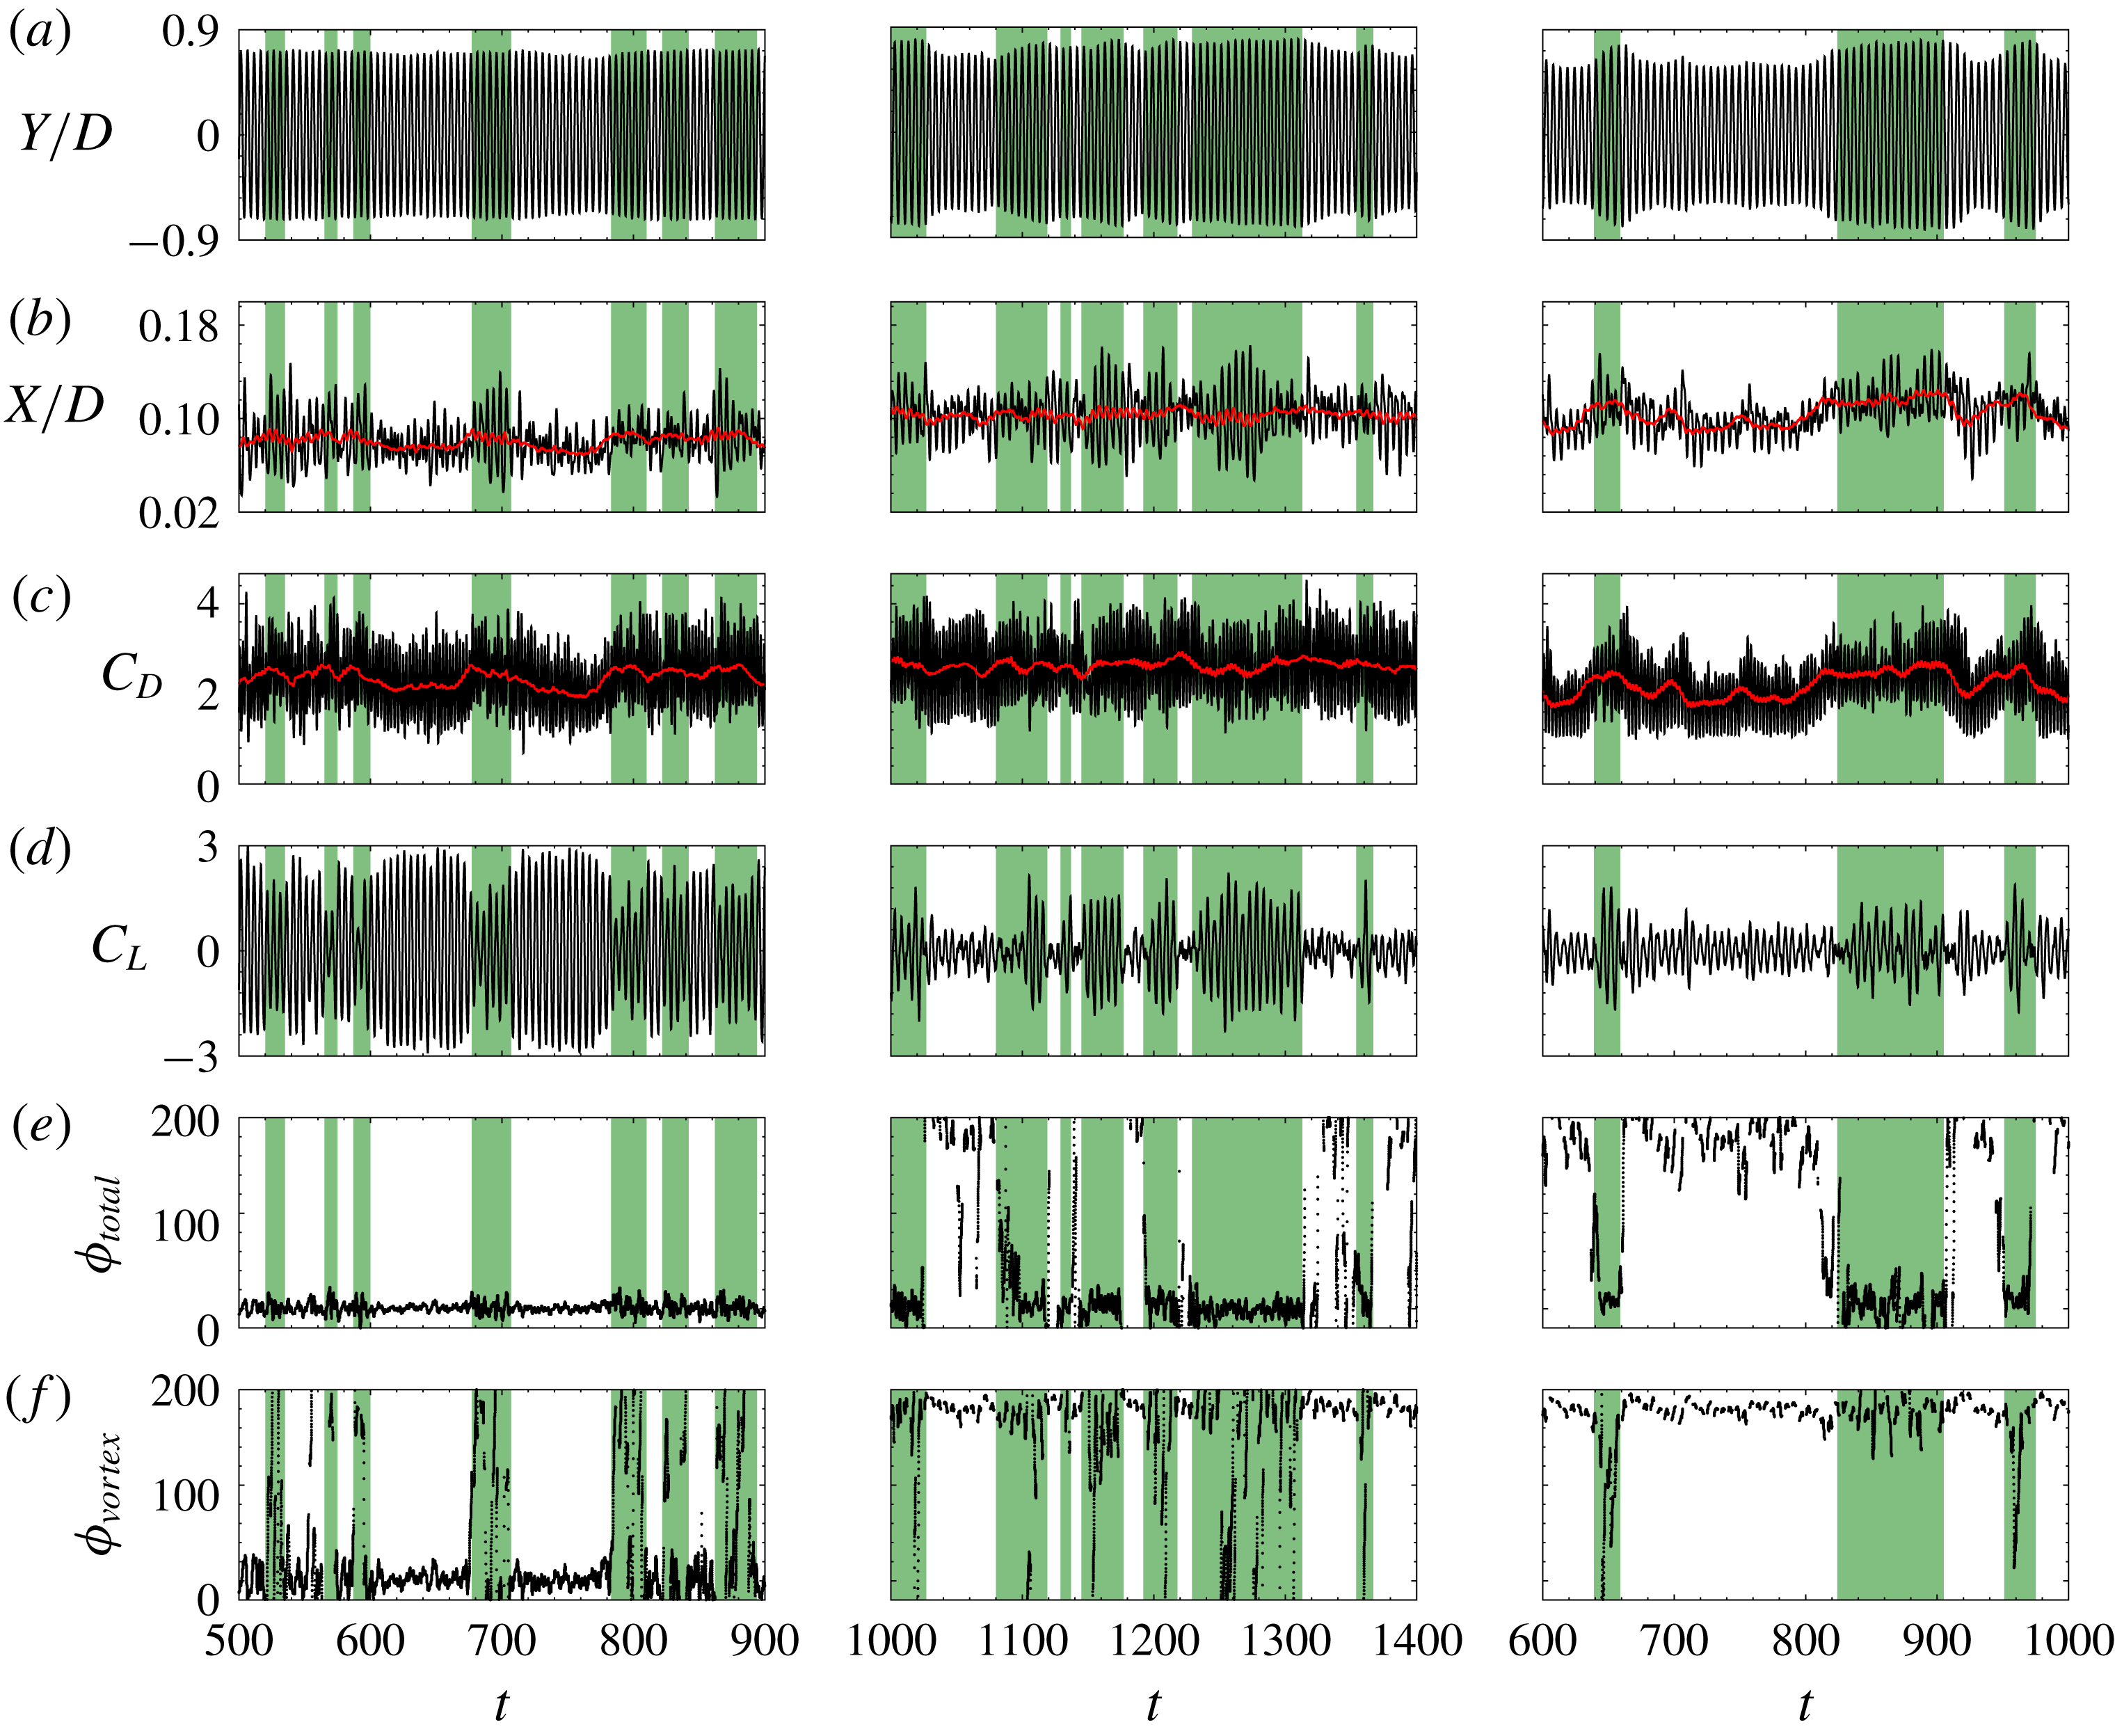
Figure 6. Flow past a freely vibrating cylinder in the intermittent regime: time histories of (a) transverse cylinder displacement, (b) streamwise cylinder displacement, (c) drag coefficient, (d) lift coefficient, (e)
 $\unicode[STIX]{x1D719}_{total}$
and (f)
$\unicode[STIX]{x1D719}_{total}$
and (f)
 $\unicode[STIX]{x1D719}_{vortex}$
. The variation of cycle-averaged value for
$\unicode[STIX]{x1D719}_{vortex}$
. The variation of cycle-averaged value for
 $X/D$
and
$X/D$
and
 $C_{D}$
is shown using a thick red line in (b) and (c), respectively. The time histories from left to right are for
$C_{D}$
is shown using a thick red line in (b) and (c), respectively. The time histories from left to right are for
 $U^{\ast }=4.7$
(decreasing
$U^{\ast }=4.7$
(decreasing
 $U^{\ast }$
),
$U^{\ast }$
),
 $U^{\ast }=5.1$
and
$U^{\ast }=5.1$
and
 $U^{\ast }=5.5$
, respectively. In each subfigure, the
$U^{\ast }=5.5$
, respectively. In each subfigure, the
 $UB^{\ast }$
response is shaded in green.
$UB^{\ast }$
response is shaded in green.
With an increase in
 $U^{\ast }$
, the difference in the amplitude of the transverse oscillation between
$U^{\ast }$
, the difference in the amplitude of the transverse oscillation between
 $UB^{\ast }$
and
$UB^{\ast }$
and
 $LB^{\ast }$
increases, thereby making the switching apparent in the transverse response of the cylinder (see
$LB^{\ast }$
increases, thereby making the switching apparent in the transverse response of the cylinder (see
 $U^{\ast }=5.1$
and 5.5 in figure 6
a). The streamwise amplitude of the cylinder oscillation as well as
$U^{\ast }=5.1$
and 5.5 in figure 6
a). The streamwise amplitude of the cylinder oscillation as well as
 $\widetilde{C_{D}}$
for
$\widetilde{C_{D}}$
for
 $UB^{\ast }$
is higher than that for
$UB^{\ast }$
is higher than that for
 $LB^{\ast }$
. This is in line with the method adopted by us for separating the
$LB^{\ast }$
. This is in line with the method adopted by us for separating the
 $UB^{\ast }$
and
$UB^{\ast }$
and
 $LB^{\ast }$
responses for
$LB^{\ast }$
responses for
 $U^{\ast }=4.7$
. For
$U^{\ast }=4.7$
. For
 $U^{\ast }=5.1$
and 5.5, the amplitude of
$U^{\ast }=5.1$
and 5.5, the amplitude of
 $C_{L}$
associated with
$C_{L}$
associated with
 $UB^{\ast }$
is higher than for
$UB^{\ast }$
is higher than for
 $LB^{\ast }$
.
$LB^{\ast }$
.
Near the higher-
 $U^{\ast }$
end of intermittent regime, the system exhibits the
$U^{\ast }$
end of intermittent regime, the system exhibits the
 $LB^{\ast }$
response for most of the time (
$LB^{\ast }$
response for most of the time (
 $U^{\ast }=5.5$
in figure 6), and the time interval between the successive appearance of the
$U^{\ast }=5.5$
in figure 6), and the time interval between the successive appearance of the
 $UB^{\ast }$
response becomes relatively large. It is, therefore, plausible that intermittent switching between
$UB^{\ast }$
response becomes relatively large. It is, therefore, plausible that intermittent switching between
 $UB^{\ast }$
and
$UB^{\ast }$
and
 $LB^{\ast }$
exists beyond
$LB^{\ast }$
exists beyond
 $U^{\ast }=5.8$
as well. However, due to constraints of the computational resources available to us at present, the computation could not be carried out for long enough to ascertain intermittent behaviour of the system beyond
$U^{\ast }=5.8$
as well. However, due to constraints of the computational resources available to us at present, the computation could not be carried out for long enough to ascertain intermittent behaviour of the system beyond
 $U^{\ast }=5.8$
.
$U^{\ast }=5.8$
.
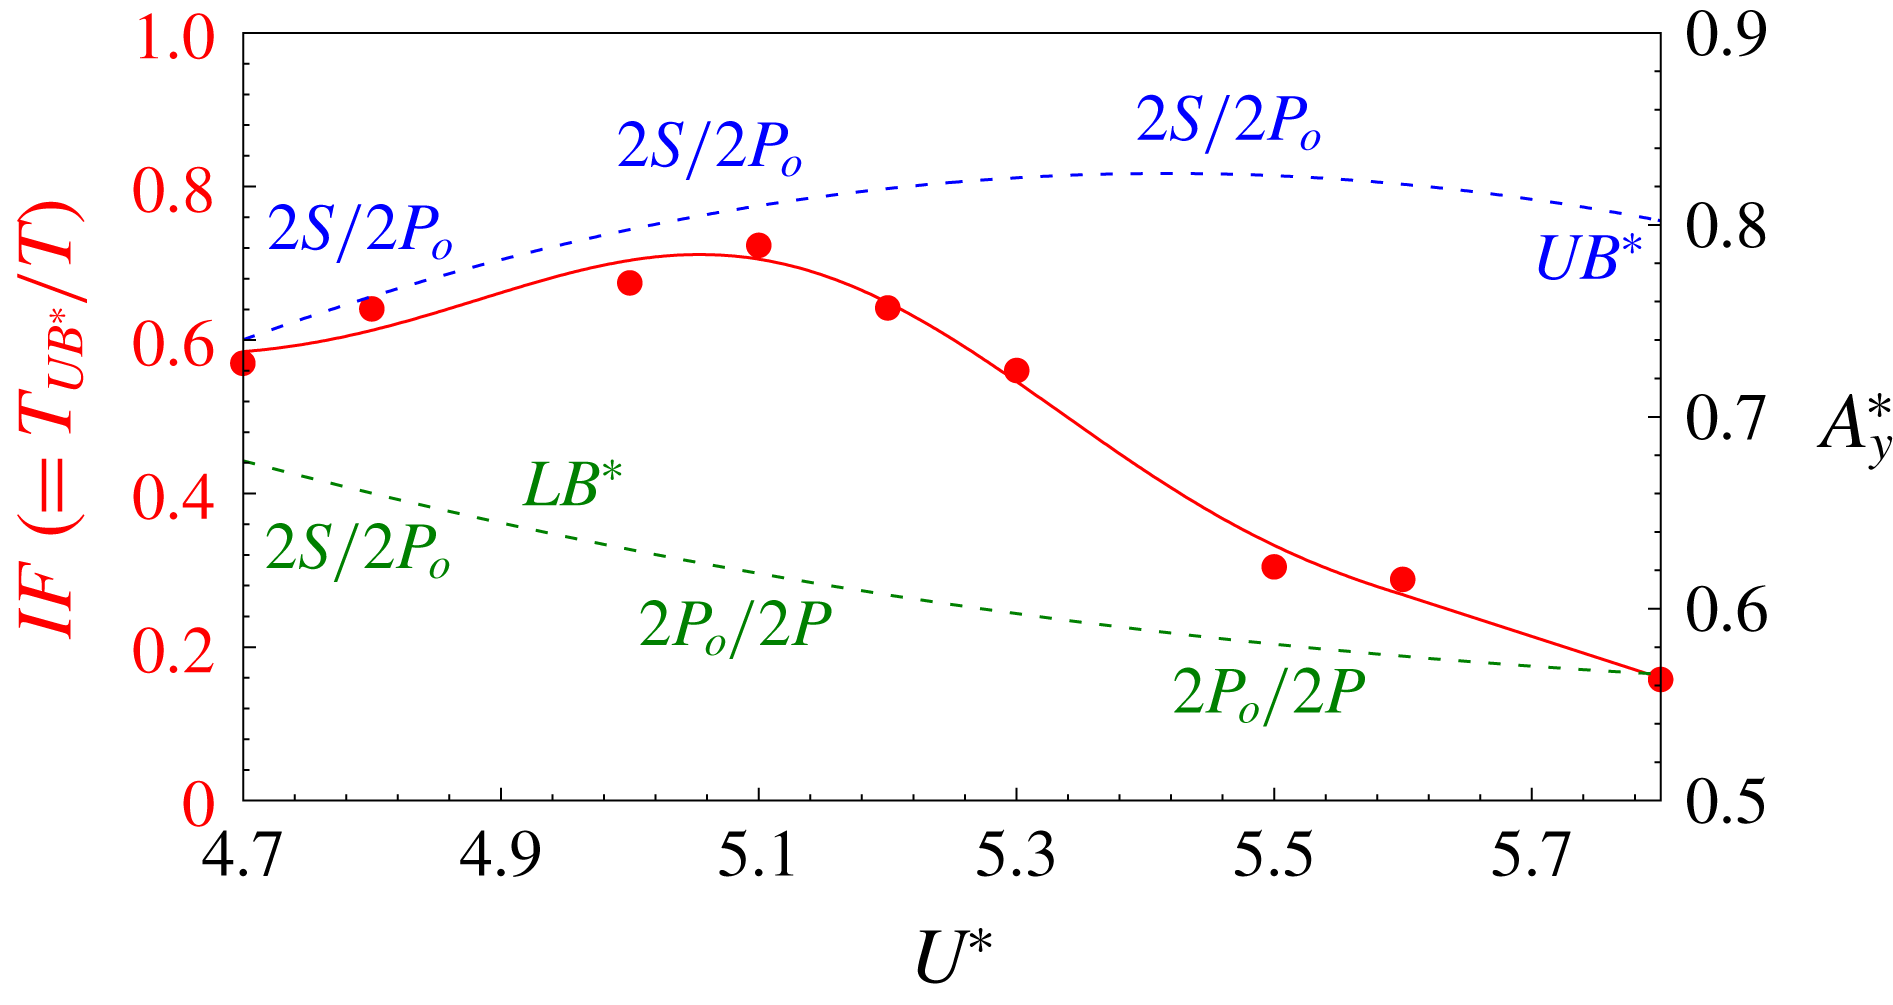
Figure 7. Flow past a freely vibrating cylinder: variation of intermittency factor (
 $IF$
) with reduced speed in the intermittent flow regime shown as filled (red) circles. The least-squares curve fit for the
$IF$
) with reduced speed in the intermittent flow regime shown as filled (red) circles. The least-squares curve fit for the
 $IF$
data points is shown using a solid (red) line. Also shown using broken lines is the amplitude response curve for
$IF$
data points is shown using a solid (red) line. Also shown using broken lines is the amplitude response curve for
 $UB^{\ast }$
(blue) and
$UB^{\ast }$
(blue) and
 $LB^{\ast }$
(green) from figure 1(a). The modes of vortex shedding at various
$LB^{\ast }$
(green) from figure 1(a). The modes of vortex shedding at various
 $U^{\ast }$
while the flow switches between
$U^{\ast }$
while the flow switches between
 $LB^{\ast }$
and
$LB^{\ast }$
and
 $UB^{\ast }$
are marked on the response curves.
$UB^{\ast }$
are marked on the response curves.
Figure 7 shows the variation of intermittency factor (
 $IF$
) with
$IF$
) with
 $U^{\ast }$
in the intermittent flow regime.
$U^{\ast }$
in the intermittent flow regime.
 $IF$
is defined as the fraction of time during which the response of the fluid–structure system is associated with the
$IF$
is defined as the fraction of time during which the response of the fluid–structure system is associated with the
 $UB^{\ast }$
response. It is observed that for
$UB^{\ast }$
response. It is observed that for
 $U^{\ast }\lesssim 5.3$
, the system has a preference for the
$U^{\ast }\lesssim 5.3$
, the system has a preference for the
 $UB^{\ast }$
response, as is evident from the value of
$UB^{\ast }$
response, as is evident from the value of
 $IF$
being greater than 0.5. On the other hand, for
$IF$
being greater than 0.5. On the other hand, for
 $U^{\ast }\gtrsim 5.3$
, the system is biased towards the
$U^{\ast }\gtrsim 5.3$
, the system is biased towards the
 $LB^{\ast }$
response. The variation of
$LB^{\ast }$
response. The variation of
 $IF$
with
$IF$
with
 $U^{\ast }$
is non-monotonic;
$U^{\ast }$
is non-monotonic;
 $IF$
increases with
$IF$
increases with
 $U^{\ast }$
up to
$U^{\ast }$
up to
 $U^{\ast }=5.1$
, and thereafter decreases. This is in line with the time histories shown in figure 6, where the fraction of the shaded region (that corresponds to
$U^{\ast }=5.1$
, and thereafter decreases. This is in line with the time histories shown in figure 6, where the fraction of the shaded region (that corresponds to
 $UB^{\ast }$
response) in the time history for
$UB^{\ast }$
response) in the time history for
 $U^{\ast }=5.1$
is higher than that for
$U^{\ast }=5.1$
is higher than that for
 $U^{\ast }=4.7$
and 5.5.
$U^{\ast }=4.7$
and 5.5.
The Williamson–Roshko map shown in figure 1(b) predicts three modes of vortex shedding in the intermittent regime:
 $2S$
,
$2S$
,
 $2P$
and
$2P$
and
 $2P_{o}$
. In the
$2P_{o}$
. In the
 $2P$
and
$2P$
and
 $2P_{o}$
mode of vortex shedding, two pairs of counter-rotating vortices are shed in one cycle of transverse oscillation of the cylinder. While the strength of the counter-rotating vortices in each pair is equal in the
$2P_{o}$
mode of vortex shedding, two pairs of counter-rotating vortices are shed in one cycle of transverse oscillation of the cylinder. While the strength of the counter-rotating vortices in each pair is equal in the
 $2P$
mode, they are different in the
$2P$
mode, they are different in the
 $2P_{o}$
mode. According to the map, the
$2P_{o}$
mode. According to the map, the
 $UB^{\ast }$
response can be associated with either the
$UB^{\ast }$
response can be associated with either the
 $2S$
or
$2S$
or
 $2P_{o}$
mode, while the
$2P_{o}$
mode, while the
 $LB^{\ast }$
response can be associated with any of the three modes. During intermittency, the flow switches between different modes of vortex shedding. Figure 5(b) shows the spanwise vorticity for
$LB^{\ast }$
response can be associated with any of the three modes. During intermittency, the flow switches between different modes of vortex shedding. Figure 5(b) shows the spanwise vorticity for
 $U^{\ast }=5.3~(UB^{\ast })$
at different time instants during the motion of the cylinder from the highest to the lowest transverse position. The same for
$U^{\ast }=5.3~(UB^{\ast })$
at different time instants during the motion of the cylinder from the highest to the lowest transverse position. The same for
 $U^{\ast }=5.3~(LB^{\ast })$
is shown in figure 5(c). In the
$U^{\ast }=5.3~(LB^{\ast })$
is shown in figure 5(c). In the
 $UB^{\ast }$
response, one CW (blue) vortex is shed in the wake as the cylinder reaches the lowest position. In addition to the CW vortex, we also observe a relatively smaller patch of positive vorticity (red) getting detached from the cylinder surface (see the region within the rectangle in the
$UB^{\ast }$
response, one CW (blue) vortex is shed in the wake as the cylinder reaches the lowest position. In addition to the CW vortex, we also observe a relatively smaller patch of positive vorticity (red) getting detached from the cylinder surface (see the region within the rectangle in the
 $L$
position of figure 5
b). For
$L$
position of figure 5
b). For
 $U^{\ast }=5.3~(LB^{\ast })$
, a pair of counter-rotating vortices is shed when the cylinder has reached the lowest position (see the region within the rectangle in the
$U^{\ast }=5.3~(LB^{\ast })$
, a pair of counter-rotating vortices is shed when the cylinder has reached the lowest position (see the region within the rectangle in the
 $L$
position of figure 5
c). The strength of the CW vortex (blue) in the pair appears to be higher than that of the CCW vortex (red). This mode of vortex shedding is reminiscent of the
$L$
position of figure 5
c). The strength of the CW vortex (blue) in the pair appears to be higher than that of the CCW vortex (red). This mode of vortex shedding is reminiscent of the
 $2P_{o}$
mode. The relative strength of the weaker vortex varies from one cycle of the cylinder oscillation to the other. In some situations, the weaker vortex is imperceptible, and the vortex shedding pattern resembles the
$2P_{o}$
mode. The relative strength of the weaker vortex varies from one cycle of the cylinder oscillation to the other. In some situations, the weaker vortex is imperceptible, and the vortex shedding pattern resembles the
 $2S$
mode. It is, therefore, difficult to associate a definite vortex shedding pattern to either the
$2S$
mode. It is, therefore, difficult to associate a definite vortex shedding pattern to either the
 $UB^{\ast }$
or the
$UB^{\ast }$
or the
 $LB^{\ast }$
response from flow visualization. We circumvent this difficulty by utilizing the co-relation between the mode of vortex shedding and the phase difference between the transverse displacement of the cylinder and lift coefficient that has been established in earlier VIV studies. In general, the lift coefficient can be split in two parts:
$LB^{\ast }$
response from flow visualization. We circumvent this difficulty by utilizing the co-relation between the mode of vortex shedding and the phase difference between the transverse displacement of the cylinder and lift coefficient that has been established in earlier VIV studies. In general, the lift coefficient can be split in two parts:
 $C_{L_{vortex}}$
and
$C_{L_{vortex}}$
and
 $C_{L_{potential}}$
. The former is attributed to vortex force and the latter is associated with the potential force (Lighthill Reference Lighthill1986; Govardhan & Williamson Reference Govardhan and Williamson2000). We denote the phase difference between
$C_{L_{potential}}$
. The former is attributed to vortex force and the latter is associated with the potential force (Lighthill Reference Lighthill1986; Govardhan & Williamson Reference Govardhan and Williamson2000). We denote the phase difference between
 $Y/D$
and total
$Y/D$
and total
 $C_{L}$
by
$C_{L}$
by
 $\unicode[STIX]{x1D719}_{total}$
and that between
$\unicode[STIX]{x1D719}_{total}$
and that between
 $Y/D$
and
$Y/D$
and
 $C_{L_{vortex}}$
by
$C_{L_{vortex}}$
by
 $\unicode[STIX]{x1D719}_{vortex}$
. The following co-relations have been reported between the vortex shedding modes and the two phase angles (Govardhan & Williamson Reference Govardhan and Williamson2000; Navrose & Mittal Reference Mittal2013; Zhao et al.
Reference Zhao, Leontini, Lo Jacono and Sheridan2014) –
$\unicode[STIX]{x1D719}_{vortex}$
. The following co-relations have been reported between the vortex shedding modes and the two phase angles (Govardhan & Williamson Reference Govardhan and Williamson2000; Navrose & Mittal Reference Mittal2013; Zhao et al.
Reference Zhao, Leontini, Lo Jacono and Sheridan2014) –
 $$\begin{eqnarray}\left.\begin{array}{@{}c@{}}2S:\unicode[STIX]{x1D719}_{total}\sim 0^{\circ },\quad \unicode[STIX]{x1D719}_{vortex}\sim 0^{\circ },\\ 2P_{o}:\unicode[STIX]{x1D719}_{total}\sim 0^{\circ },\quad \unicode[STIX]{x1D719}_{vortex}\sim 180^{\circ },\\ 2P:\unicode[STIX]{x1D719}_{total}\sim 180^{\circ },\quad \unicode[STIX]{x1D719}_{vortex}\sim 180^{\circ }.\end{array}\right\}\end{eqnarray}$$
To demonstrate the co-relation, we consider the
 $U^{\ast }=4.7$
flow (obtained via the increasing-
$U^{\ast }=4.7$
flow (obtained via the increasing-
 $U^{\ast }$
approach). The response is on
$U^{\ast }$
approach). The response is on
 $IB$
and the mode of vortex shedding in
$IB$
and the mode of vortex shedding in
 $2S$
(figure 5
a). In this situation, both
$2S$
(figure 5
a). In this situation, both
 $\unicode[STIX]{x1D719}_{total}$
and
$\unicode[STIX]{x1D719}_{total}$
and
 $\unicode[STIX]{x1D719}_{vortex}$
are expected to be close to zero. This indeed is the case, as evident from the line plot in figure 5(a), which shows the time history of
$\unicode[STIX]{x1D719}_{vortex}$
are expected to be close to zero. This indeed is the case, as evident from the line plot in figure 5(a), which shows the time history of
 $Y/D$
,
$Y/D$
,
 $C_{L}$
and
$C_{L}$
and
 $C_{L_{vortex}}$
over a half-cycle of cylinder transverse oscillation.
$C_{L_{vortex}}$
over a half-cycle of cylinder transverse oscillation.
We explore the co-relation between the two phase angles and mode of vortex shedding for three values of
 $U^{\ast }$
(
$U^{\ast }$
(
 $=4.7$
, 5.1 and 5.5) in the intermittent regime. In the intermittent regime, since the vortex shedding flips between different modes, we cannot use a plot similar to figure 5(a) to estimate
$=4.7$
, 5.1 and 5.5) in the intermittent regime. In the intermittent regime, since the vortex shedding flips between different modes, we cannot use a plot similar to figure 5(a) to estimate
 $\unicode[STIX]{x1D719}_{total}$
and
$\unicode[STIX]{x1D719}_{total}$
and
 $\unicode[STIX]{x1D719}_{vortex}$
. Instead, we use the Hilbert transform to obtain the time variation of
$\unicode[STIX]{x1D719}_{vortex}$
. Instead, we use the Hilbert transform to obtain the time variation of
 $\unicode[STIX]{x1D719}_{total}$
and
$\unicode[STIX]{x1D719}_{total}$
and
 $\unicode[STIX]{x1D719}_{vortex}$
. The method is the same as that used by Zhao et al. (Reference Zhao, Leontini, Lo Jacono and Sheridan2014) for
$\unicode[STIX]{x1D719}_{vortex}$
. The method is the same as that used by Zhao et al. (Reference Zhao, Leontini, Lo Jacono and Sheridan2014) for
 $Y$
-only oscillation. In the first step, the Hilbert transform of the time signals of
$Y$
-only oscillation. In the first step, the Hilbert transform of the time signals of
 $C_{L}$
,
$C_{L}$
,
 $C_{L_{vortex}}$
and
$C_{L_{vortex}}$
and
 $Y/D$
is carried out to estimate the time variation of the phase associated with the three signals. Thereafter, at each time instant, the phase of
$Y/D$
is carried out to estimate the time variation of the phase associated with the three signals. Thereafter, at each time instant, the phase of
 $C_{L}$
and
$C_{L}$
and
 $C_{L_{vortex}}$
is subtracted from the phase of
$C_{L_{vortex}}$
is subtracted from the phase of
 $Y/D$
to obtain instantaneous values of
$Y/D$
to obtain instantaneous values of
 $\unicode[STIX]{x1D719}_{total}$
and
$\unicode[STIX]{x1D719}_{total}$
and
 $\unicode[STIX]{x1D719}_{vortex}$
, respectively. Figures 6(e) and 6(f) shows, respectively, the variation of
$\unicode[STIX]{x1D719}_{vortex}$
, respectively. Figures 6(e) and 6(f) shows, respectively, the variation of
 $\unicode[STIX]{x1D719}_{total}$
and
$\unicode[STIX]{x1D719}_{total}$
and
 $\unicode[STIX]{x1D719}_{vortex}$
with time for
$\unicode[STIX]{x1D719}_{vortex}$
with time for
 $U^{\ast }=4.7$
(decreasing
$U^{\ast }=4.7$
(decreasing
 $U^{\ast }$
), 5.1 and 5.5. For
$U^{\ast }$
), 5.1 and 5.5. For
 $U^{\ast }=4.7$
,
$U^{\ast }=4.7$
,
 $\unicode[STIX]{x1D719}_{total}$
is close to zero at all times. On the other hand,
$\unicode[STIX]{x1D719}_{total}$
is close to zero at all times. On the other hand,
 $\unicode[STIX]{x1D719}_{vortex}$
is mostly close to zero for the
$\unicode[STIX]{x1D719}_{vortex}$
is mostly close to zero for the
 $LB^{\ast }$
response (occasionally, the value of
$LB^{\ast }$
response (occasionally, the value of
 $\unicode[STIX]{x1D719}_{vortex}$
for the
$\unicode[STIX]{x1D719}_{vortex}$
for the
 $LB^{\ast }$
response jumps close to
$LB^{\ast }$
response jumps close to
 $180^{\circ }$
, as is evident in figure 6
f at
$180^{\circ }$
, as is evident in figure 6
f at
 $t\sim 550$
), and is either close to zero or
$t\sim 550$
), and is either close to zero or
 $180^{\circ }$
for the
$180^{\circ }$
for the
 $UB^{\ast }$
response. Therefore, based on the aforementioned co-relations, the mode of vortex shedding for the
$UB^{\ast }$
response. Therefore, based on the aforementioned co-relations, the mode of vortex shedding for the
 $U^{\ast }=4.7~LB^{\ast }$
response is largely
$U^{\ast }=4.7~LB^{\ast }$
response is largely
 $2S$
, with the occasional appearance of the
$2S$
, with the occasional appearance of the
 $2P_{o}$
mode, and it regularly switches between the
$2P_{o}$
mode, and it regularly switches between the
 $2S$
and
$2S$
and
 $2P_{o}$
modes for the
$2P_{o}$
modes for the
 $UB^{\ast }$
response. A similar mix of the
$UB^{\ast }$
response. A similar mix of the
 $2S$
and
$2S$
and
 $2P_{o}$
modes is observed for the
$2P_{o}$
modes is observed for the
 $UB^{\ast }$
response of the
$UB^{\ast }$
response of the
 $U^{\ast }=5.1$
flow. The
$U^{\ast }=5.1$
flow. The
 $LB^{\ast }$
response for the
$LB^{\ast }$
response for the
 $U^{\ast }=5.1$
flow is found to be associated with either the
$U^{\ast }=5.1$
flow is found to be associated with either the
 $2P_{o}$
or
$2P_{o}$
or
 $2P$
mode. For
$2P$
mode. For
 $U^{\ast }=5.5$
, the mode of vortex shedding for the
$U^{\ast }=5.5$
, the mode of vortex shedding for the
 $LB^{\ast }$
and the
$LB^{\ast }$
and the
 $UB^{\ast }$
response is largely
$UB^{\ast }$
response is largely
 $2P$
and
$2P$
and
 $2P_{o}$
, respectively, with occasional signatures of the
$2P_{o}$
, respectively, with occasional signatures of the
 $2P_{o}$
mode in the former response and the
$2P_{o}$
mode in the former response and the
 $2S$
mode in the latter response.
$2S$
mode in the latter response.
The occurrence of different modes of vortex shedding during the intermittent regime in
 $XY$
-oscillation has been reported for
$XY$
-oscillation has been reported for
 $Y$
-only vibration as well (Zhao et al.
Reference Zhao, Leontini, Lo Jacono and Sheridan2014). Zhao et al. (Reference Zhao, Leontini, Lo Jacono and Sheridan2014) used the maximum amplitude of transverse oscillation in the entire time history to plot the response curve in the intermittent regime, and referred to it as the
$Y$
-only vibration as well (Zhao et al.
Reference Zhao, Leontini, Lo Jacono and Sheridan2014). Zhao et al. (Reference Zhao, Leontini, Lo Jacono and Sheridan2014) used the maximum amplitude of transverse oscillation in the entire time history to plot the response curve in the intermittent regime, and referred to it as the
 $UB$
response. They found that near the lower-
$UB$
response. They found that near the lower-
 $U^{\ast }$
end of the intermittent regime, the flow switches between the
$U^{\ast }$
end of the intermittent regime, the flow switches between the
 $2S$
and
$2S$
and
 $2P_{o}$
modes of vortex shedding, while it switches between the
$2P_{o}$
modes of vortex shedding, while it switches between the
 $2P_{o}$
and
$2P_{o}$
and
 $2P$
modes near the higher-
$2P$
modes near the higher-
 $U^{\ast }$
end of the intermittent regime. For the
$U^{\ast }$
end of the intermittent regime. For the
 $XY$
-oscillation, we observe that for the entire
$XY$
-oscillation, we observe that for the entire
 $UB^{\ast }$
, the vortex shedding mode switches between
$UB^{\ast }$
, the vortex shedding mode switches between
 $2S$
and
$2S$
and
 $2P_{o}$
. The system appears to have a higher preference for the
$2P_{o}$
. The system appears to have a higher preference for the
 $2P_{o}$
mode than the
$2P_{o}$
mode than the
 $2S$
mode, as is evident from the combination of
$2S$
mode, as is evident from the combination of
 $\unicode[STIX]{x1D719}_{total}$
and
$\unicode[STIX]{x1D719}_{total}$
and
 $\unicode[STIX]{x1D719}_{vortex}$
during the
$\unicode[STIX]{x1D719}_{vortex}$
during the
 $UB^{\ast }$
response for
$UB^{\ast }$
response for
 $U^{\ast }=4.7$
, 5.1 and 5.5 (shaded part of figure 6
e,f). For the
$U^{\ast }=4.7$
, 5.1 and 5.5 (shaded part of figure 6
e,f). For the
 $LB^{\ast }$
response, the results of the
$LB^{\ast }$
response, the results of the
 $XY$
-oscillation suggest that the mode of vortex shedding could be
$XY$
-oscillation suggest that the mode of vortex shedding could be
 $2S$
,
$2S$
,
 $2P_{o}$
and
$2P_{o}$
and
 $2P$
. Near the lower-
$2P$
. Near the lower-
 $U^{\ast }$
end of the intermittent regime, the mode of vortex shedding for
$U^{\ast }$
end of the intermittent regime, the mode of vortex shedding for
 $LB^{\ast }$
is mostly
$LB^{\ast }$
is mostly
 $2S$
. In the middle and higher-
$2S$
. In the middle and higher-
 $U^{\ast }$
end of the intermittent regime, the wake is a mix of the
$U^{\ast }$
end of the intermittent regime, the wake is a mix of the
 $2P_{o}$
and
$2P_{o}$
and
 $2P$
modes. Therefore, in both
$2P$
modes. Therefore, in both
 $XY$
- and
$XY$
- and
 $Y$
-only oscillation, the intermittent regime consists of a mixture of
$Y$
-only oscillation, the intermittent regime consists of a mixture of
 $2S$
,
$2S$
,
 $2P_{o}$
and
$2P_{o}$
and
 $2P$
modes of vortex shedding. The present study further brings out the flow characteristics during intermittency. The modes of vortex shedding, during intermittent switch between the
$2P$
modes of vortex shedding. The present study further brings out the flow characteristics during intermittency. The modes of vortex shedding, during intermittent switch between the
 $LB^{\ast }$
and
$LB^{\ast }$
and
 $UB^{\ast }$
response, at various
$UB^{\ast }$
response, at various
 $U^{\ast }$
are marked in figure 7.
$U^{\ast }$
are marked in figure 7.
3.4 Lower branch:
$5.9\leqslant U^{\ast }\leqslant 10.4$

Figure 8 shows the time histories of cylinder displacement and aerodynamic coefficients for
 $U^{\ast }=8.0$
. The corresponding frequency spectrum is shown alongside the time histories. The most dominant frequency for the transverse oscillation and the lift coefficient is the same. As earlier, we refer to the common fluid–structure frequency by
$U^{\ast }=8.0$
. The corresponding frequency spectrum is shown alongside the time histories. The most dominant frequency for the transverse oscillation and the lift coefficient is the same. As earlier, we refer to the common fluid–structure frequency by
 $F_{y}$
. Compared to
$F_{y}$
. Compared to
 $IB$
and intermittent regime, the level of fluctuation in the lift coefficient for
$IB$
and intermittent regime, the level of fluctuation in the lift coefficient for
 $LB$
is lower. The most dominant frequency for the streamwise oscillation and the drag coefficient is the same, and is equal to
$LB$
is lower. The most dominant frequency for the streamwise oscillation and the drag coefficient is the same, and is equal to
 $2F_{y}$
. Similar to the
$2F_{y}$
. Similar to the
 $IB$
response, the frequency spectrum of the streamwise response for
$IB$
response, the frequency spectrum of the streamwise response for
 $LB$
shows that the
$LB$
shows that the
 $F_{y}$
component is comparable in strength to the most dominant frequency. Figure 4(b) shows a close-up view of the time histories of the transverse and streamwise oscillations. Within one cycle of transverse oscillation, two peaks, one large and the other small, are observed in the streamwise response. The successive peaks occur at a frequency of
$F_{y}$
component is comparable in strength to the most dominant frequency. Figure 4(b) shows a close-up view of the time histories of the transverse and streamwise oscillations. Within one cycle of transverse oscillation, two peaks, one large and the other small, are observed in the streamwise response. The successive peaks occur at a frequency of
 $2F_{y}$
, while the pattern of a large peak followed by a small peak occurs at frequency
$2F_{y}$
, while the pattern of a large peak followed by a small peak occurs at frequency
 $F_{y}$
.
$F_{y}$
.
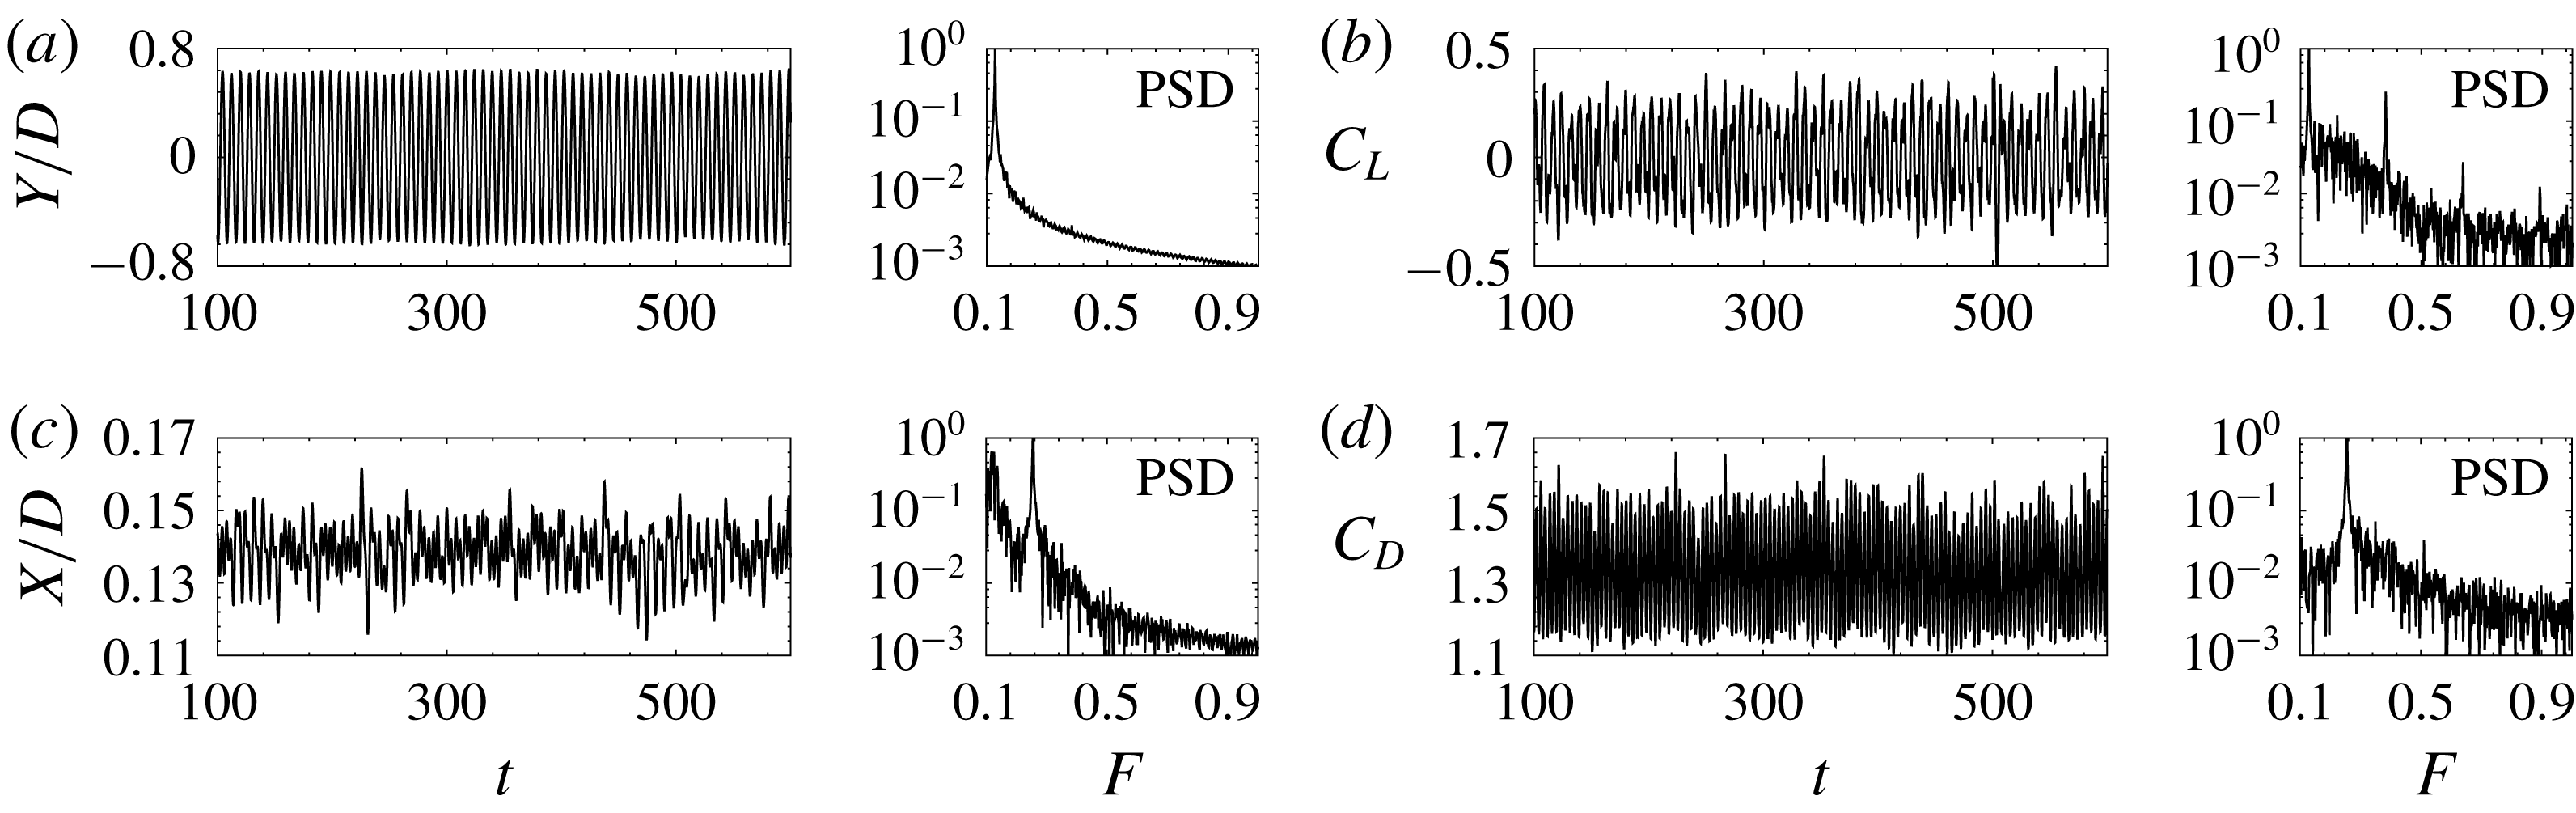
Figure 8. Flow past a freely vibrating cylinder for
 $U^{\ast }=8.0$
: time history of (a) cylinder displacement in the transverse direction, (b) lift coefficient, (c) cylinder displacement in the in-line direction and (d) drag coefficient. The corresponding frequency spectrum is shown alongside the time histories (PSD: power spectral density).
$U^{\ast }=8.0$
: time history of (a) cylinder displacement in the transverse direction, (b) lift coefficient, (c) cylinder displacement in the in-line direction and (d) drag coefficient. The corresponding frequency spectrum is shown alongside the time histories (PSD: power spectral density).
Figure 5(d) shows the spanwise vorticity for
 $LB$
. Compared to
$LB$
. Compared to
 $IB$
and the intermittent regime, the transverse width of the wake for
$IB$
and the intermittent regime, the transverse width of the wake for
 $LB$
is larger. Two pairs of counter-rotating vortices are shed in one cycle of cylinder transverse oscillation. The two vortices in each vortex pair are of equal strength. Further, both
$LB$
is larger. Two pairs of counter-rotating vortices are shed in one cycle of cylinder transverse oscillation. The two vortices in each vortex pair are of equal strength. Further, both
 $\unicode[STIX]{x1D719}_{total}$
and
$\unicode[STIX]{x1D719}_{total}$
and
 $\unicode[STIX]{x1D719}_{vortex}$
are close to
$\unicode[STIX]{x1D719}_{vortex}$
are close to
 $180^{\circ }$
, as seen from the line plot in figure 5(d). The mode of vortex shedding, therefore, is
$180^{\circ }$
, as seen from the line plot in figure 5(d). The mode of vortex shedding, therefore, is
 $2P$
. This matches with the results of
$2P$
. This matches with the results of
 $Y$
-only oscillation (Govardhan & Williamson Reference Govardhan and Williamson2000; Zhao et al.
Reference Zhao, Leontini, Lo Jacono and Sheridan2014).
$Y$
-only oscillation (Govardhan & Williamson Reference Govardhan and Williamson2000; Zhao et al.
Reference Zhao, Leontini, Lo Jacono and Sheridan2014).
4 Conclusions
A two-degree-of-freedom VIV system has been investigated via numerical simulation in the subcritical-
 $Re$
flow regime (
$Re$
flow regime (
 $1500\lesssim Re\lesssim 9000$
) for moderate mass ratio (
$1500\lesssim Re\lesssim 9000$
) for moderate mass ratio (
 $m^{\ast }=10$
). The range of the lock-in regime spans
$m^{\ast }=10$
). The range of the lock-in regime spans
 $IB$
,
$IB$
,
 $LB$
and a regime where intermittent switching occurs between a high- (
$LB$
and a regime where intermittent switching occurs between a high- (
 $UB^{\ast }$
) and a low-amplitude response (
$UB^{\ast }$
) and a low-amplitude response (
 $LB^{\ast }$
). The mode of vortex shedding for the
$LB^{\ast }$
). The mode of vortex shedding for the
 $UB^{\ast }$
response is found to be a mix of
$UB^{\ast }$
response is found to be a mix of
 $2S$
or
$2S$
or
 $2P_{o}$
, while it is can be either
$2P_{o}$
, while it is can be either
 $2S$
,
$2S$
,
 $2P_{o}$
or
$2P_{o}$
or
 $2P$
for the
$2P$
for the
 $LB^{\ast }$
response. It is observed that while the transverse force and oscillation are synchronized with respect to the most dominant frequency in the corresponding frequency spectra for the entire lock-in regime, it is not the same for in-line force and oscillation. For example, for the
$LB^{\ast }$
response. It is observed that while the transverse force and oscillation are synchronized with respect to the most dominant frequency in the corresponding frequency spectra for the entire lock-in regime, it is not the same for in-line force and oscillation. For example, for the
 $IB$
response, the most dominant frequency in the streamwise and transverse oscillations is the same, and is half the value of the most dominant frequency in
$IB$
response, the most dominant frequency in the streamwise and transverse oscillations is the same, and is half the value of the most dominant frequency in
 $C_{D}$
. On the other hand, for the
$C_{D}$
. On the other hand, for the
 $LB$
response, the most dominant frequency in the streamwise oscillation and
$LB$
response, the most dominant frequency in the streamwise oscillation and
 $C_{D}$
is the same, and is twice that of transverse oscillation. In
$C_{D}$
is the same, and is twice that of transverse oscillation. In
 $XY$
-oscillation, the system exhibits hysteresis near the higher-
$XY$
-oscillation, the system exhibits hysteresis near the higher-
 $U^{\ast }$
end of the lock-in regime that has not been reported in earlier experimental studies on
$U^{\ast }$
end of the lock-in regime that has not been reported in earlier experimental studies on
 $Y$
-only oscillation. The present work shows that the transition between various branches of cylinder response and desynchronization regimes is sensitive to streamwise oscillation even for systems with moderate mass ratios.
$Y$
-only oscillation. The present work shows that the transition between various branches of cylinder response and desynchronization regimes is sensitive to streamwise oscillation even for systems with moderate mass ratios.
Acknowledgements
The authors would like to thank Mr S. Kumar for his assistance during compilation of the data. We are grateful to Dr S. Behara, Mr A. Desai, Mr M. Furquan, Mr T. R. Sahu and Mr G. Chopra for their help with large-scale computations and flow visualization. We acknowledge the use of computational resources at the High Performance Computing facility, Computer Center, Indian Institute of Technology Kanpur that has been set up with assistance from the Department of Science and Technology (DST), India. We would also like to thank the anonymous reviewers for their feedback and insightful suggestions.


