


1. Introduction
Receptivity is known to be the first stage in laminar–turbulent transition in boundary layers. At this stage, the external perturbations are converted into instability modes of the boundary layer. For theoretical analysis of this process, the viscous–inviscid interaction theory proved to be fruitful; in our case the viscous–inviscid interaction we look at is also known as the triple-deck theory. In fact, the triple-deck theory was conceived by Lin (Reference Lin1946) in his analysis of boundary-layer stability. Lin was interested in linear perturbations that may be described by the Orr–Sommerfeld equations. In his analysis, the triple-deck model emerged when dealing with the flow behaviour near the lower branch of the neutral curve. A full nonlinear version of the triple-deck theory was later formulated by Neiland (Reference Neiland1969) and Stewartson & Williams (Reference Stewartson and Williams1969) in a completely different context – the boundary-layer separation in supersonic flow – and by Stewartson (Reference Stewartson1969) and Messiter (Reference Messiter1970) in their studies of incompressible fluid flow near the trailing edge of a flat plate. A link between Lin's (Reference Lin1946) analysis and the theory of Neiland (Reference Neiland1969) and Stewartson & Williams (Reference Stewartson and Williams1969) was established by Smith (Reference Smith1979). Soon it became clear that, in addition to boundary-layer instability and flow separation, the viscous–inviscid interaction plays a key role in many other fluid-dynamic phenomena. A review of publications in this field may be found, for instance, in the book by Sychev et al. (Reference Sychev, Ruban, Sychev and Korolev1998).
Terent'ev (Reference Terent'ev1981) was the first to apply the triple-deck theory to study the receptivity of the boundary layer. He considered an incompressible fluid flow past a flat plate, where the steady unperturbed flow was given by the Blasius solution, and assumed that small-amplitude perturbations are introduced in this flow by a ‘vibrator’, the role of which was played by a short section of the plate surface performing harmonic oscillations perpendicular to the main flow. Terent'ev's formulation represented a simplified model of the classical experiments conducted by Schubauer & Skramsted (Reference Schubauer and Skramsted1948), where the Tollmien–Schlichting waves were generated by a vibrating ribbon installed a short distance above the plate surface.
Ruban (Reference Ruban1984) and Goldstein (Reference Goldstein1985) used the triple-deck theory to study the generation of Tollmien–Schlichting waves by acoustic noise. In these works an important principle of double resonance was formulated. According to this principle, efficient generation of the instability modes in boundary layers is observed when both the frequency and the wavenumber of external perturbations coincide with those in the natural oscillations of the boundary layer. The theory of Ruban (Reference Ruban1984) and Goldstein (Reference Goldstein1985) shows that, if the acoustic field has a wide enough spectrum, then the receptivity process will ‘extract’ from it a harmonic whose frequency is in tune with the frequency of the corresponding Tollmien–Schlichting wave. Of course, under this condition the wavelength of the chosen acoustic wave appears to be much longer than the wavelength of the Tollmien–Schlichting wave, which means that the second resonance condition, the tuning of the wavenumbers, is not satisfied. However, if the surface of the wing is not absolutely smooth (which, of course, is the case in all practical applications), then one also needs to look at the perturbations produced in the boundary layer due to the wall roughnesses. These perturbations are steady and have a short length scale necessary for the resonance. Using the triple-deck model, Ruban (Reference Ruban1984) and Goldstein (Reference Goldstein1985) were able to find the amplitude of the Tollmien–Schlichting wave forming behind the roughness.
This approach was subsequently used in a number of theoretical studies of boundary-layer receptivity. Duck, Ruban & Zhikharev (Reference Duck, Ruban and Zhikharev1996) developed a theory of the generation of Tollmien–Schlichting waves by free-stream turbulence. The receptivity of the boundary layer to vibrations of the wing surface was investigated by Ruban, Bernots & Pryce (Reference Ruban, Bernots and Pryce2013). A transonic version of the Ruban–Goldstein theory was presented by Ruban, Bernots & Kravtsova (Reference Ruban, Bernots and Kravtsova2016). In that paper, in addition to linear receptivity theory, also nonlinear receptivity was studied. The latter is applicable to situations when the boundary layer develops local separation near a surface roughness. In the above studies, it was assumed that the body surface had a single roughness element. The theory was extended to the case of distributed roughness by Wu (Reference Wu2001).
In the present paper we are concerned with the receptivity of marginally separated boundary layers. The theory of marginal separation was developed independently by Ruban (Reference Ruban1981, Reference Ruban1982a) and Stewartson, Smith & Kaups (Reference Stewartson, Smith and Kaups1982). It applies to situations when a small separation region forms on a smooth segment of the body contour. A classical example is the flow near the leading edge of a thin aerofoil. It is known that, for each aerofoil shape, there exists a critical angle of attack  $\alpha _s$. For all angles of attack
  $\alpha$ smaller than
  $\alpha _s$, the flow over a thin aerofoil remains attached. However, when
  $\alpha$ reaches
  $\alpha _s$, a small region of recirculating flow is observed to form on the upper surface of the aerofoil. It remains small even when the angle of attack
  $\alpha$ grows beyond
  $\alpha _s$, which is why it is referred to as a short bubble. Its length does not exceed 1 % of the aerofoil chord, and, therefore, it has an extremely weak influence on the flow field and the values of the aerodynamic forces acting on the aerofoil. However, the short separation bubble only exists within an interval
  $\alpha \in (\alpha _s , \alpha _c)$, and, when the angle of attack reaches the second critical value
  $\alpha _c$, the bubble suddenly bursts. As a result, a transition to a new flow regime takes place with an extended separation region. Ruban (Reference Ruban1981, Reference Ruban1982a) and Stewartson et al. (Reference Stewartson, Smith and Kaups1982) deduced that the laminar, steady, two-dimensional flow in the bubble and around it can be described by an integro-differential equation for the skin friction
  $A (X)$, where
  $X$ is a coordinate measured along the aerofoil contour.
The numerical solution of this integro-differential equation shows that the separation bubble forms at  $a = a_s = 1.139$, and it bursts at
  $a = a_c = 1.330$, where
  $a$ denotes the angle-of-attack parameter.
The theory was extended to unsteady flows by Ruban (Reference Ruban1982b) and Smith (Reference Smith1982). Both authors found that the unsteady analogue of this problem leads to an integro-differential equation for the skin friction  $A(X,T)$, where
  $T$ is appropriately scaled dimensionless time. However, when dealing with this equation, they pursued different goals. Ruban (Reference Ruban1982b) was interested in the linear and nonlinear stability of the marginally separated flow. He found that the flow was subcritically unstable. He also found that, in the flow considered, the wavelength of the Tollmien–Schlichting wave is comparable with the size of the separation region, which precludes the use of the normal-mode representation of the linear perturbations for the flow stability analysis, as is done with conventional boundary layers. Smith (Reference Smith1982) discovered that the unsteady marginal separation equation admits solutions that terminate at a finite-time singularity. He suggested that these solutions describe the process of ‘bubble bursting’. Later Ryzhov & Smith (Reference Ryzhov and Smith1984) discussed this issue in more detail, and concluded that the initial value problem for
  $A(X,T)$ was ill-posed, namely, it was found that any small perturbation to the solution of the steady equation integro-differential equation grows very fast, leading to the above-mentioned singularity.
Based on these results, one might expect an immediate laminar–turbulent transition to take place in the separation bubble. However, this conclusion is not supported by experimental evidence; see reviews by Ward (Reference Ward1963) and Tani (Reference Tani1964). Not only are the short separation bubbles discovered as a result of experimental observations, but also the experiments show that, in the majority of cases of practical interest, these bubbles are laminar. As pointed out by Ely & Herring (Reference Ely and Herring1978), the reason for this is that, in the flow near the leading edge of an aerofoil, it is not the aerofoil chord but a much smaller quantity, the radius of the aerofoil nose  $r$, that plays the role of the characteristic length scale. Under conditions typical of aerodynamic applications, the Reynolds number
  $Re = V_{\infty } r / \nu$ is not large enough for the attached boundary layer to become turbulent. In fact, the flow is observed to remain laminar even after the short separation bubble is formed. However, separated flows are known to be less stable and undergo a rather rapid transition to turbulence before the reattachment point.
This present paper studies the behaviour of small-amplitude perturbations in a steady marginally separated boundary layer. For simplicity, we assume that the perturbations are produced by local suction/blowing through the body surface. Since, in flight conditions, the perturbations interacting with the boundary layer (wing vibrations, acoustic noise, free-stream turbulence, etc.) are periodic in time, we shall assume that the suction/blowing is also periodic. We start in § 2 with the formulation of the problem. In § 3 we look at the behaviour of two-dimensional perturbations. In the flow considered, neither the process of generation of the Tollmien–Schlichting waves nor their evolution in the boundary layer can be investigated using the concept of the quasi-parallel approximation, which precludes the normal-mode representation of the perturbations. Instead, we solve the linearised integro-differential equation of the marginal separation theory, which was done numerically. The results of the calculations show that the perturbations first grow in the inside of the separation region, but then start to decay downstream. In § 4 we consider the three-dimensional perturbations. In this case, instead of dealing with the integro-differential equation of marginal separation, we found it convenient to work with the Fourier transforms of the fluid-dynamic functions. The equations for the Fourier transforms are also solved numerically. The results of the calculations are presented in § 5. They show that a three-dimensional wave packet forms downstream of the source of perturbations in the boundary layer.
While, in this paper, when presenting the results of our study, we refer to the flow near the leading edge of a thin aerofoil, it should be noted that the theory is also applicable to a variety of other flows where small separation bubbles form on a smooth part of the body surface. These include supersonic flows on a surface with large curvature (Fomina Reference Fomina1983), the separation of a three-dimensional boundary layer on the surface of a paraboloid at an angle-of-attack (Brown Reference Brown1985), incipient separation in a near-wall jet (Zametaev Reference Zametaev1986) and in the boundary layer on the surface of a fast rotating cylinder (Negoda & Sychev Reference Negoda and Sychev1986), etc. For a discussion of various aspects of marginal separation theory, the interested reader is referred to Braun & Kluwick (Reference Braun and Kluwick2004) and Braun & Scheichl (Reference Braun and Scheichl2014).
2. Problem formulation
We consider an incompressible fluid flow near the leading edge of a thin aerofoil; see figure 1. We denote the fluid density by  $\rho$ and the dynamic viscosity coefficient by
  $\mu$. We further denote the free-stream velocity before the aerofoil by
  $V_{\infty }$, and the radius of curvature of the aerofoil contour at its nose by
  $r$. Using these quantities, the Reynolds number is calculated as
 \begin{equation} Re = \frac{\rho V_{\infty } r}{\mu } . \end{equation}
Figure 1. The flow near the leading edge of a thin aerofoil.
2.1. Inviscid flow region
If  $Re$ is large, then Prandtl's hierarchical strategy can be used to study the flow. The first step in this strategy is to consider the bulk of the flow where the flow is inviscid and is described by the Euler equations. These have to be solved with the impermeability condition on the body surface. If the aerofoil has a parabolic nose (
 $Y^{\prime } = \pm \sqrt {2 X^{\prime }}$), then the solution of the inviscid problem can be found in analytic form. In particular, the tangential velocity on the aerofoil surface is given by
 \begin{equation} U_e = \frac{Y^{\prime } + k}{\sqrt{Y^{\prime\,2} + 1}} . \end{equation}
Here we use Cartesian coordinates  $(X^{\prime }, Y^{\prime })$, with
  $X^{\prime }$ measured along the axis of symmetry of the parabola from the leading edge of the aerofoil. All the variables in (2.2) are dimensionless;
  $X^{\prime }$ and
  $Y^{\prime }$ are scaled with the nose radius
  $r$, and the tangential velocity
  $U_e$ is referred to the free-stream velocity
  $V_{\infty }$. The parameter
  $k$ is related to the angle of attack, and defines the position of the front stagnation point
  $O$; see figure 1. Indeed, setting
  $Y^{\prime } = - k$ in (2.2) makes
  $U_e$ zero. Away from point
  $O$, the velocity
  $U_e$ first increases, reaching its maximum value
  $\sqrt {1 + k^2}$ at point
  $M$ where
  $Y^{\prime } = 1/k$, and then decreases monotonically, tending to
  $U_e = 1$. As a result, the boundary layer that forms on the aerofoil surface finds itself under the action of the adverse pressure gradient, and may develop a separation.
2.2. Boundary layer
To study the behaviour of the boundary layer, it is convenient to use the body-fitted coordinates  $(x , y)$, with
  $x$ measured along the aerofoil surface from the front stagnation point
  $O$, as shown in figure 1, and
  $y$ in the normal direction. We denote the velocity components in these coordinates as
  $V_{\tau }$ and
  $V_n$, respectively. All the variables are assumed dimensionless. We take the radius
  $r$ of the leading edge of the aerofoil as the unit of length; the velocity components are referred to
  $V_{\infty }$. According to Prandtl (Reference Prandtl1904), in the boundary layer, the velocity components are represented by the asymptotic expansions
 \begin{equation} V_{\tau } = U (x , Y) + \cdots , \quad V_n = Re^{-1/2} V (x , Y) + \cdots , \quad \text{with} \ y = Re^{-1/2} Y . \end{equation}
Here, the functions  $U (x , Y)$ and
  $V(x , Y)$ obey the classical boundary-layer equations:
 \begin{equation} U \frac{\partial U}{\partial x} + V \frac{\partial U}{\partial Y} = U_e \frac{\textrm{d} U_e}{\textrm{d} x} + \frac{\partial ^2 U}{\partial Y^2} , \quad \frac{\partial U}{\partial x} + \frac{\partial V}{\partial Y} = 0 . \end{equation}
These have to be solved with the no-slip conditions on the aerofoil surface,
 \begin{equation} U = V = 0 \quad \text{at} \ Y = 0 , \end{equation}
and the condition of matching with the solution in the inviscid flow region,
 \begin{equation} U = U_e (x) \quad \text{at} \ Y = \infty . \end{equation}
The results of the numerical solution of problem (2.4a,b)–(2.6) are shown in figure 2 in the form of the skin friction distribution along the aerofoil surface. The skin friction is calculated as
 \begin{equation} \tau _w = \left.\frac{\partial ^2 \varPsi }{\partial Y^2}\right|_{Y = 0} , \end{equation}
where  $\varPsi$ is the streamfunction defined as
 \begin{equation} \psi= Re^{-1/2} \varPsi(x, Y) + \cdots, \quad \mbox{with} \ y=Re^{-1/2}Y. \end{equation}
One can see that there exists a critical value of angle-of-attack parameter  $k = k_0 = 1.1575$. If
  $k < k_0$, then the skin friction has a minimum at some point on the upper surface of the aerofoil where the pressure gradient is adverse. The value of the minimum decreases as
  $k$ increases, and becomes zero at
  $k = k_0$. We denote the coordinate of the point where
  $\tau _w$ first becomes zero by
  $x_0$. The calculations show that for the boundary layer on the parabola surface
  $x_0 = 8.265$. The corresponding solution of the boundary-layer equations (2.4a,b) proves to be singular. The nature of this singularity was discussed in detail by Ruban (Reference Ruban1981).
2.3. Interaction region
The appearance of the singularity at point  $x = x_0$ makes Prandtl's hierarchical approach inapplicable for describing the flow in the vicinity of this point. Instead, one has to use the viscous–inviscid interaction theory; see Ruban (Reference Ruban1982a) and Stewartson et al. (Reference Stewartson, Smith and Kaups1982). According to this theory, the interaction region assumes the three-tiered structure shown in figure 3. In the lower tier (region 1), the flow is relatively slow, and therefore very sensitive to pressure perturbations. Being exposed to an adverse pressure gradient, this region produces the main contribution to the displacement effect of the boundary layer. The resulting deformation of the streamlines is then transferred through the middle tier (region 2) to the upper tier (region 3) where it is then ‘converted’ into the perturbations of the pressure. This process is described by the potential flow theory. As far as region 2 is concerned, it plays a passive role in the interaction process. It does not contribute to the displacement effect of region 1. It also does not change the pressure gradient when transferring it from region 3 to region 1.

Figure 3. The interaction region.
When deriving the equations for the flow in the interaction region, we shall consider separately the unsteady two-dimensional flow and unsteady three-dimensional flow.
3. Unsteady two-dimensional flow
3.1. Governing equation
When dealing with a two-dimensional flow, we can introduce the streamfunction  $\psi$ such that
  $\partial \psi / \partial x = - (1 + \kappa y) V_n$ and
  $\partial \psi / \partial y = V_{\tau }$, where
  $\kappa (x)$ is the local curvature of the aerofoil contour. The asymptotic expansion of
  $\psi$ in region 1 takes the form
 \begin{align} \psi &= Re^{-13/20} \tfrac{1}{6} \lambda _0 Y_{\ast }^3 + Re^{-16/20} \varPsi _1^{\ast } (t_{\ast } , x_{\ast } , Y_{\ast }) \nonumber\\ & \quad + Re^{-19/20} \varPsi _2^{\ast } (t_{\ast } , x_{\ast } , Y_{\ast }) + \cdots , \end{align}
with the independent variables
 \begin{equation} t_{\ast } = \frac{t}{Re^{1/20}} , \quad x_{\ast } = \frac{x - x_0}{Re^{-1/5}} , \quad Y_{\ast } = \frac{y}{Re^{-11/20}} . \end{equation}
Here  $t$ is time made dimensionless by referring it to
  $r / V_{\infty }$.
Corresponding to (3.1), the asymptotic expansion of the pressure is written as
 \begin{equation} p = P_{e0} + Re^{-1/5} \lambda _0 x_{\ast } + Re^{-1/2} P^{\ast } (t_{\ast } , x_{\ast } , Y_{\ast }) + \cdots . \end{equation}
Constants  $P_{e0}$ and
  $\lambda _0$ are the pressure and the pressure gradient at the ‘centre’
  $(x = x_0)$ of the interaction region. They can be easily calculated using the inviscid solution (2.2) and the Bernoulli equation.
Substituting (3.1) into the Navier–Stokes equations, and assuming that the angle-of-attack parameter
 \begin{equation} k = k_0 + Re^{-2/5} k_1 , \end{equation}
with  $k_1$ being an order-one constant, we have in the leading-order approximation the following equation for
  $\varPsi _1^{\ast } (x_{\ast } , Y_{\ast })$:
 \begin{equation} \frac{1}{2} \lambda _0 Y_{\ast }^2 \frac{\partial ^2 \varPsi _1^{\ast }} {\partial x_{\ast } \partial Y_{\ast }} - \lambda _0 Y_{\ast } \frac{\partial \varPsi _1^{\ast }}{\partial x_{\ast }} = \frac{\partial ^3 \varPsi _1^{\ast }} {\partial Y_{\ast }^3} . \end{equation}
This equation has to be solved with the no-slip conditions on the aerofoil surface,
 \begin{equation} \varPsi _1^{\ast } = \frac{\partial \varPsi _1^{\ast }}{\partial Y_{\ast }} = 0 \quad \text{at} \ Y_{\ast } = 0 , \end{equation}
and an additional requirement that  $\varPsi _1^{\ast }$ does not grow exponentially as
  $Y_{\ast } \to \infty$. By direct substitution into (3.5) and (3.6), one can easily verify that the sought solution has the form
 \begin{equation} \varPsi _1^{\ast } = \tfrac{1}{2} A_{\ast} (t_{\ast} , x_{\ast}) Y_{\ast}^2. \end{equation}
 At this stage,  $A_{\ast } (t_{\ast } , x_{\ast })$ remains arbitrary. We do, however, know, from the solution in the boundary layer before the interaction region (see §§ 5.3.3 and 5.3.4 in Ruban (Reference Ruban2018)), that
 \begin{equation} A_{\ast } = a_0 (-x_{\ast }) + k_1 a_1 (-x_{\ast })^{-1} + \cdots \quad \text{as} \ x_{\ast } \to -\infty , \end{equation}
where  $a_0$ and
  $a_1$ are constants depending on the aerofoil shape. For an aerofoil with parabolic leading edge,
  $a_0 = 0.0085$ and
  $a_1 = -1.24$. To find function
  $A_{\ast } (t_{\ast } , x_{\ast })$, one needs to consider the second-order approximation. The equation for
  $\varPsi _2^{\ast } (x_{\ast } , Y_{\ast })$ is written as
 \begin{equation} \frac{1}{2} \lambda _0 Y_{\ast }^2 \frac{\partial ^2 \varPsi _2^{\ast }} {\partial x_{\ast } \partial Y_{\ast }} - \lambda _0 Y_{\ast } \frac{\partial \varPsi _2^{\ast }}{\partial x_{\ast }} = \frac{\partial ^3 \varPsi _2^{\ast }} {\partial Y_{\ast }^3} - \frac{\partial A_{\ast }}{\partial t_{\ast }} Y_{\ast } - \frac{1}{2} A_{\ast } \frac{\partial A_{\ast }}{\partial x_{\ast }} Y_{\ast }^2 - \frac{\partial P^{\ast }}{\partial x_{\ast }} . \end{equation}
When formulating the boundary conditions for this equation, we shall assume that the suction/blowing is perpendicular to the aerofoil surface, and is given by
 \begin{equation} v|_{y=0} = Re^{-3/4} v_w^{\ast } ( t_{\ast } , x_{\ast }) . \end{equation}
We will then have
 \begin{equation} \frac{\partial \varPsi _2^{\ast }}{\partial Y_{\ast }} = 0 , \quad \frac{\partial \varPsi _2^{\ast }}{\partial x_{\ast }} = - v_w^{\ast } ( t_{\ast } , x_{\ast }) \quad \text{at} \ Y_{\ast } = 0 . \end{equation}
 Since the pressure gradient  $\partial P^{\ast } / \partial x_{\ast }$ in (3.9) is unknown, in addition to the viscous region 1, we also need to consider the upper tier, region 3; see figure 3. The asymptotic expansion of the pressure in region 3 is written as
 \begin{equation} p = P_{e0} + Re^{-1/5} \lambda _0 x_{\ast } + Re^{-1/2} p^{\ast } (t_{\ast } , x_{\ast } , y_{\ast }) + \cdots , \end{equation}
where
 \begin{equation} y_{\ast } = \frac{y}{Re^{-1/5}} . \end{equation}
Outside the boundary layer, the flow is potential and, therefore, the pressure perturbation function  $p^{\ast }$ satisfies the Laplace equation:
 \begin{equation} \frac{\partial ^2 p^{\ast }}{\partial x_{\ast }^2} + \frac{\partial ^2 p^{\ast }}{\partial y_{\ast }^2} = 0 . \end{equation}
This has to be solved with the boundary condition (for details, see § 5.4.4 in Ruban (Reference Ruban2018))
 \begin{equation} \frac{\partial p^{\ast }}{\partial y_{\ast }} = \frac{U_0^2}{\lambda _0} \frac{\partial ^2 A_{\ast }}{\partial x_{\ast }^2} \quad \text{at} \ y_{\ast } = 0 , \end{equation}
and the requirement that  $p^{\ast }$ tends to zero as
  $x_{\ast }^2 + y_{\ast }^2 \to \infty$. Constant
  $U_0$ denotes the value of the velocity (2.2) at
  $x = x_0$.
Equation (3.15) provides the first link between regions 1 and 3. The second is given by
 \begin{equation} P^{\ast} (t_{\ast } , x_{\ast }) = p^{\ast } |_{y_{\ast } = 0} . \end{equation}
 It may be shown (see e.g. Braun & Kluwick Reference Braun and Kluwick2004) that the solution of the viscous–inviscid interaction problem (3.8)–(3.16), where  $\varPsi _2^{\ast }$ does not grow exponentially as
  $Y_{\ast } \to \infty$, exists if and only if function
  $A_{\ast } (t_{\ast } , x_{\ast })$ satisfies the equation
 \begin{align} A^2 - X^2 + 2 a &= \varLambda \int_X^{\infty } \frac{\partial ^2 A} {\partial \xi ^2} (T , \xi ) \,\frac{\textrm{d} \xi }{\sqrt{\xi - X}} \nonumber\\ &\quad - \gamma \int_{-\infty }^X \left[ \frac{\partial A} {\partial T} (T , \xi ) + v_w (\xi ) \right] \frac{\textrm{d} \xi }{(X - \xi )^{1/4}} , \end{align}
with  $\gamma = 2^{3/4} / \varGamma (5/4)$. Parameters
  $a_0$,
  $U_0$ and
  $\lambda _0$ have been eliminated from (3.17) by means of the affine transformations
 \begin{equation} A_{\ast } = \frac{a_0^{3/5} U_0^{4/5}}{\lambda _0^{1/5}} A , \quad t_{\ast } = \frac{\lambda _0^{3/10}}{a_0^{9/10} U_0^{1/5}} T , \quad x_{\ast } = \frac{U_0^{4/5}}{a_0^{2/5} \lambda _0^{1/5}} X . \end{equation}
The angle-of-attack parameter  $a$ is given by
 \begin{equation} a = k_1 \frac{(-a_1) \lambda _0^{2/5}}{a_0^{1/5} U_0^{8/5}} . \end{equation}
In the new variables, the boundary condition (3.8) for (3.17) is written as
 \begin{equation} A (X) = (-X) - a (-X)^{-1} + \cdots \quad \text{as} \ X \to - \infty . \end{equation}
3.2. Receptivity analysis
We shall assume that suction/blowing is weak and time-periodic, that is,
 \begin{equation} v_w (T , X) = \epsilon \,\textrm{e}^{\textrm{i} \omega T} V_w (X) + \textrm{c.c.} . \end{equation}
Here the amplitude of perturbations  $\epsilon$ is assumed small, while the frequency
  $\omega$ is an order-one quantity. Since
  $v_w (T , X)$ is a real function, the complex conjugate of
  $\epsilon \,\textrm {e}^{\textrm {i} \omega T} V_w (X)$ is added to the right-hand side of (3.21).
The corresponding solution of (3.17) and (3.20) is sought in the form
 \begin{equation} A (T , X) = A_0 (X) + \{ \epsilon \,\textrm{e}^{\textrm{i} \omega T} A_1 (X) + \textrm{c.c.} \} . \end{equation}
The leading-order term  $A_0 (X)$ in (3.22) represents the basic unperturbed flow. It satisfies the classical marginal separation equation:
 \begin{equation} A_0^2 - X^2 + 2 a = \varLambda \int_{X}^{\infty } \frac{A_0^{\prime \prime } (\xi )}{\sqrt{\xi - X}} \, \textrm{d} \xi . \end{equation}
The properties of this equation have been analysed by various authors. In figure 4 we reproduce the results of the numerical solution of (3.23) presented in chapter 5 of Ruban (Reference Ruban2018).

Figure 4. Solutions of equation (3.23) for  $a = -0.5$ (curve 1),
  $a = 0.0$ (2),
  $a = 0.5$ (3),
  $a = 1.0$ (4),
  $a = a_s = 1.139$ (5) and
  $a = a_c = 1.330$ (6).
When analysing these results, one needs to remember that  $A (X)$ is proportional to the skin friction. Indeed, using (3.7) in (3.1), we can write the two-term asymptotic expansion of the streamfunction in region 1 as
 \begin{equation} \psi = Re^{-13/20} \tfrac{1}{6} \lambda _0 Y_{\ast }^3 + Re^{-16/20} \tfrac{1}{2} A_{\ast } (x_{\ast }) Y_{\ast }^2 + \cdots , \quad y = Re^{-11/20} Y_{\ast } . \end{equation}
Consequently, the dimensionless skin friction is calculated as
 \begin{equation} \tau _w = \left.\frac{1}{\sqrt{Re}} \frac{\partial ^2 \psi } {\partial y^2}\right|_{y = 0} = Re^{-1/5} A_{\ast } (x_{\ast }) = Re^{-1/5} \frac{a_0^{3/5} U_0^{4/5}}{\lambda _0^{1/5}} A_0 (X) . \end{equation}
 Curve 2 in figure 4 is plotted for  $a = 0$, which corresponds to the critical value of the angle-of-attack, as estimated based on the classical boundary-layer theory. When the viscous–inviscid interaction is ignored, the Prandtl equations yield a singular solution for
  $a = 0$, which correspond to
  $k = k_0$; see figure 2. The interaction acts to smooth out the singularity. The minimal skin friction is lifted, and
  $\tau _w$ appears to be positive for all values of
  $X \in (-\infty , \infty )$. For curve 5, the parameter
  $a$ has been adjusted in such a way that the minimal skin friction returns back to zero to capture the incipience of the separation. This happens at point
  $X = 0.406$ when the parameter
  $a$ reaches the value
  $a_s = 1.139$. Curve 6 is plotted for the critical value of the parameter
  $a_c = 1.330$. It shows a region of negative
  $A$ between
  $X = -0.566$ and
  $X = 1.605$, which is occupied by the separation bubble. The solution does not exist beyond
  $a = a_c$. This result is in agreement with experimental observations, which show that, when the angle-of-attack
  $\alpha$ reaches a critical value
  $\alpha _c$, a local separation bubble can no longer exist. It is destroyed in the process known as bubble bursting.
Now we turn our attention to the perturbations. Substituting (3.22) and (3.21) into (3.17), and working with  $O (\epsilon )$ terms, we find that function
  $A_1 (X)$ satisfies the equation
 \begin{align} 2 A_0 (X) A_1 (X) &= \varLambda \int_{X}^{\infty } \frac{A_1^{\prime \prime } (\xi )}{\sqrt{\xi - X}} \, \textrm{d} \xi - \textrm{i} \omega \gamma \int_{-\infty }^X \frac{A_1 (\xi )}{(X - \xi )^{1/4}} \, \textrm{d} \xi \nonumber\\ &\quad - \gamma \int_{-\infty }^X \frac{V_w (\xi )}{(X - \xi )^{1/4}} \, \textrm{d} \xi . \end{align}
This should be solved with the boundary conditions
 \begin{equation} A_1 \to 0 \quad \text{as} \ X \to \pm \infty , \end{equation}
which are obtained by substituting (3.22) into (3.20).
For the numerical solution of (3.26), we adopted the numerical scheme developed by Scheichl, Braun & Kluwick (Reference Scheichl, Braun and Kluwick2008). By applying the transformations
 \begin{equation} X(s)=X_{0}+B \tan \left(\frac{{\rm \pi} s}{2} \right), \quad T(\tau)= \tan \left(\frac{{\rm \pi} \tau}{2} \right), \end{equation}
the variables  $X,T \in (-\infty , \infty )$ are mapped to
  $s,\tau \in [-1,1]$. The transformed spatial domain was meshed equidistantly with cell size
  ${\rm \Delta} s=2/(n+1)$. Here
  $n$ is the number of unknowns and the quantity
  $X_{0}$ allows for shifting the region of maximum spatial resolution to a point of particular interest. The resulting integrals were then approximated using the piecewise linear representation. Our calculations were performed for the suction/blowing distribution function
  $V_w = \textrm {e}^{-X^2}$. The results of the calculations are displayed in figures 5–11.

Figure 5. The real and imaginary parts of  $A_{1}(X)$ for different values of the frequency:
  $\omega =1$ (blue),
  $\omega =5$ (red) and
  $\omega =10$ (black). The angle-of-attack parameter
  $a=0$.

Figure 6. The absolute value of  $A_{1}(X)$ for the values of the frequency:
  $\omega =5$ (blue),
  $\omega =7$ (red) and
  $\omega =10$ (black). Here the angle-of-attack parameter
  $a=0$ and the green point on each curve represents the theoretical position of neutral oscillations.

Figure 7. The absolute value of  $A_{1}(X)$ for the values of the frequency: (a)
  $\omega =3$ (blue),
  $\omega =7$ (red) and
  $\omega =9$ (black); and (b)
  $\omega =10$ (blue),
  $\omega =12$ (red) and
  $\omega =15$ (black). Here the angle-of-attack parameter
  $a=-2$ and the green point on each curve represents the theoretical position of neutral oscillations.

Figure 8. The absolute value of  $A_{1}(X)$ for the values of the frequency: (a)
  $\omega =3$ (blue),
  $\omega =7$ (red) and
  $\omega =9$ (black); and (b)
  $\omega =10$ (blue),
  $\omega =12$ (red) and
  $\omega =15$ (black). Here the angle-of-attack parameter
  $a=-1$ and the green point on each curve represents the theoretical position of neutral oscillations.

Figure 9. The absolute value of  $A_{1}(X)$ for the values of the frequency: (a)
  $\omega =3$ (blue),
  $\omega =7$ (red) and
  $\omega =9$ (black); and (b)
  $\omega =10$ (blue),
  $\omega =12$ (red) and
  $\omega =15$ (black). Here the angle-of-attack parameter
  $a=1.139$ and the green point on each curve represents the theoretical position of neutral oscillations and the pink point represents the point of reattachment.
Figure 5 shows how the real and imaginary parts of the function  $A_1 (X)$ change with the frequency
  $\omega$; the angle-of-attack parameter
  $a$ is kept constant (
 $a = 0$). We see that, as
  $\omega$ grows, the number of oscillations of the perturbation function
  $A_1 (X)$ increases. This is accompanied with a decrease of the amplitude of the perturbations. Figures 6–9, where the absolute value of
  $A_1 (X)$ (for different angle-of-attack parameters) is displayed, show two peaks in the amplitude of the oscillations. The first one is centred at the position of suction/blowing, while the second corresponds to the maximum perturbations in the wave packet. Remember that
  $A_0$ (see figure 4) increases with the distance from the source of the perturbations. In these conditions, the Tollmien–Schlichting wave first grows, but then it becomes neutral and starts to decay further downstream. We found that the position of the neutral oscillations agrees rather well with the theoretical prediction of Ruban (Reference Ruban1982b). According to Ruban's (Reference Ruban1982b) theory, for large enough
  $A_0$, the neutral frequency is given by the equation
 \begin{equation} \omega = \frac{4}{{\rm \pi}^{1/4}} \cos \left(\frac{\rm \pi}{8}\right) \left[\frac{ \varGamma(5/4)}{\varGamma(3/4)} \right]^{3/2} A_0^{3/2} . \end{equation}
Using this equation one can easily find the value of  $A_0$, and hence the position
  $X$ where the perturbations become neutral. Notice that this usually happens downstream of the reattachment point (see figure 9). It is important to note, however, that the reattachment point can only be calculated for angle-of-attack parameters
  $a_{s}=1.139$ and
  $a_{c}=1.330$, since for the other values of the angle of attack the basic unperturbed flow
  $A_{0}(X)$ has no region of separation.
Figure 10 shows how the solution changes with changing the angle-of-attack parameter  $a$. Interestingly enough, the closer
  $a$ is to the critical value
  $a_c$, the smaller
  $\omega$ needs to be to generate a well-developed Tollmien–Schlichting wave packet. Further evidence of this point is given by figure 11. Here we can see that, for values of
  $a$ closer to
  $a_{c}$, Tollmien–Schlichting wave packets of significant amplitude can be generated at lower frequencies.

Figure 10. The absolute value of  $A_1 (X)$ for two frequencies (a)
  $\omega =3$ and (b)
  $\omega =10$. In both cases, the angle-of-attack parameter assumes the three values:
  $a=0$ (blue),
  $a=1.139$ (red) and
  $a=1.330$ (black).

Figure 11. Amplitude for the Tollmien–Schlichting wave packet for increasing values of  $\omega$. The angle-of-attack parameters
  $a=-1$ (blue),
  $a=0$ (red),
  $a=1$ (black),
  $a=1.139$ (green) and
  $a=1.330$ (purple).
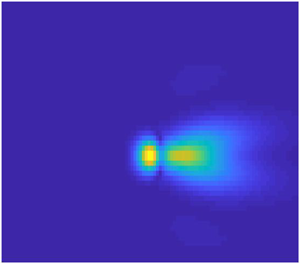
The above results show that the non-parallelism of the basic flow in the boundary layer on the leading edge of an aerofoil has a strong influence on the development of the Tollmien–Schlichting waves. These first grow downstream of the suction/blowing slot, then reach a maximum close to the neutral point (or sometimes at the neutral point), after which they start to decay. Of course, the analysis presented above is linear. In real flows the nonlinearity leads to very fast laminar–turbulent transition when the amplitude of the perturbations reaches a certain level, which happens behind the reattachment point.
4. Three-dimensional wave packets
Now we shall consider a three-dimensional version of the problem. We shall assume that the suction/blowing is localised not only in the longitudinal direction, but also in the spanwise direction, in which case (3.10) assumes the form
 \begin{equation} v|_{y=0} = Re^{-3/4} v_w^{\ast } ( t_{\ast } , x_{\ast } , z_{\ast }) , \end{equation}
with
 \begin{equation} t_{\ast } = \frac{t}{Re^{1/20}} , \quad x_{\ast } = \frac{x - x_0}{Re^{-1/5}} , \quad z_{\ast } = \frac{z}{Re^{-1/5}} . \end{equation}
In these conditions, the perturbations produced in the flow are described by the three-dimensional version of the marginal separation theory. In the framework of this theory, one can deduce a three-dimensional version of (3.17) (see e.g. Braun & Kluwick Reference Braun and Kluwick2004), and then the flow analysis can be conducted in the same way as done in the previous section. However, we found it more convenient to work in the Fourier space.
4.1. Governing equations
We start with the viscous sublayer (region 1 in figure 3). The tangential, normal and spanwise velocity components are represented in this region by the asymptotic expansions:
 \begin{equation} \left.\begin{aligned} V_{\tau } & = Re^{-1/10} \tfrac{1}{2} \lambda _0 Y_{\ast }^2 + Re^{-1/4} U_1^{\ast } (t_{\ast } , x_{\ast } , Y_{\ast } , z_{\ast }) \\ & \quad + Re^{-2/5} U_2^{\ast } (t_{\ast } , x_{\ast } , Y_{\ast } , z_{\ast }) + \cdots , \\ V_n & = Re^{-3/5} V_1^{\ast } (t_{\ast } , x_{\ast } , Y_{\ast } , z_{\ast }) + Re^{-3/4} V_2^{\ast } (t_{\ast } , x_{\ast } , Y_{\ast } , z_{\ast }) + \cdots ,\\ V_z & = Re^{-2/5} W_2^{\ast } (t_{\ast } , x_{\ast } , Y_{\ast } , z_{\ast }) + \cdots , \end{aligned} \right\} \end{equation}
where
 \begin{equation} Y_{\ast } = \frac{y}{Re^{-11/20}} . \end{equation}
The asymptotic expansion for the pressure is written as
 \begin{equation} p = P_{e0} + Re^{-1/5} \lambda _0 x_{\ast } + Re^{-1/2} P^{\ast } (t_{\ast } , x_{\ast } , Y_{\ast } , z_{\ast }) + \cdots , \end{equation}
 Substitution of (4.3) and (4.5) into the Navier–Stokes equations shows that functions  $U_1^{\ast }$ and
  $V_1^{\ast }$ satisfy the quasi-steady two-dimensional equations
 \begin{equation} \left.\begin{gathered} \frac{1}{2} \lambda _0 Y_{\ast }^2 \frac{\partial U_1^{\ast }}{\partial x_{\ast }} + \lambda _0 Y_{\ast } V_1^{\ast } = \frac{\partial ^2 U_1^{\ast }} {\partial Y_{\ast }^2} , \\ \frac{\partial U_1^{\ast }}{\partial x_{\ast }} + \frac{\partial V_1^{\ast }} {\partial Y_{\ast }} = 0 . \end{gathered}\right\} \end{equation}
Their solution satisfying the no-slip conditions on the body surface
 \begin{equation} U_1^{\ast } = V_1^{\ast } = 0 \quad \text{at} \ Y_{\ast } = 0 \end{equation}
is written as
 \begin{equation} U_1^{\ast } = A_{\ast } (t_{\ast }, x_{\ast } , z_{\ast }) \,Y_{\ast } , \quad V_1^{\ast } = - \frac{1}{2} \frac{\partial A_{\ast }}{\partial x_{\ast }} Y_{\ast }^2 , \end{equation}
where  $A_{\ast } (t_{\ast }, x_{\ast } , z_{\ast })$ is an arbitrary function. To find this function, one has to consider the next-order equations:
 \begin{gather} \frac{1}{2} \lambda _0 Y_{\ast }^2 \frac{\partial U_2^{\ast }}{\partial x_{\ast }} + \lambda _0 Y_{\ast } V_2^{\ast } = \frac{\partial ^2 U_2^{\ast }} {\partial Y_{\ast }^2} - \frac{\partial P^{\ast }}{\partial x_{\ast }} - \frac{\partial A_{\ast }}{\partial t_{\ast }} Y_{\ast } - \frac{1}{2} A_{\ast } \frac{\partial A_{\ast }}{\partial x_{\ast }} Y_{\ast }^2 , \end{gather}
 \begin{gather}\frac{\partial P^{\ast }}{\partial Y_{\ast }} = 0 , \end{gather}
 \begin{gather}\frac{1}{2} \lambda _0 Y_{\ast }^2 \frac{\partial W_2^{\ast }}{\partial x_{\ast }} = - \frac{\partial P^{\ast }}{\partial z_{\ast }} + \frac{\partial ^2 W_2^{\ast }} {\partial Y_{\ast }^2} , \end{gather}
 \begin{gather}\frac{\partial U_2^{\ast }}{\partial x_{\ast }} + \frac{\partial V_2^{\ast }} {\partial Y_{\ast }} + \frac{\partial W_2^{\ast }}{\partial z_{\ast }} = 0 . \end{gather}
These have to be solved with the following conditions on the body surface:
 \begin{equation} U_2^{\ast } = W_2^{\ast } = 0 , \quad V_2^{\ast } = v_w^{\ast } (t_{\ast } , x_{\ast } , z_{\ast }) \quad \text{at} \ Y_{\ast } = 0 , \end{equation}
and the requirement that  $U_2^{\ast }$,
  $V_2^{\ast }$ and
  $W_2^{\ast }$ do not grow exponentially as
  $Y_{\ast } \to \infty$.
The set of equations (4.9) can be reduced to the following equation:
 \begin{align} &\frac{1}{2} \lambda _0 Y_{\ast }^2 \frac{\partial ^2 V_2^{\ast }}{\partial x_{\ast } \partial Y_{\ast }} - \lambda _0 Y_{\ast } \frac{\partial V_2^{\ast }} {\partial x_{\ast }} \nonumber\\ &\quad = \frac{\partial ^3 V_2^{\ast }}{\partial Y_{\ast }^3} + \frac{\partial ^2 P^{\ast }}{\partial x_{\ast }^2} + \frac{\partial ^2 P^{\ast }} {\partial z_{\ast }^2} + \frac{\partial ^2 A_{\ast }}{\partial t_{\ast }\partial x_{\ast }} Y_{\ast } + \frac{\partial ^2}{\partial x_{\ast }^2}\left( \frac{A_{\ast }^2}{4} \right) Y_{\ast }^2 . \end{align}
This is obtained by differentiating (4.9a) with respect to  $x_{\ast }$ and (4.9c) with respect to
  $z_{\ast }$. The resulting equations are then added together, and
  $U_2^{\ast }$ and
  $W_2^{\ast }$ are eliminated with the help of the continuity equation (4.9d). The boundary conditions for (4.11) are
 \begin{equation} V_2^{\ast } = v_w^{\ast } (t_{\ast } , x_{\ast } , z_{\ast }) ,\quad \frac{\partial V_2^{\ast }}{\partial Y_{\ast }} = 0 \quad \text{at} \ Y_{\ast } = 0 . \end{equation}
The first condition serves to describe the suction/blowing through the body surface. The second condition follows directly from the continuity equation (4.9d) and the fact that  $U_2^{\ast }$ and
  $W_2^{\ast }$ satisfy the no-slip conditions (4.10).
The following two observations can be made at this stage of the analysis. Firstly, it is easily seen that to any solution  $V_2^{\ast }$ of (4.11) and (4.12) one can add
  $\frac {1}{2} B_{\ast } (t_{\ast } , x_{\ast } , z_{\ast }) Y_{\ast }^2$ with arbitrary function
  $B_{\ast } (t_{\ast } , x_{\ast } , z_{\ast })$. To find this function, one needs to consider the next-order approximation. Secondly, all the coefficients in (4.11) are functions of
  $Y_{\ast }$ only. This allows us to perform the Fourier transforms of (4.11) with respect to
  $x_{\ast }$ and
  $z_{\ast }$. Of course, the Fourier transforms are only applicable to functions that decay as
  $x_{\ast }$ and
  $z_{\ast }$ tend to infinity. To satisfy this requirement, we introduce a new function
  $V_2$ defined as
 \begin{equation} V_2^{\ast } = V_2 + \frac{1}{2} B_{\ast } (t_{\ast } , x_{\ast } , z_{\ast }) Y_{\ast }^2 - \frac{a_0^2}{5 !} Y_{\ast }^5 - \frac{\partial G_{\ast }}{\partial x_{\ast }} Y_{\ast } , \end{equation}
where
 \begin{equation} G_{\ast } (t_{\ast } , x_{\ast } , z_{\ast }) = \frac{A_{\ast }^2 - a_0^2 x_{\ast }^2 - 2 k_1 a_0 a_1}{2 \lambda _0} . \end{equation}
Then we use affine transformations
 \begin{equation} \left.\begin{gathered} V_2 = \frac{a_0^{3/2} U_0}{\lambda _0^{3/2}} V , \quad A_{\ast } = \frac{a_0^{3/5} U_0^{4/5}}{\lambda _0^{1/5}} A , \quad P^{\ast } = \frac{a_0 U_0^2}{\lambda _0} P , \\ G_{\ast } = \frac{a_0^{6/5} U_0^{8/5}}{\lambda _0^{7/5}} G , \quad t_{\ast } = \frac{\lambda _0^{3/10}}{a_0^{9/10} U_0^{1/5}} T ,\quad x_{\ast } = \frac{U_0^{4/5}}{a_0^{2/5} \lambda _0^{1/5}} X , \\ Y_{\ast } = \frac{U_0^{1/5}}{a_0^{1/10} \lambda _0^{3/10}} Y ,\quad z_{\ast } = \frac{U_0^{4/5}}{a_0^{2/5} \lambda _0^{1/5}} Z , \quad v_w^{\ast } = \frac{a_0^{3/2} U_0}{\lambda _0^{3/2}} v_w , \end{gathered}\right\} \end{equation}
and introduce Fourier transforms of functions  $V$,
$V$,  $P$,
$P$,  $A$ and
  $v_w$. In particular, the Fourier transform of
  $V$ is defined as
 \begin{equation} \breve{V} (T , \alpha , Y , \beta ) = \int_{-\infty }^{\infty } \textrm{d} X \int_{-\infty }^{\infty } V (T , X , Y , Z) \exp({-\textrm{i} \alpha X - \textrm{i} \beta Z}) \,\textrm{d} Z . \end{equation}
This turns (4.11) and (4.12) into
 \begin{gather} \frac{1}{2} \textrm{i} \alpha Y^2 \frac{\partial \breve{V}}{\partial Y} - \textrm{i} \alpha Y \breve{V} = \frac{\partial ^3 \breve{V}}{\partial Y^3} - (\alpha ^2 + \beta ^2) \breve{P} + \textrm{i} \alpha \frac{\partial \breve{A}}{\partial T} Y , \end{gather}
 \begin{gather}\breve{V} = \breve{v}_w ,\quad \frac{\partial \breve{V}}{\partial Y} = \textrm{i} \alpha \breve{G} \quad \text{at} \ Y = 0 . \end{gather}
Here  $\breve {G}$ is the Fourier transform of function
  $G$, now written as
 \begin{equation} G = \tfrac{1}{2} ( A^2 - X^2 + 2a ) , \end{equation}
with parameter  $a$ given again by (3.19).
It may be shown (see e.g. Braun & Kluwick Reference Braun and Kluwick2004) that the solution of boundary value problem (4.17), where  $\breve {V}$ does not grow exponentially as
  $Y_{\ast } \to \infty$, exists if and only if
 \begin{equation} 2^{1/4} \frac{\varGamma (5/4)}{\varGamma (3/4)} (\textrm{i} \alpha )^{3/4} \breve{G} - \frac{\sqrt{{\rm \pi} }}{2^{5/4}} \frac{\alpha ^2 + \beta ^2}{(\textrm{i} \alpha )^{3/4}} \breve{P} + \frac{\partial \breve{A}}{\partial T} + \breve{v}_w = 0 . \end{equation}
Equation (4.19) establishes the first link between function  $A$ and the pressure
  $P$.
$P$.
To obtain the second one, we need to consider the upper tier (region 3 in figure 3). The asymptotic expansions of the velocity components and the pressure in this region are written as
 \begin{equation} \left.\begin{gathered} V_{\tau } = U_0 + \cdots + Re^{-1/2} u^{\ast } (t_{\ast } , x_{\ast } , y_{\ast } , z_{\ast }) + \cdots , \\ V_n = \cdots + Re^{-1/2} v^{\ast } (t_{\ast } , x_{\ast } , y_{\ast } , z_{\ast }) + \cdots , \\ V_z = \cdots + Re^{-1/2} w^{\ast } (t_{\ast } , x_{\ast } , y_{\ast } , z_{\ast }) + \cdots , \\ p = P_{e0} + \cdots + Re^{-1/2} p^{\ast } (t_{\ast } , x_{\ast } , y_{\ast } , z_{\ast }) + \cdots , \end{gathered}\right\} \end{equation}
where  $t_{\ast }$,
  $x_{\ast }$ and
  $z_{\ast }$ are given by (4.2a–c) and
 \begin{equation} y_{\ast } = \frac{y}{Re^{-1/5}} . \end{equation}
Substituting (4.20) into the Navier–Stokes equations, one can deduce that the pressure  $p^{\ast }$ satisfies the Laplace equation:
 \begin{equation} \frac{\partial ^2 p^{\ast }}{\partial x_{\ast }^2} + \frac{\partial ^2 p^{\ast }}{\partial y_{\ast }^2} + \frac{\partial ^2 p^{\ast }}{\partial z_{\ast }^2} = 0 . \end{equation}
This has to be solved with the boundary condition
 \begin{equation} \frac{\partial p^{\ast }}{\partial y_{\ast }} = \frac{U_0^2}{\lambda _0} \frac{\partial ^2 A_{\ast }}{\partial x_{\ast }^2} \quad \text{at} \ y_{\ast } = 0 , \end{equation}
and the requirement that  $p^{\ast }$ tend to zero as
  $x_{\ast }^2 + y_{\ast }^2 + z_{\ast }^2 \to \infty$. Condition (4.23) is obtained in the usual way by matching with the solution in the boundary layer.
Affine transformations
 \begin{equation} \left.\begin{gathered} p^{\ast } = \frac{a_0 U_0^2}{\lambda _0} p , \quad A_{\ast } = \frac{a_0^{3/5} U_0^{4/5}}{\lambda _0^{1/5}} A , \\ x_{\ast } = \frac{U_0^{4/5}}{a_0^{2/5} \lambda _0^{1/5}} X , \quad y_{\ast } = \frac{U_0^{4/5}}{a_0^{2/5} \lambda _0^{1/5}} \,\bar{y} , \quad z_{\ast } = \frac{U_0^{4/5}}{a_0^{2/5} \lambda _0^{1/5}} Z \end{gathered}\right\} \end{equation}
 \begin{gather} \frac{\partial ^2 p}{\partial X^2} + \frac{\partial ^2 p}{\partial \bar{y}^2} + \frac{\partial ^2 p}{\partial Z^2} = 0 , \end{gather}
 \begin{gather}\frac{\partial p}{\partial \bar{y}} = \frac{\partial ^2 A}{\partial X^2} \quad \text{at} \ \bar{y} = 0 . \end{gather}
These are written in terms of the Fourier transforms as
 \begin{gather} \frac{\partial ^2 \breve{p}}{\partial \bar{y}^2} - (\alpha ^2 + \beta ^2) \breve{p} = 0 , \end{gather}
 \begin{gather}\frac{\partial \breve{p}}{\partial \bar{y}} = - \alpha ^2 \breve{A} \quad \text{at} \ \bar{y} = 0 . \end{gather}
The solution of (4.26), satisfying the attenuation condition
 \begin{equation} \breve{p} \to 0 \quad \text{as} \ \bar{y} \to \infty , \end{equation}
is written as
 \begin{equation} \breve{p} = \frac{\alpha ^2 \breve{A}}{\sqrt{\alpha ^2 + \beta ^2}} \exp\left({-\sqrt{\alpha ^2 + \beta ^2} \bar{y}}\right) . \end{equation}
The Fourier transform of the pressure inside the boundary layer can now be found by setting  $\bar {y} = 0$ in (4.28):
 \begin{equation} \breve{P} = \frac{\alpha ^2 \breve{A}}{\sqrt{\alpha ^2 + \beta ^2}} . \end{equation}
It remains to substitute (4.29) into (4.19), and we will have the following equation for function  $A$:
$A$:
 \begin{equation} 2^{1/4} \frac{\varGamma (5/4)}{\varGamma (3/4)} (\textrm{i} \alpha )^{3/4} \breve{G} - \frac{\sqrt{{\rm \pi} }}{2^{5/4}} \frac{\sqrt{\alpha ^2 + \beta ^2}}{(\textrm{i} \alpha )^{3/4}}\, \alpha ^2 \breve{A} + \frac{\partial \breve{A}}{\partial T} + \breve{v}_w = 0 . \end{equation}
Remember that  $\breve {G}$ is the Fourier transform of
  $\frac {1}{2} (A^2 - X^2 + 2 a)$.
4.2. Weak periodic suction/blowing
In what follows we assume that
 \begin{equation} v_w (T , X , Z) = \epsilon \,\textrm{e}^{\textrm{i} \omega T} V_w (X , Z) + \textrm{c.c.} . \end{equation}
If  $\epsilon = 0$, then the flow is unperturbed, and is described by (3.23). If
  $\epsilon$ is non-zero but small, then the solution for
  $A(T , X , Z)$ should be sought in the form
 \begin{equation} A (T , X, Z) = A_0 (X) + \{ \epsilon \,\textrm{e}^{\textrm{i} \omega T} A_1 (X , Z) + \textrm{c.c.} \} . \end{equation}
Substituting (4.32) and (4.31) into (4.30), and working with the  $O (\epsilon )$ terms, we find that function
  $A_1$ satisfies the equation
 \begin{equation} 2^{1/4} \frac{\varGamma (5/4)}{\varGamma (3/4)} (\textrm{i} \alpha )^{-1/4} \breve{H} + \frac{\sqrt{{\rm \pi} }}{2^{5/4}} \frac{\sqrt{\alpha ^2 + \beta ^2}}{(\textrm{i} \alpha )^{3/4}}\, \breve{Q} + \textrm{i} \omega \breve{A} + \breve{V}_w = 0 . \end{equation}
Here  $\breve {H}$ and
  $Q$ are the Fourier transforms of
 \begin{equation} H = A_0 \frac{\partial A_1}{\partial X} + \frac{\textrm{d} A_0}{\textrm{d} X} A_1 \quad \text{and} \quad Q = \frac{\partial ^2 A_1}{\partial X^2} , \end{equation}
respectively.
4.3. Numerical results
The numerical solution of (4.33) was obtained using Newtonian iteration. The calculations were performed for
 \begin{equation} V_w (X , Z) = \exp({-(X-X_0)^2 - Z^2}) . \end{equation}
The results are displayed in figures 12–15.

Figure 12. Contour plots for the real part of  $A_{1}(X,Z)$ for angle-of-attack parameter
  $a = 0$ and different frequencies: (a)
  $\omega =1$, (b)
  $\omega =4$, (c)
  $\omega =7$ and (d)
  $\omega =10$. The green point represents the theoretical position of neutral oscillations.

Figure 13. Contour plots for the real part of  $A_{1}(X,Z)$ for angle-of-attack parameter
  $a = 1$ and different frequencies: (a)
  $\omega =1$, (b)
  $\omega =4$, (c)
  $\omega =7$ and (d)
  $\omega =10$. The green point represents the theoretical position of neutral oscillations.

Figure 14. Contour plots for the real part of  $A_{1}(X,Z)$ for angle-of-attack parameter
  $a = 1.139$ and different frequencies: (a)
  $\omega =1$, (b)
  $\omega =4$, (c)
  $\omega =7$ and (d)
  $\omega =10$. The green point represents the theoretical position of neutral oscillations.

Figure 15. Contour plots for the real part of  $A_1 (X,Z)$, where
  $\omega =10$: (a)
  $a=1.139$ and (b)
  $a=1.330$. The green point represents the theoretical position of neutral oscillations.
We first take the angle-of-attack parameter to be  $a = 0$, and shift the centre of suction/blowing upstream to
  $X_0 = 2$. Figure 12 displays the contours of the constant real part of
  $A_1 (X , Z)$ (the imaginary part of
  $A_1 (X , Z)$ was found to behave in a similar way). One can see that with
  $\omega = 1.0$ the flow displays a ‘passive response’ to suction/blowing, but when
  $\omega$ increases, the flow becomes unstable, and the perturbations start to grow downstream of suction/blowing, taking the form of a three-dimensional wave packet. The latter is bounded in space due to the fact that the basic flow, given by
  $A_0 (X)$, is non-parallel. We found that the position of the maximum of the amplitude of pulsations can still be predicted with the help of equation (3.29) (see the green point plotted in figures 12–15). It is clear from figure 12 that, with increasing frequency
  $\omega$, the position of the maximum amplitude of the perturbations moves downstream and the number of oscillations increases. As a result, the wave packet stretches downstream. It also widens, but not significantly. Furthermore, one can see that, for different angle-of-attack parameters, the solutions behave in a similar manner (see figures 13 and 14).
Figure 15 shows how the solution changes as the angle of attack increases. The calculations were performed for  $\omega = 10$. We see that the wave packet extends in both the longitudinal and spanwise directions as
  $a$ increases from
  $a = 1.139$ to
  $a = 1.330$. Also we observe an increase in the amplitude of the oscillations, which means that at
  $a = 1.330$ the boundary layer is more prone to laminar–turbulent transition.
5. Summary
In this paper we investigated the receptivity of a marginally separated boundary layer with respect to periodic suction/blowing. The problem considered was intended to explain well-known experimental observations where the flow in the short separation bubble remains laminar except near the reattachment point. Our calculations clearly show that, for large enough frequency  $\omega$, the perturbations assume the form of a wave packet with maximum amplitude of perturbation reached downstream of the reattachment point.
The main difference between this work and previous studies of receptivity is that the marginally separated flows are non-parallel with respect to the Tollmien–Schlichting waves. The analysis of such flows requires special numerical techniques. In this paper we used both finite-difference and pseudo-spectral methods. The latter proved to be very efficient for the case of three-dimensional perturbations, allowing us to accurately resolve multiple oscillations in the flow. It should be noted that, due to the assumption of periodicity of the solution, no singularity of the type described by Smith (Reference Smith1982) and Scheichl et al. (Reference Scheichl, Braun and Kluwick2008) was observed in the flow field.
The results presented in this paper show that the non-parallelism of the basic flow in the boundary layer on the leading edge of an aerofoil has a strong influence on the development of the Tollmien–Schlichting waves. These first grow downstream of the suction/blowing slot, then reach a maximum close to the neutral point, or even at the neutral point, after which they start to decay. Both two-dimensional and three-dimensional wave packets decay with the increase in frequency  $\omega$ of perturbations. They also grow with the angle-of-attack parameter
  $a$, especially when
  $a$ approaches its critical value
  $a = 1.139$. Of course, the analysis presented above is linear. In real flows the nonlinearity leads to very fast laminar–turbulent transition when the amplitude of the perturbations reaches a certain level, which happens behind the reattachment point.
There are a number of possible extensions of the work presented in this paper. These include receptivity to acoustic noise and free-stream turbulence. Also of interest would be an extension of the analysis to nonlinear perturbations.
Declaration of interests
The authors report no conflict of interest.


