


1 Introduction
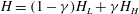
The mixing efficiency of a stratified flow can be defined as the fraction of the total energy supplied to the flow used to mix the density field irreversibly. Since irreversible mixing is a molecular process occurring at very small scales – the Batchelor scale (Batchelor Reference Batchelor1958) – it is routinely parameterized in ocean models (Osborn Reference Osborn1980) in terms of the mixing efficiency. In these models the value of the mixing efficiency is usually taken to be a constant of approximately 0.15–0.2.
Over the past 35 years or so there have been numerous attempts to measure the mixing efficiency in laboratory experiments and, more recently, in numerical simulations. An early compilation of experiments (Linden Reference Linden1979) showed that the mixing efficiency was not constant but varied with both the stability of the system, as measured by a bulk Richardson number, and with the type of flow. For example in flows where the basic density field is statically stable, maximum values of the mixing efficiency are approximately 0.2, while for flows in which at least some region of the initial density profile is statically unstable mixing efficiencies can be above 0.5 (Lawrie & Dalziel Reference Lawrie and Dalziel2011).
Further, recent scalings and numerical simulations (Billant & Chomaz Reference Billant and Chomaz2001; Lindborg Reference Lindborg2006) show that turbulent mixing in a stratified fluid is dependent on the buoyancy Reynolds number
 $F_{h}^{2}Re$
, where
$F_{h}^{2}Re$
, where
 $F_{h}=U/Nl_{h}$
is a horizontal Froude number based on the flow speed
$F_{h}=U/Nl_{h}$
is a horizontal Froude number based on the flow speed
 $U$
, the buoyancy frequency
$U$
, the buoyancy frequency
 $N$
and an external (horizontal) scale
$N$
and an external (horizontal) scale
 $l_{h}$
, and
$l_{h}$
, and
 $Re$
is the Reynolds number based on the horizontal scale
$Re$
is the Reynolds number based on the horizontal scale
 $l_{h}$
,
$l_{h}$
,
 $U$
and
$U$
and
 $\unicode[STIX]{x1D708}$
the kinematic viscosity. A smaller length scale characterizing the vertical size of overturning eddies
$\unicode[STIX]{x1D708}$
the kinematic viscosity. A smaller length scale characterizing the vertical size of overturning eddies
 $l_{v}\approx U/N$
is implicit in this relation.
$l_{v}\approx U/N$
is implicit in this relation.
If, as would be the case in an unstratified flow, the dissipation
 $\unicode[STIX]{x1D716}$
is assumed to scale with
$\unicode[STIX]{x1D716}$
is assumed to scale with
 $U^{3}/l_{h}$
, the buoyancy Reynolds number can be expressed as
$U^{3}/l_{h}$
, the buoyancy Reynolds number can be expressed as
 $Re_{B}=\unicode[STIX]{x1D716}/\unicode[STIX]{x1D708}N^{2}=CU^{3}/l_{h}\unicode[STIX]{x1D708}N^{2}=CF_{h}^{2}Re$
, where
$Re_{B}=\unicode[STIX]{x1D716}/\unicode[STIX]{x1D708}N^{2}=CU^{3}/l_{h}\unicode[STIX]{x1D708}N^{2}=CF_{h}^{2}Re$
, where
 $C$
is the constant of proportionality in the dissipation scaling and estimated to be approximately 0.04 based on the value for a turbulent shear layer (Wygnanski & Fielder Reference Wygnanski and Fielder1970; Sreenivasan Reference Sreenivasan1995). Early estimates suggest that active mixing requires
$C$
is the constant of proportionality in the dissipation scaling and estimated to be approximately 0.04 based on the value for a turbulent shear layer (Wygnanski & Fielder Reference Wygnanski and Fielder1970; Sreenivasan Reference Sreenivasan1995). Early estimates suggest that active mixing requires
 $\unicode[STIX]{x1D716}/\unicode[STIX]{x1D708}N^{2}\gtrsim 30$
(Gibson Reference Gibson1980, Reference Gibson1999), a result confirmed in recent numerical simulations of stratified turbulence (Waite Reference Waite2013). Unfortunately, the majority of previous laboratory experiments on stratified turbulence have
$\unicode[STIX]{x1D716}/\unicode[STIX]{x1D708}N^{2}\gtrsim 30$
(Gibson Reference Gibson1980, Reference Gibson1999), a result confirmed in recent numerical simulations of stratified turbulence (Waite Reference Waite2013). Unfortunately, the majority of previous laboratory experiments on stratified turbulence have
 $\unicode[STIX]{x1D716}/\unicode[STIX]{x1D708}N^{2}$
significantly smaller than this value, and so the dynamics and the subsequent mixing may well have been influenced significantly by viscosity.
$\unicode[STIX]{x1D716}/\unicode[STIX]{x1D708}N^{2}$
significantly smaller than this value, and so the dynamics and the subsequent mixing may well have been influenced significantly by viscosity.
In this paper we present measurements of mixing efficiency produced by a lock-exchange flow. Dense fluid in a long channel is initially held behind a vertical barrier separating it from a region of less dense fluid filling the remainder of the channel (figure 1). Both fluids are initially at rest and the total initial energy of the system is simply the potential energy. When the barrier is removed a dense gravity current travels along the bottom of the channel (figure 2), a light current travels in the opposite direction along the free surface, both currents reach and reflect from the far end walls, and a complex set of motions continues until eventually all motion ceases (figure 3). At this point only potential energy remains in the system. Measurements of the density field before and after the experiment allow the energy used to mix the fluid irreversibly to be calculated.

Figure 1. Schematic of the lock release experiment. Salty water of density
 $\unicode[STIX]{x1D70C}_{H}$
fills a lock of length
$\unicode[STIX]{x1D70C}_{H}$
fills a lock of length
 $L_{lock}$
, and fresher water of density
$L_{lock}$
, and fresher water of density
 $\unicode[STIX]{x1D70C}_{L}$
fills the remainder of the channel. The depth
$\unicode[STIX]{x1D70C}_{L}$
fills the remainder of the channel. The depth
 $H_{L}>H_{H}$
and is set so that the pressures on the two sides of the lock gate are the same at mid-depth of the channel.
$H_{L}>H_{H}$
and is set so that the pressures on the two sides of the lock gate are the same at mid-depth of the channel.

Figure 2. Visualization of the gravity current from Exp 6 – see table 1. The current is dyed with food colouring and viewed against a translucent lined sheet.

This study is notable for the large Reynolds numbers used to examine stratified mixing in gravity currents. Values of
 $Re$
based on the speed and depth of the current reach 70 000, and the buoyancy Reynolds number
$Re$
based on the speed and depth of the current reach 70 000, and the buoyancy Reynolds number
 $Re_{B}\gtrsim 800$
. (Note that the current depth is chosen as the appropriate external length scale to characterize
$Re_{B}\gtrsim 800$
. (Note that the current depth is chosen as the appropriate external length scale to characterize
 $l_{h}$
on the grounds that the motion in the vicinity of the current head must have similar horizontal and vertical length scales). In contrast, most previous studies of laboratory gravity currents have been conducted at Reynolds numbers typically up to a few thousand, while those attaining Reynolds numbers of a similar order to the present study have focussed on different characteristics of the current (e.g. propagation speed and current height; Keulegan Reference Keulegan1958; Shin, Dalziel & Linden Reference Shin, Dalziel and Linden2004; Marino, Thomas & Linden Reference Marino, Thomas and Linden2005; Adduce, Sciortino & Proietti Reference Adduce, Sciortino and Proietti2012) or on mixing in a different flow regime (when the governing dynamics evolves in time; Fragoso, Patterson & Wettlaufer Reference Fragoso, Patterson and Wettlaufer2013; Sher & Woods Reference Sher and Woods2015). State-of-the-art numerical simulations of gravity current mixing are limited currently to short domains (or times) or to relatively small Reynolds numbers (e.g. Özgökmen, Iliescu & Fischer Reference Özgökmen, Iliescu and Fischer2009; Ilıcak Reference Ilıcak2014). Our approach has enabled measurement of the efficiency of stratified mixing unaffected by viscosity in a gravity current, and we describe the laboratory experiments in § 2 and the results in § 3. Energetic considerations are used in § 4 to develop a model for the mixing associated with the gravity current, and we present our conclusions in § 5.
$l_{h}$
on the grounds that the motion in the vicinity of the current head must have similar horizontal and vertical length scales). In contrast, most previous studies of laboratory gravity currents have been conducted at Reynolds numbers typically up to a few thousand, while those attaining Reynolds numbers of a similar order to the present study have focussed on different characteristics of the current (e.g. propagation speed and current height; Keulegan Reference Keulegan1958; Shin, Dalziel & Linden Reference Shin, Dalziel and Linden2004; Marino, Thomas & Linden Reference Marino, Thomas and Linden2005; Adduce, Sciortino & Proietti Reference Adduce, Sciortino and Proietti2012) or on mixing in a different flow regime (when the governing dynamics evolves in time; Fragoso, Patterson & Wettlaufer Reference Fragoso, Patterson and Wettlaufer2013; Sher & Woods Reference Sher and Woods2015). State-of-the-art numerical simulations of gravity current mixing are limited currently to short domains (or times) or to relatively small Reynolds numbers (e.g. Özgökmen, Iliescu & Fischer Reference Özgökmen, Iliescu and Fischer2009; Ilıcak Reference Ilıcak2014). Our approach has enabled measurement of the efficiency of stratified mixing unaffected by viscosity in a gravity current, and we describe the laboratory experiments in § 2 and the results in § 3. Energetic considerations are used in § 4 to develop a model for the mixing associated with the gravity current, and we present our conclusions in § 5.
2 Experiments
The experiments were conducted in a rectangular channel 9.6 m long, 0.25 m wide and 0.5 m depth. A thin barrier was placed half-way along the channel, i.e.
 $L_{lock}=4.8\pm 0.1$
m, and one partition was filled with salt solution. The rest of the channel was filled with fresh water. The free-surface heights (
$L_{lock}=4.8\pm 0.1$
m, and one partition was filled with salt solution. The rest of the channel was filled with fresh water. The free-surface heights (
 $H_{L}$
and
$H_{L}$
and
 $H_{H}$
) were adjusted such that the pressures on each side of the barrier were equalized at approximately mid-depth. The experiment started by removing the barrier vertically, and ended when all perceptible motion in the channel had ceased.
$H_{H}$
) were adjusted such that the pressures on each side of the barrier were equalized at approximately mid-depth. The experiment started by removing the barrier vertically, and ended when all perceptible motion in the channel had ceased.
Measurements were made of the densities and depths on both sides of the barrier initially and of the vertical density profile and total depth
 $H$
at the end of the experiment. Great care was needed to measure the change in free-surface height, which was determined to within 0.1 mm using a micrometer. The density profile at the end of the experiment was measured by withdrawing samples at predetermined depths. All density samples were measured with an Anton Paar densitometer, accurate to
$H$
at the end of the experiment. Great care was needed to measure the change in free-surface height, which was determined to within 0.1 mm using a micrometer. The density profile at the end of the experiment was measured by withdrawing samples at predetermined depths. All density samples were measured with an Anton Paar densitometer, accurate to
 $10^{-3}~\text{kg}~\text{m}^{-3}$
.
$10^{-3}~\text{kg}~\text{m}^{-3}$
.
Table 1. Values of the dimensionless density difference
 $(\unicode[STIX]{x1D70C}_{H}-\unicode[STIX]{x1D70C}_{L})/\unicode[STIX]{x1D70C}_{0}$
, the speeds of gravity current propagation
$(\unicode[STIX]{x1D70C}_{H}-\unicode[STIX]{x1D70C}_{L})/\unicode[STIX]{x1D70C}_{0}$
, the speeds of gravity current propagation
 $U_{M}$
and
$U_{M}$
and
 $U_{i}$
measured along the bottom and predicted from (4.2), respectively, the overall Richardson number
$U_{i}$
measured along the bottom and predicted from (4.2), respectively, the overall Richardson number
 $Ri_{O}\equiv (g(\unicode[STIX]{x1D70C}_{H}-\unicode[STIX]{x1D70C}_{L})H/4\unicode[STIX]{x1D70C}_{0}U_{M}^{2})$
, the dimensionless mass anomaly
$Ri_{O}\equiv (g(\unicode[STIX]{x1D70C}_{H}-\unicode[STIX]{x1D70C}_{L})H/4\unicode[STIX]{x1D70C}_{0}U_{M}^{2})$
, the dimensionless mass anomaly
 $\unicode[STIX]{x1D6FC}$
transported from one layer into the other by mixing (see (3.1)), the Reynolds number
$\unicode[STIX]{x1D6FC}$
transported from one layer into the other by mixing (see (3.1)), the Reynolds number
 $Re\equiv (U_{M}H/2\unicode[STIX]{x1D708})$
and the buoyancy Reynolds number
$Re\equiv (U_{M}H/2\unicode[STIX]{x1D708})$
and the buoyancy Reynolds number
 $Re_{B}\equiv (C\unicode[STIX]{x1D70C}_{0}U_{M}^{3}\unicode[STIX]{x1D6FF}/g(\unicode[STIX]{x1D70C}_{H}-\unicode[STIX]{x1D70C}_{L})\unicode[STIX]{x1D708}(H/2))$
(where this expression uses an estimate of
$Re_{B}\equiv (C\unicode[STIX]{x1D70C}_{0}U_{M}^{3}\unicode[STIX]{x1D6FF}/g(\unicode[STIX]{x1D70C}_{H}-\unicode[STIX]{x1D70C}_{L})\unicode[STIX]{x1D708}(H/2))$
(where this expression uses an estimate of
 $N^{2}$
based on the interface thickness
$N^{2}$
based on the interface thickness
 $\unicode[STIX]{x1D6FF}$
and
$\unicode[STIX]{x1D6FF}$
and
 $C=0.04$
is the constant in the assumed scaling for dissipation
$C=0.04$
is the constant in the assumed scaling for dissipation
 $\unicode[STIX]{x1D716}=CU_{M}^{3}/(H/2)$
). The reference density
$\unicode[STIX]{x1D716}=CU_{M}^{3}/(H/2)$
). The reference density
 $\unicode[STIX]{x1D70C}_{0}$
is taken to be the average of
$\unicode[STIX]{x1D70C}_{0}$
is taken to be the average of
 $\unicode[STIX]{x1D70C}_{L}$
and
$\unicode[STIX]{x1D70C}_{L}$
and
 $\unicode[STIX]{x1D70C}_{H}$
, and the uncertainties in
$\unicode[STIX]{x1D70C}_{H}$
, and the uncertainties in
 $U_{M}$
and
$U_{M}$
and
 $Ri_{O}$
are based on the finite time taken to withdraw the barrier at the start of the experiment.
$Ri_{O}$
are based on the finite time taken to withdraw the barrier at the start of the experiment.

Six experiments were run and the values of the experimental parameters are given in table 1. In each case the final depth of the fluid was
 $0.4\pm 0.01$
m (the values of
$0.4\pm 0.01$
m (the values of
 $H_{L}$
and
$H_{L}$
and
 $H_{H}$
ranging from 0.402 m and 0.398 m, respectively, at the smallest density difference, to 0.438 m and 0.376 m at the largest density difference), and the only parameter that was varied was the initial density difference
$H_{H}$
ranging from 0.402 m and 0.398 m, respectively, at the smallest density difference, to 0.438 m and 0.376 m at the largest density difference), and the only parameter that was varied was the initial density difference
 $(\unicode[STIX]{x1D70C}_{H}-\unicode[STIX]{x1D70C}_{L})$
. The range covered gave measured gravity current speeds
$(\unicode[STIX]{x1D70C}_{H}-\unicode[STIX]{x1D70C}_{L})$
. The range covered gave measured gravity current speeds
 $0.037<U_{M}<0.360~\text{m}~\text{s}^{-1}$
along the tank base, with Reynolds numbers
$0.037<U_{M}<0.360~\text{m}~\text{s}^{-1}$
along the tank base, with Reynolds numbers
 $Re\equiv (U_{M}H/2\unicode[STIX]{x1D708})$
between 7400 and 72 000.
$Re\equiv (U_{M}H/2\unicode[STIX]{x1D708})$
between 7400 and 72 000.
2.1 Calculation of mixing efficiency
To calculate the mixing efficiency we first calculate the initial potential energy. The initial density distribution is
 $$\begin{eqnarray}\displaystyle \unicode[STIX]{x1D70C}=\left\{\begin{array}{@{}ll@{}}\unicode[STIX]{x1D70C}_{L},\quad & 0\leqslant x<L-L_{lock},0\leqslant z\leqslant H_{L},\\ \unicode[STIX]{x1D70C}_{H},\quad & L-L_{lock}<x\leqslant L,0\leqslant z\leqslant H_{H}.\end{array}\right. & & \displaystyle\end{eqnarray}$$
Hence the initial potential energy
 $PE_{i}$
is
$PE_{i}$
is
 $$\begin{eqnarray}\displaystyle PE_{i}=g\int _{0}^{L}\int _{0}^{H_{i}}\unicode[STIX]{x1D70C}(x,z)z\,\text{d}x\,\text{d}z=\frac{1}{2}gL[\unicode[STIX]{x1D70C}_{L}(1-\unicode[STIX]{x1D6FE})H_{L}^{2}+\unicode[STIX]{x1D70C}_{H}\unicode[STIX]{x1D6FE}H_{H}^{2}], & & \displaystyle\end{eqnarray}$$
where
 $\unicode[STIX]{x1D6FE}\equiv (L_{lock}/L)$
(
$\unicode[STIX]{x1D6FE}\equiv (L_{lock}/L)$
(
 ${\approx}0.5$
in our case) and
${\approx}0.5$
in our case) and
 $H_{i}$
is the initial depth,
$H_{i}$
is the initial depth,
 $H_{L}$
or
$H_{L}$
or
 $H_{H}$
, from (2.1). Now consider the final state after the gravity current and all subsequent motion in the channel has ceased. Conservation of volume implies the initial and final free surface heights are related by
$H_{H}$
, from (2.1). Now consider the final state after the gravity current and all subsequent motion in the channel has ceased. Conservation of volume implies the initial and final free surface heights are related by
 $H=(1-\unicode[STIX]{x1D6FE})H_{L}+\unicode[STIX]{x1D6FE}H_{H}$
.
$H=(1-\unicode[STIX]{x1D6FE})H_{L}+\unicode[STIX]{x1D6FE}H_{H}$
.
If there is no mixing and
 $\unicode[STIX]{x1D70C}_{L}<\unicode[STIX]{x1D70C}_{R}$
, the final stratification is
$\unicode[STIX]{x1D70C}_{L}<\unicode[STIX]{x1D70C}_{R}$
, the final stratification is
 $$\begin{eqnarray}\displaystyle \unicode[STIX]{x1D70C}=\left\{\begin{array}{@{}ll@{}}\unicode[STIX]{x1D70C}_{H},\quad & 0\leqslant x\leqslant L,0\leqslant z\leqslant H_{H}\unicode[STIX]{x1D6FE},\\ \unicode[STIX]{x1D70C}_{L},\quad & 0\leqslant x\leqslant L,H_{H}\unicode[STIX]{x1D6FE}<z\leqslant H.\end{array}\right. & & \displaystyle\end{eqnarray}$$
The final potential energy
 $PE_{nm}$
in this no-mixing case is
$PE_{nm}$
in this no-mixing case is
 $$\begin{eqnarray}\displaystyle PE_{nm}={\textstyle \frac{1}{2}}gH^{2}L\unicode[STIX]{x1D70C}_{L}+{\textstyle \frac{1}{2}}g{H_{H}}^{2}L(\unicode[STIX]{x1D70C}_{H}-\unicode[STIX]{x1D70C}_{L})\unicode[STIX]{x1D6FE}^{2}. & & \displaystyle\end{eqnarray}$$
Thus the maximum potential energy that can be released in this flow, the available potential energy
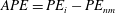 $APE=PE_{i}-PE_{nm}$
, is
$APE=PE_{i}-PE_{nm}$
, is
 $$\begin{eqnarray}\displaystyle APE & = & \displaystyle {\textstyle \frac{1}{2}}gL(1-\unicode[STIX]{x1D6FE})\left[\unicode[STIX]{x1D70C}_{L}(H_{L}^{2}-H^{2})+(\unicode[STIX]{x1D70C}_{L}-\unicode[STIX]{x1D70C}_{H})\unicode[STIX]{x1D6FE}^{2}{H_{H}}^{2}\right]\nonumber\\ \displaystyle & & \displaystyle +\,{\textstyle \frac{1}{2}}gL\unicode[STIX]{x1D6FE}\left[\unicode[STIX]{x1D70C}_{H}({H_{H}}^{2}-H^{2})+(\unicode[STIX]{x1D70C}_{H}-\unicode[STIX]{x1D70C}_{L})(H^{2}-\unicode[STIX]{x1D6FE}^{2}{H_{H}}^{2})\right],\end{eqnarray}$$
where the first and third terms on the right-hand side are associated with changes in free-surface height, and the second and fourth terms are associated with changes in density between the initial and ‘non-mixed’ states.
For a general final stratification with potential energy
 $PE_{f}$
the mixing efficiency
$PE_{f}$
the mixing efficiency
 ${\mathcal{M}}$
is defined as
${\mathcal{M}}$
is defined as
 $$\begin{eqnarray}\displaystyle {\mathcal{M}}\equiv \frac{PE_{f}-PE_{nm}}{APE}, & & \displaystyle\end{eqnarray}$$
and can be calculated from the final density field in the channel after all motion has ceased. Note that if the mixing is complete so that the final density
 $\unicode[STIX]{x1D70C}_{f}=\unicode[STIX]{x1D70C}_{L}(1-\unicode[STIX]{x1D6FE})H_{L}/H+\unicode[STIX]{x1D70C}_{H}\unicode[STIX]{x1D6FE}H_{H}/H$
is uniform throughout the channel, the final potential energy approaches
$\unicode[STIX]{x1D70C}_{f}=\unicode[STIX]{x1D70C}_{L}(1-\unicode[STIX]{x1D6FE})H_{L}/H+\unicode[STIX]{x1D70C}_{H}\unicode[STIX]{x1D6FE}H_{H}/H$
is uniform throughout the channel, the final potential energy approaches
 $PE_{i}$
given by (2.2) and the mixing efficiency
$PE_{i}$
given by (2.2) and the mixing efficiency
 ${\mathcal{M}}\rightarrow 1$
in the limit where the initial differential of free-surface height across the barrier vanishes, i.e.
${\mathcal{M}}\rightarrow 1$
in the limit where the initial differential of free-surface height across the barrier vanishes, i.e.
 $H=H_{L}=H_{H}$
.
$H=H_{L}=H_{H}$
.
3 Results
An image of a gravity current (Exp 6 – see table 1) is shown in figure 2. This current has
 $Re=72\,000$
and
$Re=72\,000$
and
 $Re_{B}=840$
, and exhibits large scale billow structures on the interface between the current and the counter-flowing current above. These structures are common to all the currents, although the intensity of the turbulence along the interface was noticeably reduced for the current with the lowest Reynolds number (Exp 5,
$Re_{B}=840$
, and exhibits large scale billow structures on the interface between the current and the counter-flowing current above. These structures are common to all the currents, although the intensity of the turbulence along the interface was noticeably reduced for the current with the lowest Reynolds number (Exp 5,
 $Re=7400$
). As is usual for a full-depth lock release, the current occupies approximately half the depth of the channel and initially travels at a constant speed. In the present experiments, this constant speed persists to the end of the channel because the channel length
$Re=7400$
). As is usual for a full-depth lock release, the current occupies approximately half the depth of the channel and initially travels at a constant speed. In the present experiments, this constant speed persists to the end of the channel because the channel length
 $L\ll 10L_{lock}$
, which is the distance at which a gravity current enters the similarity phase and begins to decelerate (Rottman & Simpson Reference Rottman and Simpson1983). Values of the measured speeds
$L\ll 10L_{lock}$
, which is the distance at which a gravity current enters the similarity phase and begins to decelerate (Rottman & Simpson Reference Rottman and Simpson1983). Values of the measured speeds
 $U_{M}$
along the bottom are given in table 1 (note that the current speeds along the free surface were marginally faster).
$U_{M}$
along the bottom are given in table 1 (note that the current speeds along the free surface were marginally faster).
On impact with the end of the channel, a large-amplitude wave with bore-like characteristics is generated (figure 3). This feature propagates back towards the other end of the channel, where it reflects again at a lower amplitude. This series of reflections from the ends of the channel continues until viscosity damps out the motion. Qualitative comparison of figures 2 and 3 indicates that the turbulent mixing, even in the first reflection, is significantly less than that during the gravity current phase. Although we have no quantitative measures of the mixing at intermediate stages of the experiment, we will assume that the mixing after the gravity current first reflects from the end wall is negligible, compared with that during the gravity current propagation.

Figure 4. Final density profiles for the experiments in table 1 normalized by the initial density difference. The profiles were measured by withdrawing samples at different depths and the profiles are drawn with linear segments between the data points. Also shown is the assumed linear variation of density corresponding to an interfacial region of dimensionless thickness
 $r=0.33$
(see (4.3)).
$r=0.33$
(see (4.3)).
Figure 4 shows the final density profiles after all motion in the channel has ceased. The profiles are approximately self-similar when normalized by the initial density difference, with a final interfacial region that is symmetrical about mid-depth (defined as
 $z^{\prime }=0$
) and significant mixing evident in the region
$z^{\prime }=0$
) and significant mixing evident in the region
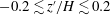 $-0.2\lesssim z^{\prime }/H\lesssim 0.2$
. A weak departure from this self-similar form is suggested at the two lowest Reynolds numbers (Exps 4 and 5) by a larger density gradient at the centre of the interface. Despite fairly large density differences (the maximum
$-0.2\lesssim z^{\prime }/H\lesssim 0.2$
. A weak departure from this self-similar form is suggested at the two lowest Reynolds numbers (Exps 4 and 5) by a larger density gradient at the centre of the interface. Despite fairly large density differences (the maximum
 $(\unicode[STIX]{x1D70C}_{H}-\unicode[STIX]{x1D70C}_{L})/\unicode[STIX]{x1D70C}_{0}\sim 0.17$
) in Exps 1 and 6, the symmetry about
$(\unicode[STIX]{x1D70C}_{H}-\unicode[STIX]{x1D70C}_{L})/\unicode[STIX]{x1D70C}_{0}\sim 0.17$
) in Exps 1 and 6, the symmetry about
 $z^{\prime }=0$
implies that non-Boussinesq effects are small (in keeping with only minor differences expected for density ratios
$z^{\prime }=0$
implies that non-Boussinesq effects are small (in keeping with only minor differences expected for density ratios
 $\unicode[STIX]{x1D70C}_{L}/\unicode[STIX]{x1D70C}_{H}>0.85$
; Birman, Martin & Meiburg Reference Birman, Martin and Meiburg2005; Lowe, Rottman & Linden Reference Lowe, Rottman and Linden2005). The symmetry about
$\unicode[STIX]{x1D70C}_{L}/\unicode[STIX]{x1D70C}_{H}>0.85$
; Birman, Martin & Meiburg Reference Birman, Martin and Meiburg2005; Lowe, Rottman & Linden Reference Lowe, Rottman and Linden2005). The symmetry about
 $z^{\prime }=0$
is further confirmed by measurements of the anomalous mass that appears in each layer as a result of mixing across the interface. The proportions of the less dense and more dense initial fluid volume that are mixed by the current into the other volume,
$z^{\prime }=0$
is further confirmed by measurements of the anomalous mass that appears in each layer as a result of mixing across the interface. The proportions of the less dense and more dense initial fluid volume that are mixed by the current into the other volume,
 $$\begin{eqnarray}\unicode[STIX]{x1D6FC}_{L}=\frac{\displaystyle \int _{0}^{\unicode[STIX]{x1D6FE}H_{H}}(\unicode[STIX]{x1D70C}_{H}-\unicode[STIX]{x1D70C})L\,\text{d}z}{(1-\unicode[STIX]{x1D6FE})H_{L}L(\unicode[STIX]{x1D70C}_{H}-\unicode[STIX]{x1D70C}_{L})}\quad \text{and}\quad \unicode[STIX]{x1D6FC}_{H}=\frac{\displaystyle \int _{\unicode[STIX]{x1D6FE}H_{H}}^{H}(\unicode[STIX]{x1D70C}-\unicode[STIX]{x1D70C}_{L})L\,\text{d}z}{\unicode[STIX]{x1D6FE}H_{H}L(\unicode[STIX]{x1D70C}_{H}-\unicode[STIX]{x1D70C}_{L})},\end{eqnarray}$$
respectively, are found to be almost identical (which would be expected by conservation of mass if non-Boussinesq effects are small), with
 $\unicode[STIX]{x1D6FC}_{L}\approx \unicode[STIX]{x1D6FC}_{H}\equiv \unicode[STIX]{x1D6FC}\approx 0.1$
in all experiments (table 1).
$\unicode[STIX]{x1D6FC}_{L}\approx \unicode[STIX]{x1D6FC}_{H}\equiv \unicode[STIX]{x1D6FC}\approx 0.1$
in all experiments (table 1).

Figure 5. Mixing efficiency results plotted as a function of the Reynolds number
 $Re$
. Error bars are calculated for each experiment and are determined mainly by the relative accuracy with which the changes in free-surface height
$Re$
. Error bars are calculated for each experiment and are determined mainly by the relative accuracy with which the changes in free-surface height
 $H_{L}-H$
and
$H_{L}-H$
and
 $H_{H}-H$
in (2.5) can be measured. The error bars exceed the symbol size only for the lowest two
$H_{H}-H$
in (2.5) can be measured. The error bars exceed the symbol size only for the lowest two
 $Re$
experiments.
$Re$
experiments.
The mixing efficiency determined from the initial and final density fields as described in § 2.1 is shown in figure 5. The values range from 0.05 to 0.08, and suggest a slight increase with
 $Re$
to an asymptote at high
$Re$
to an asymptote at high
 $Re$
. Unfortunately, we were unable to reach higher
$Re$
. Unfortunately, we were unable to reach higher
 $Re$
values with our laboratory facilities and so the asymptotic value cannot be confirmed. However, we have reason to believe this is the high
$Re$
values with our laboratory facilities and so the asymptotic value cannot be confirmed. However, we have reason to believe this is the high
 $Re$
limit as we discuss below.
$Re$
limit as we discuss below.
4 Lock-exchange gravity current model
In this section, we develop a model of a lock-exchange gravity current that accounts for dissipation and stratified mixing. First, we define general conventions applicable to both (idealized) non-dissipative and dissipative currents, and then proceed to use these to characterize the properties and energy budget of the dissipative lock-exchange flow.
We assign (figure 1) the reservoir of relatively light (heavy) fluid of density
 $\unicode[STIX]{x1D70C}_{L}$
(
$\unicode[STIX]{x1D70C}_{L}$
(
 $\unicode[STIX]{x1D70C}_{H}$
) to be initially to the left (right) of the lock. Consider the (coupled) evolution of a column of fluid from each reservoir of height
$\unicode[STIX]{x1D70C}_{H}$
) to be initially to the left (right) of the lock. Consider the (coupled) evolution of a column of fluid from each reservoir of height
 $H$
and length
$H$
and length
 $\unicode[STIX]{x0394}L$
, such that its volume (per unit spanwise width) is
$\unicode[STIX]{x0394}L$
, such that its volume (per unit spanwise width) is
 $\unicode[STIX]{x0394}Q=H\unicode[STIX]{x0394}L$
. We denote the volume exchanged (i.e. that carried in each layer) in a time
$\unicode[STIX]{x0394}Q=H\unicode[STIX]{x0394}L$
. We denote the volume exchanged (i.e. that carried in each layer) in a time
 $\unicode[STIX]{x0394}t$
as the exchange volume flux
$\unicode[STIX]{x0394}t$
as the exchange volume flux
 $\dot{Q}=\unicode[STIX]{x0394}Q/\unicode[STIX]{x0394}t$
.
$\dot{Q}=\unicode[STIX]{x0394}Q/\unicode[STIX]{x0394}t$
.
In the idealized limit of inviscid flow (a situation denoted by the subscript
 $i$
), conservation of energy can be used to predict the flow speed
$i$
), conservation of energy can be used to predict the flow speed
 $U_{i}$
, which is assumed uniform in each layer. Symmetry of the flow about the lock position implies that each layer in the exchange has depth
$U_{i}$
, which is assumed uniform in each layer. Symmetry of the flow about the lock position implies that each layer in the exchange has depth
 $H/2$
, and
$H/2$
, and
 $\dot{Q}_{i}=(1/2)U_{i}H$
. Following Yih (Reference Yih1947), Yih (Reference Yih1965) we equate the rate of release of potential energy
$\dot{Q}_{i}=(1/2)U_{i}H$
. Following Yih (Reference Yih1947), Yih (Reference Yih1965) we equate the rate of release of potential energy
 ${\dot{E}}$
(which corresponds physically to a raising (lowering) of the height of the centre of mass of the dense (light) fluid by
${\dot{E}}$
(which corresponds physically to a raising (lowering) of the height of the centre of mass of the dense (light) fluid by
 $H/4$
) with the rate at which kinetic energy is generated in the flow, i.e.
$H/4$
) with the rate at which kinetic energy is generated in the flow, i.e.
 $$\begin{eqnarray}\displaystyle {\dot{E}}={\textstyle \frac{1}{4}}g\unicode[STIX]{x1D70C}_{H}H\dot{Q}_{i}-{\textstyle \frac{1}{4}}g\unicode[STIX]{x1D70C}_{L}H\dot{Q}_{i}=2\dot{Q}_{i}{\textstyle \frac{1}{2}}\unicode[STIX]{x1D70C}_{0}U_{i}^{2}. & & \displaystyle\end{eqnarray}$$
This recovers the usual result (e.g. Benjamin (Reference Benjamin1968), Simpson (Reference Simpson1997)) for the speed of an inviscid lock-exchange gravity current,
 $$\begin{eqnarray}\displaystyle U_{i}={\textstyle \frac{1}{2}}\sqrt{g^{\prime }H}, & & \displaystyle\end{eqnarray}$$
where
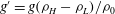 $g^{\prime }=g(\unicode[STIX]{x1D70C}_{H}-\unicode[STIX]{x1D70C}_{L})/\unicode[STIX]{x1D70C}_{0}$
is the reduced gravity.
$g^{\prime }=g(\unicode[STIX]{x1D70C}_{H}-\unicode[STIX]{x1D70C}_{L})/\unicode[STIX]{x1D70C}_{0}$
is the reduced gravity.
The idealized two-layer inviscid lock-exchange flow (which requires a step change in the density and velocity profiles) is unstable to shear at the interface. We assume that instability arises in the vicinity of each gravity current head, and then develops and saturates at some distance behind the head (a few current depths, consistent with recent observations by Sher & Woods (Reference Sher and Woods2015) and Cenedese et al. (personal communication)). Thus in a lock-exchange flow with dissipation, we expect instability and turbulent mixing at a given location to be associated with the passage of the gravity current. We also assume that turbulence with sufficient intensity to support mixing is suppressed once the instability has run its course and left behind a stabilized interfacial structure in the wake of the current, consistent with our qualitative observations, previous studies (Thorpe Reference Thorpe1973; Smyth & Moum Reference Smyth and Moum2000) and the subsequent predictions of this model.

Figure 6. Schematic diagram of the flow model: (a) indicates the overall flow structure and (b) and (c) show the assumed (piecewise linear) velocity and density profiles, respectively. Panel (a) indicates development of shear instability in the vicinity of each gravity current head, with intense turbulent eddies depicted by the swirls. Far enough behind each head, the interface between the counter-flowing currents has stabilized. The darkest grey shading denotes fluid of density
 $\unicode[STIX]{x1D70C}_{H}$
, with fluid of intermediate density indicated by lighter shading in the interfacial region between the two currents. We decompose the volume transport in the exchange flow into a number of components denoted by the general symbol
$\unicode[STIX]{x1D70C}_{H}$
, with fluid of intermediate density indicated by lighter shading in the interfacial region between the two currents. We decompose the volume transport in the exchange flow into a number of components denoted by the general symbol
 $Q$
: the subscript denotes fluid that originated from the light (
$Q$
: the subscript denotes fluid that originated from the light (
 $\text{L}$
) or heavy (
$\text{L}$
) or heavy (
 $\text{H}$
) reservoir (to the left and right, respectively), the first superscript character denotes fluid that is unmodified (
$\text{H}$
) reservoir (to the left and right, respectively), the first superscript character denotes fluid that is unmodified (
 $u$
) or modified (
$u$
) or modified (
 $m$
) by mixing with respect to its source reservoir density and the second and third superscript characters (if present) denote the direction of flow as either left to right (
$m$
) by mixing with respect to its source reservoir density and the second and third superscript characters (if present) denote the direction of flow as either left to right (
 $lr$
) or right to left (
$lr$
) or right to left (
 $rl$
). Only the component transports originating from the light reservoir,
$rl$
). Only the component transports originating from the light reservoir,
 $\dot{Q}_{L}^{u}$
,
$\dot{Q}_{L}^{u}$
,
 $\dot{Q}_{L}^{mlr}$
and
$\dot{Q}_{L}^{mlr}$
and
 $\dot{Q}_{L}^{mrl}$
, are indicated in (a) for the sake of clarity. However, as we assume anti-symmetry in the flow at vertical section b about
$\dot{Q}_{L}^{mrl}$
, are indicated in (a) for the sake of clarity. However, as we assume anti-symmetry in the flow at vertical section b about
 $z^{\prime }=0$
(4.9), the corresponding components that have originated from the heavy reservoir,
$z^{\prime }=0$
(4.9), the corresponding components that have originated from the heavy reservoir,
 $\dot{Q}_{H}^{u}$
,
$\dot{Q}_{H}^{u}$
,
 $\dot{Q}_{H}^{mrl}$
and
$\dot{Q}_{H}^{mrl}$
and
 $\dot{Q}_{H}^{mlr}$
, respectively, are equal and oppositely directed. Note that the transport components
$\dot{Q}_{H}^{mlr}$
, respectively, are equal and oppositely directed. Note that the transport components
 $\dot{Q}_{L}^{mrl}$
and
$\dot{Q}_{L}^{mrl}$
and
 $\dot{Q}_{H}^{mlr}$
represent the rate at which volume is swapped with the counter-flowing layer as a result of turbulent mixing. Further note that although transport components from left to right are defined as positive, the arrows in the figure indicate the physical direction of the transport. With this decomposition,
$\dot{Q}_{H}^{mlr}$
represent the rate at which volume is swapped with the counter-flowing layer as a result of turbulent mixing. Further note that although transport components from left to right are defined as positive, the arrows in the figure indicate the physical direction of the transport. With this decomposition,
 $\dot{Q}_{d}$
is seen to be equal to the exchange volume transport (of mixed fluid; equation (4.8)) from left to right through b, i.e.
$\dot{Q}_{d}$
is seen to be equal to the exchange volume transport (of mixed fluid; equation (4.8)) from left to right through b, i.e.
 $\dot{Q}_{L}^{u}+\dot{Q}_{L}^{mlr}+\dot{Q}_{H}^{mlr}$
, which is the sum of the horizontal and diagonal striped regions (for
$\dot{Q}_{L}^{u}+\dot{Q}_{L}^{mlr}+\dot{Q}_{H}^{mlr}$
, which is the sum of the horizontal and diagonal striped regions (for
 $0<z^{\prime }\leqslant H/2$
) in (b) (4.4). However,
$0<z^{\prime }\leqslant H/2$
) in (b) (4.4). However,
 $\dot{Q}_{d}$
must also be equal to the rate at which volume leaves a specific reservoir (4.10), i.e.
$\dot{Q}_{d}$
must also be equal to the rate at which volume leaves a specific reservoir (4.10), i.e.
 $\dot{Q}_{L}^{u}+\dot{Q}_{L}^{mlr}+|\dot{Q}_{L}^{mrl}|$
. In (c), the dashed line indicates the density of unmixed fluid entering the current from left to right at section a and the effective current depth
$\dot{Q}_{L}^{u}+\dot{Q}_{L}^{mlr}+|\dot{Q}_{L}^{mrl}|$
. In (c), the dashed line indicates the density of unmixed fluid entering the current from left to right at section a and the effective current depth
 $h_{e}$
corresponds to the height of the rectangle in the upper layer with the same area as the horizontal striped region in the profile at section b (i.e. the same total buoyancy anomaly with respect to the mid-point density
$h_{e}$
corresponds to the height of the rectangle in the upper layer with the same area as the horizontal striped region in the profile at section b (i.e. the same total buoyancy anomaly with respect to the mid-point density
 $\unicode[STIX]{x1D70C}_{0}$
).
$\unicode[STIX]{x1D70C}_{0}$
).
For simplicity we adopt mean velocity and density profiles in the wake of the current that (have evolved via instability from idealized step profiles to) vary linearly with height through the stabilized interfacial region (of thickness
 $\unicode[STIX]{x1D6FF}$
) in order to match the free stream flow velocities and densities in the layers above and below (figure 6). We define the dimensionless thickness
$\unicode[STIX]{x1D6FF}$
) in order to match the free stream flow velocities and densities in the layers above and below (figure 6). We define the dimensionless thickness
 $r$
of the stabilized interface in a dissipative current to be
$r$
of the stabilized interface in a dissipative current to be
 $$\begin{eqnarray}r\equiv \frac{\unicode[STIX]{x1D6FF}}{H}.\end{eqnarray}$$
4.1 Volume and mass transport
In the dissipative lock-exchange flow we assume that each layer will evolve to consist of a region of depth
 $(1/2)H(1-r)$
of unmixed reservoir fluid moving at the free stream speed
$(1/2)H(1-r)$
of unmixed reservoir fluid moving at the free stream speed
 $U$
, with reduced flow in the interfacial layer sandwiched between (figure 6). Thus the exchange volume transport in the flow with dissipation,
$U$
, with reduced flow in the interfacial layer sandwiched between (figure 6). Thus the exchange volume transport in the flow with dissipation,
 $\dot{Q}_{d}=\unicode[STIX]{x0394}Q_{d}/\unicode[STIX]{x0394}t\,({<}\dot{Q}_{i})$
, is
$\dot{Q}_{d}=\unicode[STIX]{x0394}Q_{d}/\unicode[STIX]{x0394}t\,({<}\dot{Q}_{i})$
, is
 $$\begin{eqnarray}\dot{Q}_{d}=\frac{1}{2}HU(1-r)+\int _{0}^{\unicode[STIX]{x1D6FF}/2}\frac{2Uz^{\prime }}{\unicode[STIX]{x1D6FF}}\,\text{d}z^{\prime }=\frac{1}{2}\left(1-\frac{r}{2}\right)HU.\end{eqnarray}$$
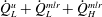
The volume transport in the upper layer can be related to the supply of unmixed fluid originating from the reservoirs by decomposing
 $\dot{Q}_{d}$
into the sum of three components (figure 6):
$\dot{Q}_{d}$
into the sum of three components (figure 6):
-
(i) an unmodified component from the left reservoir
(4.5) $$\begin{eqnarray}\displaystyle \dot{Q}_{L}^{u}={\textstyle \frac{1}{2}}HU(1-r), & & \displaystyle\end{eqnarray}$$
-
(ii) a component
$\dot{Q}_{L}^{mlr}$
from the left reservoir that is mixed as it flows to the right (in the same direction as
$\dot{Q}_{L}^{u}$
) (4.6)where
$$\begin{eqnarray}\dot{Q}_{L}^{mlr}=\int _{0}^{\unicode[STIX]{x1D6FF}/2}\frac{2Uz^{\prime }}{\unicode[STIX]{x1D6FF}}c_{\unicode[STIX]{x1D70C}_{L}}(z^{\prime })\,\text{d}z^{\prime }=\frac{5}{24}rHU,\end{eqnarray}$$
$c_{\unicode[STIX]{x1D70C}_{L}}(z^{\prime })=1/2(1+2z^{\prime }/\unicode[STIX]{x1D6FF})$
is the volume fraction of the
$\unicode[STIX]{x1D70C}_{L}$
source component in a water parcel at height
$z^{\prime }$
and (iii) a component
$\dot{Q}_{H}^{mlr}$
from the right reservoir that is mixed and joins the upper layer flowing from left to right (4.7)
$$\begin{eqnarray}\dot{Q}_{H}^{mlr}=\int _{0}^{\unicode[STIX]{x1D6FF}/2}\frac{2Uz^{\prime }}{\unicode[STIX]{x1D6FF}}\left(1-c_{\unicode[STIX]{x1D70C}_{L}}(z^{\prime })\right)\,\text{d}z=\frac{1}{24}rHU.\end{eqnarray}$$


The volume transport in the lower layer can be decomposed similarly into an unmodified component
 $\dot{Q}_{H}^{u}$
from the right reservoir, a component
$\dot{Q}_{H}^{u}$
from the right reservoir, a component
 $\dot{Q}_{H}^{mrl}$
from the right reservoir that is mixed as it flows to the left and a component
$\dot{Q}_{H}^{mrl}$
from the right reservoir that is mixed as it flows to the left and a component
 $\dot{Q}_{L}^{mrl}$
from the left reservoir that is mixed and joins the lower layer flowing from right to left. Defining volume transport from left to right as positive and invoking symmetry in the problem, we can write
$\dot{Q}_{L}^{mrl}$
from the left reservoir that is mixed and joins the lower layer flowing from right to left. Defining volume transport from left to right as positive and invoking symmetry in the problem, we can write
 $$\begin{eqnarray}\dot{Q}_{d}=\dot{Q}_{L}^{u}+\dot{Q}_{L}^{mlr}+\dot{Q}_{H}^{mlr}=|\dot{Q}_{H}^{u}|+|\dot{Q}_{H}^{mrl}|+|\dot{Q}_{L}^{mrl}|,\end{eqnarray}$$
and
 $$\begin{eqnarray}\dot{Q}_{L}^{u}=-\dot{Q}_{H}^{u},\quad \dot{Q}_{L}^{mlr}=-\dot{Q}_{H}^{mrl},\quad \dot{Q}_{H}^{mlr}=-\dot{Q}_{L}^{mrl}.\end{eqnarray}$$
Equations (4.8) and (4.9) can be used to account for the volume transport of unmixed fluid that originates from one of the reservoirs, e.g.
 $$\begin{eqnarray}\dot{Q}_{d}=\dot{Q}_{L}^{u}+\dot{Q}_{L}^{mlr}+|\dot{Q}_{L}^{mrl}|\end{eqnarray}$$
for the left reservoir. Furthermore, it follows from (4.5)–(4.7) and (4.9) that the net left to right transport of fluid that originated from the left reservoir is
 $$\begin{eqnarray}\dot{Q}_{L}^{u}+\dot{Q}_{L}^{mlr}+\dot{Q}_{L}^{mrl}=\frac{1}{2}\left(1-\frac{2r}{3}\right)HU.\end{eqnarray}$$
We define the effective current depth
 $h_{e}$
as the depth of unmixed fluid from the appropriate reservoir that would accommodate the buoyancy anomaly present in a layer of the assumed dissipative flow. Taking a layer to be either
$h_{e}$
as the depth of unmixed fluid from the appropriate reservoir that would accommodate the buoyancy anomaly present in a layer of the assumed dissipative flow. Taking a layer to be either
 $-H/2\leqslant z^{\prime }<0$
or
$-H/2\leqslant z^{\prime }<0$
or
 $0<z^{\prime }\leqslant H/2$
and the buoyancy anomaly with respect to the mid-point density
$0<z^{\prime }\leqslant H/2$
and the buoyancy anomaly with respect to the mid-point density
 $\unicode[STIX]{x1D70C}_{0}$
, we find
$\unicode[STIX]{x1D70C}_{0}$
, we find
 $h_{e}=(1-r/2)H/2$
(see figure 6
c). We proceed by assuming that the free stream speed
$h_{e}=(1-r/2)H/2$
(see figure 6
c). We proceed by assuming that the free stream speed
 $U$
in each layer will be
$U$
in each layer will be
 $U_{i}$
on the physical basis that dissipation of energy along streamlines outside the interfacial layer will be relatively small. This assumption is supported by the recent measurements of Sher & Woods (Reference Sher and Woods2015).
$U_{i}$
on the physical basis that dissipation of energy along streamlines outside the interfacial layer will be relatively small. This assumption is supported by the recent measurements of Sher & Woods (Reference Sher and Woods2015).
Sher & Woods (Reference Sher and Woods2015) also show that mixing and recirculation of fluid in the current head leads to a measured front speed
 $U_{M}$
that is somewhat less than
$U_{M}$
that is somewhat less than
 $U_{i}$
, thus we now differentiate between a prediction for the front speed
$U_{i}$
, thus we now differentiate between a prediction for the front speed
 $U_{e}$
and the free stream speed
$U_{e}$
and the free stream speed
 $U$
. We predict
$U$
. We predict
 $U_{e}$
by equating
$U_{e}$
by equating
 $U_{e}h_{e}$
with (4.11) and setting
$U_{e}h_{e}$
with (4.11) and setting
 $U=U_{i}$
. In physical terms, we expect the net rate of horizontal transport of fluid that has originated from each reservoir to give the volume transport involved in extending each current (of effective depth
$U=U_{i}$
. In physical terms, we expect the net rate of horizontal transport of fluid that has originated from each reservoir to give the volume transport involved in extending each current (of effective depth
 $h_{e}$
) in the dissipative exchange flow, i.e. to the right in the upper layer and to left in the lower layer. Hence
$h_{e}$
) in the dissipative exchange flow, i.e. to the right in the upper layer and to left in the lower layer. Hence
 $$\begin{eqnarray}\frac{U_{e}}{U_{i}}=\frac{1-2r/3}{1-r/2}.\end{eqnarray}$$
To enable comparison with the experimental measurements, we can predict the overall Richardson number
 $Ri_{O}^{p}$
for the current by using
$Ri_{O}^{p}$
for the current by using
 $U_{e}$
in place of the measured front speed
$U_{e}$
in place of the measured front speed
 $U_{M}$
in the expression for
$U_{M}$
in the expression for
 $Ri_{O}$
from table 1, thus
$Ri_{O}$
from table 1, thus
 $$\begin{eqnarray}Ri_{O}^{p}=\frac{g^{\prime }H}{4U_{e}^{2}}=\frac{U_{i}^{2}}{U_{e}^{2}}=\frac{(1-r/2)^{2}}{(1-2r/3)^{2}},\end{eqnarray}$$
upon substituting (4.2) and (4.12). (Note that the assumption that the front and free stream speeds are the same and given by (4.2), as for an idealized inviscid gravity current, (i.e.
 $U_{e}=U=U_{i}$
) corresponds to
$U_{e}=U=U_{i}$
) corresponds to
 $Ri_{O}^{p}=1$
.) Apart from a clear outlier at the lowest Reynolds number (Exp 5), the measurements in table 1 are consistent with a constant value for
$Ri_{O}^{p}=1$
.) Apart from a clear outlier at the lowest Reynolds number (Exp 5), the measurements in table 1 are consistent with a constant value for
 $Ri_{O}=1.18$
 $(\pm 0.08)$
. Thus, equating the measured
$(\pm 0.08)$
. Thus, equating the measured
 $Ri_{O}$
with (4.13) is consistent with
$Ri_{O}$
with (4.13) is consistent with
 $r=0.38$
 $(\pm 0.1)$
; however, a more accurate determination (estimated to within
$(\pm 0.1)$
; however, a more accurate determination (estimated to within
 $\pm 0.02$
) is given below.
$\pm 0.02$
) is given below.
In our physical model, mixed fluid is created by the passage of each current at the rate
 $\dot{Q}_{m}=\dot{Q}_{L}^{mlr}+\dot{Q}_{H}^{mlr}(=\dot{Q}_{L}^{mlr}+|\dot{Q}_{L}^{mrl}|)$
, which is the sum of the second and third terms on the right-hand side of (4.8) and (4.10). Upon substituting (4.6) and (4.7) for
$\dot{Q}_{m}=\dot{Q}_{L}^{mlr}+\dot{Q}_{H}^{mlr}(=\dot{Q}_{L}^{mlr}+|\dot{Q}_{L}^{mrl}|)$
, which is the sum of the second and third terms on the right-hand side of (4.8) and (4.10). Upon substituting (4.6) and (4.7) for
 $\dot{Q}_{L}^{mlr}$
and
$\dot{Q}_{L}^{mlr}$
and
 $\dot{Q}_{H}^{mlr}$
, we find that the proportion of the exchange transport involved in mixing is
$\dot{Q}_{H}^{mlr}$
, we find that the proportion of the exchange transport involved in mixing is
 $$\begin{eqnarray}\frac{\dot{Q}_{m}}{\dot{Q}_{d}}=\frac{rHU_{i}/4}{(1-r/2)HU_{i}/2}=\frac{r}{2-r}.\end{eqnarray}$$
Our model assumes that mixing will occur at a constant rate until each current first reaches the end of the channel (and is zero thereafter). Hence we expect
 $\dot{Q}_{m}/\dot{Q}_{d}$
to be equal to
$\dot{Q}_{m}/\dot{Q}_{d}$
to be equal to
 $\unicode[STIX]{x1D6FC}_{L}+\unicode[STIX]{x1D6FC}_{H}\approx 2\unicode[STIX]{x1D6FC}$
, which is calculated from (3.1) and is based on quantities that are measured accurately in experiments. As
$\unicode[STIX]{x1D6FC}_{L}+\unicode[STIX]{x1D6FC}_{H}\approx 2\unicode[STIX]{x1D6FC}$
, which is calculated from (3.1) and is based on quantities that are measured accurately in experiments. As
 $\unicode[STIX]{x1D6FC}$
is found to take a value close to 0.1 (
$\unicode[STIX]{x1D6FC}$
is found to take a value close to 0.1 (
 $\pm 0.007$
; table 1) in all experiments, equating (4.14) to
$\pm 0.007$
; table 1) in all experiments, equating (4.14) to
 $2\unicode[STIX]{x1D6FC}$
yields
$2\unicode[STIX]{x1D6FC}$
yields
 $r=0.33$
(
$r=0.33$
(
 $\pm 0.02$
), a value that is consistent with the final density gradient through the centre of the interfacial region in the self-similar profiles – see figure 4.
$\pm 0.02$
), a value that is consistent with the final density gradient through the centre of the interfacial region in the self-similar profiles – see figure 4.
It is worth remarking that the assumed piecewise linear density profile (figure 6
c) is fully consistent with the value of
 $r=0.33$
above. This may be surprising given
$r=0.33$
above. This may be surprising given
 $r=0.33$
seems to neglect curvature in the density profile and underestimate the volume of unmixed fluid that is passed to the other layer (as suggested by comparing the areas enclosed between either the measured or piecewise linear profile and the horizontal axis in figure 4). Indeed, evaluating (3.1) with the assumed piecewise linear density profile suggests coefficients
$r=0.33$
seems to neglect curvature in the density profile and underestimate the volume of unmixed fluid that is passed to the other layer (as suggested by comparing the areas enclosed between either the measured or piecewise linear profile and the horizontal axis in figure 4). Indeed, evaluating (3.1) with the assumed piecewise linear density profile suggests coefficients
 $\unicode[STIX]{x1D6FC}_{L}^{\ast }\approx \unicode[STIX]{x1D6FC}_{H}^{\ast }\approx r/4<\unicode[STIX]{x1D6FC}$
for
$\unicode[STIX]{x1D6FC}_{L}^{\ast }\approx \unicode[STIX]{x1D6FC}_{H}^{\ast }\approx r/4<\unicode[STIX]{x1D6FC}$
for
 $\unicode[STIX]{x1D6FE}=1/2$
(i.e. for a lock at the channel mid-point), where the asterisk is used to denote the calculation with the assumed (rather than the measured) profile and (4.14) has been equated with
$\unicode[STIX]{x1D6FE}=1/2$
(i.e. for a lock at the channel mid-point), where the asterisk is used to denote the calculation with the assumed (rather than the measured) profile and (4.14) has been equated with
 $2\unicode[STIX]{x1D6FC}$
. However, we note that determination of
$2\unicode[STIX]{x1D6FC}$
. However, we note that determination of
 $r$
needs to take account of the rates of volume transport and creation of mixed fluid. The amount of mixing in the final density profiles is then associated with the exchange volume flux in the currents, which, because of dissipation, is somewhat less than the maximum possible volume flux for an idealized inviscid flow (i.e.
$r$
needs to take account of the rates of volume transport and creation of mixed fluid. The amount of mixing in the final density profiles is then associated with the exchange volume flux in the currents, which, because of dissipation, is somewhat less than the maximum possible volume flux for an idealized inviscid flow (i.e.
 $\dot{Q}_{d}<\dot{Q}_{i}$
). In contrast, the calculation of
$\dot{Q}_{d}<\dot{Q}_{i}$
). In contrast, the calculation of
 $\unicode[STIX]{x1D6FC}_{L}^{\ast }$
and
$\unicode[STIX]{x1D6FC}_{L}^{\ast }$
and
 $\unicode[STIX]{x1D6FC}_{H}^{\ast }$
corresponds physically to the proportion of each reservoir volume that has been swapped to obtain the final state and, assuming the exchange flow is steady, would be equal to
$\unicode[STIX]{x1D6FC}_{H}^{\ast }$
corresponds physically to the proportion of each reservoir volume that has been swapped to obtain the final state and, assuming the exchange flow is steady, would be equal to
 $\dot{Q}_{m}/\dot{Q}_{i}$
. Upon comparison with (4.14), we reason that
$\dot{Q}_{m}/\dot{Q}_{i}$
. Upon comparison with (4.14), we reason that
 $\unicode[STIX]{x1D6FC}_{L}^{\ast }$
and
$\unicode[STIX]{x1D6FC}_{L}^{\ast }$
and
 $\unicode[STIX]{x1D6FC}_{H}^{\ast }$
(and
$\unicode[STIX]{x1D6FC}_{H}^{\ast }$
(and
 $\unicode[STIX]{x1D6FC}^{\ast }$
) will be a factor
$\unicode[STIX]{x1D6FC}^{\ast }$
) will be a factor
 $\dot{Q}_{d}/\dot{Q}_{i}=(1-r/2)$
smaller than
$\dot{Q}_{d}/\dot{Q}_{i}=(1-r/2)$
smaller than
 $\unicode[STIX]{x1D6FC}_{L}$
and
$\unicode[STIX]{x1D6FC}_{L}$
and
 $\unicode[STIX]{x1D6FC}_{H}$
(and
$\unicode[STIX]{x1D6FC}_{H}$
(and
 $\unicode[STIX]{x1D6FC}$
), respectively. For
$\unicode[STIX]{x1D6FC}$
), respectively. For
 $r=0.33$
, we therefore expect
$r=0.33$
, we therefore expect
 $\unicode[STIX]{x1D6FC}_{L}^{\ast }\approx \unicode[STIX]{x1D6FC}_{H}^{\ast }\approx \unicode[STIX]{x1D6FC}^{\ast }=0.83\unicode[STIX]{x1D6FC}\approx 0.083$
, or approximately
$\unicode[STIX]{x1D6FC}_{L}^{\ast }\approx \unicode[STIX]{x1D6FC}_{H}^{\ast }\approx \unicode[STIX]{x1D6FC}^{\ast }=0.83\unicode[STIX]{x1D6FC}\approx 0.083$
, or approximately
 $r/4$
.
$r/4$
.
4.2 Energy budget for mixing
We now consider the energetic consequences of the interfacial mixing, assuming that shear instability and turbulent mixing occur in the vicinity of each gravity current head. The drag associated with the turbulence causes the exchange transport
 $\dot{Q}_{d}$
to be less than
$\dot{Q}_{d}$
to be less than
 $\dot{Q}_{i}$
and, for the same reasons discussed above, we must analyse the energy budget by comparing the dissipative lock-exchange flow with an idealized non-dissipative counterpart that has the same exchange transport
$\dot{Q}_{i}$
and, for the same reasons discussed above, we must analyse the energy budget by comparing the dissipative lock-exchange flow with an idealized non-dissipative counterpart that has the same exchange transport
 $\dot{Q}_{d}$
. Viewed in this way, dissipation acts to ‘choke’ the rate of release of potential energy
$\dot{Q}_{d}$
. Viewed in this way, dissipation acts to ‘choke’ the rate of release of potential energy
 ${\dot{E}}$
driving the flow,
${\dot{E}}$
driving the flow,
 $$\begin{eqnarray}{\dot{E}}={\textstyle \frac{1}{4}}\unicode[STIX]{x1D70C}_{0}g^{\prime }H\dot{Q}_{d},\end{eqnarray}$$
which is obtained in a similar manner to (4.1) (
 $\dot{Q}_{i}$
being replaced by
$\dot{Q}_{i}$
being replaced by
 $\dot{Q}_{d}$
). We can calculate the rate of mixing that would be associated with the linear variation of density through the interfacial layer, i.e.
$\dot{Q}_{d}$
). We can calculate the rate of mixing that would be associated with the linear variation of density through the interfacial layer, i.e.
 $\unicode[STIX]{x1D70C}(z)=\unicode[STIX]{x1D70C}_{0}-(\unicode[STIX]{x1D70C}_{H}-\unicode[STIX]{x1D70C}_{L})z^{\prime }/\unicode[STIX]{x1D6FF}$
. The density profile if no mixing occurred would be a step from
$\unicode[STIX]{x1D70C}(z)=\unicode[STIX]{x1D70C}_{0}-(\unicode[STIX]{x1D70C}_{H}-\unicode[STIX]{x1D70C}_{L})z^{\prime }/\unicode[STIX]{x1D6FF}$
. The density profile if no mixing occurred would be a step from
 $\unicode[STIX]{x1D70C}_{L}$
to
$\unicode[STIX]{x1D70C}_{L}$
to
 $\unicode[STIX]{x1D70C}_{R}$
at
$\unicode[STIX]{x1D70C}_{R}$
at
 $z^{\prime }=0$
, thus the rate of change of potential energy owing to mixing at an interface lengthening at a rate
$z^{\prime }=0$
, thus the rate of change of potential energy owing to mixing at an interface lengthening at a rate
 $2U_{e}$
is
$2U_{e}$
is
 $$\begin{eqnarray}{\dot{E}}_{p}=2U_{e}\int _{-\unicode[STIX]{x1D6FF}/2}^{\unicode[STIX]{x1D6FF}/2}\unicode[STIX]{x1D70C}_{0}\frac{g^{\prime }}{2}\left(\text{sgn}(z^{\prime })-\frac{2z^{\prime }}{\unicode[STIX]{x1D6FF}}\right)z^{\prime }\,\text{d}z^{\prime }=\frac{1}{6}\frac{(1-2r/3)}{(1-r/2)^{2}}\unicode[STIX]{x1D70C}_{0}g^{\prime }H\dot{Q}_{d}\left(\frac{\unicode[STIX]{x1D6FF}}{H}\right)^{2},\end{eqnarray}$$
where (4.4) and (4.12) have been used.
The energy budget can be used to characterize the mixing in terms of a mixing efficiency, and the proportion of total energy released and used for mixing is predicted to be
 $$\begin{eqnarray}{\mathcal{M}}=\frac{{\dot{E}}_{p}}{{\dot{E}}}=\frac{2r^{2}}{3}\frac{(1-2r/3)}{(1-r/2)^{2}},\end{eqnarray}$$
which is dependent only upon the parameter
 $r$
characterizing the self-similar behaviour. The mixing efficiency
$r$
characterizing the self-similar behaviour. The mixing efficiency
 ${\mathcal{M}}$
predicted for
${\mathcal{M}}$
predicted for
 $r=0.33$
is 0.081, which corresponds well with the measured asymptotic value (figure 5).
$r=0.33$
is 0.081, which corresponds well with the measured asymptotic value (figure 5).
5 Conclusions
The conceptually simple experiments presented here yield a range of insights into mixing caused by a gravity current. The qualitative observations and measurements are consistent with development of stratified shear instability associated with the passage of the gravity current head. The ensuing turbulence and mixing redistributes momentum and density in the vertical until the interface above or below the current is stabilized. At sufficiently high Reynolds number (of
 $O(30\,000)$
based on the current depth), we find that the resulting density profile becomes self-similar; the thickness of the stabilized interface normalized by the total flow depth
$O(30\,000)$
based on the current depth), we find that the resulting density profile becomes self-similar; the thickness of the stabilized interface normalized by the total flow depth
 $r$
is close to a third. Interestingly, the interfacial signatures resulting from fully developed Kelvin–Helmholtz instability and mixing are essentially identical (Thorpe Reference Thorpe1973; Corcos & Sherman Reference Corcos and Sherman1976; Koop & Browand Reference Koop and Browand1979; Smyth & Moum Reference Smyth and Moum2000).
$r$
is close to a third. Interestingly, the interfacial signatures resulting from fully developed Kelvin–Helmholtz instability and mixing are essentially identical (Thorpe Reference Thorpe1973; Corcos & Sherman Reference Corcos and Sherman1976; Koop & Browand Reference Koop and Browand1979; Smyth & Moum Reference Smyth and Moum2000).
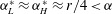
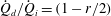
Simple arguments suggest that the dimensionless interface thickness is a direct indication of the gradient Richardson number that evolves across the interface between the two currents (i.e.
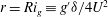 $r=Ri_{g}\equiv g^{\prime }\unicode[STIX]{x1D6FF}/4U^{2}$
, from (4.3) and with
$r=Ri_{g}\equiv g^{\prime }\unicode[STIX]{x1D6FF}/4U^{2}$
, from (4.3) and with
 $U_{e}$
in (4.13) replaced by
$U_{e}$
in (4.13) replaced by
 $U=U_{i}$
). Thus
$U=U_{i}$
). Thus
 $r\approx 0.33$
is consistent with establishment of an interfacial region that is stable to shear instability (
$r\approx 0.33$
is consistent with establishment of an interfacial region that is stable to shear instability (
 $Ri_{g}\sim 0.3$
). This dimensionless thickness is further consistent with current speed
$Ri_{g}\sim 0.3$
). This dimensionless thickness is further consistent with current speed
 $U_{e}\approx 0.92U_{i}$
(see (4.12)), and thus a Froude number
$U_{e}\approx 0.92U_{i}$
(see (4.12)), and thus a Froude number
 $Fr=U_{e}/(g^{\prime }H)^{1/2}\approx 0.46$
as found in full-depth lock-exchange experiments at high
$Fr=U_{e}/(g^{\prime }H)^{1/2}\approx 0.46$
as found in full-depth lock-exchange experiments at high
 $Re$
(Keulegan Reference Keulegan1958; Shin et al.
Reference Shin, Dalziel and Linden2004).
$Re$
(Keulegan Reference Keulegan1958; Shin et al.
Reference Shin, Dalziel and Linden2004).
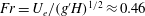
We find that up to approximately 0.08 of the energy supplied to the flow is consumed by irreversible mixing. At first glance, this value represents a mixing efficiency that is small compared to values of 0.15–0.2 that are thought to characterize the mixing owing to shear instability. However, it is important to recognise that these efficiencies measure physically different quantities. In this study we include in the energy budget the amount required to sustain the mean flow (i.e. the gravity currents), whereas a variety of measures are instead based on the proportion of energy supplied to turbulence that is consumed by mixing. Furthermore, these measures may rely on some form of averaging (e.g. in a volume, temporal or ensemble sense) or may be applicable at a specific position in the flow. Given that the turbulence in a lock-exchange gravity current is neither homogeneous nor statistically steady, we have chosen to characterize the flow by a bulk mixing efficiency measure that is unambiguous. The results highlight the importance of this consideration in a situation where the mean flow is integral to the location and characteristics of the turbulent mixing.
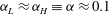
We have further shown here that the mixing associated with a gravity current only attains a self-similar asymptotic state at Reynolds numbers in excess of approximately 50 000 – well above the range typically considered in previous studies. The results suggest that the stratified turbulence is characterized by buoyancy Reynolds numbers
 $Re_{B}$
approaching 700 in this state. If the Ozmidov and Kolmogorov scales,
$Re_{B}$
approaching 700 in this state. If the Ozmidov and Kolmogorov scales,
 $$\begin{eqnarray}L_{o}=\left(\frac{\unicode[STIX]{x1D716}}{N^{3}}\right)^{1/2}\quad \text{and}\quad L_{k}=\left(\frac{\unicode[STIX]{x1D708}^{3}}{\unicode[STIX]{x1D716}}\right)^{1/4},\end{eqnarray}$$
respectively, characterize the turbulence spectrum in the lock-exchange gravity current, then the range of scales is given by
 $$\begin{eqnarray}\frac{L_{o}}{L_{k}}=\left(\frac{\unicode[STIX]{x1D716}}{\unicode[STIX]{x1D708}N^{2}}\right)^{3/4}=Re_{B}^{3/4}.\end{eqnarray}$$
Hence, our experiments span the range
 $20\lesssim L_{o}/L_{k}\lesssim 150$
, and suggest that asymptotic mixing behaviour owing to shear instability could require a separation of scales
$20\lesssim L_{o}/L_{k}\lesssim 150$
, and suggest that asymptotic mixing behaviour owing to shear instability could require a separation of scales
 $L_{o}/L_{k}\gtrsim 130$
.
$L_{o}/L_{k}\gtrsim 130$
.
Acknowledgements
We thank Philippe Odier and two anonymous reviewers for their detailed suggestions that have significantly improved this paper. We also gratefully acknowledge the skills and expertise provided by the technical staff of the G. K. Batchelor Laboratory. G.O.H. was hosted by DAMTP and supported by Australian Research Council Future Fellowship FT100100869 during part of this work. This work was supported, in part, by EPSRC Programme Grant EP/K034529/1 and by the Royal Society.


