


1. Introduction
Curved microfluidic ducts are used to separate particles/cells by size, e.g. one application being the separation of circulating tumour cells from white blood cells in a (pre-processed) blood sample (Warkiani et al. Reference Warkiani, Guan, Luan, Lee, Bhagat, Kant Chaudhuri, Tan, Lim, Lee and Chen2014). Studies on the migration and focusing of spherical particles in microfluidic ducts often assume neutrally buoyant particles and therefore neglect gravitational force (Saffman Reference Saffman1965; Ho & Leal Reference Ho and Leal1974; Schonberg & Hinch Reference Schonberg and Hinch1989; Hood, Lee & Roper Reference Hood, Lee and Roper2015; Harding, Stokes & Bertozzi Reference Harding, Stokes and Bertozzi2019). Neglect of the gravitational force is generally also assumed to be valid for particles with density close to that of the carrying fluid. However, cells are, typically, a little more dense than blood plasma and so there is a need to put this assumption to the test. Further, there is potential to apply these technologies in applications in which the particle and suspending fluid have significantly different densities.
Gravitational effects have previously been considered in the context of a spherical particle suspended in uni-directional flow between two inclined plane parallel walls (Hogg Reference Hogg1994; Asmolov Reference Asmolov1999; Asmolov, Lebedeva & Osiptsov Reference Asmolov, Lebedeva and Osiptsov2009; Asmolov & Osiptsov Reference Asmolov and Osiptsov2009; Asmolov et al. Reference Asmolov, Dubov, Nizkaya, Harting and Vinogradova2018). In these works, a common configuration is where the direction of gravity has a non-zero component in the main direction of flow (including cases in which it is aligned with the main direction of flow) (Hogg Reference Hogg1994; Asmolov Reference Asmolov1999; Asmolov et al. Reference Asmolov, Dubov, Nizkaya, Harting and Vinogradova2018). In such cases gravity modifies the slip velocity of the particle (the difference in the particle velocity in the main direction of flow compared to the velocity of the flow in its absence), which has a significant impact on the inertial lift force. Gravity can also have a direct contribution to the net force perpendicular to the walls if that component of the gravitational force is non-zero as well.
A second configuration is where the gravitational force is both parallel to the walls bounding the flow and perpendicular to main direction of flow (Asmolov & Osiptsov Reference Asmolov and Osiptsov2009; Asmolov et al. Reference Asmolov, Lebedeva and Osiptsov2009). When the appropriate Reynolds numbers are sufficiently small this effectively results in a superposition of the inertial lift forces resulting from a particle suspended in Poiseuille flow and a particle settling/falling through a stationary fluid (bounded by two walls in each case).
A third configuration is when the gravitational force aligns with the normal vector of the walls bounding the flow (Hogg Reference Hogg1994; Asmolov et al. Reference Asmolov, Dubov, Nizkaya, Harting and Vinogradova2018). In this case gravity does not modify the slip velocity of the particle. Instead, gravity adds to the inertial lift force which perturbs the particle motion normal to the walls. This last case is most relevant to our study in relation to the direction of gravity relative to the main flow and the walls. However, our duct set-up differs significantly from that of flow between two plane parallel walls making existing results unworkable.
There have been some limited experimental studies on the sorting of non-neutrally buoyant particles in curved microfluidic ducts in which the density difference of the particles relative to the fluid was less than  $20\,\%$ (Oozeki et al. Reference Oozeki, Ookawara, Ogawa, Löb and Hessel2009; Ookawara et al. Reference Ookawara, Oozeki, Ogawa, Löb and Hessel2010). These studies suggest that small variations in density have very little impact on the results. For larger density differences, interest in the application of microfluidics to mineral processing has led to studies of different device designs and focusing mechanisms than those considered herein (Priest et al. Reference Priest, Zhou, Sedev, Ralston, Aota, Mawatari and Kitamori2011; Yin, Nikoloski & Wang Reference Yin, Nikoloski and Wang2013). A better understanding of the migration of non-neutrally buoyant particles having large density differences could open up the applications of inertial microfluidics to many more applications, including mineral processing. However, to the best of our knowledge, detailed analytical/numerical studies of gravitational effects have not been carried out beyond the studies of flow bounded by two plane parallel walls similar to those described above. In the case of curved ducts, considered herein, non-neutral particle buoyancy not only adds gravitational effects, but also modifies the net effect of centripetal and centrifugal forces.
Motivated by advances in the understanding of inertial lift forces in straight square microfluidic ducts (Hood et al. Reference Hood, Lee and Roper2015) we derived a model of the leading-order forces which influence the migration of solid spherical particles in curved microfluidic ducts operating at low flow rates (Harding et al. Reference Harding, Stokes and Bertozzi2019). The model was then applied to study the specific case of neutrally buoyant particles, with several radii  $a$, suspended in flow through curved ducts, with a variety of bend radii
  $R$, having square, rectangular and trapezoidal cross-sections, each with (average) height
  $\ell$. We identified the dimensionless parameter
  $\kappa =\ell ^{4}/(4a^{3}R)$ which describes the relative scale of secondary flow drag on particles, coming from the Dean vortices that develop in flow through curved ducts, to the inertial lift force. Via a comprehensive study of the stable equilibria towards which particles migrate we also found that
  $\kappa$ approximately characterised the general focusing behaviour, particularly in the case of curved ducts having a rectangular cross-section. While the model derived therein included gravitational effects they were effectively neglected within the results since only neutrally buoyant particles were considered. The main aim of this paper is to extend those results by considering the migration of non-neutrally buoyant particles. We look specifically at the case in which gravity acts perpendicular to the plane in which the duct is curved. This means that gravity does not modify the slip velocity of the particle in the main direction of flow so that the scaling and perturbation analysis is unchanged. Additionally, in order to reduce/simplify the parameter space, we focus on the specific example of curved ducts with rectangular cross-section having an aspect ratio of two (i.e. the cross-section has width equal to twice the height).
In this work we do not consider flow effects near the inlet and outlet. Entry and exit flows for curved pipes were considered by Ault et al. (Reference Ault, Rallabandi, Shardt, Chen and Stone2017) in which they found the entry length (at which  $99\,\%$ of the fully developed fluid velocity is reached) to be approximately
  $0.0975Re$ times the pipe diameter,
  $Re$ being the pipe Reynolds number. Most curved microfluidic ducts used in practice have a bend radius which is
  $O(100)$ times the duct height such that the entry length constitutes less than
  $1/6$ of a full rotation even at a relatively high flow rate for which
  $Re=1000$. This leaves a large portion of the duct for migration to occur as predicted by our model. For more typical flow rates at which
  $Re=O(100)$ the entry length becomes an insignificant portion of a full rotation of the curved duct. Observe that changes in the flow near the exit also seem to be relatively unimportant as experimental work generally shows that particles have sufficient inertia to be carried through gently designed bifurcations at the duct exit in a predictable fashion, see for example Bhagat, Kuntaegowdanahalli & Papautsky (Reference Bhagat, Kuntaegowdanahalli and Papautsky2008).
2. Force model for non-neutrally buoyant particles
For completeness we briefly describe the model here, noting that a detailed derivation may be found in Harding et al. (Reference Harding, Stokes and Bertozzi2019).
Let  $\mathcal {D}$ denote the interior of a curved duct (in the absence of the particle). The cross-section of
  $\mathcal {D}$ is taken to be rectangular with width
  $W$ and height
  $H$. The duct is curved with a bend radius
  $R$ measured from the
  $z$ axis to the cross-section centreline (which lies in the
  $x$–
$x$– $y$ plane). A characteristic length scale for the duct is taken to be
  $\ell =\min \{W,H\}$. Although not a necessary constraint, of principal interest are cases in which
  $W\geq H$ (and thus
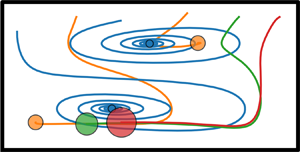
  $\ell =H$). The set-up is depicted in figure 1.

Figure 1. Curved duct with rectangular cross-section containing a spherical particle located at  $\boldsymbol {x}_{p}=\boldsymbol {x}(\theta _{p},r_{p},z_{p})$. The enlarged view of the cross-section around the particle illustrates the origin of the local
  $r,z$ coordinates at the centre of the duct. The bend radius
  $R$ is with respect to the centreline of the duct and is quite small here for illustration purposes. Gravity acts in the
  $-\boldsymbol {e}_{z}$ direction. The rotating reference frame is obtained by counter-rotating the device about the
  $z$ axis. Note that we do not consider the flow near the inlet/outlet. Adapted from Harding et al. (Reference Harding, Stokes and Bertozzi2019).
Let  $\mathcal {P}:=\{\boldsymbol {x}:|\boldsymbol {x}-\boldsymbol {x}_{p}| < a\}$ denote the volume/space occupied by a spherical particle with radius
  $a$ centred at
  $\boldsymbol {x}_{p}$ (and is such that
  $\mathcal {P}\subset \mathcal {D}$). The fluid domain in the presence of the particle is denoted
  $\mathcal {F}:=\mathcal {D}\backslash \mathcal {P}$ and is non-static as it depends on the location of the particle. The fluid is bounded by the duct walls, denoted as
  $\partial \mathcal {D}$, and the particle boundary, denoted as
  $\partial \mathcal {P}$.
Let  $p,\boldsymbol {u}$ be the pressure and velocity, respectively, of the fluid flow through the curved duct in which the spherical particle is suspended. Then,
  $p,\boldsymbol {u}$ are modelled by the Navier–Stokes equations
 \begin{gather} \boldsymbol{\nabla}\boldsymbol{\cdot}\sigma(p,\boldsymbol{u}) = \rho\left(\frac{\partial\boldsymbol{u}}{\partial t}+\boldsymbol{u}\boldsymbol{\cdot}\boldsymbol{\nabla}\boldsymbol{u}-\boldsymbol{g}\right) \quad \textrm{for}\ \boldsymbol{x}\in\mathcal{F}, \end{gather}
 \begin{gather} \boldsymbol{\nabla}\boldsymbol{\cdot}\boldsymbol{u} = 0 \quad \textrm{for}\ \boldsymbol{x}\in\mathcal{F}, \end{gather}
 \begin{gather} \boldsymbol{u} = \boldsymbol{0}\quad \textrm{for}\ \boldsymbol{x}\in\partial\mathcal{D}, \end{gather}
 \begin{gather} \boldsymbol{u} = \boldsymbol{u}_{p}+\boldsymbol{\varOmega}_{p}\times(\boldsymbol{x}-\boldsymbol{x}_{p}) \quad \textrm{for}\ \boldsymbol{x}\in\partial\mathcal{P}, \end{gather}
where
 \begin{equation} \sigma(p,\boldsymbol{u}):=-p\mathbb{I}+\mu(\boldsymbol{\nabla}\boldsymbol{u}+\boldsymbol{\nabla}\boldsymbol{u}^{\intercal}) \end{equation}
is the fluid stress tensor,  $\rho ,\mu$ denote the density and viscosity of the fluid, respectively,
  $\boldsymbol {g}:=-g\boldsymbol {k}$ is the gravitational body force and
  $\boldsymbol {u}_{p},\boldsymbol {\varOmega }_{p}$ denote the (linear) velocity of the particle and its spin (about its centre
  $\boldsymbol {x}_{p}$), respectively. Observe that for simplicity we only consider the case where gravity acts perpendicular to the plane in which the duct is curved.
Coordinates in the duct are most naturally described in a cylindrical coordinate system  $(r,\theta ,z)$, specifically
 \begin{equation} \boldsymbol{x}(r,\theta,z)=(R+r)\cos(\theta)\boldsymbol{i}+ (R+r)\sin(\theta)\boldsymbol{j}+z\boldsymbol{k}, \end{equation}
in which the particle's centre may be expressed as  $\boldsymbol {x}_{p}=\boldsymbol {x}(r_{p},\theta _{p},z_{p})$. The primary motion of the particle through the curved duct is with respect to its angular coordinate
  $\theta _{p}$. It is convenient introduce a coordinate system which is rotating about the
  $z$ axis at a rate
  $\varTheta :=\partial \theta _{p}/\partial t$ such that the angular coordinate of the particle remains fixed in this reference frame. This rotating frame of reference is described in cylindrical coordinates using primed variables
  $(r',\theta ',z')$ for which
 \begin{equation} \boldsymbol{x}'(r',\theta',z') = (R+r')\cos(\theta'+\theta_{p})\boldsymbol{i} + (R+r')\sin(\theta'+\theta_{p})\boldsymbol{j}+z'\boldsymbol{k} . \end{equation}
In this frame of reference the particle centre is located at  $\boldsymbol {x}_{p}^{\prime }=\boldsymbol {x}'(r_{p},0,z_{p})$, its (linear) velocity is
  $\boldsymbol {u}_{p}^{\prime }=\boldsymbol {u}_{p}-\varTheta (\boldsymbol {k}\times \boldsymbol {x}_{p})$ and its spin is
  $\boldsymbol {\varOmega }_{p}^{\prime }=\boldsymbol {\varOmega }_{p}-\varTheta \boldsymbol {k}$. In the rotating frame the fluid pressure and velocity are denoted
  $p',\boldsymbol {u}'$ respectively. Any remaining variables are similarly denoted with primes in this reference frame.
Rotational symmetry of the curved duct means that it is unchanged by the rotating frame, in particular  $\mathcal {D}'$ is independent of
  $t$. We assume that
  $r_{p},z_{p}$ change at a sufficiently slow rate that the flow can be reasonably well approximated by treating them as constant, in which case
  $\mathcal {P}'$ and
  $\mathcal {F}'$ can be treated as static/fixed also. Consequently, we are able to, and do, consider
  $p',\boldsymbol {u}'$ to be steady.
The fluid flow is then separated into a background flow and a disturbance flow, that is
 \begin{equation} p'=\bar{p}'+q' , \quad \boldsymbol{u}'=\bar{\boldsymbol{u}}'+\boldsymbol{v}' . \end{equation}
Here  $\bar {p}',\bar {\boldsymbol {u}}'$ denote the pressure and velocity, respectively, of the background flow; and
  $q',\boldsymbol {v}'$ denote the pressure and velocity, respectively, of the disturbance flow. The background flow describes the (steady, laminar) fluid flow through the duct in the absence of a particle, whereas the disturbance flow describes how the presence of the particle modifies/changes the background flow. Given the curved geometry of the duct the background flow is sometimes referred to as a Dean flow in the literature.
The background fluid velocity in the rotating frame is given by  $\bar {\boldsymbol {u}}'=\bar {\boldsymbol {u}}-\varTheta \boldsymbol {k}\times \boldsymbol {x}$ where
  $\bar {p},\bar {\boldsymbol {u}}$ are the background pressure and velocity, respectively, in the stationary reference frame which satisfies
 \begin{gather} \boldsymbol{\nabla}\boldsymbol{\cdot}\sigma(\bar{p},\bar{\boldsymbol{u}}) = \rho(\bar{\boldsymbol{u}}\boldsymbol{\cdot}\boldsymbol{\nabla}\bar{\boldsymbol{u}}-\boldsymbol{g}) \quad \text{for}\ \boldsymbol{x}\in\mathcal{D}, \end{gather}
 \begin{gather} \boldsymbol{\nabla}\boldsymbol{\cdot}\bar{\boldsymbol{u}} = 0 \quad \text{for}\ \boldsymbol{x}\in\mathcal{D}, \end{gather}
 \begin{gather} \bar{\boldsymbol{u}} = \boldsymbol{0}\quad \text{for}\ \boldsymbol{x}\in\partial\mathcal{D}. \end{gather}
Assuming the background flow is driven by a pressure gradient through the duct centreline it can be deduced that  $\bar {p}=-P\theta /R-gz+f(r,z)$, where
  $R$ is the bend radius at the duct centreline and
  $-gz$ is the hydrostatic pressure. Additionally, the background flow velocity
  $\bar {\boldsymbol {u}}$ is independent of
  $\theta$ can be decomposed into two distinct parts. The axial component, denoted
  $\bar {\boldsymbol {u}}_{a}$, is the primary flow component through the duct in the
  $\boldsymbol {e}_{\theta }=\partial \boldsymbol {x}/\partial \theta$ direction. The secondary flow component, denoted
  $\bar {\boldsymbol {u}}_{s}$, describes the counter-rotating vortex motion of the flow which occurs within the cross-sectional plane (orthogonal to
  $\bar {\boldsymbol {u}}_{a}$). Figure 2(a,b) depicts these two components of the background flow. Additionally, cross-section
  $(c)$ depicts the forces driving the migration of a non-neutrally buoyant particle which we ultimately aim to approximate.

Figure 2. Cross-sections of the duct depicting the components of the background flow and the forces on the particle in the curved rectangular duct.  $(a)$ The primary component of the background flow through the main axis of the duct;
  $(b)$ the secondary component of the background flow which consists of two vertically symmetric counter-rotating vortices, where the right wall is on the outside of the bend;
  $(c)$ a spherical particle and the different forces acting within the cross-sectional plane which drive its migration. Here,
  $\boldsymbol {F}_{g}$ is the gravitational component,
  $\boldsymbol {F}_{c}$ is the net centripetal/centrifugal component,
  $\boldsymbol {F}_{S}$ is the drag from the secondary component of the background flow and
  $\boldsymbol {F}_{L}$ is the inertial lift component. The magnitude and direction of each vector are for illustration only. In particular,
  $\boldsymbol {F}_{g}$ is always vertical,
  $\boldsymbol {F}_{c}$ is always radial and the directions of
  $\boldsymbol {F}_{S}$ and
  $\boldsymbol {F}_{L}$ depend on the position of the particle in the cross-section.
The disturbance flow, in the rotating frame, can be shown to satisfy
 \begin{gather} \boldsymbol{\nabla}\boldsymbol{\cdot}\sigma(q',\boldsymbol{v}') = \rho( \boldsymbol{v}'\boldsymbol{\cdot}\boldsymbol{\nabla}\bar{\boldsymbol{u}}+\varTheta\boldsymbol{k}\times\boldsymbol{v}' +(\boldsymbol{v}'+\bar{\boldsymbol{u}}-\varTheta\boldsymbol{k}\times\boldsymbol{x}')\boldsymbol{\cdot}\boldsymbol{\nabla}\boldsymbol{v}' ) \quad \text{for}\ \boldsymbol{x}'\in\mathcal{F}',\end{gather}
 \begin{gather} \boldsymbol{\nabla}\boldsymbol{\cdot}\boldsymbol{v}' = 0\quad \text{for}\ \boldsymbol{x}'\in\mathcal{F}', \end{gather}
 \begin{gather} \boldsymbol{v}' = \boldsymbol{0} \quad \text{for}\ \boldsymbol{x}'\in\partial\mathcal{D}', \end{gather}
 \begin{gather} \boldsymbol{v}' = \boldsymbol{u}_{p}^{\prime}-\bar{\boldsymbol{u}}+\varTheta\boldsymbol{k}\times\boldsymbol{x}'+\boldsymbol{\varOmega}_{p}^{\prime}\times(\boldsymbol{x}^{\prime}-\boldsymbol{x}_{p}^{\prime}) \quad \text{for}\ \boldsymbol{x}'\in\partial\mathcal{P}'.\end{gather}
Furthermore, the net force and torque on the particle, in the rotating frame, are given by
 \begin{align} \boldsymbol{F}' &= -m_{p}\varTheta^{2}\boldsymbol{k}\times(\boldsymbol{k}\times\boldsymbol{x}_{p}^{\prime}) +\rho\int_{\mathcal{P}'}\bar{\boldsymbol{u}}\boldsymbol{\cdot}\boldsymbol{\nabla}\bar{\boldsymbol{u}}\,\textrm{d}V' \nonumber\\ &\quad +(m_{f}-m_{p})g\boldsymbol{k} +\int_{\partial\mathcal{P}'}(-\boldsymbol{n})\boldsymbol{\cdot}\sigma(q',\boldsymbol{v}')\,\textrm{d}S' , \end{align}
 \begin{align} \boldsymbol{T}' &= -I_{p}\varTheta(\boldsymbol{k}\times\boldsymbol{\varOmega}_{p}^{\prime})+\rho\int_{\mathcal{P}'}(\boldsymbol{x}'-\boldsymbol{x}_{p}^{\prime})\times(\bar{\boldsymbol{u}}\boldsymbol{\cdot}\boldsymbol{\nabla}\bar{\boldsymbol{u}})\,\textrm{d}V' \nonumber\\ &\quad +\int_{\partial\mathcal{P}'}(\boldsymbol{x}'-\boldsymbol{x}_{p}^{\prime})\times((-\boldsymbol{n})\boldsymbol{\cdot}\sigma(q',\boldsymbol{v}'))\,\textrm{d}S', \end{align}
respectively, where  $m_{p}:=(4/3){\rm \pi} a^{3}\rho _{p}$ is the mass of the spherical particle (assumed to have uniform density
  $\rho _{p}$),
  $m_{f}:=(4/3){\rm \pi} a^{3}\rho$ is the mass of fluid displaced by the particle and
  $I_{p}:=(2/5)a^{2}m_{p}$ is the moment of inertia of the spherical particle.
We introduce the dimensionless parameter  $\rho _{s}:=\rho _{r}-1$ where
  $\rho _{r}:=\rho _{p}/\rho$ is the relative density of the particle compared to the surrounding fluid. It is convenient to decompose
  $\boldsymbol {F}',\boldsymbol {T}'$ into their neutrally buoyant components (i.e. corresponding to the case
  $\rho _{s}=0$) which we denote as
  $\boldsymbol {F}_{{nb}}^{\prime },\boldsymbol {T}_{{nb}}^{\prime }$, respectively, plus the remaining parts which depend on
  $\rho _{s}$. Specifically, (2.8) is reduced to
 \begin{gather} \boldsymbol{F}' = \boldsymbol{F}_{{nb}}^{\prime} - \frac{4{\rm \pi}}{3} a^{3}\rho\rho_{s} ( g\boldsymbol{k} + \varTheta^{2}\boldsymbol{k}\times(\boldsymbol{k}\times\boldsymbol{x}_{p}^{\prime}) ), \end{gather}
 \begin{gather} \boldsymbol{T}' = \boldsymbol{T}_{{nb}}^{\prime} - \frac{8{\rm \pi}}{15} a^{5}\rho\rho_{s} \varTheta(\boldsymbol{k}\times\boldsymbol{\varOmega}_{p}^{\prime}) . \end{gather}
 The problem is non-dimensionalised using the characteristic velocity scale  $U:=U_{m}(a/\ell )$, the characteristic length scale
  $a$ and by assuming viscous forces are dominant for the flow. Here,
  $U_{m}$ denotes the maximum of the axial component of the background flow
  $\bar {\boldsymbol {u}}$. The resulting force and torque scales are
  $\rho U_{m}^{2}a^{4}/\ell ^{2}$ and
  $\rho U_{m}^{2}a^{5}/\ell ^{2}$ respectively. This specific non-dimensionalisation also results in the Froude number
 \begin{equation} Fr^{2} := \frac{U^{2}}{ga} = \frac{U_{m}^{2}a}{g\ell^{2}} . \end{equation}
This leads to
 \begin{gather} \hat{\boldsymbol{F}}' = \hat{\boldsymbol{F}}_{{nb}}^{\prime} - \frac{4{\rm \pi}}{3} \rho_{s} ( Fr^{-2}\boldsymbol{k} + \hat{\varTheta}^{2}\boldsymbol{k}\times(\boldsymbol{k}\times\hat{\boldsymbol{x}}_{p}^{\prime}) ) ,\end{gather}
 \begin{gather} \hat{\boldsymbol{T}}' = \hat{\boldsymbol{T}}_{{nb}}^{\prime} - \frac{8{\rm \pi}}{15}\rho_{s}\hat{\varTheta}(\boldsymbol{k}\times\hat{\boldsymbol{\varOmega}}_{p}^{\prime}) , \end{gather}
where  $\hat {\varTheta }=\varTheta \ell /U_{m}$. The specific form of
  $\hat {\boldsymbol {F}}_{{nb}}^{\prime },\hat {\boldsymbol {T}}_{{nb}}^{\prime }$ and their perturbation expansion in terms of the particle Reynolds number
  $Re_{p}:=(\rho /\mu )U_{m}a^{2}/\ell$, are given in appendix A. The limits of our model of
  $\hat {\boldsymbol {F}}_{{nb}}^{\prime },\hat {\boldsymbol {T}}_{{nb}}^{\prime }$ are discussed in Harding et al. (Reference Harding, Stokes and Bertozzi2019). To summarise, our model is developed based on the assumption that both the particle Reynolds number
  $Re_{p}=(\rho /\mu )U_{m}a(a/\ell )$ and the Dean number
  $Dn=(\rho /\mu )U_{m}(\ell /2)\sqrt {\ell /(2R)}$ are much less than
  $1$. However, we expect the model to behave reasonably well even when one or both of these numbers approach
  $O(1)$.
For our study of the migration of non-neutrally buoyant particles considered herein we assume that  $Fr^{-2}$ is no larger than
  $O(1)$. Observe also that
  $\hat {\varTheta }$ is proportional to
  $(\ell /R)\ll 1$ (since
  $\varTheta \propto U_{m}/R$ implies
  $\hat {\varTheta }\propto \ell /R$). Consequently, the additional terms added to
  $\boldsymbol {F}_{{nb}}^{\prime },\boldsymbol {T}_{{nb}}^{\prime }$ in (2.11) can be viewed as perturbations of the force and torque on a neutrally buoyant particle. In this regime the approximation of
  $\boldsymbol {F}_{{nb}}^{\prime },\boldsymbol {T}_{{nb}}^{\prime }$ can be done in the same manner as in Harding et al. (Reference Harding, Stokes and Bertozzi2019). Specifically, we apply a perturbation expansion to the disturbance flow
  $\hat {q}',\hat {\boldsymbol {v}}'$ in terms of
  $Re_{p}$ (see appendix A). One then solves a leading-order Stokes approximation of (2.7), and in doing so determines the axial velocity of the particle (equivalently
  $\hat {\varTheta }$) and its spin (
 $\hat {\boldsymbol {\varOmega }}_{p}^{\prime }$) such that the
  $O(Re_{p}^{-1})$ components of
  $\hat {\boldsymbol {F}}_{{nb}}^{\prime },\hat {\boldsymbol {T}}_{{nb}}^{\prime }$ are zero. Subsequently, the
  $O(Re_{p}^{0})$ components of
  $\hat {\boldsymbol {F}}_{{nb}}^{\prime }$, which perturb the particle in the cross-sectional plane, are determined from the first-order correction to the Stokes approximation of (2.7) (but may be estimated indirectly via the Lorentz reciprocal theorem). The additional perturbations for a non-neutrally buoyant particle in (2.11) are then straightforward to add as an additional step at the end. Given that
  $O(Re_{p}^{0})$ components of
  $\hat {\boldsymbol {T}}_{{nb}}^{\prime }$ may be neglected, then the (small) perturbation to
  $\hat {\boldsymbol {T}}'$ for
  $\rho _{s}\neq 0$ in (2.11b) may also be neglected. For the details and a convergence analysis of the finite element method code used to solve these problems we refer the reader to Harding (Reference Harding, Lamichhane, Tran and Bunder2019).
3. Relative magnitude of gravitational and centrifugal contributions
In this section we examine the relative magnitude of the gravitational and centripetal/centrifugal forces compared to the other forces affecting particle migration. Recall that the leading-order approximation of the inertial lift force scales as  $\rho U_{m}^{2}a^{4}/\ell ^{2}$. Relative to this, the drag force from the secondary component of the background flow scales with
  $\kappa =\ell ^{4}/(4a^{3}R)$ for sufficiently small flow rates (Harding et al. Reference Harding, Stokes and Bertozzi2019). In contrast, the (dimensionless) gravitational and centripetal/centrifugal forces, which will be denoted as
  $\hat {\boldsymbol {F}}_{g},\hat {\boldsymbol {F}}_{c}$, respectively, are
 \begin{gather} \hat{\boldsymbol{F}}_{g} :=-\frac{4}{3}{\rm \pi}\rho_{s}Fr^{-2}\boldsymbol{k} \quad \Longrightarrow \quad |\hat{\boldsymbol{F}}_{g}|\propto \rho_{s}\frac{g\ell^{2}}{aU_{m}^{2}}, \end{gather}
 \begin{gather} \hat{\boldsymbol{F}}_{c}:=-\frac{4}{3}{\rm \pi}\rho_{s}\hat{\varTheta}^{2}\boldsymbol{k}\times(\boldsymbol{k}\times\hat{\boldsymbol{x}}_{p}^{\prime}) \quad \Longrightarrow\quad |\hat{\boldsymbol{F}}_{c}|\propto\rho_{s}\frac{\ell^{2}}{a R}. \end{gather}
Note that the latter is a consequence of
 \begin{equation} |\boldsymbol{k}\times(\boldsymbol{k}\times\hat{\boldsymbol{x}}_{p}^{\prime})|=\hat{r}_{p}^{\prime}=\frac{r_{p}}{a}\propto \frac{R}{a} , \end{equation}
and also
 \begin{equation} \hat{\varTheta}=\frac{\ell}{U_{m}}\varTheta=\frac{\ell}{U_{m}}\frac{\partial \theta_{p}}{\partial t}\propto \frac{\ell}{U_{m}}\frac{U_{m}}{R}=\frac{\ell}{R} . \end{equation}
 For brevity we refer to  $\hat {\boldsymbol {F}}_{c}$ as the (additional) centrifugal force in the remainder of this paper. Observe that the scale of
  $\hat {\boldsymbol {F}}_{c}$ depends on the three main length scales present in the problem, similar to
  $\kappa$, in addition to
  $\rho _{s}$. Further, its scale can be alternatively expressed as
  $\rho _{s}(a/\ell )^{2}\kappa$, and from this it is apparent that its effect is expected to be much smaller than the secondary flow drag (assuming
  $|\rho _{s}|\ll (\ell /a)^{2}$).
In contrast, the relative scale of gravitational contribution  $\hat {\boldsymbol {F}}_{g}$ does not depend on
  $R$ but instead depends on the flow velocity
  $U_{m}$ in addition to
  $\rho _{s},a,\ell$ and the constant of acceleration due to gravity
  $g$. For most practical purposes we can consider
  $g\approx 9.81\ \textrm {ms}^{-2}$ to be fixed and that changes in
  $\hat {\boldsymbol {F}}_{g}$ are due to changes in the remaining parameters. A consequence of
  $\hat {\boldsymbol {F}}_{g}\propto (U_{m})^{-2}$ is that gravity becomes much more important when the flow rate is small. This is not unexpected, since particles would have more time to settle/float compared to the timescale over which inertial focusing takes place, but is a particularly important point because our current model of the inertial lift force assumes that the flow rate is reasonably small. In other words, operating at a low flow rate means gravity may play a greater role than initially expected even if the difference in particle and fluid density are only small.
It can be helpful to consider some typical values in a microfluidic cell sorting context. The difference in cell densities and the working fluid can be up to  $10\,\%$, so
  $|\rho _{s}|\approx 0.1$ is a reasonable upper limit (noting generally the cells are slightly heavier than the fluid). Consider representative experiments (Rafeie et al. Reference Rafeie, Hosseinzadeh, Taylor and Warkiani2019) with duct height, cell radius and bend radius values of order
  $150\ \mathrm {\mu }\text {m}$,
  $5\ \mathrm {\mu }\text {m}$ and
  $1\ \text {cm}$, respectively. Assuming
  $U_{m}\approx 1\ \text {ms}^{-1}$, and that the particle velocity is close to this, one has
 \begin{gather} |\hat{\boldsymbol{F}}_{g}| =\frac{4}{3}{\rm \pi}|\rho_{s}|\frac{g\ell^{2}}{aU_{m}^{2}}\approx1.849\times10^{-2}, \end{gather}
 \begin{gather} |\hat{\boldsymbol{F}}_{c}| \lesssim \frac{4}{3}{\rm \pi}|\rho_{s}|\frac{\ell}{R+r_{p}}\frac{\ell}{a}\approx 1.885\times10^{-1}. \end{gather}
Both forces are reasonably small in this case, although  $\hat {\boldsymbol {F}}_{c}$ may be large enough to have a small influence on the stable equilibria towards which particles migrate.
Consider now what happens with particles having a different density. Suppose the particle is now either a ‘rigid bubble’ or a particle twice as dense as the suspending fluid, i.e. with  $|\rho _{s}|\approx 1$ such that the magnitude of both perturbing forces becomes
  $10$ times larger. In particular,
  $|\hat {\boldsymbol {F}}_{c}|\approx 1.885$ is now reasonably significant (while
  $|\hat {\boldsymbol {F}}_{g}|\approx 0.1849$ may have a small influence). At the extreme end, consider the effect of these forces on heavy metallic/alloy particles. Bronze, copper and nickel suspended in water have
  $\rho _{s}\approx 8$, and thus these forces are amplified by another factor
  $8$. The large centrifugal contribution will drive a significant change in particle focusing location and gravity will certainly also have some effect.
On the other hand, we can make significant changes to the gravitational contribution by changing the flow rate. Decreasing the flow rate by a factor  $10$, that is
  $U_{m}\approx 0.1\ \text {ms}^{-1}$, will increase the gravitational contribution
  $100$-fold, i.e. so even with
  $|\rho _{s}|\approx 0.1$ then
  $\hat {\boldsymbol {F}}_{g}\approx 1.849$. In contrast, increasing the flow rate by a factor
  $10$, that is
  $U_{m}\approx 10\ \text {ms}^{-1}$ will decrease the gravitational contribution
  $100$-fold making it effectively negligible even for particles made of the densest of natural elements on Earth. In a similar way, changes to the bend radius will modify
  $\hat {\boldsymbol {F}}_{c}$ (in addition to the secondary flow drag) without modifying
  $\hat {\boldsymbol {F}}_{g}$. Decreasing the bend radius to
  $R=0.1\ \text {cm}$ leads to a
  $10$-fold increase in the centrifugal force making its effects significant even when
  $|\rho _{s}|\approx 0.1$, whereas increasing it to
  $R=10\ \text {cm}$ would decrease the centrifugal force
  $10$-fold so that its effects may only be noticeable with very dense particles.
4. Effect of small perturbations on stable equilibria
Here we examine the way in which small perturbations to the force on a particle within the cross-sectional plane influence the location of stable equilibria towards which particles migrate. For this purpose it is useful to restrict our view to two-dimensional vector fields over the cross-section containing the particle centre. Given the assumptions made in § 2, the forces acting on the particle within the cross-sectional plane are independent of  $\theta _{p}$ and thus depend only on
  $r_{p},z_{p}$ when all physical parameters are fixed.
We use bold Greek letters to denote two-dimensional vectors and differentiate from three-dimensional vectors for clarity. Additionally, we change the spatial non-dimensionalisation by taking  $\ell /2$ as the characteristic length scale (since the duct dimensions in
  $\hat {\boldsymbol {x}}'$ coordinates scale with
  $\ell /a$ making it difficult to compare results for different
  $a$). Let
  $\boldsymbol {\chi }$ be the particle centre in this new scale, specifically
 \begin{equation} \boldsymbol{\chi}=(\chi_{r},\chi_{z}):=\frac{2a}{\ell}(\hat{\boldsymbol{x}}_{p}\boldsymbol{\cdot}\hat{\boldsymbol{e}}_{r}(\theta_{p}),\hat{\boldsymbol{x}}_{p}\boldsymbol{\cdot}\boldsymbol{k})=\frac{2a}{\ell}(r_{p},z_{p}), \end{equation}
where  $\hat {\boldsymbol {e}}_{r}(\theta _{p}):=\cos (\theta _{p})\boldsymbol {i}+\sin (\theta _{p})\boldsymbol {j}$. Let
  $\alpha =W/H\geq 1$ be the aspect ratio of the cross-section, then
 \begin{align} \boldsymbol{\chi}\in\left[-\alpha+\frac{2a}{\ell},\alpha-\frac{2a}{\ell}\right]\times\left[-1\!+\!\frac{2a}{\ell},1-\frac{2a}{\ell}\right] \subset[-\alpha,\alpha]\times[-1,1] ,\quad\forall\, 0 < a < \ell/2. \end{align}
Additionally, let  $\boldsymbol {\varPhi }_{{nb}}(\boldsymbol {\chi })$ denote the net force on a neutrally buoyant particle within the cross-sectional plane, specifically
 \begin{align} \boldsymbol{\varPhi}_{{nb}}(\boldsymbol{\chi}) &=(\varPhi_{{nb},r}(\chi_{r},\chi_{z}),\varPhi_{{nb},z}(\chi_{r},\chi_{z})) \nonumber\\ &:=\left(\hat{\boldsymbol{F}}_{{nb}}^{\prime}\left(\frac{\ell}{2a}\chi_{r},\frac{\ell}{2a}\chi_{z}\right)\boldsymbol{\cdot}\hat{\boldsymbol{e}}_{r}(\theta_{p}), \hat{\boldsymbol{F}}_{{nb}}^{\prime}\left(\frac{\ell}{2a}\chi_{r},\frac{\ell}{2a}\chi_{z}\right)\boldsymbol{\cdot}\boldsymbol{k}\right). \end{align}
The analogous force on a non-neutrally buoyant particle is denoted by
 \begin{equation} \boldsymbol{\varPhi}:=\boldsymbol{\varPhi}_{{nb}} + \boldsymbol{\delta} , \end{equation}
where the two components of  $\boldsymbol {\delta }=(\delta _{r},\delta _{z})$ are the centrifugal and gravitational contributions, respectively, which perturb
  $\boldsymbol {\varPhi }_{{nb}}$. From (2.11a) it can be inferred that the sign of these components satisfy
  $\textrm {sign}(\delta _{r})=\textrm {sign}(\rho _{s})$ (since
  $-\boldsymbol {k}\times (\boldsymbol {k}\times \hat {\boldsymbol {x}}_{p}^{\prime })$ points in the
  $+\hat {\boldsymbol {e}}_{r}(\theta _{p})$ direction) and
  $\textrm {sign}(\delta _{z})=-\textrm {sign}(\rho _{s})$.
Now suppose  $\boldsymbol {\chi }^{\ast }\,(\in \mathbb {R}^{2})$ is an equilibrium of
  $\boldsymbol {\varPhi }_{{nb}}$, that is
  $\boldsymbol {\varPhi }_{{nb}}(\boldsymbol {\chi }^{\ast })=(0,0)$. It follows from a first-order Taylor expansion that
  $\boldsymbol {\varPhi }(\boldsymbol {\chi })$ can be approximated in a neighbourhood of
  $\boldsymbol {\chi }^{\ast }$ via
 \begin{equation} \boldsymbol{\varPhi}(\boldsymbol{\chi}) = \boldsymbol{\delta} + \boldsymbol{\mathcal{J}}[\boldsymbol{\varPhi}_{{nb}}](\boldsymbol{\chi}^{\ast})\boldsymbol{\cdot}(\boldsymbol{\chi}-\boldsymbol{\chi}^{\ast}) + O(\|\boldsymbol{\chi}-\boldsymbol{\chi}^{\ast}\|^{2}) , \end{equation}
where  $\boldsymbol {\mathcal {J}}[\cdots ]$ denotes the Jacobian operator. Consequently, if
  $\boldsymbol {\xi }^{\ast }$ is an equilibrium of
  $\boldsymbol {\varPhi }$ (i.e.
  $\boldsymbol {\varPhi }(\boldsymbol {\xi }^{\ast })=(0,0)$) near
  $\boldsymbol {\chi }^{\ast }$ (and therefore expected to be a modification of
  $\boldsymbol {\chi }^{\ast }$ resulting from the perturbation
  $\boldsymbol {\delta }$), then
 \begin{align} \boldsymbol{\xi}^{\ast} &\approx \boldsymbol{\chi}^{\ast} - (\boldsymbol{\mathcal{J}}[\boldsymbol{\varPhi}_{{nb}}](\boldsymbol{\chi}^{\ast}))^{-1}\boldsymbol{\cdot}\boldsymbol{\delta}\nonumber\\ &= \begin{bmatrix}\chi^{\ast}_{r} \\ \chi^{\ast}_{z}\notag\\\end{bmatrix} - \begin{bmatrix}\dfrac{\partial \varPhi_{{nb},r}}{\partial \chi_{r}}(\boldsymbol{\chi}^{\ast}) & \dfrac{\partial \varPhi_{{nb},r}}{\partial \chi_{z}}(\boldsymbol{\chi}^{\ast})\\ \dfrac{\partial \varPhi_{{nb},z}}{\partial \chi_{r}}(\boldsymbol{\chi}^{\ast}) & \dfrac{\partial \varPhi_{{nb},z}}{\partial \chi_{z}}(\boldsymbol{\chi}^{\ast})\end{bmatrix}^{-1} \begin{bmatrix}\delta_{r} \\ \delta_{z} \end{bmatrix} \nonumber\\ &=\begin{bmatrix}\chi^{\ast}_{r} \\ \chi^{\ast}_{z}\end{bmatrix} \!+\!\dfrac{\delta_{r}}{\det(\boldsymbol{\mathcal{J}}[\boldsymbol{\varPhi}_{{nb}}])(\boldsymbol{\chi}^{\ast})}\begin{bmatrix}-\dfrac{\partial \varPhi_{{nb},z}}{\partial \chi_{z}}(\boldsymbol{\chi}^{\ast}) \\ \dfrac{\partial \varPhi_{{nb},z}}{\partial \chi_{r}}(\boldsymbol{\chi}^{\ast})\end{bmatrix} \!+\! \dfrac{\delta_{z}}{\det(\boldsymbol{\mathcal{J}}[\boldsymbol{\varPhi}_{{nb}}])(\boldsymbol{\chi}^{\ast})}\begin{bmatrix}\dfrac{\partial \varPhi_{{nb},r}}{\partial \chi_{z}}(\boldsymbol{\chi}^{\ast}) \\ -\dfrac{\partial \varPhi_{{nb},r}}{\partial \chi_{r}}(\boldsymbol{\chi}^{\ast})\end{bmatrix}, \end{align}
where
 \begin{equation} \det(\boldsymbol{\mathcal{J}}[\boldsymbol{\varPhi}_{{nb}}]) = \frac{\partial \varPhi_{{nb},r}}{\partial \chi_{r}}\frac{\partial \varPhi_{{nb},z}}{\partial \chi_{z}}-\frac{\partial \varPhi_{{nb},z}}{\partial \chi_{r}}\frac{\partial \varPhi_{{nb},r}}{\partial \chi_{z}} . \end{equation}
Unsurprisingly, the sensitivity of the equilibrium  $\boldsymbol {\chi ^{\ast }}$ to perturbations depends on the partial derivatives of
  $\boldsymbol {\varPhi }_{{nb}}$ at
  $\boldsymbol {\chi ^{\ast }}$. Specifically, the overall sensitivity is inversely proportional to
  $\det (\boldsymbol {\mathcal {J}}[\boldsymbol {\varPhi }_{{nb}}])(\boldsymbol {\chi }^{\ast })$. Furthermore, notice that the sensitivity with respect to the radial perturbation
  $\delta _{r}$ depends on the gradients of the vertical component of
  $\boldsymbol {\varPhi }_{{nb}}$. Similarly, the sensitivity with respect to the vertical perturbation
  $\delta _{z}$ depends on the gradients of the radial component of
  $\boldsymbol {\varPhi }_{{nb}}$. While straightforward, this approximation is helpful to explain some of the behaviour observed in § 5 which may at first seem counter-intuitive.
5. Results
5.1. Modification of focusing location for moderate to large Froude numbers
Figures 3, 5 and 6 show the location of the stable focusing equilibria, each for a different particle size, over a range of different relative densities and Froude numbers. Each figure contains three different views of the four-dimensional data. Figures 3(a,c), 5(a,c) and 6(a,c) show the location of the stable equilibria, i.e.  $\xi _{z}^{\ast }$ versus
  $\xi _{r}^{\ast }$, where each pair depicts the equilibria in the upper and lower halves of the duct. Figures 3(b,d), 5(b,d) and 6(b,d) show the vertical location
  $\xi _{z}^{\ast }$ versus the relative density difference
  $\rho _{s}$ and each pair similarly depicts equilibria in the upper and lower halves of the duct. Figures 3(e), 5(e) and 6(e) show the relative density difference
  $\rho _{s}$ versus the horizontal/radial location
  $\xi _{r}^{\ast }$. Observe that the orientation of the
  $\xi _{r}^{\ast }$ and
  $\xi _{z}^{\ast }$ axes in the latter plots are made to be consistent with the first plot. In each plot the stable equilibria in the upper and lower halves of the duct are further differentiated by
  $\boldsymbol {\times }$ and
  $\boldsymbol {+}$ markers, respectively. Additionally, the neutrally buoyant case (
 $\rho _{s}=0$) is highlighted by the intersection of the horizontal and vertical grey lines on each plot. In this case the stable equilibria, which always occur in a symmetric pair for the examples considered herein, are unaffected by changes in Froude number and give results consistent with those in Harding et al. (Reference Harding, Stokes and Bertozzi2019). Changes in focusing location will be discussed relative to these points. The limiting case
  $Fr^{2}\rightarrow \infty$ shows what happens when the effect of gravity is negligible independent of
  $\rho _{s}$. This effectively demonstrates how the centrifugal force influences the equilibria in isolation.

Figure 3. Modified focusing location  $\boldsymbol {\xi }^{\ast }=(\xi ^{\ast }_{r},\xi ^{\ast }_{z})$ for particles with radius
  $a=0.05$ and relative density difference
  $\rho _{s}$ when suspended in flow through a curved rectangular duct having width
  $4$, height
  $2$ and bend radius
  $160$ at a variety of Froude numbers
  $Fr^{2}$. The
  $\boldsymbol {\times },\boldsymbol {+}$ markers differentiate the equilibria in the upper and lower halves of the cross-section respectively. The intersection of grey lines indicates the neutrally buoyant case, i.e.
  $\boldsymbol {\chi }^{\ast }_{\pm }$.
We start by discussing figure 3 in detail. Figure 3(a,c) shows the equilibria locations for a particle with radius  $2a/\ell =0.05$ over
  $\rho _{s}=-1,-0.5,0,0.5,\ldots ,8$ and all of the
  $Fr^{2}$ shown in the legend. In order to elucidate the general trends here we first discuss how
  $\rho _{s}$ and
  $Fr^{2}$ modify the horizontal location by examining the bottom plot which shows
  $\rho _{s}$ versus
  $\xi _{r}^{\ast }$ over all of the
  $Fr^{2}$. Recall that in the case
  $Fr^{2}\rightarrow \infty$ any changes in focusing location are driven only by the relative centrifugal force. With increasing relative density
  $\rho _{s}$ both equilibria shift very slightly toward the outside wall (and toward the inside wall with decreasing
  $\rho _{s}$). Observe that both the upper and lower equilibria are affected in the same way. In contrast, for finite Froude numbers we observe that the horizontal location of the stable equilibria in the upper and lower halves diverge showing the breaks in symmetry of the equilibria pair. For the equilibrium in the upper half, decreasing
  $Fr^{2}$ (i.e. increasing effect of gravity) causes a shift toward the outer wall for
  $\rho _{s}>0$ (and toward the inside wall for
  $\rho _{s}<0$). The opposite occurs for the lower equilibrium which, for decreasing
  $Fr^{2}$, shifts toward the inside wall for
  $\rho _{s}>0$ (and toward the outside wall for
  $\rho _{s}<0$). Each of these trends are approximately linear with respect to
  $\rho _{s}$. The total range of motion is a little over
  $10\,\%$ of the duct width over the
  $Fr^{2}$ and
  $\rho _{s}$ considered.
Next we discuss the effect of  $\rho _{s}$ and
  $Fr^{2}$ on the vertical location of the equilibria in figure 3 by examining the right plot pair which show
  $\xi _{z}^{\ast }$ versus
  $\rho _{s}$. There is a clear, and approximately linear, anti-symmetric trend for the equilibria to move away from the centre (vertically) for increasing
  $\rho _{s}$ (and conversely for decreasing
  $\rho _{s}$), although the range of motion is relatively small (roughly
  $2\,\%$ of the duct height). Consequently, for the case
  $Fr^{2}\rightarrow \infty$, in which the shift in horizontal location of the equilibria pair is the same, the overall symmetry of the pair is maintained. Interestingly, and somewhat counter-intuitively at first glance, the Froude number has no appreciable effect on the vertical location of the stable equilibria (the
  $Fr^{2}=10$ markers lie over the others).
To understand why the equilibria behave in this manner we can examine the components of the Jacobian of  $\boldsymbol {\varPhi }_{{nb}}^{\ast }$. For a neutrally buoyant particle the two equilibria lie at approximately
  $\boldsymbol {\chi }_{\pm }^{\ast }\approx (-0.2783,\pm 0.4353)$ for which we then estimate
 \begin{equation} \boldsymbol{\mathcal{J}}[\boldsymbol{\varPhi}_{{nb}}](\boldsymbol{\chi}_{\pm}^{\ast}) \approx \begin{bmatrix} -0.5436 & {\mp}311.1 \\ {\pm}16.31 & -11.79 \end{bmatrix} , \end{equation}
and  $\det (\boldsymbol {\mathcal {J}}[\boldsymbol {\varPhi }_{{nb}}](\boldsymbol {\chi }_{\pm }^{\ast }))\approx 5081$. Consequently, from (4.6), small perturbations result in the modified equilibria
 \begin{equation} \boldsymbol{\xi}_{\pm}^{\ast} \approx \boldsymbol{\chi}_{\pm}^{\ast} + \frac{\delta_{r}}{5081}\begin{bmatrix} 11.79 \\ {\pm}16.31 \end{bmatrix} + \dfrac{\delta_{z}}{5081}\begin{bmatrix} {\mp}311.1 \\ 0.5436 \end{bmatrix} . \end{equation}
The large determinant means that the equilibria are generally not very sensitive to buoyancy. However, it is clear that they are most sensitive to the vertical component of  $\boldsymbol {\delta }$ which leads to perturbations to the horizontal (or radial) component of
  $\boldsymbol {\chi }^{\ast }$. In other words, the equilibria are most sensitive to the addition of the gravitational term
  $\hat {\boldsymbol {F}}_{g}$ which primarily leads to a modification of
  $\chi _{r}^{\ast }$. The reasonably large value of
  $\partial \varPhi _{{nb},r}/\partial \chi _{z}\approx 311.1$ in relation to the others is a consequence of the force on the particle being dominated by the secondary flow drag (since
  $\kappa =200$ is reasonably large) and
  $\boldsymbol {\chi }_{\pm }^{\ast }$ being relatively close to the centre of the secondary/Dean flow vortices (where
  $|\partial (\hat {\boldsymbol {e}}_{r}\boldsymbol {\cdot }\bar {\boldsymbol {u}}_{s})/\partial z|$ is largest). Lastly, observe that changes to the vertical location of equilibria are dominated by the horizontal component of
  $\boldsymbol {\delta }$, i.e. the most significant driver of change to
  $\xi _{z}^{\ast }$ is the centrifugal force
  $\hat {\boldsymbol {F}}_{c}$.
The behaviour can also be understood by examining figure 4. Figures 4(a), 4(c) and 4(e) show the magnitude of the force driving particle motion in the cross-sectional plane and include the zero level contours of the horizontal and vertical components in black and white, respectively. Figures 4(b), 4(d) and 4(f) show super-imposed trajectories that have been approximated from a simple first-order model of particle motion within the cross-sectional plane. Figures 4(a) and 4(b) show the neutrally buoyant case with  $2a/\ell =0.05$,
  $\rho _{s}=0$ and
  $Fr^{2}=\infty$. These results are identical to those from Harding et al. (Reference Harding, Stokes and Bertozzi2019). In figures 4(c) and 4(d), we increase the particle density to
  $\rho _{s}=8$ while keeping
  $Fr^{2}=\infty$. This means that there is an additional contribution to the force on the particle from
  $\hat {\boldsymbol {F}}_{c}$, but none from
  $\hat {\boldsymbol {F}}_{g}$. Any change in stable equilibria due to the addition of
  $\hat {\boldsymbol {F}}_{c}$ must therefore lie on the zero level contour of the vertical component of
  $\boldsymbol {\varPhi }_{{nb}}$. Specifically, any perturbation of the stable equilibria must remain on the white contour in figure 4(a) corresponding to
  $\varPhi _{{nb},z}=0$. Further, since the perturbation
  $\delta _{r}$ (due to
  $\hat {\boldsymbol {F}}_{c}$) is positive, the black contour in
  $(a)$ will encroach on the regions with negative
  $\varPhi _{{nb},r}$ and consequently the stable equilibria must move along the white contour in the directions indicated by the red arrows. The difference in figures 4(a,b) and 4(c,d) is somewhat subtle, particularly the small movement of the equilibria, but notice the difference in maximum magnitude of the force is larger in figure 4(c) than in figure 4(a), and also the in-spiralling of particles towards the stable equilibria is a little tighter in figure 4(d) than in figure 4(b). Figures 4(e) and 4(f), the only additional change relative to the figures 4(c) and 4(d) is the addition of a non-zero
  $\hat {\boldsymbol {F}}_{g}$ by reducing the Froude number to
  $Fr^{2}=10$ (thus the
  $\varPhi _{r}=\varPhi _{{nb},r}+\delta _{r}$ is identical to that in figures 4c and 4d). As a consequence, any further change in the stable equilibria from figure 4(c) must follow the zero level contour of
  $\varPhi _{r}$ (in black) and, further, must be in the directions indicated by the red arrows (since
  $\delta _{z}<0$ and so the white contour will encroach into regions with positive
  $\varPhi _{z}$). In particular, this makes it clear why the stable equilibria do not move vertically under perturbations to the vertical component of the force in this case, i.e. because their vertical position is constrained by the zero contour of the horizontal component of the force. Figure 4( f) clearly shows the staggering in horizontal location of the equilibria pair and the in-spiralling of trajectories is a little tighter again compared to figure 4(c).

Figure 4. Force and trajectories plots which illustrate changes in equilibria for select cases from figure 3 (with particle size  $2a/\ell =0.05$):
  $(a{,}b)$
 $\rho _{s}=0$,
  $Fr^{2}=\infty$;
  $(c{,}d)$
 $\rho _{s}=8$,
  $Fr^{2}=\infty$;
  $(e{,}f)$
 $\rho _{s}=8$,
  $Fr^{2}=10$. Panels (a,c,e) show the magnitude of the cross-sectional force on the particle with zero level contours of the horizontal and vertical components in black and white, respectively. The black and white arrows indicate the sign of the horizontal and vertical locations, respectively, at that particular location (noting the sign changes whenever the respective zero contour is crossed). The red arrows in (a,c) indicate the direction the stable equilibria will move going into (c,e), respectively. Panels (b,d, f) show superimposed particle trajectories obtained using a first-order trajectory model. Green and yellow markers show the location of stable and saddle equilibria, respectively, and have size equal to that of the particle.
The set-up for figure 5 is identical to figure 3 with the exception that the particle radius has increased to  $a=0.10$ (from
  $a=0.05$). This has the following effects: (a) the magnitude of
  $\kappa$, and therefore the secondary flow drag, has decreased
  $8$-fold, (b)
  $\hat {\boldsymbol {F}}_{c}$ has decreased
  $2$-fold (for fixed
  $\rho _{s}$) and (c)
  $\hat {\boldsymbol {F}}_{g}$ has decreased
  $2$-fold (for fixed
  $\rho _{s},U_{m},g$). However, for the latter it is important to point out that, since we have provided results with the same
  $Fr^{2}$ values, increasing
  $a$ by a factor
  $2$ requires a decrease in
  $U_{m}$ by a factor
  $1/\sqrt {2}$. It is evident from figure 5(a,c) that changes to equilibria location are no longer linear in nature and cover a much larger range of the duct width and height. To understand these trends we again first look at the change in horizontal location with respect to
  $\rho _{s}$ and
  $Fr^{2}$ as shown in figure 5(e). For
  $Fr^{2}\rightarrow \infty$ the effect of the increasing
  $\rho _{s}$ (i.e. increasing centrifugal force) is to push the equilibria pair toward the outer wall, that is increasing
  $\xi _{r}^{\ast }$, and conversely for decreasing
  $\rho _{s}$. This is consistent for both equilibria and therefore does not break the symmetry of the pair. For finite and decreasing
  $Fr^{2}$ the two stable equilibria again diverge, the upper one shifting further to the right while the lower one shifts left. The range of motion is approximately
  $60\,\%$ of the duct width in this case over the
  $Fr^{2}$ and
  $\rho _{s}$ considered. Interestingly, it appears that for some
  $Fr^{2}\in [10,20]$ the effect of
  $\hat {\boldsymbol {F}}_{c}$ and
  $\hat {\boldsymbol {F}}_{g}$ on
  $\xi _{r}^{\ast }$ roughly cancel each other for the lower of the two stable equilibria.

Figure 5. Modified focusing location  $\boldsymbol {\xi }^{\ast }=(\xi ^{\ast }_{r},\xi ^{\ast }_{z})$ for particles with radius
  $a=0.10$ and relative density difference
  $\rho _{s}$ when suspended in flow through a curved rectangular duct having width
  $4$, height
  $2$ and bend radius
  $160$ at a variety of Froude numbers
  $Fr^{2}$. The
  $\boldsymbol {\times },\boldsymbol {+}$ markers differentiate the equilibria in the upper and lower halves of the cross-section respectively. The intersection of grey lines indicates the neutrally buoyant case, i.e.
  $\boldsymbol {\chi }^{\ast }_{\pm }$.
Consider now figure 5(b,d). Here, we see that changes to  $Fr^{2}$ are beginning to have some effect on
  $\xi _{z}^{\ast }$, albeit it is still somewhat smaller than the effect of changing
  $\rho _{s}$. This is a strong indication that the vertical location of the equilibria is more sensitive to
  $\hat {\boldsymbol {F}}_{c}$ than
  $\hat {\boldsymbol {F}}_{g}$. In the case
  $Fr^{2}\rightarrow \infty$ both equilibria again shift away from the centre in a symmetric manner, such that when combined with the consistent horizontal shift, the overall symmetry of the pair is maintained. For finite
  $Fr^{2}$ and sufficiently large
  $\rho _{s}$ we observe that both equilibria are pulled down slightly towards the bottom of the duct (which breaks the symmetry of the pair). Further, the bottom equilibrium appears to be affected by changes in
  $Fr^{2}$ more than the upper one. The total range of motion in the vertical position of the equilibria is approximately
  $10\,\%$ and
  $7.5\,\%$ of the duct height for the lower and upper equilibrium, respectively.
We again examine the components of the Jacobian to explain these trends. The two equilibria in the neutrally buoyant case lie at approximately  $\boldsymbol {\chi }_{\pm }^{\ast }\approx (-1.001,\pm 0.4388)$ and for these we estimate
 \begin{equation} \boldsymbol{\mathcal{J}}[\boldsymbol{\varPhi}_{{nb}}](\boldsymbol{\chi}_{\pm}^{\ast}) \approx \begin{bmatrix} 0.03309 & {\mp}22.37 \\ \pm5.036 & -9.352 \end{bmatrix} , \end{equation}
and  $\det (\boldsymbol {\mathcal {J}}[\boldsymbol {\varPhi }_{{nb}}](\boldsymbol {\chi }_{\pm }^{\ast }))\approx 112.3$. Consequently, from (4.6), we have
 \begin{equation} \boldsymbol{\xi}_{\pm}^{\ast} \approx \boldsymbol{\chi}_{\pm}^{\ast} + \frac{\delta_{r}}{112.3}\begin{bmatrix} 9.352 \\ \pm 5.036 \end{bmatrix} + \frac{\delta_{z}}{112.3}\begin{bmatrix} \mp22.37 \\ -0.03309 \end{bmatrix} . \end{equation}
The much smaller determinant makes the equilibria more sensitive to the perturbations (the coefficients of the Jacobian have also decreased, but not as much). The dominant component is again  $\partial \varPhi _{{nb},r}/\partial \chi _{z}$, which drives changes to
  $\xi _{r}^{\ast }$ proportional to
  $\hat {\boldsymbol {F}}_{g}$, but by a much smaller margin in this case. The significant decrease is largely due to the decrease in the influence of the secondary flow by a factor of
  $8$ (with
  $\kappa =25$), and additionally because the equilibria pair in the neutrally buoyant case has shifted significantly toward the inside wall (and away from the vortex centres). Changes to equilibria with respect to
  $\delta _{r}$, or
  $\hat {\boldsymbol {F}}_{c}$, are reasonably consistent with those observed for suitably small
  $|\rho _{s}|$. On the other hand, the small value of
  $\partial \varPhi _{{nb},r}/\partial \chi _{r}$ suggests that
  $\hat {\boldsymbol {F}}_{g}$ should have even less influence on the vertical location of equilibria than would appear from the figure. This is an instance where the first-order Taylor expansion about
  $\boldsymbol {\chi }^{\ast }_{\pm }$ is not enough to understand the full range of perturbations. In particular, as
  $\rho _{s}$ increases and
  $\hat {\boldsymbol {F}}_{c}$ shifts the equilibria to the right, then
  $\partial \varPhi _{{nb},r}/\partial \chi _{r}$ evaluated at
  $\boldsymbol {\xi }_{\pm }^{\ast }$ becomes more significant. For example, when
  $\rho _{s}\approx 4$ then
  $\boldsymbol {\xi }_{\pm }^{\ast }\approx (-0.7444,\pm 0.5086)$ and
  $\partial \varPhi _{{nb},r}(\boldsymbol {\xi }_{\pm }^{\ast })/\partial \chi _{r}\approx -0.9909$ which is a significant increase in magnitude. This demonstrates that the sensitivity to
  $\hat {\boldsymbol {F}}_{g}$ can sometimes depend on whether the equilibria are also significantly perturbed by
  $\hat {\boldsymbol {F}}_{c}$.
Figure 6 shows the modified focusing location for a particle with radius  $a=0.15$. The increase in
  $a$ further decreases the magnitude of
  $\kappa$ and the influence of the secondary flow drag on particle migration. Further, both
  $\hat {\boldsymbol {F}}_{c},\hat {\boldsymbol {F}}_{g}$ also become less influential given fixed
  $\rho _{s},U_{m},g$ (although we again emphasise that for fixed
  $Fr^{2}$ we require an appropriate decrease in
  $U_{m}$ to balance the larger
  $a$). Figure 6(e) shows that with
  $Fr^{2}\rightarrow \infty$ the effect of the increasing
  $\rho _{s}$ (i.e. increasing centrifugal force) is to push the equilibria pair toward the outer wall (and conversely for decreasing
  $\rho _{s}$) as per usual, albeit by a much more significant amount than observed for smaller particles. In particular this effect is strong enough to push particles well into the right half of the cross-section for
  $\rho _{s}\geq 4$. Additionally, for
  $\rho _{s}<0$, particles are migrating closer to the inside wall. Decreasing
  $Fr^{2}$ then leads to a divergence in the horizontal location of the upper and lower equilibria similar to that observed previously. Interestingly, over the range of
  $Fr^{2}$ shown, and for
  $\rho _{s}>0$, the effect of
  $\hat {\boldsymbol {F}}_{g}$ on
  $\xi _{r}^{\ast }$ is never enough to overcome the effect of
  $\hat {\boldsymbol {F}}_{c}$. Also observe that for
  $Fr^{2}=10$ and
  $\rho _{s}>4$ there is no marker for a stable equilibrium in the upper half of the duct because it has disappeared leaving only the one stable equilibrium residing in the lower half of the cross-section. This is also the case for
  $Fr^{2}=20$ and
  $\rho _{s}>6$ (some examples illustrating this at even smaller
  $Fr^{2}$ are provided in the § 5.2).

Figure 6. Modified focusing location  $\boldsymbol {\xi }^{\ast }=(\xi ^{\ast }_{r},\xi ^{\ast }_{z})$ for particles with radius
  $a=0.15$ and relative density difference
  $\rho _{s}$ when suspended in flow through a curved rectangular duct having width
  $4$, height
  $2$ and bend radius
  $160$ at a variety of Froude numbers
  $Fr^{2}$. The
  $\boldsymbol {\times },\boldsymbol {+}$ markers differentiate the equilibria in the upper and lower halves of the cross-section respectively. The intersection of grey lines indicates the neutrally buoyant case, i.e.
  $\boldsymbol {\chi }^{\ast }_{\pm }$.
Consider now the change in  $\xi _{z}^{\ast }$ with
  $\rho _{s}$ in figure 6(b,d). For
  $Fr^{2}\rightarrow \infty$ we see the usual trend of a symmetric migration away from the centre (vertically) for increasing
  $\rho _{s}$. For
  $\rho _{s}<0$ we see the usual migration towards the centre, however, this is much more significant than usual and can be attributed to the horizontal location of the particle moving into the region near the left wall where the zero contour of
  $\varPhi _{nb,z}$ in the upper and lower halves curve inwards to meet in the centre. For finite and decreasing
  $Fr^{2}$, and with
  $\rho _{s}>0$, we observe that the particle is pulled downwards compared to its location if gravity were absent. The effect of
  $\hat {\boldsymbol {F}}_{g}$ is more significant than that previously observed as is demonstrated best by the upper equilibrium in the
  $Fr^{2}=10$ case which has
  $\xi _{z}^{\ast }<\chi _{z}^{\ast }$ for
  $\rho _{s}>1$. The effect of
  $\hat {\boldsymbol {F}}_{g}$ when
  $\rho _{s}=-1$ is also quite extreme and provides a significant perturbation towards the top of the duct. In the case
  $Fr^{2}=10$ (and
  $\rho _{s}=-1$) the lower of the two equilibria disappears entirely leaving only one stable equilibrium in the upper half of the duct. The total range of each of
  $\xi _{r}^{\ast },\xi _{z}^{\ast }$ is slightly larger than that observed for
  $a=0.10$.
We again examine the components of the Jacobian to explain these trends. The two equilibria in the neutrally buoyant case lie at approximately  $\boldsymbol {\chi }_{\pm }^{\ast }\approx (-0.9935,{\pm }0.5089)$ and for these we estimate
 \begin{equation} \boldsymbol{\mathcal{J}}[\boldsymbol{\varPhi}_{{nb}}](\boldsymbol{\chi}_{\pm}^{\ast}) \approx \begin{bmatrix} -0.9676 & \mp1.017 \\ \pm1.754 & -17.99 \end{bmatrix} , \end{equation}
and  $\det (\boldsymbol {\mathcal {J}}[\boldsymbol {\varPhi }_{{nb}}](\boldsymbol {\chi }_{\pm }^{\ast }))\approx 19.19$. Consequently, from (4.6), we have
 \begin{equation} \boldsymbol{\xi}_{\pm}^{\ast} \approx \boldsymbol{\chi}_{\pm}^{\ast} + \frac{\delta_{r}}{19.19}\begin{bmatrix} 17.99 \\ \pm 1.017 \end{bmatrix} + \frac{\delta_{z}}{19.19}\begin{bmatrix} \mp1.754 \\ 0.9676 \end{bmatrix} . \end{equation}
The smaller determinant again makes the equilibria even more sensitive to the perturbations, particularly in the most dominant component which is now  $\partial \varPhi _{{nb},z}/\partial \chi _{r}$. This component drives changes to
  $\xi _{r}^{\ast }$ proportional to
  $\hat {\boldsymbol {F}}_{c}$ and its reasonably large magnitude is consistent with the observation of significant changes in
  $\xi _{r}^{\ast }$ with respect to
  $\rho _{s}$. The signs of the
  $\delta _{z}$ component of the perturbation are consistent with what we expect, although we note that the specific values are not reflective of the observed behaviour due to the large changes in
  $\xi _{r}^{\ast }$ with
  $\rho _{s}$. In particular, the effect of
  $\hat {\boldsymbol {F}}_{g}$ on
  $\xi _{r}^{\ast }$ relative to
  $\xi _{z}^{\ast }$ is generally observed to be larger than
  $1.754/0.9676\approx 1.813$.
Figure 7 shows a few samples from figure 6, analogous to figure 4. Recall that figure 4 illustrated how the location of equilibria change upon adding the centrifugal and gravitational forces to the migration force of a neutrally buoyant particle. First, adding the centrifugal force causes the equilibria to follow the zero level contour of the vertical component of the migration force. Then, adding the gravitational force causes the equilibria to follow the zero level contour of the horizontal component of the migration force. Similar observations can be made in figure 7 through this sequence, first with the neutrally buoyant case in (a,b), then  $\rho _{s}=2.5$ and
  $Fr^{2}=\infty$ in (c,d) and lastly
  $\rho _{s}=2.5$ and
  $Fr^{2}=10$ in (e, f). The red arrows in figures 7(a) and 7(c) illustrate the contours that the (stable) equilibria follow going into figures 7(c) and 7(e), respectively. However, notice that the significantly different zero level contours in figure 7(a) compared to figure 4(a) result in a radically different perturbation of the stable equilibria upon adding first
  $\hat {\boldsymbol {F}}_{c}$ and then
  $\hat {\boldsymbol {F}}_{g}$. Also observe that in figure 7(e) if we were to increase
  $\rho _{s}$ much more then the closed white contour in the upper half will shrink further and no longer intersect the black contour such that the upper of the two stable equilibria disappears (along with the nearby saddle equilibrium).

Figure 7. Force and trajectories plots which illustrate changes in equilibria for select cases from figure 6 (with particle size  $2a/\ell =0.15$):
  $(a{,}b)$
 $\rho _{s}=0$,
  $Fr^{2}=\infty$;
  $(c{,}d)$
 $\rho _{s}=2.5$,
  $Fr^{2}=\infty$;
  $(e{,}f)$
 $\rho _{s}=2.5$,
  $Fr^{2}=10$. Panels (a,c,e) show the magnitude of the cross-sectional force on the particle with zero level contours of the horizontal and vertical components in black and white, respectively. The black and white arrows indicate the sign of the horizontal and vertical locations, respectively, at that particular location (noting the sign changes whenever the respective zero contour is crossed). The red arrows in (a,c) indicate the direction the stable equilibria will move going into (c,e), respectively. Panels (b,d, f) show superimposed particle trajectories obtained using a first-order trajectory model. Green and yellow markers show the location of stable and saddle equilibria, respectively, and have size equal to that of the particle.
Additional results for the case  $a=0.20$ were found to follow qualitatively similar trends to that of
  $a=0.15$. For completeness these results are provided in appendix B.
Our results generally suggest that small density differences between the particle and the surrounding fluid do not result in significantly different behaviour when  $Fr^{2}\gg 1$. This is consistent with the results of Ookawara et al. (Reference Ookawara, Oozeki, Ogawa, Löb and Hessel2010) who conducted experiments with particles suspended in flow through a half-turn curved rectangular duct. They used three different density fluids which differed from the density of the particle by no more than
  ${\pm }12\,\%$ and observed similar results in each case.
5.2. Significant changes in focusing when  $Fr^{2}=O(1)$

Here we describe some of the significant changes in particle focusing that occur when  $Fr^{2}=O(1)$, specifically using
  $Fr^{2}=1$ as an illustrative example. In figures 8–10 we show estimated particle trajectories for
  $\rho _{s}\in \{-1,0,1,3\}$ with a fixed bend radius of
  $2R/\ell =160$. In each of these cases the effect of gravity is quite large leading to significantly different behaviour from that discussed in the preceding section where
  $Fr^{2}\geq 10$.

Figure 8. Estimated particle trajectories for  $\rho _{s}=-1,0,1,3$ (a,b,c,d) with
  $2R/\ell =160$ and
  $Fr^{2}=1$ for a particle with radius
  $2a/\ell =0.05$. Green and yellow markers show the stable and saddle equilibria, respectively, with size matching that of the particle.

Figure 9. Estimated particle trajectories for  $\rho _{s}=-1,0,1,3$ (a,b,c,d) with
  $2R/\ell =160$ and
  $Fr^{2}=1$ for a particle with radius
  $2a/\ell =0.10$. Green and yellow markers show the stable and saddle equilibria, respectively, with size matching that of the particle.

Figure 10. Estimated particle trajectories for  $\rho _{s}=-1,0,1,3$ (a,b,c,d) with
  $2R/\ell =160$ and
  $Fr^{2}=1$ for a particle with radius
  $2a/\ell =0.15$. Green and yellow markers show the stable and saddle equilibria, respectively, with size matching that of the particle.
In figure 8 we consider a particle with size  $2a/\ell =0.05$ for which the secondary flow drag is the dominant force within the cross-section, as is evident since the trajectories no longer spiral around the Dean vortex centres. The most obvious effect of non-neutral particle buoyancy is a significant difference in horizontal location of the upper and lower stable equilibria which, from earlier discussion, can be attributed to the addition of the gravitational force. Because the effect of the centrifugal force is relatively small it can be seen that the results for
  $\rho _{s}={\pm }1$ are quite similar up to a vertical reflection. Observe that for
  $\rho _{s}=-1$ there are some trajectories that begin in the lower half of the cross-section but end up migrating towards the upper equilibrium as a result of buoyancy, and vice versa for
  $\rho _{s}=1$. Further increasing the particle density to
  $\rho _{s}=3$ leads to an even larger divergence in the horizontal location of the two stable equilibria. Additionally, the number of trajectories that migrate towards the lower stable equilibrium becomes much more than those migrating to the upper stable equilibrium.
Observe that the inertial lift force on the particle gets stronger as the particle nears the bottom wall and this acts as a re-suspension mechanism to elevate the particle a little from the bottom wall. This is also observed in much simpler studies of the combined effects of gravity and inertial lift force on a spherical particle suspended in flow between two plane parallel walls (Asmolov et al. Reference Asmolov, Dubov, Nizkaya, Harting and Vinogradova2018). Further, although to a lesser extent, the secondary component of the background flows acts to pull the particle up from the bottom wall in the half of the duct adjacent to the inside wall (relative to the centre of the duct bend). Analogous observations can be made for a buoyant particle. A very heavy particle (e.g. with much larger  $\rho _{s}$) would eventually overcome both of these re-suspension mechanisms and simply roll along the bottom wall as it makes its way around the curved duct. However, we note that our computations involve an extrapolation near the walls and such extreme cases may require more careful treatment.
In figure 9 we consider a particle with size  $2a/\ell =0.10$. The relative effect of the secondary flow drag is smaller in this case which is evident in the trajectories no longer spiralling around the Dean vortex centres. For
  $\rho _{s}={\pm }1$ we again observe similar results up to vertical reflection which again indicates a relatively small effect from centrifugal force. Further, the reduced effect of the secondary flow drag has increased the relative effect of the gravitational force as is evident by the majority of particle trajectories going towards the upper equilibrium for
  $\rho _{s}=-1$ (figure 9a) and lower equilibrium for
  $\rho _{s}=1$ (figure 9c). For an even denser particle with
  $\rho _{s}=3$ (figure 9d) the upper equilibrium disappears entirely leaving only one stable equilibrium at the bottom near the inside wall, towards which particles migrate from any initial position. Observe that this is situated slightly above where the particle would be touching the bottom wall as a consequence of the relatively strong wall effect. Further increasing
  $\rho _{s}$ (or decreasing
  $Fr^{2}$) would soon result in the stable equilibrium making contact with the wall.
Figure 10 shows analogous results for a particle with size  $2a/\ell =0.15$. For each of
  $\rho _{s}=-1,1,3$, the gravitational force dominates the vertical component of the force on the particle which results in only one stable equilibrium. For
  $\rho _{s}=-1$ this is located near (but not touching) the top wall of the duct, whereas for
  $\rho _{s}=1,3$ this is located near (but not touching) the bottom wall of the duct. Additionally, the stable equilibrium is approximately
  $1/4$ of the width of the duct away from the inside wall in each case, excepting
  $\rho _{s}=3$, where it is a little closer towards the centre (and also almost touching the bottom wall). Results for
  $2a/\ell =0.20$ were found to be qualitatively similar in the non-neutrally buoyant cases and are provided in appendix B for completeness.
5.3. Particle separation by size at different bend radii
In this section we study how the focusing of non-neutrally buoyant particles changes depending on the bend radius of the duct. In order to make a fair comparison for different particle sizes it is necessary to treat  $Fr^{2}$ a little differently. Recall that in the context of the dimensionless scaling used to estimate the inertial lift force we defined
  $Fr^{2}:=U_{m}^{2}a/(g\ell ^{2})$ (see (2.10)). If one wishes to examine focusing behaviour for different particle sizes with fixed
  $U_{m},\ell ,g$ then each particle size will have a different
  $Fr^{2}$. To simplify the discussion we introduce
 \begin{equation} \widetilde{Fr}^{2}:=\frac{U_{m}^{2}}{g\ell} , \end{equation}
which could be interpreted as the ‘duct Froude number’, noting that one then has  $Fr^{2}=(a/\ell )\widetilde {Fr}^{2}$. This is useful because
  $\widetilde {Fr}^{2}$ does not depend on the particle size and is therefore more useful when comparing focusing behaviour of different size particles suspended in flow through a specific duct (with the same flow rate and gravitational constant).
Figure 11(a) shows variation in horizontal focusing position  $\xi _{r}^{\ast }$ when
  $\rho _{s}=-1$ and
  $\widetilde {Fr}^{2}=200$. This corresponds to the case of a ‘rigid bubble’ with a moderate flow rate (e.g.
  $U_{m}\approx 0.443\ \textrm {ms}^{-1}$ with
  $g\approx 9.81\ \textrm {ms}^{-2}$ and
  $\ell =10^{-4}\ \textrm {m}$). From earlier discussions, compared to a neutrally buoyant particle we expect the focusing location to be little closer to the inside wall, and additionally, we expect a small difference in the horizontal location of the equilibria in the upper and lower halves of the duct (although this appears to be indistinguishable in most cases). Apart from these small differences the overall trends in figure 11(a) are similar to those of a neutrally buoyant particle (Harding et al. Reference Harding, Stokes and Bertozzi2019).

Figure 11. The perturbed horizontal location of (stable) equilibria  $\xi _{r}^{\ast }$ versus
  $\epsilon ^{-1}$ when
  $\widetilde {Fr}^{2}=200$ for each
  $\rho _{s}=-1,1,4,8$ in (a,b,c,d), respectively. The red, orange, lime and blue markers in each plot correspond to
  $2a/\ell =0.05,0.10,0.15,0.20$, respectively. Additionally,
  $\times$ markers denote equilibria in the upper half of the duct and
  $+$ markers denote equilibria in the lower half.
Figure 11(b) shows the variation in horizontal focusing position  $\xi _{r}^{\ast }$ when
  $\rho _{s}=1$ and
  $\widetilde {Fr}^{2}=200$. This corresponds to the case of particles with twice the density of the surrounding fluid. Compared to a neutrally buoyant particle we expect the focusing location to be little closer towards the outside wall, and a similar divergence in the upper and lower equilibria as in figure 11(a) (albeit in the opposite direction). In fact, it is observed that the change in behaviour for the two smaller particle sizes is quite small, whereas the two larger particles are no longer located within one unit of the inside wall. The largest particle in particular now has
  $\xi _{r}^{\ast }$ which only covers a range only
  $\approx 1/8$ of the duct width over the
  $\epsilon ^{-1}$ shown, specifically remaining in a small region slightly left of centre. As a result, we can see that there is no longer a good choice of
  $\epsilon ^{-1}$ (or equivalently
  $R$) which will separate the largest particle from the others, unlike in say figure 11(a) where
  $20\leq \epsilon ^{-1}\leq 40$ provides a small amount of separation.
In figure 11(c) we consider a much larger particle density, specifically  $\rho _{s}=4$, but still with
  $\widetilde {Fr}^{2}=200$. There are two main differences in this plot compared to the previous two. First is that the centrifugal force has a much more significant effect in pushing particles towards the outside wall. The second is that the divergence of equilibria in the upper and lower halves of the duct due to the gravitational force is much more noticeable. While the former of these differences is potentially good for particle separation, by spreading particles over a larger range of the duct, the latter hinders the ability to obtain a good separation of particles because each size now focuses towards two distinct horizontal locations. That said, for small
  $\epsilon ^{-1}\lesssim 80$ there is reasonably good separation of the largest particle while for
  $\epsilon ^{-1}\gtrsim 1000$ there is reasonably good separation of the smallest particle.
Lastly, in figure 11(d) we consider the relatively extreme case of very heavy particles having  $\rho _{s}=8$ and with
  $\widetilde {Fr}^{2}=200$. This leads to some markedly different focusing behaviour and, in particular, for sufficiently large
  $\epsilon ^{-1}$ it is observed that the upper of the two equilibria disappears leaving only the lower equilibrium. It is observed that the
  $\epsilon ^{-1}$ at which this first occurs is decreasing for increasing
  $a$. When only one equilibrium is present it eliminates the potential issue caused by the usual divergence of the horizontal location of the equilibria pair due to the gravitational force. This then potentially provides another opportunity in which separation of very heavy particles in microfluidic sorters may be very effective. For example figure 11(d) shows that very good separation of the smaller particle is possible for
  $\epsilon ^{-1}\gtrsim 640$.
5.4. Particle focusing behaviour versus $\kappa$

In Harding et al. (Reference Harding, Stokes and Bertozzi2019) the parameter  $\kappa =\ell ^{4}/(4a^{3}R)$ was identified as describing the relative magnitudes of the inertial lift force and secondary flow drag. It was also observed that plotting the horizontal component of the stable equilibria pair, that is
  $(2a/\ell )\chi _{r}^{\ast }$, against
  $\kappa$ led to an approximate collapse of curves for each particle size. Figure 12 provides analogous plots of
  $\xi _{r}^{\ast }$ against
  $\kappa$ for different
  $\rho _{s}$ with fixed
  $\widetilde {Fr}^{2}=200$. Note that these plots show the same data as in figure 11 only plotted against
  $\kappa$ rather than
  $\epsilon ^{-1}$.

Figure 12. The perturbed horizontal location of (stable) equilibria  $\xi _{r}^{\ast }$ versus
  $\kappa$ when
  $\widetilde {Fr}^{2}=200$ for each
  $\rho _{s}=-1,1,4,8$ in (a,b,c,d), respectively. The red, orange, lime and blue markers in each plot correspond to
  $2a/\ell =0.05,0.10,0.15,0.20$, respectively. Additionally,
  $\times$ markers denote equilibria in the upper half of the duct and
  $+$ markers denote equilibria in the lower half.
First we examine figure 12(a) for which  $\rho _{s}=-1$. Interestingly, the approximate collapse of
  $\xi _{r}^{\ast }$ against
  $\kappa$ for the different
  $a$ appears to be reasonably consistent throughout. Compared to the results of a neutrally buoyant particle in Harding et al. (Reference Harding, Stokes and Bertozzi2019) the approximate collapse is better for larger
  $\kappa$ in this particular case, but also a little worse for smaller
  $\kappa$. One other difference is that the smaller particles no longer exhibit a third equilibrium near the centre of the inside wall for small
  $\kappa$ (recall that additional equilibria occur for small particles near the centre of both of the shorter walls in a straight rectangular duct and that in curved ducts the one near the outside wall disappears while the one near the inside wall only remains for reasonably large bend radius
  $R$ albeit having a small basin of attraction).
Figure 12(b) shows the case with  $\rho _{s}=1$. The behaviour of the two larger particles has changed significantly compared to figure 12(a) leading to a degradation in the approximate collapse was observed. However, the two smaller particles continue to behave similarly with respect to
  $\kappa$. Additionally, observe that there is still a collapse of the curves towards
  $\xi _{r}^{\ast }=0$ at both ends.
Figure 12(c) exhibits a more extreme degradation in the ability of  $\kappa$ to predict focusing behaviour for different size particles with relative density
  $\rho _{s}=4$. Interestingly, however, there appears to be some structure in the increasing value of
  $\xi _{r}^{\ast }$ with
  $a$ for fixed
  $\kappa$. Larger particles generally focus closer to the outside wall than smaller ones, owing to the centrifugal force. Additionally, for each particle size, the combined effect of gravity and the secondary flow causes the upper equilibria pair to shift towards the outside wall relative to the lower equilibria.
Lastly, figure 12(d) shows the case with extremely heavy particles for which  $\rho _{s}=8$. The divergence of equilibria is much more extreme than in figure 12(c). In particular, observe that the upper equilibrium vanishes over a large range of
  $\kappa$. Furthermore, the upper equilibrium vanishes at approximately the same value of
  $\kappa \approx 24$ for each particle size (excepting the smallest particle for which this occurs around
  $\kappa \approx 56$).
5.5. Particle separation by density at different bend radii
The plots in figure 11 explored the focusing position of particles with different size but the same relative density. Here, we consider the reverse, specifically the difference in focusing position for particles with the same size but having different relative density. Figure 13 shows the horizontal location  $\xi _{r}^{\ast }$ of stable equilibria versus
  $\epsilon ^{-1}=2R/\ell$. In figure 13(a) the particle size is fixed at
  $2a/\ell =0.05$ while the colour of the markers correspond to the different values of
  $\rho _{s}=0,2,4,6$. The remaining subplots are similar but for the different particle sizes as indicated. Plots of
  $\xi _{r}^{\ast }$ versus
  $\kappa$ are not provided in this instance since, given
  $a$ is fixed and only
  $\epsilon ^{-1}$ changes in each subplot, no new information would be provided. Recall that
  $\rho _{s}=0$ is a neutrally buoyant particle, and thus the usual stable equilibria pair are vertically symmetric in each case.

Figure 13. The perturbed horizontal location of (stable) equilibria  $\xi _{r}^{\ast }$ versus
  $\epsilon ^{-1}=2R/\ell$ for particles with size
  $2a/\ell =0.05,0.10,0.15,0.20$ in (a,b,c,d), respectively, and with
  $\widetilde {Fr}^{2}=200$. The red, orange, lime and blue markers correspond to the relative densities
  $\rho _{s}=0,2,4,6$, respectively, and additionally,
  $\times$ markers denote equilibria in the upper half of the duct and
  $+$ markers denote equilibria in the lower half. The legend in (a) applies to all four plots.
In figure 13(a), where  $2a/\ell =0.05$, we see that increasing
  $\epsilon ^{-1}$ leads to an increasing spread in the horizontal location of particles, and beyond a value of
  $80$ the location is generally getting closer to the inside wall. Equilibria in the upper half are perturbed to the right/outside of the neutrally buoyant case while those in the lower half are perturbed to the left/inside. For small
  $\epsilon ^{-1}$ the small particle focuses near the centre of the Dean vortices irrespective of
  $\rho _{s}$. The stable equilibria never enter the right half of the cross-section over this range of
  $\epsilon ^{-1}$. For very large
  $\epsilon ^{-1}$ we would expect the stable equilibria pair to eventually shift back towards the centre (for all
  $\rho _{s}$) as the effect of secondary flow and centrifugal force vanishes (and equilibria near the centre of the left and right walls will appear). In figure 13(b), where
  $2a/\ell =0.10$, we similarly observe particles of each density quite close to the location of the Dean vortex centres for
  $\epsilon ^{-1}<40$. There is an increasing spread up to
  $\epsilon ^{-1}\approx 320$ and then a decreasing spread converging near the centre. Additionally, we observe for
  $\epsilon ^{-1}>640$ the appearance of an additional equilibrium near the centre of the inside wall only for
  $\rho _{s}=0$ (which is a feature that occurs for small neutrally buoyant particles in straight ducts as discussed in Harding et al. Reference Harding, Stokes and Bertozzi2019). Again, the stable equilibria never enter the right half of the cross-section over this range of
  $\epsilon ^{-1}$. In contrast to
  $(a)$, the perturbed location of stable equilibria for each
  $\rho _{s}=2,4,6$ is to the right/outside of the neutrally buoyant case and this continues to be the case in figures 13(c) and 13(d).
In figure 13(c), where  $2a/\ell =0.15$, there is already some spread in particle location for small
  $\epsilon ^{-1}$ and this increases (for increasing
  $\epsilon ^{-1}$) and reaches a maximum at approximately
  $\epsilon ^{-1}\approx 100$ after which the spread decreases with horizontal location of stable equilibria converging towards the centre. Unlike the previous two cases (featuring smaller particles), the denser particles now have enough additional centrifugal force to focus within the right half of the duct cross-section. Lastly, in figure 13(d), there is again a significant spread in horizontal location for small
  $\epsilon ^{-1}$ which increases up to
  $\epsilon ^{-1}\approx 50$ and then begins to decrease, again converging towards the centre for large
  $\epsilon ^{-1}$. Interestingly, for
  $\epsilon ^{-1}$ between roughly
  $50$ and
  $160$ the upper equilibrium disappears for
  $\rho _{s}=6$. In this range the combined effect of gravity and centrifugal force is enough to remove this equilibrium leaving only one stable equilibrium in the lower half. Observe that for
  $\epsilon ^{-1}<160$ there is a reasonable degree of separation between the particles with density
  $\rho _{s}=0$ and
  $\rho _{s}=2$ from the others. This is also true, although by a smaller margin, in figure 13(c) for
  $\epsilon ^{-1}$ between roughly
  $60$ and
  $160$. This provides a good opportunity for separating larger sized particles by density.
6. Conclusions
Non-neutral buoyancy adds a significant degree of complexity to the problem of understanding the focusing of particles suspended in flow through curved microfluidic ducts. Generally one would expect the centrifugal force to push particles toward the outside wall, and gravitational force to pull particles downwards. However, we have demonstrated that this is not always the case, for example the additional gravitational force on the smallest particle considered in our study made negligible difference to the vertical coordinate of the stable equilibria but instead perturbed the horizontal/radial coordinate. On the other hand, the change in behaviour of large particles is more consistent (qualitatively) with intuition. A first-order perturbation analysis of the force on a particle supports these findings and can be useful for understanding the effect of small perturbations more generally. The effect of larger perturbations are not so well described by first-order perturbations and vary such that it becomes difficult to provide a general description of any value.
We also examined the case with a unit Froude number to illustrate what might happen when the gravitational effects are significant. With increasing particle radius, and increasing  $\rho _{s}$, there is an increasing divergence in the horizontal location of the upper and lower equilibria and an increasing preference for trajectories to migrate towards one over the other (e.g. for
  $\rho _{s}>0$ the preferred equilibrium is in the lower half of the duct and vice versa for
  $\rho _{s}<0$). Further, we observe that eventually the less preferred of the two equilibria disappears leaving only the one stable equilibrium (which is almost in contact with the bottom wall for
  $\rho _{s}>0$).
We then examined the effect of bend radius on the horizontal location of the stable equilibria for several  $\rho _{s}\neq 0$ and
  $Fr^{2}=200(a/\ell )$. For
  $\rho _{s}=-1$ the general behaviour is qualitatively similar to that observed for neutrally buoyant particles, and in particular, an approximate collapse of the curve of
  $\xi _{r}^{\ast }$ against
  $\kappa$ for each
  $a$ is still observed. On the other hand, for
  $\rho _{s}=1,4,8$ we see an increasing divergence of the equilibria pair, increasingly significant perturbations towards the outer wall of the duct, and an increasing breakdown of the approximate collapse of the curve of
  $\xi _{r}^{\ast }$ against
  $\kappa$ for different
  $a$ which occurs for neutrally buoyant particles.
Lastly, we examined the effect of relative particle density  $\rho _{s}$ on the horizontal location of the stable equilibria for each of our particle sizes, and again with
  $Fr^{2}=200(a/\ell )$. Here, we observed some potential to separate larger particles by density over a reasonably large range of practical bend radii.
Generally speaking, non-neutral buoyancy effects appear to hinder the ability to separate particles by size, due to both the divergence of the horizontal location of the two equilibria and also the less predictable behaviour more generally. However, there is a possibility that at the extreme end, where only one stable equilibrium remains, there may be opportunities for enhanced separation by size. A more promising possibility is the separation of equal size particles by density. We finally note that our results confirm that for  $|\rho _{s}|<1/10$, which is typical for cell sorting applications, and provided the injected solution is well mixed and flow rate is not too small, the additional gravitational and centrifugal forces have sufficiently small influence on the location of stable equilibria that they may be considered negligible.
Acknowledgements
This research is supported under Australian Research Council's Discovery Projects funding scheme (project number DP160102021 and DP200100834) and a Future Fellowship (FT160100108) to Y.M.S.. The results were computed using supercomputing resources provided by the Phoenix HPC service at the University of Adelaide.
Declaration of interests
The authors report no conflict of interest.
Appendix A. Expansion of the neutrally buoyant force and torque
Observe that the neutrally buoyant force and torque components in (2.11) are
 \begin{equation} \hat{\boldsymbol{F}}_{nb}^{\prime} = -\frac{4{\rm \pi}}{3}\hat{\varTheta}^{2}\boldsymbol{k}\times(\boldsymbol{k}\times\hat{\boldsymbol{x}}_{p}^{\prime}) +\int_{\hat{\mathcal{P}}'}\hat{\bar{\boldsymbol{u}}}\boldsymbol{\cdot}\hat{\boldsymbol{\nabla}}'\hat{\bar{\boldsymbol{u}}}\,\textrm{d}\hat{V}' +Re_{p}^{-1}\int_{\partial\hat{\mathcal{P}}'}(-\boldsymbol{n})\boldsymbol{\cdot}\hat{\sigma}'(\hat{q}',\hat{\boldsymbol{v}}')\,\textrm{d}\hat{S}' , \end{equation}
 \begin{align} \hat{\boldsymbol{T}}_{nb}^{\prime} &= -\frac{8{\rm \pi}}{15}\hat{\varTheta}(\boldsymbol{k}\times\hat{\boldsymbol{\varOmega}}_{p}^{\prime})+\int_{\hat{\mathcal{P}}'}(\hat{\boldsymbol{x}}'-\hat{\boldsymbol{x}}_{p}^{\prime})\times(\hat{\bar{\boldsymbol{u}}}\boldsymbol{\cdot}\hat{\boldsymbol{\nabla}}'\hat{\bar{\boldsymbol{u}}})\,\textrm{d}\hat{V}' \nonumber\\ &\quad +Re_{p}^{-1}\int_{\partial\hat{\mathcal{P}}'}(\hat{\boldsymbol{x}}'-\hat{\boldsymbol{x}}_{p}^{\prime})\times((-\boldsymbol{n})\boldsymbol{\cdot}\hat{\sigma}'(\hat{q}',\hat{\boldsymbol{v}}'))\,\textrm{d}\hat{S}' , \end{align}
where  $\hat {\boldsymbol {\nabla }}'$ and
  $\hat {\sigma }'$ are the gradient and fluid stress tensor with respect to the dimensionless spatial coordinates in the rotating reference frame. We apply a perturbation expansion to the disturbance flow
  $\hat {\boldsymbol {v}}',\hat {q}'$ in terms of
  $Re_{p}$, specifically
 \begin{gather} \hat{\boldsymbol{v}}' = \boldsymbol{v}_{0} + Re_{p}\boldsymbol{v}_{1} + O(Re_{p}^{2}) , \end{gather}
 \begin{gather} \hat{q}' = q_{0} + Re_{p} q_{1} + O(Re_{p}^{2}) . \end{gather}
The leading-order velocity  $\boldsymbol {v}_{0}$ satisfies the Stokes equation with the boundary conditions
 \begin{equation} \boldsymbol{v}_{0} = \hat{\boldsymbol{\varOmega}}_{p}^{\prime}\times(\hat{\boldsymbol{x}}'-\hat{\boldsymbol{x}}_{p}^{\prime})+\hat{\varTheta}(\boldsymbol{e}_{z}\times\hat{\boldsymbol{x}}') -\hat{\bar{\boldsymbol{u}}} , \end{equation}
on the particle surface  $\partial \mathcal {P}'$ and
  $\boldsymbol {v}_{0}=\boldsymbol {0}$ on all other surfaces. The first-order velocity correction
  $\boldsymbol {v}_{1}$ also satisfies the Stokes equation but with a forcing term given by the inertia from
  $\boldsymbol {v}_{0}$ and with
  $\boldsymbol {v}_{1}=\boldsymbol {0}$ on all boundaries. Substituting (A 2) into (A 1a) we find that
  $\hat {\boldsymbol {F}}_{nb}^{\prime }$ can be decomposed as
 \begin{equation} \hat{\boldsymbol{F}}_{nb}^{\prime} = Re_{p}^{-1}\boldsymbol{F}_{nb,-1} + \boldsymbol{F}_{nb,0} + O(Re_{p}) , \end{equation}
where
 \begin{gather} \boldsymbol{F}_{nb,-1} := \int_{\partial\hat{\mathcal{P}}'} (-\boldsymbol{n})\boldsymbol{\cdot}\hat{\sigma}'(q_{0},\boldsymbol{v}_{0}) \,\textrm{d}\hat{S}' , \end{gather}
 \begin{gather} \boldsymbol{F}_{nb,0} := -\frac{4{\rm \pi}}{3} \hat{\varTheta}^{2}\boldsymbol{k}\times(\boldsymbol{k}\times\hat{\boldsymbol{x}}_{p}^{\prime}) +\int_{\hat{\mathcal{P}}'} \hat{\bar{\boldsymbol{u}}}\boldsymbol{\cdot}\hat{\boldsymbol{\nabla}}'\hat{\bar{\boldsymbol{u}}} \,\textrm{d}\hat{V}' +\int_{\partial\hat{\mathcal{P}}'} (-\boldsymbol{n})\boldsymbol{\cdot}\hat{\sigma}'(q_{1},\boldsymbol{v}_{1}) \,\textrm{d}\hat{S}' . \end{gather}
An analogous expansion also applies to  $\hat {\boldsymbol {T}}_{nb}^{\prime }$, the most significant term being
 \begin{equation} \boldsymbol{T}_{nb,-1} := \int_{\partial\hat{\mathcal{P}}'}(\hat{\boldsymbol{x}}'-\hat{\boldsymbol{x}}_{p}^{\prime})\times((-\boldsymbol{n})\boldsymbol{\cdot}\hat{\sigma}'(q_{0},\boldsymbol{v}_{0}))\,\textrm{d}\hat{S}' . \end{equation}
The surface integral in (A 5b) can be calculated without explicitly solving for  $q_{1},\boldsymbol {v}_{1}$ by using a variant of the Lorentz reciprocal theorem. Each of
  $q_{0},\boldsymbol {v}_{0},\boldsymbol {F}_{nb,-1},\boldsymbol {T}_{nb,-1},\boldsymbol {F}_{nb,0}$ can also be further decomposed into parts depending on the axial and secondary components of the background flow, that is
  $\bar {\boldsymbol {u}}_{a}$ and
  $\bar {\boldsymbol {u}}_{s}$, respectively. This is necessary in order to fully separate the axial contributions to the force on the particle from those contributions that perturb its location within the cross-sectional plane. We refer the interested reader to Harding et al. (Reference Harding, Stokes and Bertozzi2019) for the complete details.
It is instructive to examine the centripetal and centrifugal components of (A 5b). By substituting  $\hat {\bar {\boldsymbol {u}}}=\hat {\bar {\boldsymbol {u}}}'+\hat {\varTheta }(\boldsymbol {k}\times \hat {\boldsymbol {x}}^{\prime })$ it can be shown that
 \begin{equation} -\frac{4{\rm \pi}}{3}\hat{\varTheta}^{2}\boldsymbol{k}\times(\boldsymbol{k}\times\hat{\boldsymbol{x}}_{p}^{\prime})+\int_{\hat{\mathcal{P}}'}\hat{\bar{\boldsymbol{u}}}\boldsymbol{\cdot}\hat{\boldsymbol{\nabla}}\hat{\bar{\boldsymbol{u}}}\,\textrm{d}\hat{V}' =\int_{\hat{\mathcal{P}}'}\hat{\bar{\boldsymbol{u}}}'\boldsymbol{\cdot}\hat{\boldsymbol{\nabla}}'\hat{\bar{\boldsymbol{u}}}'+2\hat{\varTheta}(\boldsymbol{k}\times\hat{\bar{\boldsymbol{u}}}') \,\textrm{d}\hat{V}' . \end{equation}
The right-hand side is quite small, for example, given a particle slip velocity of magnitude  $(a/\ell )U_{m}$ (in a dimensional setting), this term is proportional to
  $\ell /R$. The main takeaway is that
  $-(4{\rm \pi} /3)\hat {\varTheta }^{2}\boldsymbol {k}\times (\boldsymbol {k}\times \hat {\boldsymbol {x}}_{p}^{\prime })$ exactly cancels with the
  $\int _{\hat {\mathcal {P}}'}(\hat {\varTheta }\boldsymbol {k}\times \hat {\boldsymbol {x}}^{\prime })\boldsymbol {\cdot }\boldsymbol {\nabla }(\hat {\varTheta }\boldsymbol {k}\times \hat {\boldsymbol {x}}^{\prime })\,\textrm {d}\hat {V}'$ that appears in the integral on the left-hand side as a result of the substitution. This explains why the net centripetal and centrifugal force for a neutrally buoyant particle has no apparent effect. A similar argument can be applied to the appropriate terms in
  $\hat {\boldsymbol {T}}_{{nb}}^{\prime }$, but these terms are small regardless and ultimately neglected.
Appendix B. Modified particle focusing location for $a=0.20$

Figure 14, which shows the modified focusing location for a particle with radius  $a=0.20$, exhibits similar trends as in figure 6. Observe that the neutrally buoyant equilibria have shifted closer towards the centre in this case, in particular
  $\boldsymbol {\chi }_{\pm }^{\ast }\approx (-0.4666,{\pm }0.5128)$. A consequence of this is that the particle does not get so close to the inside wall for
  $\rho _{s}<0$ and so the large perturbation in vertical position is not observed (and both equilibria still exist for
  $\rho _{s}=-1$ and
  $Fr^{2}=10$ unlike the situation for
  $a=0.15$). The effect of gravity remains significant in this case and there are many more cases where the equilibrium in the upper half disappears, specifically for
  $Fr^{2}=10$ and
  $\rho _{s}\geq 3$, for
  $Fr^{2}=20$ and
  $\rho _{s}>4$, for
  $Fr^{2}=40$ and
  $\rho _{s}\geq 6$ and lastly for
  $Fr^{2}=80$ and
  $\rho _{s}>7$. For completeness we note that for this particle size the Jacobian gives the approximation
 \begin{equation} \boldsymbol{\xi}_{\pm}^{\ast} \approx \boldsymbol{\chi}_{\pm}^{\ast} + \frac{\delta_{r}}{27.62}\begin{bmatrix} 26.05 \\ \pm0.1554 \end{bmatrix} + \frac{\delta_{z}}{27.62}\begin{bmatrix} \mp1.089 \\ 1.054 \end{bmatrix} , \end{equation}
in which  $\partial \varPhi _{{nb},z}/\partial \chi _{r}$ remains the dominant component.

Figure 14. Modified focusing location  $\boldsymbol {\xi }^{\ast }=(\xi ^{\ast }_{r},\xi ^{\ast }_{z})$ for particles with radius
  $a=0.20$ and relative density difference
  $\rho _{s}$ when suspended in flow through a curved rectangular duct having width
  $4$, height
  $2$ and bend radius
  $160$ at a variety of Froude numbers
  $Fr^{2}$. The
  $\boldsymbol {\times },\boldsymbol {+}$ markers differentiate the equilibria in the upper and lower halves of the cross-section respectively. The intersection of grey lines indicates the neutrally buoyant case, i.e.
  $\boldsymbol {\chi }^{\ast }_{\pm }$.
Figure 15 shows the modified focusing locations when  $Fr=1$ and
  $\rho _{s}=-1,0,1,3$ for a particle with size
  $2a/\ell =0.20$. In the non-neutrally buoyant cases (
 $\rho _{s}\neq 0$) the behaviour is qualitatively similar to that of figure 10 excepting the stable equilibria are a little closer to the centre of the duct horizontally.

Figure 15. Estimated particle trajectories for  $\rho _{s}=-1,0,1,3$ (a,b,c,d) with
  $2R/\ell =160$ and
  $Fr^{2}=1$ for a particle with radius
  $2a/\ell =0.20$. Green, yellow and red markers show the stable, saddle and unstable equilibria, respectively, with size matching that of the particle.


