


1. Introduction
Trauma from intra-abdominal, pelvic and groin haemorrhage cannot be effectively stopped by applying clamping or compression. During the Korean war the surgical procedure called resuscitative endovascular balloon occlusion of the aorta (REBOA) was invented for treating battlefield injuries (Hughes Reference Hughes1954). The procedure is now well accepted for treating trauma patients who are in extremis (near death) from pelvic or lower extremity injuries, and sometimes in patients with suspected intra-abdominal bleeding. This technique involves rapidly placing a flexible catheter into the femoral artery in the groin, maneuvering it into the aorta and inflating a balloon at its tip. This stops blood flow beyond the balloon, essentially halting any bleeding, while also stopping all blood flow distal to the balloon. Usually the inflated balloon is kept in the patient before transporting him/her to the operating room. Typically the balloon is  $5\sim 10$ cm in length and usually inflated with saline water.
During the procedure arterial pressure and the balloon inflation should be maintained and the balloon position should be secured to prevent distal movement caused by cardiac pressure. The degree of movement depends on cardiac output. If the patient has low intravascular volume then the movement is weak. On the other hand the movement could be strong if the patient is receiving volume resuscitation and adrenaline which is an endogenous catecholamine with potent alpha- and beta-adrenergic stimulating properties. The alpha-adrenergic property increases systemic vascular resistance (increased blood pressure). The beta-adrenergic effect increases myocardial contractility and heart rate (increased cardiac output). Although the balloon, sheath and wire can be secured with sutures or an occlusive dressing that pin the apparatus to the patient, these need to be observed continuously to assure no downward or caudal migration. Often an assistant is needed to hold the apparatus while monitoring and communicating the mean arterial pressure, maintenance of position and maintenance of occlusion (balloon inflation); see Stannard, Eliason & Rasmussen (Reference Stannard, Eliason and Rasmussen2011).
In a recent experimental study Borger van den Burg et al. (Reference Borger van den Burg, Van Schaik, Brouwers, Wong, Rasmussen, Hamming and Hocencamp2019) tested balloon migration in an in vitro model of human circulation. Eight different balloons manufactured in USA, Japan and Russia were tested in a male porcine thoratic aorta of 30 cm length and  $20\sim 30$ mm diameter. Migration was recorded under both steady and intermittent pressure. Tests under steady pressure were made in three ranges: (I) hypotensive (70–80 mmHg), (II) normotensive (100–120 mmHg) and (III) hypertensive (160–180 mmHg). Test for each range lasted 2 min. For CookCoda, balloon migration was 0–5 mm during range I, zero movement in range II and 80 mm in range III after 90 s. Kinking of the soft catheter was observed. No balloon movement was observed under intermittent pressure of 120 mmHg. Details of the intermittent pressure were not reported.
To provide some helpful information for improved control of REBOA operations, it is desirable to have a quantitative theory on its physics. In the existing literature of fluid mechanics there are a few articles treating partially similar phenomena in different fields of applications. Greenberg (Reference Greenberg1960) first investigated the transient motion of a frictionless piston driven by sound in a fluid-filled tube. Starting from an unconstrained piston in an initially calm fluid, different pressures were applied and maintained at the two ends of the tube. The piston movement resulting from acoustic waves was analysed as a free-boundary problem. Greenberg solved only the linearized problem for infinitesimal migration by a Fourier method. The nonlinear transient problem was later solved by Miranker (Reference Miranker1961) who applied the theory of characteristics and numerical computations. In these theories wall friction is neglected. In biophysics viscous stress can be more important than fluid inertia in small blood vessels, prompting the use of the lubrication approximation by many authors. For example, Lighthill (Reference Lighthill1968) studied the motion of a pellet in compliant tube forced by steady blood flow, and countered by fluid resistance from viscous shear. He cautioned however that ‘when flow speeds are sufficiently reduced, hydrodynamical lubrication in the capillaries gets replaced by solid friction, which can support differences of pressure without the red cells moving at all.’ Fitz-Gerald (Reference Fitz-Gerald1969) extended his work to a very compliant red cell in a relatively rigid capillary. Steady creeping flow through the gap between a long cylinder and a concentric elastic tube was studied by Elbaz & Gat (Reference Elbaz and Gat2016). Wave-induced flows in elastic ureters without occlusions have been examined by Lukoudis & Roos (Reference Lukoudis and Roos1970), Fung & Yih (Reference Fung and Yih1968) and Shapiro, Jaffrin & Weinberg (Reference Shapiro, Jaffrin and Weinberg1969) for the effects of peristaltic pumping. Of interest to geology, the lubrication approximation has also been applied to lava flow down an incline (Huppert Reference Huppert1982a,Reference Huppertb), fluid-driven fracturing (Ball & Neufield Reference Ball and Neufield2018), spreading of viscous fluid injected between an elastic sheet and a rigid substrate (Hewitt, Balmforth & De Bruyn Reference Hewitt, Balmforth and De Bruyn2015), peeling of an elastic sheet over viscous fluid layer (Lister, Peng & Neufeld Reference Lister, Peng and Neufeld2014) and buoyancy-driven rise of magma in cracks of Earth's lithosphere (Lister Reference Lister1990), etc.
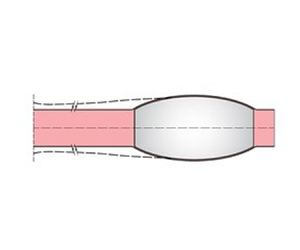
Compared with the studies cited above, REBOA flow is distinct in that the forces on the balloon are intermittent, induced by the pulsating cardiac pressure. As a consequence, the balloon response is also intermittent and affected by both fluid shear and solid friction. The geometry of the fissure between the walls of the aorta and balloon must also vary cyclically in time. In this work we consider an idealized REBOA system by assuming that the inflated balloon is positioned in zone 1 (from the left subclaven artery to the upper border of the aliac trunk) and unsupported by the catheter or the sheath; see figure 1. Our theory accounts for wave propagation driven by the pulsating pressure at the aortic valve. Blood-driven fissure between the walls of the aorta and balloon is treated by unsteady lubrication approximation. Because part of the balloon wall is pressurized tightly against the aortal wall, solid friction is included. Secure anchoring depends on the friction coefficient between the contacting walls, the dimensions, the initial distention as well as the initial position of the balloon. Distal migration due to insufficient anchoring is also predicted by solving a nonlinear free-boundary problem numerically.

Figure 1. Symbolic model of REBOA.
2. Blood flow in the aorta
2.1. Governing equations
As sketched in figure 1, a straight aorta extends from the left ventricle (aortic valve) at  $x=0$ without side branches. The balloon is modelled as a compliant tube of length
  $\ell$ with flat ends and is inflated with saline water to be tightly squeezed against the aorta. Details of the coordinate system are shown in figure 2.

Figure 2. Balloon in aorta. Solid curves: geometry under zero blood pressure. Dashed curves: after heart valve opens. Labels ( $x,r$): inertial coordinates; Labels (
 $\xi ,\eta$): coordinates moving with balloon.
Consider first an insufficiently constrained balloon. It is assumed bleeding is essentially halted after balloon inflation, and no flowing blood remains on the distal side ( $x>X(t)+\ell$). Migration from the initial position
  $X(0)$ to
  $X(t)$ can begin after the aortic valve opens at time
  $t=0$. Let the blood pressure and velocity in the aorta be denoted respectively by
  $p(x,t)$ and
  $u(x,t)$. Between the heart valve and the balloon, the aorta wall suffers small deformation to sustain wave motion. Let
  $R$ denote the inner radius of aorta and the outer radius of the balloon at both ends. Linearized law of mass conservation of blood in aorta requires
 \begin{equation} 2 {\rm \pi}i R\frac{\partial a}{\partial t}+ {\rm \pi}i R^2\frac{\partial u}{\partial x}=0, \quad 0< x< X(t), \end{equation}
where  $u$ is the area-averaged velocity and
  $a(x,t)$ is the radial distention. As discussed in Fung (Reference Fung1997), the Stokes–Wormersley number is usually large, viscosity can be ignored. The linearized law of momentum conservation in the aorta requires
 \begin{equation} \frac{\partial u}{\partial t} + \frac{1}{\rho} \frac{\partial p}{\partial x}=0,\quad 0< x< X(t). \end{equation}
In many classical models of aorta walls, the excess blood pressure in the aorta and the wall distention  $a$ are related by the linear relation
 \begin{equation} a=\alpha p, \end{equation}
where  $\alpha$ is the wall compliance known to be
 \begin{equation} \alpha=\frac{R}{{2}\rho C^2}, \end{equation}
 $\rho$ is the blood density and
  $C=5\sim 10\ \textrm {m}\ \textrm {s}^{-1}$ is the Moens–Korteweg wave speed
 \begin{equation} C^2 =\frac{Eh_a}{2\rho R}, \end{equation}
with  $E$ being the Young's modulus, and
  $h_a$ the thickness of the aorta wall. It can be estimated from Hallock & Benson (Reference Hallock and Benson1937) and Sonesson et al. (Reference Sonesson, Hansen, Stale and Länne1993) that
  $\alpha =O(10^{-7})\ \text {m}\ \text {Pa}^{-1}$ for a young male. It follows from (2.1) that
 \begin{equation} \frac{1}{\rho C^2} \frac{\partial p}{\partial t}+\frac{\partial u}{\partial x}=0, \end{equation}
and from (2.2) that
 \begin{equation} \frac{\partial^2 p}{\partial x^2}-\frac{1}{ C^2} \frac{\partial^2p}{\partial t^2}=0,\quad 0< x< X(t). \end{equation}
In a straight aorta blocked by a balloon, unbounded resonance would occur due to the forcing of persistent pressure pulses from the heart. In more recent literature, the artery wall has been modelled as a viscoelastic material (see Fung Reference Fung1997; Pedley Reference Pedley1980)). An extensive list of references can be found in Canic et al. (Reference Canic, Tambaca, Guidoboni, Mikelic, Hartlet and Rosenstrauch2006) who have treated the nonlinear fluid/structure interaction in human femoral arteries by a Kelvin–Voigt shell model. In this study we focus only on small disturbances and adopt a linear viscoelastic model of Kelvin–Voigt type for the aorta,
 \begin{equation} \alpha p= a+ \beta\frac{\partial a}{\partial t}, \end{equation}
where  $\beta$ is the Kelvin–Voigt viscosity coefficient. Equation (2.7) is now changed to
 \begin{equation} \frac{\partial^2 p}{\partial x^2} -\frac{1}{C^2} \frac{\partial^2p}{\partial t^2} +\beta\frac{\partial^3 p}{\partial x^2\partial t}=0,\quad 0< x< X(t). \end{equation}
The coefficient  $\beta$ is taken from Canic et al. (Reference Canic, Tambaca, Guidoboni, Mikelic, Hartlet and Rosenstrauch2006). In particular, if
  $h_a$ is the artery wall thickness then to the first order of approximation
 \begin{equation} p=\frac{Eh_a a}{R^2}+\frac{h_aC_v}{R^2}\frac{\partial a}{\partial t},\quad \frac{h_a}{R}\ll 1, \end{equation}
where  $C_v$ is related to the Lame constants
  $\lambda _v$ and
  $\mu _v$ by
 \begin{equation} C_v=\frac{2\lambda_v\mu_v}{\lambda_v+2\mu_v}+2\mu_v. \end{equation}
Using the experimental data of Armentano et al. (Reference Armentano, Barra, Levenson, Simon and Pinchel1995a,Reference Armentano, Magnien, Simon, Bellenfant, Barra and Levensonb) for a femoral artery, Canic et al. (Reference Canic, Tambaca, Guidoboni, Mikelic, Hartlet and Rosenstrauch2006) found that  ${h_aC_v}/{R}=1.6\times 10^3$ Pa s. By comparing with (2.10), the Kelvin–Voigt coefficient
  $\beta$ in (2.8) can be identified as
 \begin{equation} \beta=\alpha\frac{h_a C_v}{R^2}. \end{equation}
By our choice of  $\alpha =10^{-7}\, \textrm {m}\ \textrm {Pa}^{-1}$ and
  $R=1\ \textrm {cm}=10^{-2}\ \textrm {m}$,
  $\beta =1.6\times 10^{-2}\ \textrm {s}$.
At the upstream end of the inflated balloon,  $x=X(t)$, we impose the kinematic condition
 \begin{equation} u(X,t)= X_{t},\quad x=X(t). \end{equation}
The dynamic boundary condition at the heart valve is
 \begin{equation} p(0,t)=P(t),\quad x=0, \end{equation}
where  $P(t)$ is the known pressure at the ventricle. The initial conditions are assumed to be
 \begin{equation} {p=P_{diastolic},}\quad\frac{\partial p}{\partial t}=0;\quad 0< x< X(0),\ t=0. \end{equation}
2.2. Pressure at the heart valve
We also assume the cardiac pressure  $P(t)$ at the aortic valve starts at the diastolic pressure
  $P_{diastolic}$ (e.g. 80 mmHg), then varies through cycles of pulses of period
  $T$ with peaks of the systolic height
  $P_{systolic }$ (e.g. 120 mmHg), as shown in figure 3. The first peak arrives at
  $t=T_0+T/2$ after the valve opens, where
  $T_0< T/2$. Successive peaks arrive at
  $t=T_0+ \left ( k-{1}/{2} \right ) T$, with
  $k=1,2,3,\ldots$. For convenience, we introduce
 \begin{equation} \tau=t- \left( T_0+\frac{T}{2} \right) , \end{equation}
so that  $P(t)$ becomes
  $P(\tau )$ which is an infinite sequence of pulses peaked at
  $\tau =kT, k=0,1,2,3,\ldots$. Specifically the first peak in
  $-\frac {T}{2}<\tau <\frac {T}{2}$ is assumed to be
 \begin{equation} P_{diastolic}+ \left\{
\begin{array}{@{}cc}0, & -\displaystyle\dfrac{T}{2}<\tau<{-}
T_1 ;\\ p_{max}\cos \left( \displaystyle\dfrac{ {\rm \pi}i
\tau}{2 T_1} \right) , & -T_1<\tau<0;\\ p_{max}\cos \left(
\displaystyle\dfrac{ {\rm \pi}i \tau}{2 T_2} \right) , &
0<\tau< T_2;\\ 0, &
T_2<\tau<\displaystyle\dfrac{T}{2}.\end{array}\right.
\end{equation}
\begin{equation} P_{diastolic}+ \left\{
\begin{array}{@{}cc}0, & -\displaystyle\dfrac{T}{2}<\tau<{-}
T_1 ;\\ p_{max}\cos \left( \displaystyle\dfrac{ {\rm \pi}i
\tau}{2 T_1} \right) , & -T_1<\tau<0;\\ p_{max}\cos \left(
\displaystyle\dfrac{ {\rm \pi}i \tau}{2 T_2} \right) , &
0<\tau< T_2;\\ 0, &
T_2<\tau<\displaystyle\dfrac{T}{2}.\end{array}\right.
\end{equation}
Then  $P(\tau )$ can be written as a Fourier series
 \begin{equation} P(\tau)= P_{diastolic}+ P_0+\text{Re}\,\sum_{k=1}^\infty P_k\ \textrm{e}^{\textrm{i}\mu_k\tau},\quad \mu_k=\frac{2k {\rm \pi}i}{T}, \end{equation}
with
 \begin{equation}
\left. \begin{aligned} P_0 & =\frac{2
p_{max}}{T}\frac{(T_1+T_2)}{ {\rm \pi}},\\ P_k &
={\frac{2p_{max}}{T}} \left[ \frac{( {\rm \pi}/2T_1)\ \textrm{e}^{\textrm{i}\mu_k
T_1}-\textrm{i}\mu_k}{( {\rm \pi}/2T_1)^2-(\mu_k)^2}
+\frac{( {\rm \pi}/2T_2)\ \textrm{e}^{-\textrm{i}\mu_kT_2}+\textrm{i}\mu_k}{(
{\rm \pi}/2T_2)^2-(\mu_k)^2} \right] .
\end{aligned} \right\}
\end{equation}
\begin{equation}
\left. \begin{aligned} P_0 & =\frac{2
p_{max}}{T}\frac{(T_1+T_2)}{ {\rm \pi}},\\ P_k &
={\frac{2p_{max}}{T}} \left[ \frac{( {\rm \pi}/2T_1)\ \textrm{e}^{\textrm{i}\mu_k
T_1}-\textrm{i}\mu_k}{( {\rm \pi}/2T_1)^2-(\mu_k)^2}
+\frac{( {\rm \pi}/2T_2)\ \textrm{e}^{-\textrm{i}\mu_kT_2}+\textrm{i}\mu_k}{(
{\rm \pi}/2T_2)^2-(\mu_k)^2} \right] .
\end{aligned} \right\}
\end{equation}
Figure 3. Model of pressure pulses released from a ventricle for  $T_0=0$ s,
  $T_1=0.1$ s,
  $T_2=0.3$ s.
By shifting the origin of time and changing from  $\tau$ to
  $t$,
$t$,
 \begin{equation} P(t)=P_{diastolic}+\text{Re}\, \sum_{k=0}^\infty \overline P_k\textrm{e}^{\textrm{i}\mu_k t}\quad t\geq 0,\end{equation}
where
 \begin{equation} \overline P_k=P_k \textrm{e}^{- \textrm{i}\mu_k(T_0+T/2)},\quad \overline P_0=P_0. \end{equation}
 In figure 3,  $P(t)$ is shown for
  $T_0=0$ s,
  $T_1=0.1$ s,
  $T_2=0.3$ s and
  $T=1$ s to be used in later computations.
2.3. Aorta pressure in anchored balloon
In general,  $p(x,t)$ is coupled with
  $X(t)$ by (2.9) and subjected to (2.13), (2.14) and (2.15). The initial-boundary-value problem is nonlinear and will be solved later numerically together with the flow inside the gap between the walls of the aorta and balloon. To demonstrate how the viscoelastic model reduces resonance in the aorta, we solve the linear initial-boundary-value problem for
  $p$ for constant
  $X$ as sketched below.
Let us define  $p(x,t)=P(t)+W(x,t)$ so that
 \begin{gather} \frac{\partial^2 W}{\partial x^2}-\frac{1}{C^2}\frac{\partial^2W}{\partial {t}^2} +\beta\frac{\partial^3 W}{\partial x^2\partial t}=\frac{1}{C^2}\frac{\partial^2 P}{\partial t^2},\quad 0< x< X,\end{gather}
 \begin{gather} W=0,\quad x=0;\quad \frac{\partial W}{\partial x}=0,\quad x=X. \end{gather}
Since  $P(0)=P_{diastolic}$, we have
 \begin{equation} W=0,\quad\frac{\partial W}{\partial t}=0,\quad t=0,\ 0< x< X. \end{equation}
Let  $W$ be given by
 \begin{equation} W(x,t)=\sum_{n=1}^\infty T_n(t) \sin \left[ \left( n-\frac{1}{2} \right) \frac{ {\rm \pi}x}{X} \right] \end{equation}
which satisfies (2.23). The solution for  $T_n(t)$ is
 $$\begin{gather} T_n(t)=\text{Re} \sum_{k=1}^\infty E_{kn}\textrm{e}^{\textrm{i}\mu_kt}\nonumber\\ -\textrm{e}^{-\beta_nt/2}\left[ \text{Re}\,\sum_{k=1}^\infty E_{kn}\cos{\frac{t}{2}\sqrt{4\omega_n^2-\beta_n^2}}+ \text{Re}\,\sum_{k=1}^\infty E_{kn}\left(\beta_n+2i\mu_k\right)\frac{\sin{\frac{t}{2}\sqrt{4\omega_n^2-\beta_n^2}}}{\sqrt{4\omega_n^2-\beta_n^2}}\right] , \end{gather}$$
where
 \begin{equation} E_{kn}=\frac{4\mu_k^2\overline P_k}{ {\rm \pi}(2n-1)\left(i\beta_n\mu_k-\mu_k^2+ \omega_n^2\right)} \end{equation}
and
 \begin{equation} \beta_n=\beta\omega_n^2,\quad\omega_n=\frac{C {\rm \pi}}{X}\left(n-\frac{1}{2}\right), \end{equation}
with  $\omega _n$ being the eigenfrequency and
  $\beta _n$ the damping rate of the
  $n$th mode. The
  $k$-series now starts from
  $k=1$ since
  $\mu _0=0$. In (2.26) the first series represents the quasi-steady pressure, the remaining two series represent the transient pressure which decays in large time.
From (2.25),
 \begin{equation} W(X,t)=\sum_{n=1}^\infty ({-}1)^{n-1}T_n(t) \end{equation}
which depends on  $X$ through
  $\omega _n$. The pressure at
  $x=X$ is finally given by
 \begin{equation} p(X,t)=P_{diastolic}+\text{Re} \left[ \sum_{k=1}^\infty \textrm{e}^{\textrm{i}\mu_k t}{\overline P_k}+\sum_{n=1}^\infty({-}1)^{n-1}T_n(t) \right] ,\quad t>0. \end{equation}
The quasi-steady part is simply,
 \begin{equation} p(X,t)=P_{diastolic}+\text{Re}\sum_{k=1}^\infty \textrm{e}^{\textrm{i}\mu_k t} \left[ {\overline P_k}+\sum_{n=1}^\infty({-}1)^{n-1}E_{kn} \right] ,\quad \mu_1 t\gg 1. \end{equation}
 Figure 4 shows the behaviour of maximum  $p(X,t)$ according to (2.30) at the upstream end of the balloon for
  $\beta =[0.1,0.5,1,1.5,2]\times 10^{-2}\ \text {s}$. Only the three largest
  $\beta$'s are known for human aorta (Canic et al. Reference Canic, Tambaca, Guidoboni, Mikelic, Hartlet and Rosenstrauch2006), for which max
  $p(X,t)$ increases monotonically with
  $X$. For these three cases, the solution is dominated by (2.31) since the transients die out quickly. The results for very small
  $\beta =[0.1, 0.5]\times 10^{-2}$ s are also included just to show the occurrence of resonance at values of
  $X$ corresponding to the eigenfrequencies
  $\omega _1$.

Figure 4. Maximum aortic pressure at the head of balloon at different  $X$. Only
  $\beta =[1.0, 1.5, 2.0]\times 10^{-2}\ \text {s}$ are known to be representative for a human aorta.
3. Blood flow in the balloon-aorta gap
3.1. Initial distension of inflated balloon
We modify Lighthill (Reference Lighthill1968) who treated the pellet motion in an elastic vessel driven by a steady blood flow. With reference to figure 2, let  $r$ be the radial distance from the aorta axis and
  $R$ the inner radius of the undeformed aorta, and
  $\xi$ be the non-inertial coordinate moving with the balloon,
 \begin{equation} \xi=x-X\left(t\right)-\frac{\ell}{2},\quad t\geq 0. \end{equation}
Let us define
 \begin{equation} \eta=r-R \end{equation}
and let  $\eta =b(\xi )$,
  $-\ell /2\le \xi \le \ell /2$ describe the outer surface of the fully inflated balloon and
  $\eta =a(\xi ,t)$ be the distention of the aorta wall. We assume that, when the aorta is drained and
  $p=0$, the aorta wall is initially in tight contact with the balloon, i.e.
  $a=b$ for
  $-\ell /2 \le \xi \le \ell /2, t< 0$. When the incident pressure pulse arises, the aorta wall is forced by the blood pressure
  $p_g$ in the gap and
  $a(\xi , t)$ become larger than
  $b(\xi )$ and creates a gap of positive thickness.
In principle, the balloon can be slightly compressed. However, the compliance of the commercial balloon is  $O(10^{-3})$ times that of the aorta (Secco et al. Reference Secco2016). Since the saline water inside is also quite incompressible, the inflated balloon retains its shape approximately as a rigid body. The balloon distension
  $b(\xi )$ is a function of the balloon-fixed coordinate
  $\xi$ only. As a simple model to be used in later computations, we shall choose a paraboloidal balloon with truncated ends, as sketched in figure 2,
 \begin{equation} b(\xi)= {b_0} \left( 1-\frac{\xi^2(t)}{\ell^2/4} \right) ,\quad -\ell \le \xi \le \ell/2, \end{equation}
with  $b_0$ being the maximum radial distension of the balloon. Today's commercial balloons have rounded ends. But in later calculations of the total longitudinal pressure force, the difference between flat and round ends is negligible since the local pressure is essentially constant. This follows from Gauss’ theorem,
 \begin{equation} \iiint_V \boldsymbol{\nabla}\boldsymbol{\cdot}(p\,\boldsymbol{e}_x)\,\textrm{d}V=\iint_A p\,(\boldsymbol{e}_x\boldsymbol{\cdot} \boldsymbol{n}) \,\textrm{d}A=0, \end{equation}
where  $V$ and
  $A=A_1\cup A_2$ are respectively the total volume and surface of the head.
Unlike the aorta upstream of the balloon, no wave motion is expected in the thin gap. We ignore  $\beta \frac {\partial a}{\partial t}=O(\beta a/T)$ relative to
  $a$ and approximate (2.8) by
  $\alpha p_g\approx a$. The thickness of the partially open gap at any
  $t>0$ is therefore
 \begin{equation} h\left(\xi,t\right)= a- b= \alpha p_g\left(\xi,t\right)-b(\xi),\quad-\frac{\ell}{2} < \xi <\xi_*(t),\quad t\geq 0, \end{equation}
where  $\xi _*(t)$ denotes the moving tip of the gap, as marked in figure 2. In particular,
 \begin{equation} h\left(\xi,0\right)= \alpha P_{diastolic}- b(\xi),\quad-\frac{\ell}{2} < \xi <\xi_*(0),\quad t= 0, \end{equation}
in view of the initial condition (2.15). Beyond the tip, the two walls are in close contact,
 \begin{equation} h(\xi, t) = 0,\quad \xi_*<\xi<\ell/2. \end{equation}
 Because the balloon wall compliance is much smaller than  $\alpha$ (Secco et al. Reference Secco2016), the initial distention of the contacting walls can be related to the initial contact pressure
  $p_c(\xi )$ by
 \begin{equation} p_c(\xi)=\frac{a(\xi,0))}{\alpha} =\frac{b(\xi)}{\alpha}. \end{equation}
 Later ( $t>0$) when the front of the pressure pulse crosses the upstream end of the balloon, a gap must expand in
  $-\ell /2<\xi <\xi _*(t)$, since
  $p_c(\xi =-\ell /2)=0$ is always smaller than
  $p(X,t)$. In the gap
  $p_c$ is replaced by the blood pressure
 \begin{equation} p(\xi,t)=p_g(\xi,t),\quad -\ell/2<\xi<\xi_*(t). \end{equation}
Note that  $p_g(\xi _*,t)=p_c(\xi _*)={b(\xi _*)}/{\alpha }$. Clearly if
  $0< p_g< p_c(\xi =0)={b_0}/\alpha$, the gap cannot extend beyond the mid-section of the balloon (i.e.
  $\xi _*<0$). Since
  $p_c(-\ell /2,0)=0$ at the upstream end, the aorta wall will always be separated from the balloon by any finite pressure
  $p(X,t)$ after
  $t=0$. To prevent leakage, the balloon must be inflated so that
  $p_c(0)$ is greater than the maximum
  $p(X,t)$ from the incident pulses. Take
  $\alpha =10^{-7}\ \text {m}\ \text {Pa}^{-1}$, and a balloon with the maximum distention
  $b_0=2\ \text {mm}$. (We maintain the assumption of constant compliance in (3.8) for simplicity although linear elasticity may be inadequate if
  $b_0/R$ is not infinitesimal (Caro et al. Reference Caro, Pedley, Schroter and Seed2011).) Then the maximum
  $p_c(0)= {b_0}/\alpha =2\times 10^{4}\ \text {Pa} = 150\ \text {mmHg}$, when it is higher than any
  $p(X,t)$, prevents the gap from advancing to the mid-point (
 $\xi =0$) and no leakage will occur. Clearly a much less inflated balloon will not be effective to halt haemorrhage. In later numerical examples we only examine sufficiently inflated balloons of moderate distension that disallow leakage.
3.2. Lubrication approximation of blood flow in the gap
Let  $u_g'(x,\eta ,t)$ and
  $v_g'(x,\eta ,t)$ denote the horizontal and radial blood velocity in the inertial coordinate system fixed on the aorta, and
  $u_g(\xi ,\eta ,t),v_g(\xi ,\eta ,t)$ denote the corresponding velocity components in the non-inertial moving coordinates
  $(\xi =x-X(t)-\ell /2,\eta ,t)$. Since
 \begin{gather} u_g(\xi,\eta,t)=u_g'(x,\eta,t)-X_t, \end{gather}
 \begin{gather} \frac{\partial u'_g}{\partial x}=\frac{\partial u_g}{\partial \xi}\frac{\partial \xi}{\partial x}=\frac{\partial u_g}{\partial \xi},\quad \frac{\partial (u'_g,v'_g)}{\partial \eta}=\frac{\partial (u_g,v_g)}{\partial \eta}. \end{gather}
For a narrow gap  $h/\ell \ll 1$, the law of mass conservation is
 \begin{equation} \frac{\partial u'_g}{\partial x}+\frac{\partial v'_g}{\partial \eta}=0,\quad\text{i.e.}\ \frac{\partial u_g}{\partial \xi}+\frac{\partial v_g}{\partial \eta}=0,\quad \text{in}\ b(\xi)<\eta< a(\xi,t). \end{equation}
Neglecting convective inertia and invoking the lubrication approximation, momentum conservation requires
 \begin{equation} 0={-}\frac{\partial p_g}{\partial x}+\mu\frac{\partial^2u'_g}{\partial \eta^2} ,\quad \text{i.e.}\ 0={-}\frac{\partial p_g}{\partial \xi}+\mu\frac{\partial^2u_g}{\partial \eta^2}, \quad \text{in}\ b(\xi)<\eta< a(\xi,t), \end{equation}
and
 \begin{equation} -\frac{\partial p_g}{\partial \eta}=0 ,\quad \text{in}\ b(\xi)<\eta< a(\xi,t). \end{equation}
 On the non-compliant balloon wall  $\eta =b(\xi )$ we have
  $u'_g(x,b,t)=X_{t}$, hence,
 \begin{equation} u_g(\xi,b,t)=0, \quad \text{and}\quad v_g(\xi,b,t)=0. \end{equation}
 On the aorta wall,  $\eta =a(\xi ,t)$,
  $v'_g(\xi ,a,t)=0$, hence,
 \begin{gather} u_g(\xi,a,t)={-}X_t, \end{gather}
 \begin{gather} v_g(\xi,a,t)=\frac{\partial a(\xi,t)}{\partial t}=\frac{\partial a}{\partial t}+\frac{\partial\xi}{\partial t}\frac{\partial a}{\partial \xi}= \frac{\partial h}{\partial t}-X_t\frac{\partial a}{\partial \xi}. \end{gather}
 Upon integrating (3.12) from  $\eta =b$ to
  $\eta = a$, applying Leibniz rule,
 \begin{equation} \frac{\partial}{\partial \xi}\int_{b}^{a} u_g\,\textrm{d}\eta-u_g(\xi,a)\frac{\partial a}{\partial \xi}+{u_g(\xi,y_b) \frac{\partial b}{\partial \xi} }+v_g(\xi,a)-{v_g(\xi,b)}=0, \end{equation}
and then using the boundary conditions (3.16) and (3.17), we obtain
 \begin{equation} \frac{\partial}{\partial \xi}\int_{b}^{a} u_g\,\textrm{d}\eta + \frac{\partial h}{\partial t} =0.\end{equation}
Thus, the volume flux is not constant. Defining the depth-averaged velocity  $U$ by
 \begin{equation} Uh= \int_{b}^{a} u_g\,\textrm{d}\eta, \end{equation}
(3.19) becomes the depth-integrated law of mass conservation
 \begin{equation} \frac{\partial (Uh)}{\partial \xi} + \frac{\partial h}{\partial t}=0, \end{equation}
which is similar to that of one-dimensional gas dynamics, where  $h$ plays the role of gas density.
Integrating the momentum equation (3.13) twice, using (3.15) and (3.16) give the velocity profile
 \begin{equation} u_g(\xi,\eta,t)=\frac{\partial p_g}{\partial\xi}\frac{(\eta-a)(\eta-b)}{2\mu}-X_t\frac{\eta-b}{h}. \end{equation}
The depth-averaged velocity is
 \begin{equation} U ={-}\frac{h^2}{12\mu} \frac{\partial p_g}{\partial \xi}-\frac{X_t}{2}={-}\frac{h^2}{12\mu\alpha}\frac{\partial (h+b)}{\partial \xi}-\frac{X_t }{2}. \end{equation}
Substituting this into (3.21) yields
 \begin{equation} {\frac{\partial h}{\partial t}=\frac{\partial}{\partial \xi} \left\{ \frac{h^3}{12\mu\alpha} \frac{\partial \left( h+b \right) }{\partial \xi} +\frac{h}{2}X_t \right\}}, \end{equation}
which is similar to the approximate governing equation of a thin viscous layer on an incline (Huppert Reference Huppert1982a; Lister Reference Lister1992), and in a hydraulic fracture (Lister Reference Lister1990). This nonlinear diffusion equation must be solved numerically for the initial condition (3.6) in view of (2.15). The boundary conditions are
 \begin{equation} p_g=p(X,t),\quad \text{at}\ \xi ={-}\ell/2, \quad \text{and}\quad h(\xi,t)=0, \quad \xi=\ell/2,\ t>0. \end{equation}
A small gap must exist at the upstream end of the balloon at the start. Thus, at any  $t\geq 0$, the walls of the aorta and balloon are separated only in
  $-\ell /2<\xi <\xi _*(t)$ but remain in tight contact in
  $\xi _*(t)<\xi <\ell /2$.
Solution of the complete problem requires numerical computation of the aorta pressure  $p(X,t)$ at the upstream end of the balloon, the gap thickness
  $h(\xi ,t)$, the tip position
  $\xi _*(t)$ and the balloon motion
  $X_t$. Details will be given in § 6.
For later use, the dominant shear stress in the fluid is, from (3.22),
 \begin{equation} \tau_{\xi\eta}= \mu\frac{\partial u_g}{\partial \eta}=\mu\frac{\partial p_g}{\partial \xi}\frac{2y-(a+b)}{2}-\frac{\mu X_t}{h}. \end{equation}
Hence,
 \begin{equation} \left( \begin{array}{c}\tau_{\xi\eta}|_{a}\\ \tau_{\xi\eta}|_{b}\end{array} \right) ={\pm}\frac{h}{2}\frac{\partial p_g}{\partial\xi}{-\frac{\mu X_t}{h}}. \end{equation}
4. Approximate analysis for gap evolution
As a preliminary step before the solution of the complete problem involving balloon dynamics, we first analyse the mechanics of gap evolution, leaving  $X_t$ to be determined later.
Using (3.5),  $a=h+b$, we integrate (3.24) over the small neighbourhood of the gap tip
 \begin{equation} \frac{h^3}{12\mu\alpha}\frac{\partial a}{\partial \xi}+\frac{h}{2}X_t={-}\int^{\xi_*}_\xi\frac{\partial h}{\partial t}\,\textrm{d}\xi'. \end{equation}
Since  $\xi _*-\xi =O(\ell /2)$, the right-hand side is
  $O(h\ell /2\Delta T$), where
  $\Delta T=T_1+T_2= 0.4$ s. Taking
  $\mu =3.7\times 10^{-3}\ \textrm {kg}\,(\textrm {m}\ \textrm {s})^{-1}$,
  $\alpha = 10^{-7}\, \textrm {m}\ \textrm {Pa}^{-1}$,
  $\ell =40$ mm and
  $h=O(b_0)=O(2\ \text {mm})$, we get
 \begin{equation} O \left( \frac{\partial a}{\partial\xi} \right) =\frac{12\mu\alpha}{h^2}\frac{\ell}{2\Delta T} = \left( \frac{\sqrt{12\mu \alpha \ell/(2\Delta T)}}{h} \right) ^2\ll 1. \end{equation}
It follows that the aorta wall is very flat away from the small neighbourhood of the gap tip.
Matching pressures at  $\xi =-\ell /2$, we get
 \begin{equation} a(-\ell/2,t)=\alpha p_g(-\ell/2,t)=\alpha p(X,t). \end{equation}
The straight line extending the flat aorta wall intersects the balloon at  $\xi _0$ where
  $a(-\ell /2,t)=b(\xi _0)$. For the paraboloidal balloon, this gives the quadratic equation for
  $\xi _0$,
 \begin{equation} b(\xi_0) = b_0 \left( 1-\frac{\xi_0^2}{\ell^2/4} \right) = a(-\ell/2, t) = \alpha p(X,t). \end{equation}
Recall that  $p(X,t)< \alpha b_0$ since leakage is not allowed, the negative sign of the square root must be taken so that
 \begin{equation} \frac{\xi_0(t)}{\ell/2} ={-\sqrt{1-\frac{a(-\ell/2,t)}{b_0}} } ={-}\sqrt{1-\frac{ \alpha p(X,t)}{ b_0}}. \end{equation}
Note that if  $p(X,0)>0$,
  $\xi _0(0)$ must be finite, i.e.
 \begin{equation} \frac{\xi_0(0)}{\ell/2} ={-\sqrt{1-\frac{a(-\ell/2,0)}{b_0}} } ={-}\sqrt{1-\frac{ \alpha p(X,0)}{ b_0}}, \end{equation}
and a small gap must exist at the upstream end of the balloon at the start.
To guarantee zero leakage, the intersection point  $\xi _0(t)$ must be on the upstream half of the balloon wall. As an estimate, we take a relatively high
  $p(X,t)=150\ \text {mmHg}=2\times 10^4\ \text {Pa}$,
  $b_0=2\ \text {mm}$, then
  $a(-\ell /2,t)=1.995\ \text {mm} < b_0$ and
  $\xi _0=-1.0$ mm. The velocity of the intersection point is
 \begin{equation} \frac{\textrm{d}\xi_0}{\textrm{d}t}=\displaystyle\frac{ \alpha\ell\displaystyle\frac{\textrm{d} p(X,t)}{\textrm{d} t}}{4 b_0\sqrt{1-\alpha\frac{p(X,t)}{ b_0}}}. \end{equation}
Thus,  ${\textrm {d}\xi _0}/{\textrm {d}t}$ and
  ${\textrm {d}p(X,t)}/{\textrm {d}t}$ are of the same sign, implying that the gap tip advances (or retreats) when the pressure rises (or falls).
We now study the small neighbourhood of  $\xi _0$ defined by
  $\epsilon (\xi -\xi _0)$ where the small parameter
  $\epsilon$ will be identified later in (4.20). Introducing the inner coordinate,
 \begin{equation} \sigma=\frac{\xi-\xi_0}{\epsilon},\end{equation}
and changing the independent variable from  $(\xi ,t)$ to
  $(\sigma , t)$, we employ the chain rule
 \begin{equation} \frac{\textrm{d} h(\xi,t)}{\textrm{d} t}=\frac{\partial h(\sigma,t)}{\partial t}-\frac{1}{\epsilon}\frac{\partial h}{\partial \sigma}\frac{\textrm{d}\xi_0}{\textrm{d}t},\quad \frac{\partial}{\partial \xi}=\frac{1}{\epsilon}\frac{\partial}{\partial\sigma}, \end{equation}
to rewrite (3.24) as
 \begin{equation} \epsilon \frac{\partial h}{\partial t} -\frac{\textrm{d}\xi_0}{\textrm{d}t} \frac{\partial h}{\partial \sigma} = \frac{\partial}{\partial \sigma} \left\{ \frac{h^3}{12 \mu \alpha} \left[ \frac{\partial h}{\partial \xi}+ \frac{\partial b}{\partial \xi} \right] + \frac{h X_t}{2} \right\}. \end{equation}
Ignoring  $\epsilon ({\partial h}/{\partial t})$ and integrating in
  $\sigma$ once, we have
 \begin{equation} \frac{h^2}{12 \mu \alpha} \left[ \frac{\partial h}{\partial \xi}+ S \right] ={-} \left( \frac{\textrm{d}\xi_0}{\textrm{d}t} + \frac{X_t}{2} \right) , \quad S\equiv \left. \frac{\textrm{d} b}{\textrm{d} \xi}\right|_{\xi_0}={-}\frac{8b_0}{\ell^2}\xi_0, \end{equation}
in a  $O(\epsilon \ell /2)$ neighbourhood of
  $\xi _0$ where the local balloon slope
  $S$ is approximately a constant. The integration constant is zero since
  $h=0$ when the right-hand side vanishes. We now use this approximation to examine the advance and retreat of the gap tip.
4.1. Gap advancing
Consider first the phase when aortic pressure rises so that  ${\textrm {d}\xi _0}/{\textrm {d}t} >0$. During this phase
  $X_t>0$. Defining the length
 \begin{equation} \delta_+{=} \sqrt{\frac{12 \mu \alpha}{S} \left( \frac{\textrm{d}\xi_0}{\textrm{d}t}+\frac{X_t}{2} \right) }, \end{equation}
and rewriting (4.11) as
 \begin{equation} \left( \frac{h}{\delta_+} \right) ^2 \left[ \frac{\textrm{d}(h/\delta_+)}{\textrm{d}(S\sigma/\delta_+)}+1 \right] ={-}1, \end{equation}
which is a first-order differential equation for  $h/\delta _+$,
 \begin{equation} \left( 1 - \frac{1}{1 + \displaystyle \left( \frac{h}{\delta_+} \right) ^2} \right) \,\textrm{d} \left( \frac{h}{\delta_+} \right) ={-} \frac{S}{\delta_+}\, \textrm{d}\xi. \end{equation}
The solution for the advancing tip is
 \begin{equation} \frac{h}{\delta_+} - \tan^{{-}1} \frac{h}{\delta_+} ={-}\frac{S}{\delta_+}(\xi - \xi_*), \end{equation}
where  $\xi _*$ corresponds to the gap tip where
  $h = 0$. In figure 5 this approximate result is compared with the more complete numerical solution by the method of § 6. There is a slight difference since (4.15) is based on approximating the local balloon surface by a plane.

Figure 5. Snapshot of gap during the advancing phase of the second pulse at  $t=1.45$ s. The circular dots represent numerical results including the thin tail left by the first pulse. The hatched surface is the upstream half of balloon wall.
Note that in the immediate neighbourhood of the tip  $\xi -\xi _*=O(\delta _+/S)$.
To have some preliminary idea of the magnitude of  $\delta _+$, we consider the instant when
  $X_t=0$,
 \begin{equation} \delta_+|_{X_t=0}=\sqrt{\frac{12\mu\alpha}{S}\frac{\textrm{d}\xi_0}{dt}}. \end{equation}
Let us estimate the pressure pulse height above  $P_{diastolic}$ to be
  ${\Delta p(X,t)}=40$ mmHg =
  $0.533 \times 10^4$ Pa and the duration to be
  $\Delta T=T_1=0.2$ s, typical
  $S= 2$ mm/20 mm = 0.1. Then
 \begin{align} \delta_+|_{X_t=0} &= \sqrt{\frac{12\mu\alpha}{S}\frac{\textrm{d}\xi_0}{\textrm{d}t}}=\sqrt{\frac{12\mu\alpha^2}{S^2}\frac{\textrm{d} p(X,t)}{\textrm{d}t}}=\frac{\alpha}{S}\sqrt{12\mu \frac{\textrm{d}p(X,t)}{\textrm{d}t}}\nonumber\\ &= \frac{10^{{-}7}}{{2}/20}\sqrt{12\times 3.7\times 10^{{-}3}\frac{0.533\times10^4}{{0.2}}}={34.3\times10^{{-}6}\ \text{m}=0.0343\ \text{mm}}. \end{align}
 At the outer limit of the inner field, i.e. away from the tip,  $-S(\xi -\xi _*)/\delta _+\gg 1$. The left-hand side of (4.15) may be approximated for large
  $h/\delta _+$ so that
  $\tan ^{-1} ({h}/{\delta _+})\to { {\rm \pi}}/{2}$. Since the aorta wall is nearly flat,
  $h\approx S(\xi -\xi _*)$, where
  $S$ is the local balloon slope at
  $\xi _0$. Equation (4.15) then becomes
 \begin{equation} \frac{S (\xi-\xi_0)}{\delta_+} - \frac{ {\rm \pi}}{2} ={-}\frac{S}{\delta_+} (\xi - \xi_*), \end{equation}
which gives the position of the gap tip at  $t$,
$t$,
 \begin{equation} \xi_*-\xi_0={-}\frac{ {\rm \pi}}{2} \frac{\delta_+}{S} ={-} \left[ \frac{3 {\rm \pi}^2 \mu \alpha}{S^3} \left( \frac{\textrm{d}\xi_0}{\textrm{d}t}+\frac{X_t}{2} \right) \right] ^{{1}/{2}}<0. \end{equation}
Thus,  $\xi _*-\xi _0$ is a very short distance, and the tip is slightly behind
  $\xi _0(t)$. Because of this and (4.15), the neighbourhood of the tip is of the length
  $O(\delta _+/S)$, implying in turn that the small parameter in (4.8) is
 \begin{equation} \epsilon=O \left( \frac{\delta_+{/}S}{\ell/2} \right) . \end{equation}
 On the other hand,  $\xi _*-\xi =O(\delta _+/S)$ is very small in the immediate neighbourhood of the tip;
  $h/\delta _+$ is also small and
 \begin{equation} \tan^{{-}1}\frac{h}{\delta_+}\approx\frac{h}{\delta_+}-\frac{h^3}{3\delta^3_+}+\cdots. \end{equation}
Equation (4.15) can be approximated by
 \begin{equation} \frac{h^3}{3\delta^3_+}={-}\frac{S}{\delta_+}(\xi-\xi_*); \end{equation}
hence,
 \begin{equation} \frac{h}{\delta_+}\approx \left( -\frac{ S}{\delta_+}(\xi-\xi_*) \right) ^{1/3} \end{equation}
which represents a blunt front similar to film flow down an incline (Huppert Reference Huppert1982a; Lister Reference Lister1992) and is a well-known feature of the nonlinear diffusion equation (Landau & Lifshitz Reference Landau and Lifshitz1959).
4.2. Gap retreating
When the pressure pulse rises near its peak, the total force can be large enough to cause balloon migration. As the peak is passed, the balloon remains stationary ( $X_t = 0$) since the pressure never reverses direction. The tip reaches its farthest point at time
  $t_*$ and then stops. As the pressure falls from
  $p_g$ to
  $P_{diastolic}$, the aorta wall tends to fall on the balloon so that
  $\xi _0$ moves backwards. The flow ceases inside the gap which becomes a tail between
  $\xi _0$ and
  $\xi _*$. Numerical solution by the scheme to be described in § 6 indicates that
  $\xi _*$ remains essentially constant. This can be confirmed by noting that the aorta wall is nearly parallel to the balloon wall. Using the numerical evidence that
  ${\partial h}/{\partial \xi }\approx 0$ around
  $\xi _*$, (3.24) is approximately hyperbolic,
 \begin{equation} \frac{\partial h}{\partial t}\approx\frac{S(\xi_*)h^2}{4\mu\alpha}\frac{\partial h}{\partial\xi},\quad S(\xi_*)=\frac{\textrm{d}b}{\textrm{d}\xi}|_{\xi_*}, \end{equation}
whose local characteristic curve is a straight line  ${\textrm {d}\xi }/{\textrm {d}t}=0$ since
  $h^2= 0$. Thus, the point
  $\xi _*$ stays unmoved. As
  $\xi _0$ retreats, the tail must stretch in length and becomes thinner in time. The current advancing gap climbs over the tail left by the previous pressure pulse.
The profile of the retreating gap away from  $\xi _*$ but closer to
  $\xi _0$ can be treated analytically. Defining
 \begin{equation} \delta_-(t) = \sqrt{ \frac{12 \mu \alpha}{S} \left| \frac{\textrm{d}\xi_0}{\textrm{d}t}\right|}, \end{equation}
(4.11) can be rewritten as
 \begin{equation} \left( 1+ \frac{1}{ \left( \displaystyle\frac{h}{\delta_-} \right) ^2-1} \right) \,\textrm{d} \left( \frac{h}{\delta_-} \right) ={-}\frac{S}{\delta_-} \,\textrm{d} \xi, \end{equation}
which can be integrated to give
 \begin{equation} \frac{h}{\delta_-} + \frac{1}{2}\ln \frac{\displaystyle\frac{h}{\delta_-}-1}{\displaystyle\frac{h}{\delta_-}+1} = \frac{S}{\delta_-} (\xi_A-\xi). \end{equation}
The integration constant  $\xi _A$ can be determined by requiring
  $h$ to match smoothly its value near
  $\xi _0$,
 \begin{equation} h(\xi)=h(\xi_0)+\frac{\partial h}{\partial \xi}(\xi-\xi_0)=0+\frac{\partial (a-b)}{\partial \xi}(\xi-\xi_0)+\cdots={-}S(\xi_0)(\xi-\xi_0)+\cdots,\end{equation}
since  $a$ is nearly constant (see (4.2)) and
  ${\textrm {d}b}/{\textrm {d}\xi }|_{\xi _0}= S(\xi _0)$. Equation (4.27) can match (4.28) if
  $\xi _A=\xi _0$, so that the gap profile is
 \begin{equation} \frac{h}{\delta_-} + \frac{1}{2}\ln \frac{\displaystyle\frac{h}{\delta_-}-1}{\displaystyle\frac{h}{\delta_-}+1} ={-}\frac{S}{\delta_-} (\xi-\xi_0). \end{equation}
Sufficiently far downstream of  $\xi _0$, the right-hand side is positive and large, so that the above equation can be approximated by
 \begin{equation} \frac{1}{2} \ln \left( \frac{h}{\delta_-}-1 \right) \approx{-}\frac{S(\xi-\xi_*)}{\delta_-},\quad \text{or}\ \frac{h}{\delta_-}\approx 1+\exp \left( -\frac{2S(\xi-\xi_*)}{\delta_-} \right) \to 1. \end{equation}
Thus, the thickness of the gap tail diminishes with time according to (4.25) due to the fall of  $\textrm {d}p/\textrm {d}t$ and, hence,
  $\textrm {d}\xi _0/\textrm {d}t$. The aorta wall tends to collapse onto the balloon during pressure decline.
These features of the gap tail are reasonably confirmed by numerical solution of (3.24) shown in figure 6. In comparison, the analytical theory is slightly inaccurate caused by approximating the balloon wall by a plane of local slope  $S(\xi _0)$.

Figure 6. Snapshot of gap during the retreating phase of the second pulse at  $t=1.7\ \text {s}$. The circular dots represent numerical results and the hatched surface is the upstream half of balloon wall.
In summary, the gap between the walls of the aorta and balloon evolves in three stages between successive pulses.
(a) First, the gap opens at
 $\xi =-\ell /2$ and advances to the right. Due to viscosity, the gap tip $\xi _*(t)$ is of $O(d_+/S)$ behind $\xi _0(t)$, i.e. $\xi _*=\xi _0-O(\delta _+/S)$. The local gap thickness is $h = O(\delta _+)$ as shown by (4.15) and (4.23). As $p_g$ increases to a systolic peak, the gap tip advances to the furthest point $\xi _*$ close to but behind $\xi _0(t)$, i.e. $\xi _*=\xi _0(t)-O(\delta _+/S)$.
(b) Second, the gap closes and the tip retreats toward
$-\ell /2$. The gap between $\xi _0(t)$ and $\xi _*$ forms a very thin film of thickness $h=O(\delta _-)$ which decays with time. The tip remains at $\xi _*$.(c) Third, at the next pulse, the inlet pressure increases again and the gap advances along the thin film blood left by the previous pulse.


This process is repeated cyclically after each heart beat.
5. Balloon dynamics
We assume that before the heart valve opens, blood fills the aorta during the balloon inflation. Since the balloon wall and saline water within are much less elastic than the aorta wall, the balloon acts like a rigid body during migration.
After the blood wave arrives from the ventricle, the aorta wall near  $\xi =-\ell /2$ is forced to separate from the balloon by the blood pressure
  $p_g(\xi ,t)$. A gap is formed with its front advancing from
  $\xi =-\ell /2$ to
  $\xi _*(t)$. In the region where the two walls are still in tight contact,
  $\xi _*(t)<\xi <\ell /2$, solid friction must be dominant. This is different from the problem of Lighthill (Reference Lighthill1968) on the steady motion of pellet in a blood vessel where there is always a non-zero gap and no solid friction, and also different from the mixed friction in metal bearings where solid and fluid can coexist in the narrow gap dominated by partial contact of asperities.
For a crude estimate of solid friction, partial guidance can be found from the literature on the treatment of an abdominal aortic anuerysm, which is a localized dilatation of the infrarenal aorta. The disease is often treated by placing a stent-graft into the aneurysm to form an artificial conduit so as to exclude the aneurysm sac. The stent is a scaffold made of fibrous biomaterials. Its migration can introduce shear forces and radial forces that damage the endothelial cellular layer. To prevent such damages, the stent must be anchored in place by sufficiently strong friction (Liffman et al. Reference Liffman, Sutalo, Lawrence-Brown, Semmens and Aldham2006). From Dunn et al. (Reference Dunn, Zaveri, Keselowsky and Sawyer2007), the measured values of the friction coefficient are of the order of  $f= 0.03 \sim 0.06$. Petrini et al. (Reference Petrini, Miglivacca, Massarotti, Schievano, Dubini and Auricchio2005) and Wu et al. (Reference Wu, Qi, Liu, Yang and Wang2007) used the friction coefficient of 0.05. Vad et al. (Reference Vad, Eskinazi, Corbett, McLaughlin and Vande Geest2010) conducted extensive experiments of three Nitinol stent-grafts in polymeric tubes of different diameters (A:
  $22\sim 28$ mm, B:
  $20\sim 28$ mm, C:
  $18\sim 24$ mm). The friction coefficients were found to be
  $f=0.08 \sim 0.16$,
  $0.22 \sim 0.46$ and
  $0.012 \sim 0018$, respectively. Clearly the range of
  $f$ is wide among these devices. Unfortunately no data are known on the friction coefficient in REBOA; hence, tentative estimates will be made in the present theory. With this reservation we now formulate the equation of balloon motion.
Consider in general when  $b_0$ and
  $p_c$ are not large enough to stop the balloon motion. Newton's law requires
 \begin{equation} M \frac{d^2 X}{d t^2} = F(t), \quad X_t > 0. \end{equation}
The mass  $M$ of the truncated paraboloid is
 $$\begin{gather} M=\rho_b \int_{-\ell/2}^{\ell/2} {\rm \pi}\left[ R + b(\xi) \right] ^2 \,\textrm{d} \xi = \frac{ {\rm \pi}\rho_b R^2 \ell}{2} \int_{-\ell/2}^{\ell/2} \left[ 1 + \frac{b_0}{R} \frac{b(\xi)}{b_0} \right] ^2 d \left( \frac{\xi}{\ell/2} \right) \nonumber\\ = {\rm \pi}\rho_bR^2 \ell \left\{ 1 + {\frac{4}{3}\frac{b_0}{R} + \frac{8}{15} \frac{b_0^2}{R^2}} \right\}. \end{gather}$$
Since the balloon is normally filled with medical saline of density  $\rho _b=1.005\ \textrm {kg}\ \textrm {m}^{-3}$, the balloon with
  $b_0 = 2\ \text {mm}$,
  $R = 1\ \text {cm}$ and
  $\ell = 4\ \text {cm}$ has the mass
  $M\approx 16\ \text {g}$.
The total force  $F$ consists of several parts,
 \begin{equation} F = F_p - F_f + F_v, \end{equation}
where  $F_p$,
  $F_f$ and
  $F_v$ stands for parts due to pressure, frictional resistance and viscous shear, respectively.
The pressure force  $F_p$ is
 \begin{equation} F_p=F_{p,g}+F_{p,c}, \end{equation}
where  $F_{p,g}$ is due to fluid pressure on the balloon head and in the gap,
 \begin{equation} F_{p, g}(t) = p(X, t) {\rm \pi}R^2 + \int_{-\ell/2}^{\xi_*} p_g(\xi, t)\, 2 {\rm \pi}\left( R+b(\xi) \right) \, \frac{\textrm{d} b}{\textrm{d} \xi} \, \textrm{d}\xi,\end{equation}
with
 \begin{equation} p(X,t)=p_g\left(-\frac{\ell}{2},t\right),\end{equation}
and  $F_{p,c}$ is due to direct contact of the aorta and balloon,
 \begin{equation} F_{p, c}(t) = \int_{\xi_*}^{\ell/2} p_c(\xi, t)\, 2 {\rm \pi}\left( R+b(\xi) \right) \, \frac{\textrm{d} b}{\textrm{d} \xi} \, \textrm{d}\xi, \end{equation}
where  $p_c$ is the contact pressure defined in (3.8).
Since the contact pressure over the dry part of the balloon wall is  $p_c=b_0/\alpha$, the friction force
  $F_f$ during balloon motion is
 \begin{align} F_f(t) &= \int_{\xi_*}^{\ell/2} f p_c(\xi, t)\, 2 {\rm \pi}\left( R+b(\xi) \right) \, \textrm{d}\xi=\int_{\xi_*(t)}^{\ell/2} f \frac{b(\xi)}{\alpha} 2 {\rm \pi}(R+b(\xi))\, \textrm{d}\xi\nonumber\\ &= \frac{2 {\rm \pi}f R b_0}{\alpha} \int_{\xi_*(t)}^{\ell/2} \frac{b(\xi)}{b_0} \left( 1 + \frac{b_0}{R} \frac{b(\xi)}{b_0} \right) \,\textrm{d} \xi\nonumber\\ &=\frac{ {\rm \pi}R^2 b_0}{\alpha} \frac{f\ell}{R} \left\{ \frac{1}{3}(\chi_*^3 - 3 \chi_* + 20 + \frac{b_0}{15R} (1-\chi_*)^3(3 {\chi}_*^2+9 \chi_*+8) \right\}, \end{align}
where (3.3) is used for  $b(\xi )$ and
  $f$ is the kinetic friction coefficient. For brevity,
 \begin{equation} \chi=\frac{\xi(t)}{\ell/2},\quad \chi_* = \frac{\xi_*(t)}{\ell/2} \end{equation}
are introduced. When the balloon stops to move,  $f$ should in principle be the static friction coefficient. For lack of accurate information, no distinction will be made in this study.
Finally, the viscous drag force is
 \begin{equation} F_v(t) = \left.\int_{-\ell/2}^{\xi_*} \tau_{\xi \eta}\right|_{\eta=b} 2 {\rm \pi}\left(R+b(\xi)\right)\, \textrm{d}\xi. \end{equation}
In view of (3.27) and  $p_g=a/\alpha$,
 \begin{equation} \left.\tau_{\xi \eta}\right|_{\eta=b} ={-}\frac{h}{2\alpha} \frac{\partial a}{\partial \xi} - \mu \frac{X_t}{h}. \end{equation}
It is convenient to write
 \begin{equation} F_v=F_{v,a_\xi}+F_{v,X_t}, \end{equation}
with
 \begin{align} F_{v, a_\xi}(t) ={-}\int_{-\ell/2}^{\xi_*} \frac{h}{2\alpha} \frac{\partial a}{\partial \xi} 2 {\rm \pi}\left(R+b(\xi)\right)\, \textrm{d}\xi,\quad F_{v, X_t}(t) ={-}\int_{-\ell/2}^{\xi_*} \mu \frac{X_t}{h} 2 {\rm \pi}\left(R+b(\xi)\right)\, \textrm{d}\xi. \end{align}
The complete computational task is to solve the initial-boundary-value problem coupling the aorta pressure  $p(X,t)$, the gap advance/retreat and the balloon displacement
  $X(t)$, due to weak inflation, weak solid friction or high cardiac pressure.
For programming convenience, we employ the following governing equations for waves in the aorta:
 \begin{gather} \frac{\partial u}{\partial t} ={-} \frac{\partial (p/\rho)}{\partial x}, \end{gather}
 \begin{gather} \frac{\partial (p/\rho)}{\partial t} ={-}C^2 \left( 1+\beta\frac{\partial}{\partial t} \right) \frac{\partial u}{\partial x} \end{gather}
instead of (2.9). Equation (5.15) is obtained by substituting (2.1) into the time derivative of (2.8). To account for the moving boundary, we introduce
 \begin{equation} x = X(t) \zeta \end{equation}
so that the aorta is defined by  $\zeta \in [0, 1]$. In terms of the new independent variables
  $t$ and
  $\zeta$, the equations for
  $u$ and
  $p/\rho$ become
 $$\begin{gather} \frac{\partial u}{\partial t} = \frac{X_t \zeta}{X} \frac{\partial u}{\partial \zeta} - \frac{1}{X} \frac{\partial \, p/\rho}{\partial \zeta}, \end{gather}$$
 $$\begin{gather}\frac{\partial (p/\rho)}{\partial t} = \frac{X_t \zeta}{X} \frac{\partial (p/\rho)}{\partial \zeta} - \frac{C^2}{X} \frac{\partial u}{\partial \zeta}{-\beta \frac{C^2}{X} \frac{\partial}{\partial \zeta} \left( \frac{\partial u}{\partial t} \right) }. \end{gather}$$
The boundary conditions are now specified at two known points  $\zeta =0,1$,
 \begin{equation} p(t, \zeta = 0) = P(t),\quad u(t, \zeta = 1) = X_t(t). \end{equation}
6. Numerical solution for balloon migration
We employ the method of lines (Scheisser Reference Scheisser1991) and discretize  $\zeta =[0,1]$ at
  $N+1$ points
  $\zeta _j, j = 0, 1, \ldots , N$. There are
  $2N+2$ unknowns:
  $u_j, j = 0, 1, \ldots , N-1$,
  $p_j, j=1, 2, \ldots , N$,
  $X$ and
  $X_t$, governed by
  $2N+2$ first-order ordinary differential equations,
 $$\begin{gather} \frac{\partial u_j}{\partial t} = \frac{X_t \zeta_j}{X} \left[ D_N u \right] _j - \frac{1}{X} \left[ D_N (p/\rho) \right] _j, \quad j = 0, \ldots, N-1, \end{gather}$$
 $$\begin{gather}\frac{\partial (p_j/\rho)}{\partial t} = \frac{X_t \zeta_j}{X} \left[ D_N (p/\rho) \right] _j - \frac{C^2}{X} \left[ D_N \left( u + {\beta \frac{\partial u}{\partial t}} \right) \right] _j, \quad j = 1, \ldots, N, \end{gather}$$
along with Newton's law (5.1) and  $X_t=\textrm {d} X/\textrm {d} t$. Here
  $D_N$ is the derivative matrix which can be either a Chebyshev differentiation matrix (see Trefethen Reference Trefethen2000, Chapter 6) based on N+1 Chebyshev points, or a standard central finite difference matrix based on N+1 nodes of equal spacing, i.e.
 \begin{equation} [D_N f]_j=\frac{f_j-\,f_{j-1}}{2\Delta \zeta}. \end{equation}
Equations (6.1) and (6.2) are coupled with (5.1) and (3.24) for finding  $p_g$ and
  $\xi _*$ to determine
  $F$.
$F$.
We require the boundary conditions,
 \begin{equation} p(0,t) =P(t),\quad \zeta=0; \quad u_N(t)= X_t(t),\quad \zeta=1, \end{equation}
and initial conditions
 \begin{equation} u_j(0)=0,\quad p_j(0)= P_{diastolic},\quad X(0)= X_0, \quad \frac{\textrm{d}X(0)}{\textrm{d}t} = 0. \end{equation}
 When the balloon moves, the nonlinear heat equation (3.24) contains  $X_t$ which has to be solved by coupling with (6.1)–(6.5) and matching
  $p_N(t) = p(X, t)$. A fixed time step
  $\Delta t$ is used. From
  $t^{(n)} = n \Delta t$ to
  $t^{(n+1)} = (n+1) \Delta t$, the balloon motion equation (5.1) is approximated by
 \begin{equation} M \frac{\textrm{d} X_t}{\textrm{d} t} = \frac{F^{(n)} + F^{(n+1)}}{2} \end{equation}
with a truncation error of  $(\Delta t)^2$. The force
  $F^{(n+1)}$ is obtained by finding
  $h^{n+1}$ from (3.24) using the Crank–Nicolson finite difference scheme,
 \begin{equation} \frac{h^{(n+1)}-h^{(n)}}{\Delta t} = \frac{1}{2} \frac{\partial q (h^{(n+1)})}{\partial \xi} +\frac{1}{2} \frac{\partial q (h^{(n)})}{\partial \xi}, \end{equation}
where
 \begin{equation} q(h) = \frac{h^3}{12 \mu \alpha} \frac{\partial (h+b)}{\partial \xi} + \frac{h}{2} X_t^{(n+{1}/{2})} \end{equation}
with  $X_t^{(n+{1}/{2})} = (X_t^{(n+1)}+X_t^{(n)})/2$. At the left boundary of gap
  $\xi = -\ell /2$, the gap pressure matches the aorta pressure and satisfies (3.5), i.e.
  $h^{(n+1)}(-\ell /2) = \alpha p_N^{(n+1)}$. The right boundary is the tip of the gap
  $\xi _*(t)$ where the thickness
  $h(\xi _*(t))\equiv 0$, which requires
 \begin{equation} \frac{\textrm{d} (h (\xi_*(t)))}{\textrm{d}t} = \frac{\partial h}{\partial t} + \frac{\textrm{d} \xi_*}{\textrm{d} t} \frac{\partial h}{\partial \xi} = 0. \end{equation}
Thus, the tip moves at the velocity
 \begin{equation} \frac{\textrm{d}\xi_*}{\textrm{d} t} ={-}\frac{h_t}{h_\xi} = \left.-\frac{q_\xi}{h_\xi}\right|_{\xi = \xi_*(t)}, \end{equation}
which can be numerically determined. A grid of equal spacing  $\Delta \xi$ is used to dynamically cover the computational domain between
  $-\ell /2$ and
  $-\ell /2 + M \Delta \xi$ such that
  $-\ell /2 + M \Delta \xi \le \xi _*(t) < -\ell /2 + (M+1) \Delta \xi$. The grid number
  $M$ increases as
  $\xi _*(t)$ moves closer to the balloon centre
  $\xi = 0$. The
  $\xi$-derivative of
  $h$ and
  $q$ are approximated by the central difference formula for inner nodes but by single-sided differences for boundary nodes. The unknown
  $h^{(n+1)}$ in the discretized nonlinear heat equation (6.7) is solved using MATLAB nonlinear equations solver fsolve with analytically calculated Jacobian. Since
  $F^{(n+1)}$ and
  $X^{(n+1)}$ are part of the solutions, a few iterations are required in each time step.
For the limiting case of constant  $X$, this numerical scheme has been confirmed by comparison with the exact result of (2.30) and analytical approximations as shown in figures 5 and 6.
In our first numerical example the inputs are  $X(0)=20$ cm,
  $f = 0.202$,
  $P_{systolic}=120$ mmHg and
  $P_{diastolic}=80$ mmHg. In figure 7(a) the time series of the aortic pressure pulses is first displayed. Positive
  $F(t)$ occurs only during a brief moment around the pulse peaks and appear as spikes. These spikes lead to sudden jumps of
  $X(t)$ under each pressure pulse. Note that both the spike height and the displacement jumps increase slowly in time, due to the similar growth of max
 $(p(X,t))$ in figure 4. Finally, the location of the gap tip
  $\xi _*$ is shown. After each jump,
  $\xi _*$ retreats somewhat due to the advancement of the balloon. The total migration is 3.5 cm after 15 s, or roughly 0.233 mm
  ${\rm s}^{-1}$. The gradual lengthening of
  $\xi _*$ follows the increase of displacement jumps. More details around a typical pressure peak are displayed in figure 8. When
  $p(X,t)$ climbs up the peak, the gap tip first retreats along the balloon (figure 8a). Meanwhile migration begins and accelerates as long as
  $F>0$ (figure 8b). When
  $p(X,t)$ falls down from the peak, the gap tip then advances while the balloon decelerates and finally stops. Viscous drag is negligibly small throughout (figure 8c).

Figure 7. Balloon movement forced by intermittent cardiac pressure and resisted by friction. Input data:  $\ell = 4$ cm,
  $b_0 = 2$ mm,
  $V_b=16.185$ ml and
  $M = 16.3$ g. (a) Blood pressure
  $p(X, t)$; (b)
  $F=F_p+F_f$ around the peaks of pressure pulses when the balloon moves; (c) displacement of the balloon; (d) gap tip
  $\xi _*$.

Figure 8. Numerically computed balloon velocity and forces near the peak of a typical pressure pulse. (a) Pressure  $p(X,t)$ (dashed curve) and gap tip
  $\xi _*(t)$. (b) Balloon velocity (dashed curve) and the total force on balloon
  $F$ (solid). (c) Viscous drag
  $F_{s, a_\xi }$ and
  $F_{s, X_t}$.
The effect of friction coefficient  $f$ is shown in figure 9 for
  $f=0.200,0.201$ and 0.202, all for the same
  $X(0)=20$ cm. The balloon displacement increases several fold if
  $f$ is reduced by only 1 %. To better understand the sensitivity of balloon migration on
  $f$ and
  $X(0)$, let us first seek analytical estimates of the dominant force components
  $F_p=F_{p,g}+F_{p,c}$ and
  $F_f$. Since
  $\partial a/\partial \xi \approx 0$ over the wet part of the balloon wall, the following approximation can be made in the integrals of (5.5),
 \begin{equation} p_g(\xi) \approx p_g(-\ell/2)=p(X,t), \end{equation}
so that
 \begin{align} F_{p, g} &\approx {\rm \pi}R^2 + p(X,t)\int_{-\ell/2}^{\xi_*(t)} 2 {\rm \pi}(R+b(\xi)) b_\xi\,\textrm{d} \xi \nonumber\\ &= p(X,t) \left[ R + {b(\xi_*(t))} \right]^2. \end{align}
Figure 9. Balloon displacement for  $X(0)=20$ cm and different
  $f$. Other inputs are the same as those in figure 7.
Using  $p_c=b_0/\alpha$, the force on the dry part of balloon wall is
 \begin{align} F_{p,c} &= \int^{\ell/2}_{\xi_*(t)} p_c(\xi) 2 {\rm \pi}(R+b(\xi)) b_\xi \,\textrm{d} \xi= \frac{2 {\rm \pi}}{\alpha} \int^{\ell/2}_{\xi_*(t)} b(\xi) (R+b(\xi)) b_\xi \,\textrm{d} \xi\nonumber\\ &={-} \frac{2 {\rm \pi}}{\alpha} \left[ R \frac{b^2(\xi_*)}{2}+ \frac{b^3(\xi_*) }{3} \right] . \end{align}
On the other hand, the solid friction acting on the balloon surface in contact with the aorta is already given by (5.8).
It can be seen in figure 7 that, around the first pulse peak at  $t = 0.5\ \text {s}$, the blood pressure inside the gap is about 128 mmHg. The corresponding
  $\xi _* \approx -8.2 \ \text {mm}$ and
  $b(\xi _*) \approx 1.7\ \text {mm}$. From (6.12) we get
  $F_{p,g}=128 \times 133 \times {\rm \pi}(0.01+0.0017)^2 \approx 7.32\ \text {N}$. Similarly
  $F_{p,c}\approx -0.96\ \text {N}$ from (6.13). The frictional resistance is
  $F_f \approx 6.26\ \text {N}$ from (5.8). Neglecting the viscous drag
  $F_s$, the net force is
  $7.32 - 0.96 - 6.26 = 0.1\ \text {N}$, which, on a balloon with relatively small mass
  $M=$ 16 g, leads to a large acceleration of
  $0.1/0.016 = 6.25\ \text {m}\ \text {s}^{-2}$. If the coefficient
  $f$ is reduced just by 1 % from 0.202 to 0.200, the frictional resistance is reduced by
  $6.26 \times 0.01 = 0.06\ \text {N}$, i.e. 60 %, and the net force is increased by 60 % from 0.1 to 0.16 N, resulting in considerable increase of balloon acceleration and displacement.
In figure 10 the numerically computed balloon displacements for  $X(0)= 19.0, 19.5, 20.0$ cm and
  $f=0.200$ are compared. Again a small change in
  $X(0)$ leads to a large difference in
  $X(t)$ at large
  $t$. At these initial positions, the peak pressures at
  $X$ are 127, 127.6 and 128.2 mmHg, respectively. The difference of 0.6 mmHg corresponds to a change in
  $F_{p,g}$ by
  $0.6 \times 133 \times {\rm \pi}(0.01+0.0017)^2 \approx 0.03\ \text {N}$. Thus, the net force is reduced by 30 % for each 5 mm reduction of separation from the ventricle. This is again due to the dependence of max
 $(p(X,t))$ on
  $X(0)$.

Figure 10. Balloon displacement for  $f = 0.200$ and different
  $X(0)$. Other inputs are the same as those in figure 7.
In the experiments of Borger van den Burg et al. (Reference Borger van den Burg, Van Schaik, Brouwers, Wong, Rasmussen, Hamming and Hocencamp2019), migration of 0.9 mm  ${\rm s}^{-1}$ was observed in one test under a steady hypertensive pressure of 160–180 mmHg. Their balloon was partially supported at the back by a catheter which buckled in some of the tests. Since the measurement was performed for steady pressure on a much larger porcine aorta of undocumented elastic properties and initial distension, a meaningful comparison is not feasible and must await more definitive experiments and reliable modelling of the catheter deformation.
7. Criteria for secure anchoring
When the balloon is securely anchored,  $X_t=0$. We first use the numerical scheme to compute the threshold value of max
  $p(X,t)$ by requiring
  $F=F_p-F_f+F_v=0$. The results are shown by circular dots in figure 11 for different
  $b_0$ and
  $f$, but the same
  $X(0)=20$ cm. For example, if
  $b_0=2.4$ mm and
  $f=0.2$, then max(
 $p(X,t))$ must not exceed 150 mmHg for secure anchoring. If max(
 $p(X,t)$) is higher,
  $b_0$ and/or
  $f$ must be increased.

Figure 11. Threshold of  $\max (p(X,t))$ for fixed
  $X(0)=20$ cm and different balloon distention
  $b_0$ and friction factor
  $f$. Circular dots: numerical computations. Solid curve: analytical approximations.
For confirmation, it is useful to compare the numerical computed criteria with analytical approximations. Making use of the near flatness of the aorta wall over most of the gap and invoking (4.19), we first use (3.3) for  $b(\xi )$ in (6.12) and (4.4) and then approximate
  $\xi _*$ by
  $\xi _0$ so that
 \begin{align} F_{p, g} &\approx{=} {\rm \pi}R^2 p(X, t) \left[ 1+\frac{b_0}{R} \left( 1 - \frac{\xi_0^2}{(\ell/2)^2} \right) \right] ^2 \end{align}
 \begin{align} & = {\rm \pi}R^2\frac{b_0}{\alpha} \left( 1-\chi_0^2 \right) \left[ 1+\frac{b_0}{R} \left( 1 - \chi_0^2 \right) \right] ^2, \end{align}
with  $-1<\chi _0=\xi _0/(\ell /2)<0$. Use has been made of (4.4). By similar substitution in (6.13) we get
 \begin{equation} F_{p,c} \approx{-}\frac{ {\rm \pi}R^2 b_0}{\alpha} (1-\chi_0^2)^2 \left[ { \frac{b_0}{R} + \frac{2}{3} \left( \frac{b_0}{R} \right) ^2 (1-\chi_0^2) } \right] ,\end{equation}
which is negative and opposite to the direction of blood flow.
The total pressure force is
 \begin{equation} F_p = F_{p, g} + F_{p, c} \approx {\rm \pi}R^2 \frac{b_0}{\alpha}(1-\chi_0^2) \left[ 1+\frac{b_0}{R}(1-\chi_0^2) +\frac{1}{3} \left( \frac{b_0}{R} \right) ^2 \left( 1 - \chi_0^2 \right) ^2 \right] . \end{equation}
 The solid friction along the contacting surface of the balloon and the aorta is obtained from (5.8) with  $\xi _*$ replaced by
  $\xi _0$, i.e.
  $\chi _*$ by
  $\chi _0$.
To ascertain that the viscous drag is negligible, we put  $X_t=0$ in (5.13) to get
 \begin{align} F_v=F_{v, a_\xi} ={-}\int_{-\ell/2}^{\xi_*} \frac{h}{2\alpha} \frac{\partial a}{\partial \xi} 2 {\rm \pi}R\,\textrm{d}\xi={-} \left\{ \int_{-\ell/2}^{\xi_*-O(\delta_+{/}S)}+\int_{\xi_*-O(\delta_+{/}S)}^{\xi_*} \right\} \frac{h}{2\alpha} \frac{\partial a}{\partial \xi} 2 {\rm \pi}R\,\textrm{d}\xi. \end{align}
Again by invoking (4.2), the first integral above can be neglected. The second integral is over the small neighbourhood of the gap front. During the gap advance  $h=O(\delta _+)$ and
  ${\partial a}/{\partial \xi }=O(\delta _+/(\delta _+/S))$ near the front, the second integral is of the order
 \begin{equation} O(F_v)=\frac{2 {\rm \pi}R}{2\alpha} \left( \delta_+\frac{\delta_+}{\delta_+{/}S}\frac{\delta_+}{S} \right) =\frac{ {\rm \pi}R\delta^2_+}{\alpha}. \end{equation}
It follows that
 \begin{equation} O \left( \frac{F_v}{F_p} \right) =\frac{ {\rm \pi}R \delta^2_+{/}\alpha}{ {\rm \pi}R^2b_0/\alpha}=\frac{\delta^2_+}{b_0R}\sim\frac{(0.0343)^2}{2\times10}\ll 1. \end{equation}
This confirms numerical computations that the balloon is mainly pushed by the normal pressure over the wetted area and resisted by solid friction over the dry part. Though responsible for the gap formation, viscous drag is a negligible part of the total force.
The condition for secure anchoring is  $F_p\leq F_f$. From (5.8) and (7.4), the minimum
  $f$ for anchoring the balloon is
 $$\begin{gather} (1-\chi_0^2) \left[ 1+\frac{b_0}{R}(1-\chi_0^2) +\frac{1}{3} \left( \frac{b_0}{R} \right) ^2 \left( 1 - \chi_0^2 \right) ^2 \right] \nonumber\\ \leq\frac{ f\ell}{R} \left[ \frac{{\chi}_0^3 - 3 \chi_0 + 2}{3} + {\frac{b_0}{R} \frac{(1-\chi_0)^3(3 {\chi}_0^2+9 \chi_0+8)}{15}} \right] , \quad -1<\chi_0<0. \end{gather}$$
For any given  $\max ( p(X, t))$,
  $\chi _0$ is found from (4.5) and plugged into (7.8) to obtain the threshold friction coefficient
  $f$ as a function of
  $b_0/R$ and
  $\ell /R$. The result is displayed by solid curves in figure 11. Agreement with numerical computation is excellent.
To see how well haemorrhage is prevented by the anchored balloon, we display the dependence of numerically computed  $\xi _*$ on max
 $(p(X,t))$ and
  $b_0$ in figure 12. For a given distension
  $b_0$, larger max(
 $p(X,t)$) corresponds to smaller
  $-\xi _*$, implying higher risk of leakage. In addition, the analytical relation (4.5) is also plotted as solid curves, showing the small difference between
  $\xi _0$ and
  $\xi _*$, hence confirming a key estimate used in the analytical approximation.
8. Conclusions
In order to provide guidance for avoiding the hazard of balloon migration in REBOA, a quantitative theory is described here to examine the physical mechanism of fluid/structure interaction. First it is found that the blood pressure that forces the balloon varies along the aorta, and depends on the initial position of the balloon. Greater separation from the ventricle leads to greater driving pressure. Hence, the proper initial placement may need to be decided according to the patient's blood pressure. The cardiac pressure is shown to force the contacting walls to separate, whether the balloon is firmly anchored or not. The fluid mechanics of gap formation is partially related to the physics of lubrication in narrow conduits. Due to the intermittency of cardiac pressure, the gap front alternately advances and retreats following the rise and fall of the incident pulses. Leakage and/or migration also depend on a judicious balance between balloon distension  $b_0$ and roughness, hence, the frictional resistance. For a given aortic pressure and
  $f$, migration can occur if
  $b_0$ is too small. On the other hand, for a given pressure and chosen
  $b_0$, bleeding cannot be stopped if
  $f$ is not large enough. Once migration begins, the balloon advances in abrupt steps under each pressure pulse. Moreover, the migration speed is found to be sensitive to the roughness of the balloon surface; thus, further experiments are needed for more accurate data on aorta compliance and the friction properties of different balloon materials. An improved theory may also need to consider the stiffness of the catheter and computational simulation of the complex aortic system. Since the migration of an unsupported balloon depends also on the careful choice of initial distension and placement, easy and safe use of REBOA may require further innovations of locking devises.


Acknowledgement
C. C. M. thanks Professor H. A. Stone of Princeton University for calling our attention to Lighthill (Reference Lighthill1968). Y. L. thanks Dr X. Wang of New York Life for providing input on fundamental concepts and practices of cardiology related to this problem. S. M. thanks Dr D. Bianchi of University of Pavia for fruitful discussions about the biomechanics of arterial tissues. P. S. thanks Professor G. Bellotti of University of Roma Tre for discussions in the initial stage. Detailed suggestions by the referees have been most helpful in completing the revision.
Funding
Funding for P. S. was provided by a grant from the University of Rome Tor Vergata (Fluidodinamica Sistemi Biologici No.COGC09010102 (1030203)).
Declaration of interests
The authors report no conflict of interest.


