


1. Introduction
The cell, fundamental unit of life, is a mechanical machine assembled from smaller machines (Needleman & Dogic Reference Needleman and Dogic2017). The mechanical aspects of the cell are central to many processes, including cell motility, cell division, organelle transport and mechanotransduction (Fletcher & Mullins Reference Fletcher and Mullins2010). The cell cytoskeleton – a dynamic assembly of polymerizing and depolymerizing semi-flexible filaments, motor proteins and crosslinkers that are immersed in and permeated by the cell cytoplasm – is the cell's machinery for generating active forces and responding to external forces (Howard Reference Howard2001). A major direction of research in cell mechanics involves studying different types of mechanical coupling between the discrete components of the cytoskeleton, i.e. single filaments and motors, and the emergent behaviour of the assembly at larger scales (Shelley Reference Shelley2016; Needleman & Dogic Reference Needleman and Dogic2017). In comparison, at the whole cell scale, it is useful to view the cytoskeleton as a continuous material with complex mechanical behaviour. This is the scope used in this study.
The cytoskeleton rheology is complex due to the multiple mechanisms of active force generation, and its highly dynamic and heterogeneous structure. A variety of techniques have been developed over the years for characterizing the cell's mechanical response to force/stress in the continuum scale. In probe-based techniques, the relationship between the force and velocity of particles placed inside the cell or on its boundary is used to extract the rheological behaviour of the local structure around the probe. These include passive and active microrheology (MR) (Squires & Mason Reference Squires and Mason2010) and atomic force microscopy (Haase & Pelling Reference Haase and Pelling2015; Beicker et al. Reference Beicker, O'Brien, Falvo and Superfine2018). In comparison, techniques such as optical tweezers, micropipette aspiration and fluid-based deformation cytometry provide the mechanical response of the whole cell to external forces (Di Carlo Reference Di Carlo2012; Darling & Di Carlo Reference Darling and Di Carlo2015; Hobson, Falvo & Superfine Reference Hobson, Falvo and Superfine2021). When interpreting these experiments, it is assumed commonly that the active force generated by the cell is weaker in comparison with the externally applied force, or in the case of passive MR, weaker than the thermal force. Therefore, these methods may not be used to study, for example, the mechanics of cell division, where the active forces lead to significant remodelling of the cytoskeleton.
Here, we focus on applications where the active forces can be neglected in comparison to the external forces, and focus on only the passive responses of the fluid and the network phases to external forces. Some of the methods for measuring the active forces in different cellular processes and the cell's response to them are surveyed in Weihs, Mason & Teitell (Reference Weihs, Mason and Teitell2006) and Hao et al. (Reference Hao, Cheng, Tanaka, Hosokawa, Yalikun and Li2020).
Relating the force to displacement in probe-based techniques, and predicting cellular deformations in whole cell techniques, requires specifying a constitutive equation (CE) for the cellular material(s) and solving the resulting momentum and mass conservation equations. Several continuum descriptions with different levels of complexity have been used for modelling the cytoskeleton and its permeating fluid, including viscoelastic (VE) models, active gel theories that account for active stresses (MacKintosh & Levine Reference MacKintosh and Levine2008; Banerjee & Marchetti Reference Banerjee and Marchetti2011; Prost, Jülicher & Joanny Reference Prost, Jülicher and Joanny2015), and Biot poroelasticity (Moeendarbary et al. Reference Moeendarbary, Valon, Fritzsche, Harris, Moulding, Thrasher, Stride, Mahadevan and Charras2013); see Mogilner & Manhart (Reference Mogilner and Manhart2018) for a review on this topic. The most widely used model is a generalized linear viscoelastic CE to describe the linear response of the cytoskeleton and the permeating fluid. The underlying assumption here is that the fluid and network phases are both incompressible and move with the same velocity. For this choice of CE, the momentum equation reduces to the Stokes equation upon the Laplace or Fourier transform in time, allowing one to use the existing boundary value solutions in Stokes flow. For example, the response function of a spherical probe moving under a time-dependent force  $F(t)$ is simply given by the Stokes drag formula
  $\tilde {F}(s)= (6{\rm \pi} \,\tilde {G}(s)\,a)\, \tilde {U}(s)$, where
  $a$ is the sphere radius, and
  $\sim$ denotes variables in Laplace space (Squires & Mason Reference Squires and Mason2010). This formula together with the fluctuation dissipation theorem forms the theoretical basis of the generalized Stokes–Einstein relation (GSER) used in passive MR (Mason & Weitz Reference Mason and Weitz1995).
To determine the frequency range over which the GSER is valid, Levine & Lubensky (Reference Levine and Lubensky2000) used a two-phase model (compared to an effective single-phase model used in the GSER) to study the dynamics of a sphere embedded in a VE network and permeated by a Newtonian fluid. Their calculations show that the fluid flow induced by local compression and dilation of the network produces a relaxation dynamics that is slower than shear relaxation. Following this, they define a critical frequency below which the GSER becomes inaccurate:  $\omega _c=(2G+\lambda )/(a^2\xi )$, where
  $G$ and
  $\lambda$ are the first and second Lamé coefficients of a linear elastic material, and
  $\xi$ is the friction coefficient that determines the fluid–network force exchange due to their relative motion. Interestingly, experimental and theoretical studies suggest that the flows induced by network compression/dilation (osmotic flows) may be the key for predicting the observed dynamics in processes such as cell blebbing (Charras et al. Reference Charras, Yarrow, Horton, Mahadevan and Mitchison2005, Reference Charras, Coughlin, Mitchison and Mahadevan2008; Mitchison, Charras & Mahadevan Reference Mitchison, Charras and Mahadevan2008; Strychalski et al. Reference Strychalski, Copos, Lewis and Guy2015; Strychalski & Guy Reference Strychalski and Guy2016) and cell motility (Strychalski et al. Reference Strychalski, Copos, Lewis and Guy2015).
The osmotic flows can also be computed using Biot theory of linear poroelasticity (Biot Reference Biot1941, Reference Biot1955), which neglects the viscous stress contributions from the permeating fluid, and is thus unable to resolve the faster shear relaxation dynamics. Because of the wide range of time scales in the cytoskeleton, one cannot assess the relative importance of shear and bulk (dilation/compression) relaxation in the cytoskeleton a priori. In this regard, the two-phase model of the cytoskeleton and its fluid medium provides a useful framework to study both shear and bulk relaxation of the cytoskeleton and the permeating flows.
By solving the conservation equations in a two-phase model, one can compute the displacement fields in both the fluid and network phases. These displacement fields can be measured separately, for example, by (i) tracking particles that are smaller than the network mesh size, to measure the fluid flows (Delarue et al. Reference Delarue2018), and (ii) tracking particles that are significantly larger than mesh size to measure network displacements. Computing these fluid flows allows one to investigate the effect of internal flows on the transport of protein aggregates and organelles inside the cell. Defects in protein transport have been tied to many diseases (Aridor & Hannan Reference Aridor and Hannan2000, Reference Aridor and Hannan2002). Note that the sizes of proteins and organelles range between tens of nanometres to micron scale. Thus the Péclet number corresponding the internal flows may well be  $Pe \ge 1$, leading to significant advective transport (Mogre, Brown & Koslover Reference Mogre, Brown and Koslover2020). Furthermore, the network deformations may lead to changes in the local porosity and thus mobility of the proteins (Irianto et al. Reference Irianto, Pfeifer, Bennett, Xia, Ivanovska, Liu, Greenberg and Discher2016). For the above reasons, it is desirable to characterize and compute the intracellular flows.
Analysing the results of mechanical experiments and/or modelling the whole cell response to external forces requires solving the conservation equations of a two-phase system. This is more involved than the case of a linear VE material, even for simple geometries. For example, the solution to a sphere moving in a two-phase system provided by Levine & Lubensky (Reference Levine and Lubensky2001) is an approximate solution. Instead of imposing the boundary conditions (BCs) directly, the authors used a wave vector cutoff  $k_{max}={{\rm \pi} }/{a}$ to the fundamental solutions of a point force. Fu, Shenoy & Powers (Reference Fu, Shenoy and Powers2008) used a two-fluid model and obtained an exact closed-form response function of an oscillating sphere. They used a kinetic friction law for the network BCs to describe the slip velocity between the network and the probe, and explored the effect of this slip velocity on the computed VE functions. Later, Fu, Shenoy & Powers (Reference Fu, Shenoy and Powers2010) applied the general solution for the two-fluid model to analyse the swimming of an infinite sheet with a small-amplitude travelling wave deformation. Diamant (Reference Diamant2015) and Sonn-Segev et al. (Reference Sonn-Segev, Bernheim-Groswasser, Diamant and Roichman2014) used the general solution of a sphere moving in a two-fluid system to study the dynamics at different length scales compared to the size of the probe and the network mesh. They explored how these lengths influence the measurements of single-particle and two-point MR, and the transition to bulk rheological response at larger lengths.
Typically, the equations of two-phase models are solved numerically using grid-based techniques such as the immersed boundary method (Strychalski et al. Reference Strychalski, Copos, Lewis and Guy2015; Strychalski & Guy Reference Strychalski and Guy2016; Copos & Guy Reference Copos and Guy2018). Assuming that the network and fluid phases are in their linear response regime results in a set of linear partial differential equations (PDEs). This opens the door for developing a mathematical framework, similar to Stokes flow microhydrodynamics (Kim & Karrila Reference Kim and Karrila2013), that can be used to obtain analytical solutions in simple geometries and to develop special-purpose numerical methods, such as boundary integral and singularity methods, for solving problems with complex geometries and multiple interfaces (Pozrikidis Reference Pozrikidis1992).
In this study, we derive the general solutions (in spherical coordinates) of the linear PDEs describing a two-phase system in Laplace space. We model the network as a general compressible VE material, and the fluid as a VE incompressible fluid. As an example, we use the axisymmetric form of the general solution to study the dynamics of a rigid sphere moving in a PVE material, composed of a linear elastic network and a Newtonian fluid, under an external force. We derive closed-form expressions for the time-dependent fluid and network displacement fields, and calculate the time-dependent mobility of the sphere, as a function of constitutive parameters of the fluid and the network. The motivation for choosing the sphere problem is to develop a formulation for characterizing PVE materials using single- and two-point particle-tracking passive and active MR. We show that the network compressibility, and the response of the fluid to that, introduces a slow relaxation time scale in addition to the faster shear relaxation time characterized as the ratio of the fluid viscosity to the network shear modulus. These predictions are in agreement with the experimental measurements of cell mechanics (Rosenbluth et al. Reference Rosenbluth, Crow, Shaevitz and Fletcher2008). Altogether, our solution to the sphere problem suggests that particle-tracking MR experiments may be used to determine fluid permeability, in addition to VE properties of the fluid and the network.
2. General solutions
We begin by expressing the conservation equations in the two-phase model, which includes momentum conservation equations for the fluid and the network phases as well as the mass conservation of the mixture. The network and the fluid mechanics are coupled through the friction forces that arise from the relative motion of these two phases. Due to the microscopic dimensions, inertial forces can be neglected in determining the intracellular mechanics. With these assumptions, the conservation equations are as follows.
 $$\begin{gather} \text{Mass conservation:} \quad \boldsymbol{\nabla}\boldsymbol{\cdot} [\phi \boldsymbol{v}_n+(1-\phi)\boldsymbol{v}_f]=0. \end{gather}$$
 $$\begin{gather}\text{Momentum equation for the network:} \quad \boldsymbol{\nabla}\boldsymbol{\cdot} [\boldsymbol{\sigma}_n-\phi p \boldsymbol{I}]-\xi (\boldsymbol{v}_f-\boldsymbol{v}_n)=\boldsymbol{0}. \end{gather}$$
 $$\begin{gather}\text{Momentum equation for the fluid:} \quad \boldsymbol{\nabla}\boldsymbol{\cdot} [\boldsymbol{\sigma}_f-\left(1-\phi\right) p \boldsymbol{I}]+\xi(\boldsymbol{v}_f-\boldsymbol{v}_n)=\boldsymbol{0}. \end{gather}$$
Here, subscripts  $n$ and
  $f$ denote network and fluid phases,
  $\phi$ is the volume fraction of the network phase,
  $\boldsymbol {\sigma }_{n}$ and
  $\boldsymbol {\sigma }_{f}$ are the network and fluid stresses,
  $p$ is the pressure that ensures the incompressibility constraint of the fluid phase,
  $\xi$ is the friction constant per unit volume that couples the network and fluid dynamics, and
  $\boldsymbol {I}$ is the identity matrix. The governing equations form a well-posed linear set of PDEs, when the network stress is modelled using linear VE constitutive equations (CEs). We take the volume fraction of the network phase,
  $\phi$, to remain constant in space and time. Thus the compressibility of the network leads to non-zero divergence of the fluid velocity field:
  $\boldsymbol {\nabla } \boldsymbol {\cdot } \boldsymbol {v}_f =(\phi /(\phi -1))\,\boldsymbol {\nabla } \boldsymbol {\cdot } \boldsymbol {v}_n \neq 0$. However, this apparent fluid compressibility is not associated with changes in fluid density, and arises from fluid sources and sinks in response to changes in the volume of the network phase. As such, the Newtonian fluid stress does not include the isotropic term that scales with
  $\eta _b (\boldsymbol {\nabla }\boldsymbol {\cdot }\boldsymbol {v}_f)$, where
  $\eta _b$ is the bulk viscosity.
We use a general linear VE isotropic CE to describe the traceless component of the fluid stress:
 \begin{equation} {\boldsymbol{\sigma}}_f = \int_{0}^t G_f(t-t^\prime) (\boldsymbol{\nabla} {\boldsymbol{v}}_f (t^\prime)+ \boldsymbol{\nabla}{\boldsymbol{v}}_f^{\rm T} (t^\prime)) \mathrm{d} t^\prime, \end{equation}
where  $G_f(t)$ is the fluid's shear modulus, and superscript
  ${\rm T}$ denotes the transpose operation. Similarly, we model the network stress
  $\boldsymbol {\sigma }_n$ using a general linear VE isotropic CE:
 \begin{equation} {\boldsymbol{\sigma}}_n = \int_{0}^t [G(t-t^\prime) \left(\boldsymbol{\nabla}{\boldsymbol{v}}_n (t^\prime)+ \boldsymbol{\nabla}{\boldsymbol{v}}_n^{\rm T} (t^\prime) \right) + \lambda(t-t^\prime)\left(\boldsymbol{\nabla}\boldsymbol{\cdot} \boldsymbol{v}_n(t^\prime)\right)\boldsymbol{I}] \mathrm{d} t^\prime, \end{equation}
where,  $G(t)$ and
  $\lambda (t)$ are the time-dependent first and second Lamé coefficients. For a linear elastic network, these coefficients are related through the Poisson ratio
  $\nu$:
  $\lambda ={2G\nu }/{(1-2\nu )}$. Taking the Laplace transform of (2.2) and (2.3) yields
  $\tilde {\boldsymbol {\sigma }}_f=\tilde {\eta }(s)\,(\boldsymbol {\nabla } \tilde {\boldsymbol {v}}_f+\boldsymbol {\nabla } \tilde {\boldsymbol {v}}^{\rm T}_f)$ and
  $\tilde {\boldsymbol {\sigma }}_n(s)=\tilde {G}(s)\,(\boldsymbol {\nabla } \tilde {\boldsymbol {v}}_n+\boldsymbol {\nabla } \tilde {\boldsymbol {v}}^{\rm T}_n)+\tilde {\lambda }(s)\,(\boldsymbol {\nabla }\boldsymbol {\cdot } \tilde {\boldsymbol {v}}_n)$, where
  $\sim$ denotes variables in Laplace space (
 $s$-space), and
  $\tilde {\eta }(s)=\mathcal {L}[G_f(t)]$. Substituting these expressions in the Laplace transform of (2.1) gives
 $$\begin{gather} \boldsymbol{\nabla}\boldsymbol{\cdot} \left( {\tilde{\boldsymbol{v}}}_n \phi + {\tilde{\boldsymbol{v}}}_f (1- \phi) \right) =0 , \end{gather}$$
 $$\begin{gather}\tilde{\eta} (s)\,{\nabla}^2 {\tilde{\boldsymbol{v}}}_f + \xi (\tilde{\boldsymbol{v}}_n - \tilde{\boldsymbol{v}}_f ) - (1- \phi )\,\boldsymbol{\nabla} \tilde{p} =\boldsymbol{0} , \end{gather}$$
 $$\begin{gather}\tilde{G}(s)\,{\nabla}^2 \tilde{\boldsymbol{v}}_n + (\tilde{\lambda}(s) +\tilde{G}(s)) \boldsymbol{\nabla} (\boldsymbol{\nabla}\boldsymbol{\cdot}\tilde{\boldsymbol{v}}_n ) - \xi (\tilde{\boldsymbol{v}}_n - \tilde{\boldsymbol{v}}_f ) - \phi\, \boldsymbol{\nabla} \tilde{p}=\boldsymbol{0}. \end{gather}$$
 Next, we introduce  $q:= -\boldsymbol {\nabla }\boldsymbol {\cdot } \tilde {\boldsymbol {v}}_n$. Using (2.4a), we get
  $\boldsymbol {\nabla } \boldsymbol {\cdot } \tilde {\boldsymbol {v}}_f= -\varepsilon q$, where
  $\varepsilon = {\phi }/{(\phi -1)}$. We then take the divergence of (2.4b), and (2.4c), and add them to get
 \begin{equation} {\nabla}^2 \varPhi =0 ,\quad \text{where}\ \varPhi := (\varepsilon \tilde{\eta} + (\tilde{\lambda} +2\tilde{G}) ) q + \tilde{p}. \end{equation}
The general solution of the Laplace equation in spherical coordinates is
 \begin{equation} \varPhi(r,\theta,\varphi)=\sum_{\ell=0}^\infty \sum_{m={-}\ell}^{m=\ell} \left[D_{\ell ,m}^{{\pm}} \begin{pmatrix} r^{\ell} \\ r^{-\ell -1} \end{pmatrix}\right] Y_{\ell ,m}(\theta,\varphi), \end{equation}
where  $Y_{\ell, m}=P_{\ell }^m (\cos \theta )\,{\mathrm {e}}^{{\rm i} m \varphi }$ is the scalar spherical harmonic function of degree
  $\ell$ and order
  $m$,
$m$,  $P_{\ell }^m$ is the associated Legendre function of degree
  $\ell$ and order
  $m$,
$m$,  $\theta \in [0,{\rm \pi} ]$ is the polar angle, and
  $\varphi \in [0,2{\rm \pi} )$ is the azimuthal angle;
  $r^{\ell }$ and
  $r^{-\ell -1}$ are two linearly independent functions describing the variation of
  $\varPhi$ in the radial direction. For brevity, we have presented these two functions in the array format
  $(\ )^{\pm }$, where
  $D^+$ (
 $D^-$) are the coefficients associated with the function in the first (second) row, to be determined through imposing BCs. The first row contains the internal solutions (the functions are finite when
  $r\to 0$ and are unbounded as
  $r\to \infty$), and the second row contains the external solutions (the functions decay to zero as
  $r\to \infty$ and are singular as
  $r\to 0$). This notation is used throughout the paper.
Eliminating the pressure term, after applying the divergence operator to the network and fluid phases, produces a modified Helmholtz equation for  $q$:
$q$:
 \begin{equation} {\nabla}^2 q - {\alpha}_{\varepsilon}^2 q=0,\quad \text{where}\ {\alpha}_{\varepsilon}^2(s) = \frac{\xi {(1- \varepsilon)}^2}{ \tilde{\lambda}(s) +2\tilde{G}(s) + {\varepsilon}^2 \tilde{\eta} }.\end{equation}
The general solution for  $q$, in spherical coordinates, can be expressed as
 \begin{equation} q(r,\theta,\varphi)=\sum_{\ell=0}^\infty \sum_{m={-}\ell}^{m=\ell}\left[ E_{\ell ,m}^{{\pm}} \begin{pmatrix} {{\mathsf{i}}}_{\ell } ({\alpha}_{\varepsilon} r) \\ {{\mathsf{k}}}_{\ell } ({\alpha}_{\varepsilon} r) \end{pmatrix} \right] Y_{\ell ,m} (\theta , \varphi), \end{equation}
where  ${{\mathsf{i}}}_{\ell } ({\alpha }_{\varepsilon } r)= \sqrt {{{\rm \pi} }/{2 {\alpha }_{\varepsilon } r}}\,I_{\ell +{1}/{2}} ({\alpha }_{\varepsilon } r)$, and
  ${{\mathsf{k}}}_{\ell } ({\alpha }_{\varepsilon } r)= \sqrt {{2}/{{\rm \pi} {\alpha }_{\varepsilon } r}}\,K_{\ell +{1}/{2}} ({\alpha }_{\varepsilon } r)$, are modified spherical Bessel functions of the first and second kind, respectively (Arfken & Weber Reference Arfken and Weber1999). Taking the general solution of the Laplace equation for
  $\varPhi$, and the modified Helmholtz equation for
  $q$, in spherical coordinates, we can express the pressure as
 \begin{align} \tilde{p} (r,\theta , \varphi)= \sum_{\ell=0}^\infty \sum_{m={-}\ell}^{m=\ell} \left[D_{\ell ,m}^{{\pm}} \begin{pmatrix} r^{\ell} \\ r^{-\ell -1} \end{pmatrix} - ( \varepsilon \tilde{\eta} + \tilde{\lambda} +2\tilde{G} ) \begin{pmatrix} {{\mathsf{i}}}_{\ell } ({\alpha}_{\varepsilon} r) \\ {{\mathsf{k}}}_{\ell } ({\alpha}_{\varepsilon} r) \end{pmatrix} E_{\ell ,m}^{{\pm}} \right] Y_{\ell ,m} (\theta , \varphi). \end{align}
 Next, we introduce  ${\boldsymbol {v}}^{+} := \tilde {\eta } \tilde {\boldsymbol {v}}_f + \tilde {G} \tilde {\boldsymbol {v}}_n$ and
  ${\boldsymbol {v}}^{-} := \tilde {\boldsymbol {v}}_f - \tilde {\boldsymbol {v}}_n$. After summation and subtraction of (2.4b) and (2.4c), and a few lines of algebra, we arrive at the following equations for
  $\boldsymbol {v}^{+}$ and
  $\boldsymbol {v}^{-}$:
 $$\begin{gather} {\nabla}^2 {\boldsymbol{v}}^{+} - \boldsymbol{\nabla} (\boldsymbol{\nabla} \boldsymbol{\cdot}{\boldsymbol{v}}^{+}) = \boldsymbol{\nabla} \varPhi, \end{gather}$$
 $$\begin{gather}{\nabla}^2 {\boldsymbol{v}}^{-} + \frac{{\gamma}_{\varepsilon}}{1- \varepsilon}\,\boldsymbol{\nabla} (\boldsymbol{\nabla}\boldsymbol{\cdot} {\boldsymbol{v}}^{-} ) - {\beta}^2 {\boldsymbol{v}}^{-} = \frac{1}{\widetilde{{\eta}}_{\varepsilon}}\,\boldsymbol{\nabla} \varPhi, \end{gather}$$
where
 \begin{align*} {\beta }^2 = \xi \left(\frac{1}{\tilde {G}} + \frac{1}{\tilde {\eta }}\right),\quad \frac{1}{{\tilde {\eta }}_{\varepsilon }} = \frac{1}{1-\varepsilon} \left(\frac{1}{\tilde {\eta }} + \frac{\varepsilon }{\tilde {G}}\right) \end{align*}
and
 \begin{align*} {\gamma }_{\varepsilon } =\frac{\tilde {\lambda } +\tilde {G}}{\tilde {G}} + \frac{\tilde {\eta } }{1- \varepsilon } \left[ \left( \varepsilon + \frac{\tilde {\lambda } +2\tilde {G}}{\tilde {\eta}} \right) \left(\frac{1}{\tilde {\eta }} + \frac{\varepsilon }{\tilde {G}}\right)\right]. \end{align*}
We note that  ${\alpha }_{\varepsilon }^2 = {(1- \varepsilon )}{\beta }^2/{(1- \varepsilon + {\gamma }_{\varepsilon })}$. The general solutions for
  ${\boldsymbol {v}}^{+}$ and
  ${\boldsymbol {v}}^{-}$ are:
 \begin{align} {\boldsymbol{v}}^{+} & = \sum_{\ell=0}^\infty \sum_{m={-}\ell}^{m=\ell} \left\{\begin{pmatrix} r^{\ell} \\ r^{-\ell -1} \end{pmatrix} \left[ A_{\ell ,m}^{{\pm}} \sqrt{\ell (\ell +1)}\,{\boldsymbol{C}}_{\ell ,m} \vphantom{\begin{pmatrix} (\ell +1) {\boldsymbol{P}}_{\ell +1,m} + \sqrt{(\ell +1)(\ell +2)} {\boldsymbol{B}}_{\ell +1,m} \\ - \ell {\boldsymbol{P}}_{\ell -1,m} + \sqrt{\ell (\ell -1)} {\boldsymbol{B}}_{\ell -1,m} \end{pmatrix}}\right.\right. \nonumber\\ &\quad \left.\left.{}+ B_{\ell ,m}^{{\pm}} \begin{pmatrix} (\ell +1) {\boldsymbol{P}}_{\ell +1,m} + \sqrt{(\ell +1)(\ell +2)}\,{\boldsymbol{B}}_{\ell +1,m} \\ - \ell {\boldsymbol{P}}_{\ell -1,m} + \sqrt{\ell (\ell -1)}\,{\boldsymbol{B}}_{\ell -1,m} \end{pmatrix}\right] \right.\nonumber\\ &\quad + \left. D_{\ell ,m}^{{\pm}} \begin{pmatrix} r^{\ell +1} \\ r^{-\ell } \end{pmatrix} \begin{pmatrix} \dfrac{1}{2(2\ell +3)} \\ \dfrac{1}{2(2\ell -1)} \end{pmatrix} \begin{pmatrix} \ell {\boldsymbol{P}}_{\ell ,m} + \dfrac{\ell +3 }{\ell +1} \sqrt{\ell (\ell +1)}\,{\boldsymbol{B}}_{\ell ,m} \\ (\ell +1) {\boldsymbol{P}}_{\ell ,m} + \dfrac{2- \ell}{ \ell} \sqrt{\ell (\ell +1)}\,{\boldsymbol{B}}_{\ell ,m} \end{pmatrix} \right.\nonumber\\ &\quad - \left. \frac{\varepsilon \tilde{\eta} +\tilde{G}}{{\alpha}_{\varepsilon}^2}\, E_{\ell ,m}^{{\pm}} \left[ \frac{\mathrm{d}}{\mathrm{d} r} \begin{pmatrix} {{\mathsf{i}}}_{\ell } ({\alpha}_{\varepsilon} r) \\ {{\mathsf{k}}}_{\ell } ({\alpha}_{\varepsilon} r) \end{pmatrix} {\boldsymbol{P}}_{\ell ,m}+ \frac{1}{r} \begin{pmatrix} {{\mathsf{i}}}_{\ell } ({\alpha}_{\varepsilon} r) \\ {{\mathsf{k}}}_{\ell } ({\alpha}_{\varepsilon} r) \end{pmatrix} \sqrt{\ell(\ell +1)}\,{\boldsymbol{B}}_{\ell ,m}\right]\right\}, \end{align}
 \begin{align} {\boldsymbol{v}}^{-} & = \sum_{\ell=0}^\infty \sum_{m={-}\ell}^{m=\ell} \left\{{A'}_{\ell ,m}^{{\pm}} \begin{pmatrix} {{\mathsf{i}}}_{\ell } (\beta r) \\ {{\mathsf{k}}}_{\ell } (\beta r) \end{pmatrix} \sqrt{\ell (\ell +1)}\,{\boldsymbol{C}}_{\ell ,m} \right. \nonumber\\ &\quad \left.{}+ {B '}_{\ell ,m}^{{\pm}} \left[\ell (\ell +1) {\boldsymbol{P}}_{\ell ,m}\,\frac{1}{\beta r} \begin{pmatrix} {{\mathsf{i}}}_{\ell } (\beta r) \\ {{\mathsf{k}}}_{\ell } (\beta r) \end{pmatrix} + \sqrt{\ell (\ell +1)}\,{\boldsymbol{B}}_{\ell ,m} \right.\right. \nonumber\\ &\quad \left.{}\times \left(\frac{\mathrm{d}}{\mathrm{d} (\beta r)} \begin{pmatrix} {{\mathsf{i}}}_{\ell } (\beta r) \\ {{\mathsf{k}}}_{\ell } (\beta r) \end{pmatrix} + \frac{1}{\beta r} \begin{pmatrix} {{\mathsf{i}}}_{\ell } (\beta r) \\ {{\mathsf{k}}}_{\ell } (\beta r) \end{pmatrix}\right)\right] \nonumber\\ &\quad - \frac{1}{ {\tilde{\eta}}_{\varepsilon} {\beta}^2}\,{D}_{\ell ,m}^{{\pm}} \begin{pmatrix} r^{\ell -1} \\ r^{-\ell -2} \end{pmatrix} \begin{pmatrix} \ell {\boldsymbol{P}}_{\ell ,m} + \sqrt{\ell (\ell +1)}\,{\boldsymbol{B}}_{\ell ,m} \\ -(\ell +1) {\boldsymbol{P}}_{\ell ,m} + \sqrt{\ell (\ell +1)}\,{\boldsymbol{B}}_{\ell ,m} \end{pmatrix} \nonumber\\ &\quad \left.{}-\frac{ \varepsilon -1 }{ {\alpha}_{\varepsilon}^2 }\,{E}_{\ell ,m}^{{\pm}} \left[\frac{\mathrm{d}}{\mathrm{d} r} \begin{pmatrix} {{\mathsf{i}}}_{\ell } ( {\alpha}_{\varepsilon} r) \\ {{\mathsf{k}}}_{\ell } ( {\alpha}_{\varepsilon} r) \end{pmatrix} {\boldsymbol{P}}_{\ell ,m} + \frac{1}{r} \begin{pmatrix} {{\mathsf{i}}}_{\ell } ( {\alpha}_{\varepsilon} r) \\ {{\mathsf{k}}}_{\ell } ( {\alpha}_{\varepsilon} r) \end{pmatrix} \sqrt{\ell (\ell +1)}\,{\boldsymbol{B}}_{\ell ,m}\right]\right\}, \end{align}
where
 $$\begin{gather} {\boldsymbol{P}}_{\ell ,m} = Y_{\ell ,m} (\theta ,\varphi)\,\hat{\boldsymbol{r}} , \end{gather}$$
 $$\begin{gather}{\boldsymbol{B}}_{\ell ,m} =\frac{1}{\sqrt{\ell (\ell +1)}} \left[ \frac{\partial }{\partial \theta} \hat{\boldsymbol{\theta}} + \frac{1}{\sin \theta}\,\frac{\partial }{\partial \varphi} \widehat{\boldsymbol{\varphi}} \right] Y_{\ell,m} (\theta , \varphi) , \end{gather}$$
 $$\begin{gather}{\boldsymbol{C}}_{\ell ,m} = \frac{1}{\sqrt{\ell (\ell +1)}} \left[\frac{1}{\sin \theta}\,\frac{\partial }{\partial \varphi} \hat{\boldsymbol{\theta}} - \frac{\partial }{\partial \theta} \widehat{\boldsymbol{\varphi}} \right] Y_{\ell,m} (\theta , \varphi) \end{gather}$$
are scaloidal–poloidal–toroidal representations of mutually orthogonal vector spherical harmonics that are used commonly to express the solutions to vector Laplace and Helmholtz equations in spherical coordinates (Morse & Feshbach Reference Morse and Feshbach1953), and  $A_{\ell,m}^{\pm }$,
  $B_{\ell,m}^{\pm }$,
  ${A'}_{\ell,m}^{\pm }$,
  ${B'}_{\ell,m}^{\pm }$,
  $D_{\ell,m}^{\pm }$ and
  $E_{\ell,m}^{\pm }$ are 12 constants to be determined from BCs; the solution details are given in Appendix A. Substituting these expressions in relations
  $\tilde {\boldsymbol {v}}_f = ({\boldsymbol {v}}^{+} + \tilde {G} {\boldsymbol {v}}^{-} )/(\tilde {\eta } + \tilde {G})$ and
  $\tilde {\boldsymbol {v}}_n = ({\boldsymbol {v}}^{+} - \eta {\boldsymbol {v}}^{-} )/(\tilde {\eta } + \tilde {G})$ gives the fluid and network velocity (or displacement) fields in
  $s$-space, which we do not produce here for brevity.
2.1. Axisymmetric solutions
The general solutions for  $\tilde {\boldsymbol {v}}_f$ and
  $\tilde {\boldsymbol {v}}_n$ can be used to obtain analytical expressions for a variety of problems involving spherical geometries. Several applications of Lamb's general solution for Stokes flow may be found in Happel & Brenner (Reference Happel and Brenner2012) and Kim & Karrila (Reference Kim and Karrila2013); the analytical solutions of poroelastic equations using Biot's general solution, which neglects the fluid shear forces, are surveyed in Detournay & Cheng (Reference Detournay and Cheng1993) and Cheng (Reference Cheng2016). The majority of these solutions involve axisymmetric geometries, i.e.
  $\partial _{\varphi } v_r = \partial _{\varphi } v_{\theta } =0$, and
  ${v}_\varphi =0$. This is achieved when the summation index is
  $m=0$ in (2.11) and (2.12), and
  ${A}_{\ell m}^{\pm }={A'}_{\ell m}^{\pm }=0$. The axisymmetric forms of the fluid and network velocities in Laplace space simplify to
 \begin{align} \tilde{v}_{r,f} &= \frac{1}{\tilde{\eta} +\tilde{G}} \left[\sum_{\ell =0}^{\infty} \left\{\begin{pmatrix} {B}_{\ell -1}^{+}\\{B}_{\ell +1}^{-} \end{pmatrix} \begin{pmatrix} \ell r^{\ell -1} \\ -(\ell +1) r^{-\ell -2} \end{pmatrix} + {B'}_{\ell}^{{\pm}}\, \frac{\ell (\ell +1) \tilde{G}}{\beta r} \begin{pmatrix} {{\mathsf{i}}}_{\ell } (\beta r) \\ {{\mathsf{k}}}_{\ell } (\beta r) \end{pmatrix} \vphantom{\begin{pmatrix} \dfrac{\ell +3}{2(\ell +1)(2\ell +3)} r^2 - \dfrac{\tilde{G}}{{\tilde{\eta}}_{\varepsilon} {\beta}^2} \\ \dfrac{2- \ell}{2 \ell (2\ell -1)} r^2 - \dfrac{\tilde{G}}{{\tilde{\eta}}_{\varepsilon} {\beta}^2} \end{pmatrix}}\right.\right.\nonumber\\ &+ D_{\ell }^{{\pm}} \begin{pmatrix} r^{\ell -1} \\ r^{-\ell -2} \end{pmatrix} \begin{pmatrix} \dfrac{\ell}{2(2\ell +3)}\,r^2 - \dfrac{G}{{\tilde{\eta}}_{\varepsilon} {\beta}^2}\,\ell \\ \dfrac{\ell +1}{2(2\ell -1)}\,r^2 + \dfrac{\tilde{G}}{ {\tilde{\eta}}_{\varepsilon} {\beta}^2}\,(\ell +1) \end{pmatrix} \left.\left.\vphantom{\begin{pmatrix} \dfrac{\ell +3}{2(\ell +1)(2\ell +3)} r^2 - \dfrac{\tilde{G}}{{\tilde{\eta}}_{\varepsilon} {\beta}^2} \\ \dfrac{2- \ell}{2 \ell (2\ell -1)} r^2 - \dfrac{\tilde{G}}{{\tilde{\eta}}_{\varepsilon} {\beta}^2} \end{pmatrix}} - \frac{\varepsilon (\tilde{\eta} +\tilde{G})}{{\alpha}_{\varepsilon}^2}\,{E}_{\ell}^{{\pm}}\, \frac{\mathrm{d}}{\mathrm{d}r} \begin{pmatrix} {{\mathsf{i}}}_{\ell } ( {\alpha}_{\varepsilon} r) \\ {{\mathsf{k}}}_{\ell } ( {\alpha}_{\varepsilon} r) \end{pmatrix} \right\} P_{\ell} (\cos\theta) \right], \end{align}
 \begin{align} \tilde{v}_{\theta ,f} &= \frac{1}{\tilde{\eta} +\tilde{G}} \left[\sum_{\ell =1 }^{\infty} \left\{ \begin{pmatrix} {B}_{\ell -1}^{+} \\ {B}_{\ell +1}^{-} \end{pmatrix} \begin{pmatrix} r^{\ell -1} \\ r^{-\ell -2} \end{pmatrix} + {B'}_{\ell}^{{\pm}}\,\frac{\tilde{G}}{\beta } \left[\frac{\mathrm{d}}{\mathrm{d}r} \begin{pmatrix} {{\mathsf{i}}}_{\ell } (\beta r) \\ {{\mathsf{k}}}_{\ell } (\beta r) \end{pmatrix} + \frac{1}{r} \begin{pmatrix} {{\mathsf{i}}}_{\ell } (\beta r) \\ {{\mathsf{k}}}_{\ell } (\beta r) \end{pmatrix} \right] \vphantom{\begin{pmatrix} \dfrac{\ell +3}{2(\ell +1)(2\ell +3)} r^2 - \dfrac{\tilde{G}}{{\tilde{\eta}}_{\varepsilon} {\beta}^2} \\ \dfrac{2- \ell}{2 \ell (2\ell -1)} r^2 - \dfrac{\tilde{G}}{{\tilde{\eta}}_{\varepsilon} {\beta}^2} \end{pmatrix}}\right.\right.\nonumber\\ &\quad +\left.\left. D_{\ell }^{{\pm}} \begin{pmatrix} r^{\ell -1} \\ r^{-\ell -2} \end{pmatrix} \begin{pmatrix} \dfrac{\ell +3}{2(\ell +1)(2\ell +3)}\,r^2 - \dfrac{\tilde{G}}{{\tilde{\eta}}_{\varepsilon} {\beta}^2} \\ \dfrac{2- \ell}{2 \ell (2\ell -1)}\,r^2 - \dfrac{\tilde{G}}{{\tilde{\eta}}_{\varepsilon} {\beta}^2} \end{pmatrix} - \frac{\varepsilon (\tilde{\eta} +\tilde{G})}{{\alpha}_{\varepsilon}^2}\,{E}_{\ell}^{{\pm}}\,\frac{1}{r} \begin{pmatrix} {{\mathsf{i}}}_{\ell } ({\alpha}_{\varepsilon} r) \\ {{\mathsf{k}}}_{\ell } ( {\alpha}_{\varepsilon} r) \end{pmatrix}\right\} \frac{\mathrm{d}}{\mathrm{d}\theta} P_{\ell} (\cos\theta)\right], \end{align}
 \begin{align} \tilde{v}_{r,n} &= \frac{1}{\tilde{\eta} + \tilde{G}} \left[\sum_{\ell =0}^{\infty} \left\{ \begin{pmatrix} {B}_{\ell -1}^{+}\\ {B}_{\ell +1}^{-} \end{pmatrix} \begin{pmatrix} \ell r^{\ell -1} \\ -(\ell +1) r^{-\ell -2} \end{pmatrix} - {B'}_{\ell}^{{\pm}}\,\frac{\ell (\ell +1) \tilde{\eta}}{\beta r} \begin{pmatrix} {{\mathsf{i}}}_{\ell } (\beta r) \\ {{\mathsf{k}}}_{\ell } (\beta r) \end{pmatrix}\right.\right.\nonumber\\ &\quad + \left.\left. D_{\ell }^{{\pm}} \begin{pmatrix} r^{\ell -1} \\ r^{-\ell -2} \end{pmatrix} \begin{pmatrix} \dfrac{\ell}{2(2\ell +3)}\,r^2 + \dfrac{\tilde{\eta}}{{\tilde{\eta}}_{\varepsilon} {\beta}^2}\,\ell \\ \dfrac{\ell +1}{2(2\ell -1)}\,r^2 - \dfrac{\tilde{\eta}}{{\tilde{\eta}}_{\varepsilon} {\beta}^2}\,(\ell +1) \end{pmatrix} - \frac{ \tilde{\eta} + \tilde{G} }{{\alpha}_{\varepsilon}^2}\,{E}_{\ell}^{{\pm}}\, \frac{\mathrm{d}}{\mathrm{d}r} \begin{pmatrix} {{\mathsf{i}}}_{\ell } ( {\alpha}_{\varepsilon} r) \\ {{\mathsf{k}}}_{\ell } ( {\alpha}_{\varepsilon} r) \end{pmatrix} \right\} P_{\ell} (\cos\theta) \right], \end{align}
 \begin{align} \tilde{v}_{\theta ,n} &= \frac{1}{\tilde{\eta} +\tilde{G}} \left[ \sum_{\ell =1 }^{\infty} \left\{ \begin{pmatrix} {B}_{\ell -1}^{+} \\ {B}_{\ell +1}^{-} \end{pmatrix} \begin{pmatrix} r^{\ell -1} \\ r^{-\ell -2} \end{pmatrix} - {B'}_{\ell}^{{\pm}}\,\frac{\tilde{\eta}}{\beta } \left[\frac{\mathrm{d}}{\mathrm{d}r} \begin{pmatrix} {{\mathsf{i}}}_{\ell } (\beta r) \\ {{\mathsf{k}}}_{\ell } (\beta r) \end{pmatrix} + \frac{1}{r} \begin{pmatrix} {{\mathsf{i}}}_{\ell } (\beta r) \\ {{\mathsf{k}}}_{\ell } (\beta r) \end{pmatrix} \right] \vphantom{\begin{pmatrix} \dfrac{\ell +3}{2(\ell +1)(2\ell +3)} r^2 - \dfrac{\tilde{G}}{{\tilde{\eta}}_{\varepsilon} {\beta}^2} \\ \dfrac{2- \ell}{2 \ell (2\ell -1)} r^2 - \dfrac{\tilde{G}}{{\tilde{\eta}}_{\varepsilon} {\beta}^2} \end{pmatrix}}\right.\right.\nonumber\\ &\quad +\left.\left. D_{\ell }^{{\pm}} \begin{pmatrix} r^{\ell -1} \\ r^{-\ell -2} \end{pmatrix} \begin{pmatrix} \dfrac{\ell +3}{2(\ell +1)(2\ell +3)}\,r^2 + \dfrac{\tilde{\eta}}{{\tilde{\eta}}_{\varepsilon} {\beta}^2} \\ \dfrac{2- \ell}{2 \ell (2\ell -1)}\,r^2 + \dfrac{\tilde{\eta}}{{\tilde{\eta}}_{\varepsilon} {\beta}^2} \end{pmatrix} - \frac{ \tilde{\eta} + \tilde{G} }{{\alpha}_{\varepsilon}^2}{E}_{\ell}^{{\pm}}\,\frac{1}{r} \begin{pmatrix} {{\mathsf{i}}}_{\ell } ( {\alpha}_{\varepsilon} r) \\ {{\mathsf{k}}}_{\ell } ( {\alpha}_{\varepsilon} r) \end{pmatrix} \right\} \frac{\mathrm{d}}{\mathrm{d}\theta} P_{\ell} (\cos\theta)\right]. \end{align}
We note that fluid velocity dependency on the network compressibility (through  ${\alpha }_{\varepsilon }$) is proportional to
  $\phi \sim \varepsilon \ll 1$ and thus negligible in most physiologically relevant conditions. In the next section, we use the axisymmetric solutions to study the dynamics of a spherical bead moving within a PVE medium, and provide an exact solution of the equations subject to appropriate BCs. Moreover, we discuss the differences between the dynamics of the sphere moving in VE and PVE materials in the context of single-particle and two-point MR.
3. A rigid sphere moving a network that is permeated by a fluid
Consider a rigid sphere moving with time-dependent velocity  $U (t)\, \hat {\boldsymbol {z}}$ in an unbounded PVE medium. We assume that the size of the sphere is larger than the typical mesh size of the background network, and assume no-slip BCs for both the network and fluid velocity fields:
 \begin{equation} \text{at}\ r=a:\quad \tilde{v}_{r,f}=\tilde{v}_{r,n}=\tilde{U}(s)\cos \theta,\quad \tilde{v}_{\theta,f}=\tilde{v}_{\theta,n} ={-}\tilde{U}(s)\sin \theta. \end{equation}
Note that these BCs are accurate only when the interface is between an elastic (or rigid) domain and a PVE domain. The BCs become more involved at fluid–PVE and PVE–PVE interfaces (Feng & Young Reference Feng and Young2020). Since the velocity field must decay to zero at infinity, and functions corresponding to internal solutions are all unbounded as  $r\to \infty$, their corresponding coefficients (
 $+$ superscript) are identically zero.
Applying no-slip BCs (3.1a,b) to the axisymmetric solutions for the fluid and network, we get
 \begin{align} \tilde{v}_{r,f} &= \frac{a}{{\beta}^2 r^3}\,\frac{\tilde{U}(s)}{{\varDelta}_{\varepsilon}} \left[ g_1 + (1-\varepsilon) {\tau}_{\varepsilon} (3 r^2 - a^2) {\beta}^2 g_2 -3\, \frac{{\alpha}_{\varepsilon}^2}{{\beta}^2}\,(1-\varepsilon) \,{\rm e}^{-\beta (r-a)} (1+ \beta r) \right. \nonumber\\ &\quad \left.\vphantom{\frac{{\alpha}_{\varepsilon}^2}{{\beta}^2}} -\varepsilon g_3 + 3\varepsilon (1+\tau) \exp({- {\alpha}_{\varepsilon} (r-a)}) (2+ 2{\alpha}_{\varepsilon} r + {\alpha}_{\varepsilon}^2 r^2) \right] \cos\theta, \end{align}
 \begin{align} \tilde{v}_{\theta ,f} &= \frac{a}{2{\beta}^2 r^3}\,\frac{\tilde{U}(s)}{{\varDelta}_{\varepsilon}} \left[g_1 - (1-\varepsilon) {\tau}_{\varepsilon} (3 r^2 + a^2) {\beta}^2 g_2 \vphantom{\frac{{\alpha}_{\varepsilon}^2}{{\beta}^2}}\right. \nonumber\\ &\quad -3\,\frac{{\alpha}_{\varepsilon}^2}{{\beta}^2}\,(1-\varepsilon) \,{\rm e}^{-\beta (r-a)} (1+ \beta r + {\beta}^2 r^2) \nonumber\\ &\quad\left.\vphantom{\frac{{\alpha}_{\varepsilon}^2}{{\beta}^2}} -\varepsilon g_3 + 6\varepsilon (1+\tau) \exp({- {\alpha}_{\varepsilon} (r-a)}) (1+ {\alpha}_{\varepsilon} r ) \right] \sin\theta, \\ \tilde{v}_{r,n} &= \frac{a}{{\beta}^2 r^3}\,\frac{\tilde{U}(s)}{{\varDelta}_{\varepsilon}} \left[{-}g_4 + (1-\varepsilon) {\tau}_{\varepsilon} (3 r^2 - a^2) {\beta}^2 g_2 +3\, \frac{{\alpha}_{\varepsilon}^2}{{\beta}^2}\,\tau (1-\varepsilon) \,{\rm e}^{-\beta (r-a)} (1+ \beta r) \right. \nonumber\\ &\quad\left.\vphantom{\frac{{\alpha}_{\varepsilon}^2}{{\beta}^2}} +\varepsilon \tau g_1 + 3 (1+\tau) \exp({- {\alpha}_{\varepsilon} (r-a)}) (2+ 2{\alpha}_{\varepsilon} r + {\alpha}_{\varepsilon}^2 r^2) \right] \cos\theta, \\ \tilde{v}_{\theta ,n} &= \frac{a}{2{\beta}^2 r^3}\,\frac{\tilde{U}(s)}{{\varDelta}_{\varepsilon}} \left[{-}g_4 - (1-\varepsilon) {\tau}_{\varepsilon} (3 r^2 + a^2) {\beta}^2 g_2 \vphantom{\frac{{\alpha}_{\varepsilon}^2}{{\beta}^2}}\right. \nonumber\\ &\quad +3\,\frac{{\alpha}_{\varepsilon}^2}{{\beta}^2}\,\tau (1-\varepsilon) \,{\rm e}^{-\beta (r-a)} (1+ \beta r + {\beta}^2 r^2) \nonumber\\ &\quad \left.\vphantom{\frac{{\alpha}_{\varepsilon}^2}{{\beta}^2}} +\varepsilon \tau g_1 + 6 (1+\tau) \exp({- {\alpha}_{\varepsilon} (r-a)}) (1+ {\alpha}_{\varepsilon} r ) \right] \sin\theta, \end{align}
where  $\tau (s) = {\tilde {\eta }(s)}/{\tilde {G} (s)}$ is the shear relaxation time,
  $\tilde {\eta }_{\varepsilon } = {(1-\varepsilon ) \tilde {\eta }}/{(1+ \varepsilon \,\tau (s))}$, and
  ${\tau }_{\varepsilon } (s)= {\tilde {\eta }_{\varepsilon }}/{\tilde {G}(s)}$. Defining the inverse of permeability as
  ${\beta }_{\circ }^2 = {\xi }/{\tilde {\eta }}$, we have
 \[ {\beta }^2 = {\beta }_{\circ }^{2} (1+\tau (s) ), {\alpha }_{\varepsilon }^2 = {\beta }_{\circ }^{2} \frac{\tau (s)(1-\varepsilon )^2}{\frac{2(1-\nu )}{1-2\nu} + {\varepsilon }^2\,\tau (s)}. \]
The remaining coefficients that appear in (3.2) are given by the expressions
 $$\begin{gather} {\varDelta}_{\varepsilon} = 2 {\tau}_{\varepsilon} (1-\varepsilon) (1+ a {\alpha}_{\varepsilon}) + \frac{{\alpha}_{\varepsilon}^2}{{\beta}^2} (1+ \varepsilon \tau + {\tau}_{\varepsilon} (1-\varepsilon) (1+ a\beta + a^2 {\beta}^2)), \end{gather}$$
 $$\begin{gather}g_1 = \frac{{\alpha}_{\varepsilon}^2}{{\beta}^2}\,(3+3a \beta + a^2 {\beta}^2),\quad g_2 = 1+ a {\alpha}_{\varepsilon} + \frac{1}{2}\,\frac{{\alpha}_{\varepsilon}^2}{{\beta}^2}\, (1+ a\beta + a^2 {\beta}^2), \end{gather}$$
 $$\begin{gather}g_3 = 6(1+\tau) (1+ a {\alpha}_{\varepsilon}) + 2 \tau a^2 {\alpha}_{\varepsilon}^2 + 3\, \frac{{\alpha}_{\varepsilon}^2}{{\beta}^2}\,(1+ a\beta + a^2 {\beta}^2), \end{gather}$$
 $$\begin{gather}g_4 = 6(1+\tau) (1+ a {\alpha}_{\varepsilon}) + 2 a^2{\alpha}_{\varepsilon}^2 + 3 \tau\,\frac{{\alpha}_{\varepsilon}^2}{{\beta}^2}\,(1+ a\beta + a^2 {\beta}^2). \end{gather}$$
Substituting for coefficients in (2.9), the pressure is given by
 \begin{align} \tilde{p} &= \frac{3 a (\tilde{\eta} +\tilde{G})}{2 r^2}\, \frac{\tilde{U}(s)}{{\varDelta}_{\varepsilon}} \left[2 {\tau}_{\varepsilon} (1-\varepsilon) (1+ a {\alpha}_{\varepsilon}) + {\tau}_{\varepsilon}\,\frac{{\alpha}_{\varepsilon}^2}{{\beta}^2}\, (1- \varepsilon) (1+a\beta + a^2 {\beta}^2) \right. \nonumber\\ &\quad \left. {}-2\,\frac{{\alpha}_{\varepsilon}^2}{{\beta}^2}\left(\varepsilon \tau + \frac{\tilde{\lambda}}{\tilde{G}} +2 \right) \exp({-{\alpha}_{\varepsilon} (r-a)}) (1+ {\alpha}_{\varepsilon} r) \right] \cos\theta. \end{align}
The fluid and network stress components, including the traceless and isotropic parts (see Appendix B for explicit expressions of the network and fluid stresses), are
 \begin{gather} \tilde{\sigma}_{rr}^{f} ={-}\tilde{p} (1-\phi)+ 2 \tilde{\eta}\, \frac{\partial \tilde{v}_{r,f}}{\partial r},\\ \tilde{\sigma}_{rr}^{n} = (\tilde{\lambda} + 2\tilde{G})\,\frac{\partial \tilde{v}_{r,n} }{\partial r} + \frac{\tilde{\lambda}}{r} \left( 2 \tilde{v}_{r,n} + \cot\theta\,\tilde{v}_{ \theta ,n} + \frac{\partial}{\partial \theta} \tilde{v}_{ \theta ,n} \right) -\phi \tilde{p}, \\ \tilde{\sigma}_{r\theta}^{f} = \tilde{\eta} \left( \frac{1}{r}\, \frac{\partial \tilde{v}_{r,f}}{\partial \theta} + \frac{\partial \tilde{v}_{\theta , f}}{\partial r} - \frac{\tilde{v}_{\theta , f}}{r}\right),\\ \tilde{\sigma}_{r\theta}^{n}= \tilde{G} \left( \frac{1}{r}\,\frac{\partial \tilde{v}_{r,n}}{\partial\theta} + \frac{\partial \tilde{v}_{ \theta ,n}}{\partial r} - \frac{\tilde{v}_{ \theta ,n}}{r} \right). \end{gather}
 Evaluating these stresses at  $r=a$ and integrating over the sphere surface gives the following relations for the total force from the fluid and network phases:
 \begin{align} \tilde{\boldsymbol{F}}(s) &= \int_{0}^{2{\rm \pi}} \int_{0}^{\rm \pi}((\tilde{\sigma}_{rr}^{f} + \tilde{\sigma}_{rr}^{n}) \hat{\boldsymbol{r}} + ( \tilde{\sigma}_{r\theta}^{f} + \tilde{\sigma}_{r\theta}^{n} ) \hat{\boldsymbol{\theta}}) a^2 \sin\theta \,\mathrm{d}\theta\,\mathrm{d}\varphi =\tilde{R}(s)\,\tilde{U}(s)\,\hat{\boldsymbol{z}}, \end{align}
 \begin{align} \tilde{R}(s) &= 6{\rm \pi}\,\tilde{G}(s)\,a \frac{\left(1+\tau\right)\tau}{{\varDelta}_{\varepsilon}} \left[\frac{\tilde{\eta}_{\varepsilon}}{\tilde\eta}\,(1-\varepsilon) \left(2(1+a {\alpha}_{\varepsilon} ) + \frac{{\alpha}_{\varepsilon}^2}{{\beta}^2}\,(1+ a\beta + a^2 {\beta}^2)\right) \right.\nonumber\\ &\quad \left.{}+ \frac{2}{3}\,\varepsilon\, \frac{{\alpha}_{\varepsilon}^2}{{\beta}^2}\,(1+ a {\alpha}_{\varepsilon})\right], \end{align}
where  $\tilde {R}(s)$ is the response function that we set out to find. Using the fluctuation dissipation theorem (FDT), the measurable mean squared displacement (MSD) can be related to the response function using
  $\langle {\rm \Delta} \tilde {\boldsymbol {r}}^2 \rangle =6k_{B}T\,\tilde {M}(s)/s^2$ (Squires & Mason Reference Squires and Mason2010), where
  $\langle \,\rangle$ denotes ensemble average,
  ${\rm \Delta} \tilde {\boldsymbol {r}}^2$ is the MSD of the spherical probe,
  $\tilde {M}(s)=\tilde {R}^{-1}(s)$ is the sphere's isotropic mobility in Laplace space, and
  $k_{B} T$ is Boltzmann thermal energy. This relation is used to compute
  $\tilde {R}(s)$, which in theory can be used to compute
  $\tilde {G}(s)$,
  $\tilde {\eta }(s)$,
  $\nu$ and
  $\beta _\circ$ in single-particle tracking MR.
In two-point MR, the positional cross-correlations of two fluctuating probes are used to measure the properties of the medium separating them. We can relate these movements to the medium's mechanical properties by applying the FDT, which yields  $\mathcal {L}\langle {\rm \Delta} \boldsymbol {x}_1(0)\,{\rm \Delta} \boldsymbol {x}_2(t)\rangle =6 k_{B} T\,\tilde {\boldsymbol {M}}_{21}(s)/s^2$ (Squires & Mason Reference Squires and Mason2010), where
  $\mathcal {L}$ is the Laplace transform operator, and
  $\tilde {\boldsymbol {M}}_{21}(s)$ is the pair mobility tensor that computes the velocity of particle
  $2$ due to a force on particle
  $1$:
$1$:  $\tilde {\boldsymbol {U}}_2(\boldsymbol {r},s)=\tilde {\boldsymbol {M}}_{21} (\boldsymbol {r},s)\boldsymbol {\cdot }\tilde {\boldsymbol {F}}_1(s)$, where
  $\boldsymbol {r}$ is the pair separation vector. For VE materials, and when the particles are separated by a large distance (
 $r/a\gg 1$), the motion of particle 2 becomes independent of its size and asymptotes to the velocity of the surrounding VE fluid:
  $\tilde {\boldsymbol {U}}_2(\boldsymbol {r},s)\approx \tilde {\boldsymbol {v}}(\boldsymbol {r},s)$.
We use a similar approximation here and assume that particle 2 moves with the network velocity at its centre:  $\boldsymbol {U}_2(\boldsymbol {r})\approx \boldsymbol {v}_n(\boldsymbol {r})$ when
  $r/a\gg 1$. The pair mobility tensor can be expressed in the general form
  $\tilde {\boldsymbol {M}}_{21}=\widetilde {{M}}_{21}^\parallel \hat {\boldsymbol {r}}\hat {\boldsymbol {r}}+\widetilde {{M}}_{21}^\perp (\boldsymbol {I}-\hat {\boldsymbol {r}}\hat {\boldsymbol {r}})$, where
  $\parallel$ and
  $\perp$ denote parallel and perpendicular to the direction of applied force, respectively. Using
  $\tilde {U}(s)=\tilde {M}(s)\,\tilde {F}(s)$ in (3.2), and the above expression for the mobility tensor, we arrive at the expressions
 \begin{equation} \tilde{M}_{21}^\parallel{=}\tilde{M}(s)\,\frac{a}{\beta^2 r^3 \varDelta_\epsilon}\,[\cdots]_{r,n},\quad \tilde{M}_{21}^\perp{=}\tilde{M}(s)\,\frac{a}{2 \beta^2 r^3 \varDelta_\epsilon}\,[\cdots]_{\theta,n}, \end{equation}
where  $[\cdots ]_{r,n}$ and
  $[\cdots ]_{\theta,n}$ are the terms between brackets in (3.2c) and (3.2d). These expressions provide the mathematical framework for analysing two-point MR results.
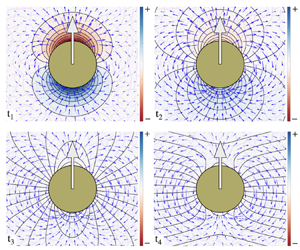
3.1. Results
In this section, we consider the example of a spherical probe moving under constant force  ${\boldsymbol {F}}_{\circ }$, as an analogue to the active MR experiment, within a PVE material composed of a linear elastic network, with shear modulus
  $G$ and Poisson ratio
  $\nu$, and a Newtonian fluid of viscosity
  $\eta$, making
  $\tau (s)=s\eta /G$; see figure 1(a). The probe's velocity and the induced displacements in the network and fluid phases can be computed in Laplace space using (3.6) and (3.2), respectively. We then use Fourier–Euler summation (Abate & Whitt Reference Abate and Whitt1992) to invert numerically the results from
  $s$-space to time-space. The limiting values of all these quantities at
  $t=0$ and
  $t\to \infty$ can be computed analytically using the following limits in
  $s$-space:
  $f(t=0^+) =\lim _{s\to \infty } s\,\tilde {f}(s)$ and
  $f(t\to \infty ) =\lim _{s\to 0} s\,\tilde {f}(s)$ (see Appendix C). Figure 1(b) shows the variations of
  $1-x/x_\infty$ versus
  $t/\tau$ for different values of
  $\beta _0>1$, when
  $\phi \to 0$ and
  $\nu =0.3$ (length is non-dimensionalized with probe radius). Here,
  $x$ is the probe's position,
  ${x}_{\infty }=({{F_{\circ }}}/{6{\rm \pi} G a}) ({(5-6\nu )}/{4(1-\nu )})$ is the long-time position of the probe, and
  $\tau =\eta /G$ is the time scale of shear deformations. Note that the curves in the main figures produce identical results for different values of
  $\tau$ when time is made dimensionless as
  $t/\tau$. The predictions of the VE model (
 $1-x_{{VE}}/{x_\infty }=\textrm {e}^{-t/\tau }$) are displayed as a dashed line. As can be seen, the relaxation at early times is independent of permeability
  $\beta _{\circ }$, and is controlled by
  $\tau$. This is followed by a slow relaxation dynamics, with the relaxation time appearing to increase with permeability
  $\beta _\circ$. Note that
  $1-x/x_\infty \to 0$ as
  $t \to \infty$.

Figure 1. (a) A schematic representation of a rigid spherical probe moving under a constant force in a PVE medium. The sphere moves from  ${{x}}_{\circ }$ at early times to
  ${{x}}_{\infty }$ at long times. Plots of the sphere relaxation
  $1-x(t)/x_\infty$ versus time are shown for: (b) different values of permeability, when
  $\phi \to 0$ and
  $\nu =0.3$; (c) different values of the Poisson ratio, when
  $\phi \to 0$ and
  ${\beta }_{\circ } =2$; and (d) different values of the network volume fraction, when
  $\nu =0.3$ and
  ${\beta }_{\circ } =2$. Each inset figure represents the results of its associated main figure, as a function of rescaled time
  $t/\tau _D$, where
  $\tau _D=a^2/D_q$ is the diffusion time scale of the compressibility field for distance
  $a$, where
  $D_q=\tau ^{-1}\alpha _\epsilon ^{-2}$ is the diffusion coefficient of the network compressibility.
Next, to study the effect of network compressibility, we compute the relaxation dynamics for different values of the Poisson ratio  $\nu$ and a constant permeability
  $\beta _\circ =2$; see figure 1(c). As can be seen, the extent of deformation that follows a slow relaxation dynamics is reduced with increasing
  $\nu$. For
  $\nu =0.49$, which correspond to a nearly incompressible network, the relaxation is given almost entirely by the VE model. This observation suggests that the slow relaxation is induced by network compressibility. An inspection of (2.7) shows that for a linear elastic network and a Newtonian fluid, it is a diffusion equation, with the diffusion coefficient given by
  $D_q=\tau ^{-1} \alpha _\epsilon ^{-2}$. The same equation and concept appear in Biot poroelasticity (Detournay & Cheng Reference Detournay and Cheng1993; Doi Reference Doi2009; Cheng Reference Cheng2016), where
  $D_q$ is sometimes referred to as generalized consolidation coefficient in the soil mechanics literature.
Following this observation, we rescale the time axis of figure 1(b) with  $t/\tau _D$, where
  $\tau _D=a^2/D_q = a^2 {\alpha }_{\varepsilon }^2 \tau$ is the characteristic time scale for the diffusion of network compressibility. Upon this rescaling, all the results collapse to a single line at longer time scales (see the inset of figure 1b), which is consistent with the idea that the slow relaxation is determined by the diffusion of network compressibility and the fluid pressure induced by that. This rescaling did not result in the collapse of the data for different values of
  $\nu$ (see the inset of figure 1c), suggesting a more complex dependency of the dynamics on
  $\nu$. To further clarify the role of shear viscosity, in Appendix D, we include the bead's relaxation dynamics, where we vary only the shear viscosity and keep the rest of the parameters unchanged. As we explained earlier, decreasing the viscosity leads to faster initial relaxation and does not affect the long-time relaxation as long as
  $\xi$ remains unchanged.
In figure 1(d), we study the effect of volume fraction of the network phase on probe dynamics in the range  $0 < \phi \le 0.3$ for the choice
  $\beta _\circ =2$ and
  $\nu =0.3$. The value of
  $\phi$ appears not to change the qualitative behaviour and has only a minor quantitative effect on the overall dynamics. We observe the same weak dependencies for the displacement fields. As such, in the remainder of this paper, we present only the results for
  $\phi \to 0$, which results in
  $\varepsilon =0$,
  $\eta _\varepsilon =\eta$,
  $\tau _\varepsilon =\tau$ and
  $\alpha _\varepsilon =\alpha$.
Note that even though  $\phi \to 0$, the fluid permeability can still be largely affected by the cytoskeletal network. To see this, consider the expression for permeability of a dilute fibrous network in a Newtonian fluid:
  $(\beta _\circ a_f)^{2}={8\phi }/{(-\ln \phi -1.48)}$ (Sangani & Acrivos Reference Sangani and Acrivos1982), where
  $a_f$ is the radius of the fibre. Let us consider microtubules that have the largest radius among the cytoskeletal filaments:
  $a_f \approx 12 \,\textrm {nm}$. Rescaling this expression to the probe's radius – which is the scale of interest here – gives
  $({\beta _\circ } a)^2= ({a}/{a_f})^2({8\phi }/{(-\ln \phi -1.48)})$. Assuming a spherical bead of radius
  $a\sim 1 \,\mathrm {\mu }\textrm {m}$, we see that even for very small volume fractions, we have the likely condition
  $\phi (a/a_f)^2 \gg 1$, which results in
  $\beta _\circ a \gg 1$ and a substantial reduction in fluid permeability by the network in the probe's length scale.
Based on these findings, we provide a recipe for determining the constitutive parameters in an active MR set-up such as the one used here, when the fluid is Newtonian. If the fluid is also VE, then the probe motion alone can determine only the ratio  $\tilde {\eta }(s)/\tilde {G}(s)$ and not the individual terms, and displacement fields will be needed to disentangle the time scales associated with each of the fluid and the network. At very early times, the network is hardly deformed and the probe velocity is determined by the fluid drag force:
  $U (t\to 0)={F}_\circ /(6{\rm \pi} \eta a)$. Measuring
  $U (t=0)$ can thus be used to compute
  $\eta$. At later intermediate times the dynamics is controlled by relaxation of shear modes, allowing us to determine
  $\eta /G(t)$ and thus
  $G(t)$. Having
  $\eta$ and
  $G(t)$, one can compute
  $\nu$ by using the steady-state displacement of the probe:
 \[ {x}_{\infty }=\frac{{F}_{\circ }}{6{\rm \pi} G(t\to \infty ) a} \frac{5-6\nu }{4(1-\nu )}. \]
Finally,  $\beta _{\circ }$ can be determined by fitting (3.6) to the displacement versus time at longer time scales.
We now focus on the network displacement versus time at different, but all large, distances from the probe. Figure 2(a) shows displacement relaxation along the direction of the applied force,  $1-u_{n}^{\parallel }(r)/u_{n}^{\parallel,\infty }$, at different distances from the probe, for
  $\beta _\circ =2$,
  $\nu =0.3$ and
  $\phi \to 0$ (as for the rest of the results). Similar to the probe's dynamics, the relaxation at early times is determined by the shear modes given by the VE model (dashed line). For large
  $r/a$, the time-dependent
  $1-u_{n}^{\parallel }/u_{n}^{\parallel,\infty }$ exhibits a slow relaxation dynamics that varies with separation distance and exhibits a local minimum (a minimum for
  $u_{n}^{\parallel }$) followed by what appears to be a local maximum, noting that
  $1-u_{n}^{\parallel }/u_{n}^{\parallel,\infty } \to 0$ as
  $t\to \infty$.

Figure 2. The relaxation of network displacement fields in response to the moving probe in directions parallel (a) and perpendicular (b) to the applied force, and at different distances from the sphere,  $1-u^{(\parallel,\perp )}_n/u^{(\parallel,\perp ),\infty }_n$. The inset figures show the same results as the associated figures when the time axis is scaled as
  $t/{\tau }_{D}^r$, where
  $\tau _D^r=r^2 {\alpha }^2 \tau$ is the time scale for the network compressibility field to diffuse distance
  $r$ away from the probe. Here, we have taken
  ${\beta }_{\circ }=2$,
  $\phi \to 0$ and
  $\nu =0.3$.
Figure 2(b) shows the displacement relaxation in the direction perpendicular to the applied force,  $u_{n}^{\perp }$, versus time at different values of
  $r$. Unlike the displacements in the parallel direction, we do not observe any local optimum in time. Aside from this difference, the relaxation dynamics follows closely the behaviour that we observed in the parallel direction.
The predicted change in relaxation dynamics with  $r$ is in line with previous experimental results (Rosenbluth et al. Reference Rosenbluth, Crow, Shaevitz and Fletcher2008), where atomic force microscopy (AFM) was used to deform the cell cortex, and the displacements of probe particles were measured at different distances from the AFM tip. Similar to our predictions, the experiments show a fast initial relaxation that is independent of distance from the AFM tip, followed by a significantly slower relaxation dynamics that slows down further with increasing distance from the tip.
To test if the slow relaxation is again controlled by the diffusion of the stress associated with network compressibility, we scale the time axis with the diffusion time scale for travelling the distance  $r$:
$r$:  $\tau _D^{r}=r^2/D_q = r^2 {\alpha }^2 \tau$. Again, we observe a nice collapse of the plots at longer times, which further confirms that slow relaxation dynamics is determined by the diffusion of network compressibility and its associated stresses.
In Appendix D, we present the results of pressure relaxation dynamics induced by the probe's motion under a constant force. In figure 7, we show the relaxation dynamics of the pressure on the surface of the probe and parallel to the applied force ( $p(r=a,\theta =0)$), for different values of permeability
  ${\beta }_{\circ }$ and Poisson ratio
  $\nu$ of the PVE material. As can be seen, in all cases the pressure relaxation is controlled entirely by
  $\tau _D$ and is independent of shear relaxation
  $\tau$. We observe the same behaviour when studying the pressure relaxation at different probe distances (different values of
  $r/a$); see figure 7. This behaviour is in agreement with the previous two-dimensional immersed boundary simulations (Strychalski & Guy Reference Strychalski and Guy2016). (We note that a recent three-dimensional immersed boundary simulation of cell blebbing by Strychalski (Reference Strychalski2021) observes a sub-diffusive pressure relaxation.)
In figures 4(a,b) of Appendix D, we present the relaxation dynamics of the fluid velocity fields away from the probe in parallel and perpendicular directions for different values of  $\beta _\circ$,
  $\nu$ and
  $r/a$. We observe that the fluid velocity does not undergo a slow relaxation process and the relaxation dynamics is dominated by shear relaxation times
  $\tau$. This difference can be explained by noting that the fluid, unlike the network, is incompressible, hence its dynamics is determined by shear hydrodynamic modes and not the compression modes. These results confirm further our observations thus far: i.e. for the network displacement fields the early/fast relaxation dynamics is controlled by
  $\tau$, and the slow relaxation is controlled by
  $\tau _D^r$, whereas the relaxation of fluid velocity is determined only by
  $\tau$. Another difference between VE and PVE models appears in the ratio of parallel to perpendicular displacements. For VE materials,
  $u_{VE}^\parallel /u_{VE}^\perp =M_{12}^{\parallel }/M_{12}^{\perp }=2$, whereas for a linear elastic material, the ratio is dependent on
  $\nu$,
  $u_{E}^\parallel /u_{E}^\perp ={4(1-\nu )}/{(3-4\nu )}$ (Levine & Lubensky Reference Levine and Lubensky2000), which changes from
  $2$ for
  $\nu =0.5$ to
  $\frac {8}{7}$ for
  $\nu =-1$. For PVE materials, the ratio changes over time from
  $2$ at early times to
  $u_{E}^\parallel /u_{E}^\perp$ at long times. Figure 3(a) shows these variations over time for
  $10\le r/a \le 50$ and
  $\beta _\circ =2$, while the inset shows the results for
  $2\le \beta _\circ \le 20$ and
  $r=50$. In both plots,
  $\nu =0.3$ and the time is made dimensionless by
  $\tau _D^r=r^2/D_q$. As can be seen, the results for different values of
  $r/a$ and
  $\beta _\circ$ all collapse to a single curve over the entire time domain.

Figure 3. (a) The ratio of parallel to perpendicular network displacements,  $\varGamma _n=u^\parallel _n/u^\perp _n$, as a function of
  $t/\tau ^D_r$. Main plot: different values of distance
  $r$ from the probe, taking
  $\beta _\circ =2$ and
  $\nu =0.3$. Inset: different permeability
  $\beta _\circ$, taking
  $r/a=10$,
  $\nu =0.3$. (b) Variations of
  $\varTheta ={(\varGamma _n -\varGamma _{n}^{\infty })}/{(\varGamma _{n}^{\circ }-\varGamma _{n}^{\infty })}$ versus time for different Poisson ratios, taking
  $\beta _\circ =2$ and
  $r/a=10$. Inset: collection of all the data in the figure plotted as
  $\varTheta$ versus
  $t/\tau ^D_r$. All the data collapse to a single curve irrespective of the choice of
  $\nu$,
  $r$,
$r$,  $\beta _\circ$ and
  $\tau$.

Figure 4. Relaxation of displacements in the parallel (a) and perpendicular (b) directions to the applied force, for different values of permeability  $\beta _\circ$, Poisson ratio
  $\nu$, and separation distances
  $r/a$. In all cases, the relaxation is dominated (down to
  $1-u^{(\parallel,\perp )}_f/u_f^\infty \approx 0.001$) by the shear relaxation time scale
  $\tau$.
In figure 3(b), we study the effect of  $\nu$ on the variations of
  $\varTheta ={(\varGamma _n -\varGamma _{n}^\infty )}/{(\varGamma _{n}^{\circ }-\varGamma _{n}^\infty )}$ as a function of
  $t/\tau _D^r$ for different values of
  $\nu$, with
  $\beta _\circ =2$ and
  $r/a=10$, where
  $\varGamma _n (r,t)=u_n^{\parallel }/u_n^\perp$. The data collapse to a single curve. The inset of figure 3(b) shows the cumulative
  $\varTheta (t)$ versus
  $t/\tau _D^r$ data for different values of
  $r$,
$r$,  $\beta _\circ$ and
  $\nu$, collapsing to the same curve. All together, these results show that the relaxation dynamics of displacement (and mobility) ratios is determined entirely by the diffusion of network compressibility
  $\tau _D^r$. The experimental determination of this ratio in two-point MR provides another method to compute
  $D_q$ and thus
  $\beta _\circ$. In contrast, as we show in figure 5(a) of Appendix D, the ratio of fluid displacements in parallel and perpendicular directions remains nearly equal to
  $2$ for different choices of parameters.

Figure 5. (a) The ratio of parallel to perpendicular fluid displacements,  $\varGamma _f=u^\parallel _f/u^\perp _f$, as a function of
  $t/\tau$. Main plot: different values of
  $r$, taking
  $\beta _\circ =2$ and
  $\nu =0.3$. Inset: different permeabilities, for
  $r/a=10$ and
  $\nu =0.3$. (b) The sphere relaxation
  $1-x(t)/x_\infty$ versus time for different values of viscosity, when
  $\nu =0.3$,
  $G=1$ and
  $\xi =1$. Inset plot represents the results as a function of rescaled time
  $t/\tau _D$, where
  $\tau _D={a^2 \xi (1-2\nu )}/{2G(1-\nu )}$ is the diffusion time scale of the compressibility field for distance
  $a$.
$a$.
4. Summary
Increasing experimental evidence points to a PVE model as the most accurate description of the mechanics of the cell cytoskeleton (Mogilner & Manhart Reference Mogilner and Manhart2018). Biot's theory of poroelasticity has been used to describe these observations (Charras et al. Reference Charras, Yarrow, Horton, Mahadevan and Mitchison2005, Reference Charras, Coughlin, Mitchison and Mahadevan2008). Biot's theory neglects shear stresses, which are crucial for determining the mechanical response of cytoskeletal assemblies ( $\phi \ll 1$) at short and intermediate time scales. To overcome this limitation, we include the shear stresses, which modifies the fluid momentum equation from Darcy to the Brinkman equation. We present the first general solutions of these modified linear PVE equations in spherical coordinates; the fluid phase is described as an incompressible linear VE fluid, and the network phase is modelled as a compressible linear VE material. Similar to Stokes flow microhydrodynamics (Kim & Karrila Reference Kim and Karrila2013) and linear elasticity (Gurtin Reference Gurtin1973), the linearity of the equations of motion allows development of a robust mathematical framework for describing the motion of inclusions moving in PVE materials, and the interior displacements generated in PVE materials by the motion of outer boundaries. These general solutions can be used to develop Faxén laws for a two-phase system, which relates the force (torque) on a sphere to the (angular) velocity fields of the fluid and network in general background flow. Faxén laws can then be used to develop numerical techniques similar to Stokesian dynamics (Fiore & Swan Reference Fiore and Swan2019), for modelling the motion of spherical inclusions in PVE materials, based on singularity solutions.
To demonstrate the utility of the general solutions, we studied the dynamics of a rigid sphere moving in a PVE material. Using the axisymmetric form of the general solutions, we derived closed-form solutions for the sphere's response function (hydrodynamic resistance), and fluid and network displacement fields. We showed that the displacement relaxation of the rigid sphere and the network displacements induced by it follow two distinct dynamics at short and long time scales. The dynamics at short time scales is dominated by hydrodynamic shear modes on the system, and thus can be captured using a VE model. The following slow relaxation dynamics could not be predicted using the VE model; instead, we showed that this dynamic is controlled by the diffusion time scale of network compressibility and the response of the fluid pressure to these local changes in network volume. These predictions are in agreement with the experimental observations, including the slow distance-dependent relaxation that follows the initial fast relaxation observed by atomic force microscopy experiments of Rosenbluth et al. (Reference Rosenbluth, Crow, Shaevitz and Fletcher2008). They are also in agreement with the results of Charras, Mitchison & Mahadevan (Reference Charras, Mitchison and Mahadevan2009) and Moeendarbary et al. (Reference Moeendarbary, Valon, Fritzsche, Harris, Moulding, Thrasher, Stride, Mahadevan and Charras2013), and the experimental and computational observations of slow propagation of hydrostatic pressure in blebs (Charras et al. Reference Charras, Yarrow, Horton, Mahadevan and Mitchison2005, Reference Charras, Coughlin, Mitchison and Mahadevan2008; Strychalski & Guy Reference Strychalski and Guy2016). Finally, we discussed how our results can be used directly to analyse the results of single-particle and two-point MR, and calculate fluid permeability in addition to the commonly measured VE properties of the system.
In studying the probe's motion, we assumed that the probe size is significantly larger than the mesh size of the network, which led to assuming no-slip BCs for both the fluid and network phases at the probe's surface ( $r=a$). This is a reasonable assumption, since the mesh size for actin networks in the cell starts from 20 to 200 nm, and the typical probe size used in the experiments is at least 1000 nm, which is about at least
  $5$ times larger than the mesh size. On the other hand, it is now possible to include and trace genetically encoded multimeric nanoparticles of diameter 15–40 nm within the cell (Delarue et al. Reference Delarue2018). The particles that are smaller than the mesh size of the network can be used to study the effect of network topology and mechanics on the transport of small molecules and organelles through the fluid phase. The BCs for the network phase need to be modified when analysing the motion of particles when
  $\beta _\circ a\le 1$. Here, the more appropriate BCs for the network phase would be to assume that because the network and the probe are not in direct contact, no force is applied from the network to the probe, i.e.
  $\boldsymbol {\sigma }_n\boldsymbol {\cdot } \hat {\boldsymbol {n}}=\boldsymbol {0}$ at
  $r=a$ (Fu et al. Reference Fu, Shenoy and Powers2008; Diamant Reference Diamant2015). This BC can be incorporated easily within our general solution. Note that this modification in BCs changes qualitatively the time-dependent motion of the probe. In particular, the probe's response at long times will be dominated by VE properties of the fluid domain when
  $\beta _\circ a\le 1$, in contrast to the mechanics being determined by the network phase when
  $\beta _\circ a> 1$.
Acknowledgements
We thank the members of Nazockdast and Klotsa Labs for fruitful discussions and suggestions.
Funding
We acknowledge support by the National Science Foundation under grant no. CBET-1944156.
Declaration of interests
The authors report no conflict of interest.
Appendix A. Solving the  $v^{+}$ and $v^{-}$ equations


A.1. General solution of the $v^{+}$ equation

The equation for  ${\boldsymbol {v}}^{+}$ is
 \begin{equation} {\nabla}^2 {\boldsymbol{v}}^{+} - \boldsymbol{\nabla} (\boldsymbol{\nabla}\boldsymbol{\cdot}{\boldsymbol{v}}^{+}) = \boldsymbol{\nabla} \varPhi. \end{equation}
Using  $\boldsymbol {\nabla }\boldsymbol {\cdot } {\boldsymbol {v}}^{+} = - (\varepsilon \tilde {\eta } + \tilde {G}) q$, we can write the equation for
  ${\boldsymbol {v}}^{+}$ as
 \begin{equation} {\nabla}^2 {\boldsymbol{v}}^{+} = \boldsymbol{\nabla} (\varPhi - (\varepsilon \tilde{\eta} + \tilde{G})q). \end{equation}
We look for the solution of (A2) in the form  ${\boldsymbol {v}}^{+} = {\boldsymbol {v}}_{h}^{+} + \boldsymbol {\nabla } \chi$, which can be fulfilled by requiring that
  ${\nabla }^2 {\boldsymbol {v}}_{h}^{+} = \boldsymbol {0}$, and that
  $\chi$ satisfies
 \begin{equation} {\nabla}^2 \chi = \varPhi - (\varepsilon \tilde{\eta} + \tilde{G}) q . \end{equation}
The general solution for  ${\boldsymbol {v}}_{h}^{+}$ is (Morse & Feshbach Reference Morse and Feshbach1953)
 \begin{equation} {\boldsymbol{v}}_{h}^{+} = \sum_{\ell ,m} [{A}_{\ell ,m}^{{\pm}} {\boldsymbol{M}}_{\ell ,m}^{{\pm}} + {B}_{\ell ,m}^{{\pm}} {\boldsymbol{N}}_{\ell ,m}^{{\pm}} + {C}_{\ell ,m}^{{\pm}} {\boldsymbol{G}}_{\ell ,m}^{{\pm}}], \end{equation}
where
 $$\begin{gather} {\boldsymbol{M}}_{\ell ,m}^{{\pm}} = \begin{pmatrix} r^{\ell} \\ r^{- \ell -1} \end{pmatrix} \sqrt{\ell (\ell +1)}\,{\boldsymbol{C}}_{\ell ,m} , \end{gather}$$
 $$\begin{gather}{\boldsymbol{N}}_{\ell ,m}^{{\pm}} = \begin{pmatrix} r^{\ell} \\ r^{- \ell -1} \end{pmatrix} \begin{pmatrix} (\ell +1) {\boldsymbol{P}}_{\ell +1,m} + \sqrt{(\ell +1)(\ell +2)}\,{\boldsymbol{B}}_{\ell +1,m} \\ - \ell {\boldsymbol{P}}_{\ell -1,m} + \sqrt{\ell (\ell -1)}\,{\boldsymbol{B}}_{\ell -1,m} \end{pmatrix}, \end{gather}$$
 $$\begin{gather}{\boldsymbol{G}}_{\ell ,m}^{{\pm}} = \begin{pmatrix} r^{\ell} \\ r^{- \ell -1} \end{pmatrix} \begin{pmatrix} - \ell {\boldsymbol{P}}_{\ell -1,m} + \sqrt{\ell (\ell -1)}\,{\boldsymbol{B}}_{\ell -1,m} \\ (\ell +1) {\boldsymbol{P}}_{\ell +1,m} + \sqrt{(\ell +1)(\ell +2)}\,{\boldsymbol{B}}_{\ell +1,m} \end{pmatrix}, \end{gather}$$
and  ${\boldsymbol {P}}_{\ell,m}$,
  ${\boldsymbol {B}}_{\ell,m}$ and
  ${\boldsymbol {C}}_{\ell,m}$ are defined in the main text. Using the Laplace general solution for
  $\varPhi$, and the Helmholtz general solution for
  $q$, (A3) becomes
 \begin{equation} {\nabla}^2 \chi = \sum_{\ell ,m} \left[ D_{\ell ,m}^{{\pm}} \begin{pmatrix} r^{\ell} \\ r^{-\ell -1} \end{pmatrix} - (\varepsilon \tilde{\eta} + \tilde{G}) E_{\ell ,m}^{{\pm}} \begin{pmatrix} {{\mathsf{i}}}_{\ell } ({\alpha}_{\varepsilon} r) \\ {{\mathsf{k}}}_{\ell } ({\alpha}_{\varepsilon} r) \end{pmatrix}\right] Y_{\ell m} (\theta ,\varphi) . \end{equation}
The solution for  $\chi$ is
 \begin{equation} \chi = \sum_{\ell ,m} \left[ D_{\ell ,m}^{{\pm}}\,\frac{r^2}{2} \begin{pmatrix} \dfrac{1}{2\ell +3} r^{\ell} \\ \dfrac{1}{-2\ell +1} r^{-\ell -1} \end{pmatrix} - \frac{ \varepsilon \tilde{\eta} + \tilde{G}}{{\alpha}_{\varepsilon}^2}\,E_{\ell ,m}^{{\pm}} \begin{pmatrix} {{\mathsf{i}}}_{\ell } ({\alpha}_{\varepsilon} r) \\ {{\mathsf{k}}}_{\ell } ({\alpha}_{\varepsilon} r) \end{pmatrix}\right] Y_{\ell m}(\theta, \varphi) . \end{equation}
So  $\boldsymbol {\nabla }\chi$ becomes
 \begin{align} \boldsymbol{\nabla} \chi &= \sum_{\ell ,m} \frac{1}{2} \begin{pmatrix} r^{\ell +1} \\ r^{-\ell } \end{pmatrix} D_{\ell ,m}^{{\pm}} \begin{pmatrix} \dfrac{\ell +2}{2\ell +3}\,{\boldsymbol{P}}_{\ell ,m} + \dfrac{1}{2\ell +3} \sqrt{\ell (\ell +1)}\,{\boldsymbol{B}}_{\ell ,m} \\ \dfrac{\ell -1}{2\ell -1}\,{\boldsymbol{P}}_{\ell ,m} + \dfrac{1}{-2\ell +1} \sqrt{\ell (\ell +1)}\,{\boldsymbol{B}}_{\ell ,m} \end{pmatrix} \nonumber\\ &\quad - \sum_{\ell ,m} \frac{ \varepsilon \tilde{\eta} + \tilde{G} }{{\alpha}_{\varepsilon}^2}\,E_{\ell ,m}^{{\pm}} \left[\frac{\mathrm{d}}{\mathrm{d} r} \begin{pmatrix} {{\mathsf{i}}}_{\ell }({\alpha}_{\varepsilon} r) \\ {{\mathsf{k}}}_{\ell } ({\alpha}_{\varepsilon}r) \end{pmatrix} {\boldsymbol{P}}_{\ell ,m}+ \frac{1}{r} \begin{pmatrix} {{\mathsf{i}}}_{\ell } ({\alpha}_{\varepsilon} r) \\ {{\mathsf{k}}}_{\ell }({\alpha}_{\varepsilon} r) \end{pmatrix} \sqrt{\ell(\ell +1)}\,{\boldsymbol{B}}_{\ell ,m} \right]. \end{align}
Substituting  ${\boldsymbol {v}}_{p}^{+}=\boldsymbol {\nabla } \chi$ and
  ${\boldsymbol {v}}_{h}^{+}$ expressions, and setting
  $\boldsymbol {\nabla } \boldsymbol {\cdot } {\boldsymbol {v}}^{+} = - (\varepsilon \tilde {\eta } + \tilde {G}) q$, gives
 \begin{equation} {D}_{\ell ,m}^{+} = (\ell +1) (2\ell +3) {C}_{\ell +1 ,m}^{+},\quad {D}_{\ell ,m}^{-} = \ell (2\ell -1) {C}_{\ell -1 ,m}^{-} , \end{equation}
and we get (2.11) in the main text.
A.2. General solution of the $v^{-}$ equation

The equation for  ${\boldsymbol {v}}^{-}$ is
 \begin{equation} {\nabla}^2 {\boldsymbol{v}}^{-} + \frac{{\gamma}_{\varepsilon}}{1- \varepsilon}\,\boldsymbol{\nabla} (\boldsymbol{\nabla}\boldsymbol{\cdot} {\boldsymbol{v}}^{-} ) - {\beta}^2 {\boldsymbol{v}}^{-} = \frac{1}{{ \tilde{\eta}}_{\varepsilon}}\,\boldsymbol{\nabla} \varPhi. \end{equation}
We look for the solution of (A10) in the form  ${\boldsymbol {v}}^{-} = {\boldsymbol {v}}_{{h}}^{-} + {\boldsymbol {v}}_{{p}}^{-}$. For the homogeneous part, we assume
  ${\boldsymbol {v}}_{{h}}^{-} = {\boldsymbol {v}}_{{T}}^{-} + {\boldsymbol {v}}_{{L}}^{-}$, where
  $\boldsymbol {\nabla } \boldsymbol {\cdot } {\boldsymbol {v}}_{{T}}^{-} =0$ and
  $\boldsymbol {\nabla }\times {\boldsymbol {v}}_{{L}}^{-} = \boldsymbol {0}$. Inserting this ansatz into the
  ${\boldsymbol {v}}^{-}$ equation, we get
 $$\begin{gather} {\nabla}^2 {\boldsymbol{v}}_{T}^{-} - {\beta}^2 {\boldsymbol{v}}_{T}^{-} = \boldsymbol{0}, \end{gather}$$
 $$\begin{gather}{\nabla}^2 {\boldsymbol{v}}_{L}^{-} + \frac{{\gamma}_{\varepsilon}}{1-\varepsilon}\,\boldsymbol{\nabla} \left(\boldsymbol{\nabla}\boldsymbol{\cdot}{\boldsymbol{v}}_{L}^{-} \right) - {\beta}^2 {\boldsymbol{v}}_{L}^{-} = \boldsymbol{0}. \end{gather}$$
Since  $\boldsymbol {\nabla } (\boldsymbol {\nabla }\boldsymbol {\cdot } {\boldsymbol {v}}_{L}^{-} ) = {\nabla }^2 {\boldsymbol {v}}_{L}^{-}$, we can write
 $$\begin{gather} {\nabla}^2 {\boldsymbol{v}}_{T}^{-} = {\beta}^2 {\boldsymbol{v}}_{T}^{-} , \end{gather}$$
 $$\begin{gather}{\nabla}^2 {\boldsymbol{v}}_{L}^{-} = {\alpha_{\varepsilon}}^2 {\boldsymbol{v}}_{L}^{-} , \end{gather}$$
where  ${\alpha _{\varepsilon }}^2 = {{\beta }^2 (1- \varepsilon )}/{(1- \varepsilon + {\gamma }_{\varepsilon })}$. The general solutions for
  ${\boldsymbol {v}}_{T}^{-}$ and
  ${\boldsymbol {v}}_{L}^{-}$ are (Ben-Menahem & Singh Reference Ben-Menahem and Singh1968)
 $$\begin{gather} {\boldsymbol{v}}_{T}^{-} = \sum_{\ell ,m} {A'}_{\ell ,m}^{{\pm}} {\boldsymbol{M '} }_{\ell ,m}^{{\pm}} + {B '}_{\ell ,m}^{{\pm}} {\boldsymbol{N '} }_{\ell ,m}^{{\pm}} , \end{gather}$$
 $$\begin{gather}{\boldsymbol{v}}_{L}^{-} = \sum_{\ell ,m} {C '}_{\ell ,m}^{{\pm}} {\boldsymbol{L} }_{\ell ,m}^{{\pm}} , \end{gather}$$
where  ${\boldsymbol {M '} }_{\ell,m}^{\pm } = \boldsymbol {\nabla } \times (\boldsymbol {r} {\psi }_{T, \ell,m}^{\pm } )$,
  ${\boldsymbol {N '} }_{\ell,m}^{\pm } = ({1}/{\beta })\,\boldsymbol {\nabla } \times \boldsymbol {\nabla } \times (\boldsymbol {r} {\psi }_{T, \ell,m}^{\pm } )$ and
  ${\boldsymbol {L} }_{\ell,m}^{\pm }=$
  $({1}/{{\alpha }_{\varepsilon }})\boldsymbol {\nabla } {\psi }_{L, \ell,m}^{\pm }$. Here,
  ${\psi }_{T, \ell,m}^{\pm }$, and
  ${\psi }_{L, \ell,m}^{\pm }$ satisfy the scalar Helmholtz equations
  ${\nabla }^2 {\psi }_{T, \ell,m}^{\pm }-{\beta}^2 {\psi }_{T, \ell,m}^{\pm } =0$ and
  ${\nabla }^2 {\psi }_{L, \ell,m}^{\pm } - {{\alpha }_{\varepsilon }}^2 {\psi }_{L, \ell,m}^{\pm } =0$, respectively. So
 \begin{equation} {\boldsymbol{v}}_{h}^{-} = \sum_{\ell ,m} {A'}_{\ell ,m}^{{\pm}} {\boldsymbol{M '} }_{\ell ,m}^{{\pm}} + {B '}_{\ell ,m}^{{\pm}} {\boldsymbol{N '} }_{\ell ,m}^{{\pm}} + {C '}_{\ell ,m}^{{\pm}} {\boldsymbol{L} }_{\ell ,m}^{{\pm}} , \end{equation}
where
 \begin{gather} {\boldsymbol{M '} }_{\ell ,m}^{{\pm}} = \begin{pmatrix} {{\mathsf{i}}}_{\ell }(\beta r) \\ {{\mathsf{k}}}_{\ell } (\beta r) \end{pmatrix} \sqrt{\ell (\ell +1)}\,{\boldsymbol{C}}_{\ell ,m}, \end{gather}
 \begin{gather} \hspace{-1pc}{\boldsymbol{N '} }_{\ell ,m}^{{\pm}} = \ell (\ell +1) {\boldsymbol{P}}_{\ell ,m}\,\frac{1}{\beta r} \begin{pmatrix} {{\mathsf{i}}}_{\ell } (\beta r) \\ {{\mathsf{k}}}_{\ell } (\beta r) \end{pmatrix} + \sqrt{\ell (\ell +1)}\,{\boldsymbol{B}}_{\ell ,m} \nonumber\\ \hspace{2.8pc}\times\left\lbrace \frac{\mathrm{d}}{\mathrm{d} (\beta r)} \begin{pmatrix} {{\mathsf{i}}}_{\ell } (\beta r) \\ {{\mathsf{k}}}_{\ell } (\beta r) \end{pmatrix} + \frac{1}{\beta r} \begin{pmatrix} {{\mathsf{i}}}_{\ell } (\beta r) \\ {{\mathsf{k}}}_{\ell } (\beta r) \end{pmatrix} \right\rbrace, \end{gather}
 \begin{gather} {\boldsymbol{L} }_{\ell ,m}^{{\pm}} = \frac{\mathrm{d}}{\mathrm{d} ({\alpha}_{\varepsilon} r)} \begin{pmatrix} {{\mathsf{i}}}_{\ell } ({\alpha}_{\varepsilon} r) \\ {{\mathsf{k}}}_{\ell } ({\alpha}_{\varepsilon} r) \end{pmatrix} {\boldsymbol{P}}_{\ell ,m} + \sqrt{\ell (\ell +1)}\, {\boldsymbol{B}}_{\ell ,m}\,\frac{1}{ {\alpha}_{\varepsilon} r} \begin{pmatrix} {{\mathsf{i}}}_{\ell } ( {\alpha}_{\varepsilon} r) \\ {{\mathsf{k}}}_{\ell } ( {\alpha}_{\varepsilon} r) \end{pmatrix}. \end{gather}
 Next, we seek the particular solution of the form  ${\boldsymbol {v}}_{{p}}^{-} = \boldsymbol {\nabla } \chi$. Inserting this ansatz into (A10), we get
 \begin{equation} {\nabla}^2 \chi - {\beta}^2 \chi = \frac{1}{{\tilde{\eta}}_{\varepsilon}}\,\varPhi - \gamma_{\varepsilon} q . \end{equation}
Assuming  $\chi = {\chi }_1 + {\chi }_2$, where
  ${\chi }_1$ and
  ${\chi }_2$ satisfy equations
  ${\nabla }^2 {\chi }_1 - {\beta }^2 {\chi }_1 = - \gamma _{\varepsilon } q$ and
  ${\nabla }^2 {\chi }_2 - {\beta }^2 {\chi }_2 = ({1}/{{\tilde {\eta }}_{\varepsilon }}) \varPhi$, we get solutions
  ${\chi }_1 = - ({\gamma _{\varepsilon }}/{({\alpha }_{\varepsilon }^2 - {\beta }^2)})q$, and
  ${\chi }_2 = - ({1}/{{\beta }^2}) ({1}/{{\tilde {\eta }}_{\varepsilon }}) \varPhi$. Using the general solution of Laplace for
  $\varPhi$, and the Helmholtz equation for
  $q$, we get
 \begin{equation} \chi = \sum_{\ell ,m} \left[ - \frac{1}{{\beta}^2}\, \frac{1}{{\tilde{\eta}}_{\varepsilon}}\,D_{\ell ,m}^{{\pm}} \begin{pmatrix} r^{\ell} \\ r^{-\ell -1} \end{pmatrix} - \frac{\gamma_{\varepsilon}}{ {\alpha}_{\varepsilon}^2 - {\beta}^2}\,E_{\ell ,m}^{{\pm}} \begin{pmatrix} {{\mathsf{i}}}_{\ell } ({\alpha}_{\varepsilon} r) \\ {{\mathsf{k}}}_{\ell } ({\alpha}_{\varepsilon} r) \end{pmatrix} \right] Y_{\ell m} (\theta ,\varphi). \end{equation}
So the particular solution is
 \begin{align} {\boldsymbol{v}}_{p}^{-} &= \boldsymbol{\nabla} \chi = \sum_{\ell ,m} \left\{-\frac{1}{{\beta}^2}\,\frac{1}{{\tilde{\eta}}_{\varepsilon}}\,{D}_{\ell ,m}^{{\pm}} \begin{pmatrix} r^{\ell -1} \\ r^{-\ell -2} \end{pmatrix} \begin{pmatrix} \ell {\boldsymbol{P}}_{\ell ,m} + \sqrt{\ell (\ell +1)}\,{\boldsymbol{B}}_{\ell ,m} \\ -(\ell +1) {\boldsymbol{P}}_{\ell ,m} + \sqrt{\ell (\ell +1)}\,{\boldsymbol{B}}_{\ell ,m} \end{pmatrix} \right. \nonumber\\ &\quad \left.{}-\frac{\gamma_{\varepsilon}}{ {\alpha}_{\varepsilon}^2 - {\beta}^2}\,{E}_{\ell ,m}^{{\pm}} \left[ \frac{\mathrm{d}}{\mathrm{d} r} \begin{pmatrix} {{\mathsf{i}}}_{\ell } ( {\alpha}_{\varepsilon} r) \\ {{\mathsf{k}}}_{\ell } ( {\alpha}_{\varepsilon} r) \end{pmatrix} {\boldsymbol{P}}_{\ell ,m} + \frac{1}{r} \begin{pmatrix} {{\mathsf{i}}}_{\ell } ( {\alpha}_{\varepsilon} r) \\ {{\mathsf{k}}}_{\ell } ( {\alpha}_{\varepsilon} r) \end{pmatrix} \sqrt{\ell (\ell +1)}\,{\boldsymbol{B}}_{\ell ,m}\right] \right\} . \end{align}
 Substituting the  ${\boldsymbol {v}}_{p}^{-}$ and
  ${\boldsymbol {v}}_{h}^{-}$ expressions, and using the facts that
  ${{\gamma }_{\varepsilon }}/{({\beta }^2 - {\alpha }_{\varepsilon }^2)} = {(1-\varepsilon )}/{{\alpha }_{\varepsilon }^2}$ and
  $\boldsymbol {\nabla } \boldsymbol {\cdot }{\boldsymbol {v}}^{-} = (1- \varepsilon ) q$, we get
  ${C '}_{\ell,m}^{\pm } =0$, and recover (2.12) in the main text.
A.3. Some relations between vector spherical functions
 \begin{gather} \boldsymbol{\nabla} \times \left( f(r) {\boldsymbol{P}}_{\ell ,m} \right) = \frac{f(r)}{r} \sqrt{\ell (\ell +1)} {\boldsymbol{C}}_{\ell ,m},\quad \boldsymbol{\nabla}\boldsymbol{\cdot}\left(f(r) {\boldsymbol{P}}_{\ell ,m} \right) =\left( \frac{2}{r} f(r) + \frac{\mathrm{d}f}{\mathrm{d}r} \right) Y_{\ell ,m} (\theta ,\varphi), \end{gather}
 \begin{gather} \boldsymbol{\nabla} \times \left( f(r) {\boldsymbol{B}}_{\ell ,m} \right) ={-} \left( \frac{f(r)}{r} + \frac{\mathrm{d}f}{\mathrm{d}r} \right) {\boldsymbol{C}}_{\ell ,m}, \quad \boldsymbol{\nabla}\boldsymbol{\cdot} \left( f(r) {\boldsymbol{B}}_{\ell ,m} \right) \!={-} \sqrt{\ell (\ell \!+\!1)} \frac{f(r)}{r} Y_{\ell ,m} (\theta ,\varphi), \end{gather}
 \begin{gather} \boldsymbol{\nabla} \times \left( f(r) {\boldsymbol{C}}_{\ell ,m} \right) = \frac{f(r)}{r} \sqrt{\ell (\ell +1)} {\boldsymbol{P}}_{\ell ,m} + \left(\frac{f(r)}{r} + \frac{\mathrm{d}f}{\mathrm{d}r} \right) {\boldsymbol{B}}_{\ell ,m} ,\quad \boldsymbol{\nabla}\boldsymbol{\cdot} \left( f(r) {\boldsymbol{C}}_{\ell ,m} \right) = 0. \end{gather}
Appendix B. Fluid and network stress fields
The fluid stress components are
 \begin{align} {\tilde{\sigma}}_{rr}^{f} & ={-}\tilde{p} (1-\phi)+ 2 \tilde{\eta}\, \frac{\partial \tilde{v}_{r,f}}{\partial r} \nonumber\\ & = \frac{3a \tilde{\eta} }{2 {\beta}^2 (1-\varepsilon) r^4}\, \frac{ \tilde{U}(s)}{{\varDelta}_{\varepsilon}} \left[24 \varepsilon (1-\varepsilon) \left(\frac{1+\tau}{\tau}\right) (1+a {\alpha}_{\varepsilon}) \vphantom{\left( \varepsilon \tau ({-}1 + 2\varepsilon) + \frac{\tilde{\lambda}}{\tilde{G}}+2 \right)}\right. \nonumber\\ &\quad + 4 a^2 {\alpha}_{\varepsilon}^2 (1-\varepsilon) (2\varepsilon \tau -1 + 3\varepsilon) -12\,\frac{{\alpha}_{\varepsilon}^2}{{\beta}^2}\,{(1-\varepsilon)}^2(1+a\beta) \nonumber\\ &\quad + (\varepsilon -1)\,\frac{{ \tilde{\eta}}_{\varepsilon}}{ \tilde{\eta}} \left[ 2 a^2 \tau (\varepsilon -1) + \left( (3-2\varepsilon)\tau +1 \right) r^2 \right] [ 2 {\beta}^2 (1+ a {\alpha}_{\varepsilon}) \nonumber\\ &\quad + {\alpha}_{\varepsilon}^2 (1+ a\beta + a^2 {\beta}^2)] + 4\, \frac{{\alpha}_{\varepsilon}^2}{{\beta}^2}\,{(\varepsilon -1)}^2 (3+ 3\beta r + {\beta}^2 r^2) \exp({-\beta (r-a)}) \nonumber\\ &\quad + 24 \varepsilon(\varepsilon -1) (1+\tau) (1+ {\alpha}_{\varepsilon} r) \exp({- {\alpha}_{\varepsilon} (r-a)}) \nonumber\\ &\quad + 2{\alpha}_{\varepsilon}^2 r^2 \left( \varepsilon \tau ({-}5+6\varepsilon) + \frac{\tilde{\lambda}}{\tilde{G}} + \frac{1}{\tau} \left(\frac{\tilde{\lambda}}{\tilde{G}}+2\right) + (2-5\varepsilon + 6 {\varepsilon}^2) \right) \exp({- {\alpha}_{\varepsilon} (r-a)}) \nonumber\\ &\quad \left.+\, 2 {\alpha}_{\varepsilon}^3 r^3 \left(1+ \frac{1}{\tau}\right) \left( \varepsilon \tau ({-}1 + 2\varepsilon) + \frac{\tilde{\lambda}}{\tilde{G}}+2 \right) \exp({- {\alpha}_{\varepsilon} (r-a)})\right] \cos\theta, \end{align}
 \begin{align} {\tilde{\sigma}}_{r\theta}^{f} & = \tilde{\eta} \left( \frac{1}{r}\, \frac{\partial \tilde{v}_{r,f}}{\partial \theta} + \frac{\partial \tilde{v}_{\theta , f}}{\partial r} - \frac{ \tilde{v}_{\theta , f}}{r} \right) \nonumber\\ & = \frac{3a \tilde{\eta} }{2 {\beta}^2 r^4}\, \frac{ \tilde{U}(s)}{{\varDelta}_{\varepsilon}} \left[12 \varepsilon (1+\tau) (1+ a {\alpha}_{\varepsilon}) -2 a^2 {\beta}^2 (\varepsilon -1) {\tau}_{\varepsilon} (1+ a {\alpha}_{\varepsilon}) \vphantom{\frac{{\alpha}_{\varepsilon}^2}{{\beta}^2}}\right. \nonumber\\ &\quad - \frac{{\alpha}_{\varepsilon}^2}{{\beta}^2}\, [ 6(1-\varepsilon) (1+ a\beta) - 2 a^2 {\beta}^2 ({-}1 +\varepsilon (3+2\tau)) \nonumber\\ &\quad +a^2 {\beta}^2 {\tau}_{\varepsilon} (\varepsilon -1) (1+ a\beta + a^2 {\beta}^2)] \nonumber\\ &\quad +\frac{{\alpha}_{\varepsilon}^2}{{\beta}^2}\,(1-\varepsilon)(6+ 6\beta r + 3 {\beta}^2 r^2 + {\beta}^3 r^3) \exp({-\beta (r-a)}) \nonumber\\ &\quad \left.\vphantom{\frac{{\alpha}_{\varepsilon}^2}{{\beta}^2}} -4\varepsilon (1+\tau) (3+ 3{\alpha}_{\varepsilon} r + {\alpha}_{\varepsilon}^2 r^2) \exp({- {\alpha}_{\varepsilon} (r-a)})\right] \sin\theta . \end{align}
The network stress components are
 \begin{align} {\tilde{\sigma}}_{rr}^{n} & = (\tilde{\lambda} + 2\tilde{G})\, \frac{\partial \tilde{v}_{r,n} }{\partial r} + \frac{\tilde{\lambda}}{r} \left(2 \tilde{v}_{r,n} + \cot\theta\,\tilde{v}_{ \theta ,n} + \frac{\partial}{\partial \theta} \tilde{v}_{ \theta ,n} \right) -\phi \tilde{p} \nonumber\\ & = \frac{3a \tilde{G} }{2 {\beta}^2 (1-\varepsilon) r^4}\, \frac{\tilde{U}(s)}{{\varDelta}_{\varepsilon}} \left[24 (1-\varepsilon) (1+\tau) (1+ {\alpha}_{\varepsilon} r) + (\varepsilon -1) {\tau}_{\varepsilon} [ 2 a^2 (\varepsilon -1) \vphantom{\left({\varepsilon}^2 \tau + \frac{\tilde{\lambda}}{\tilde{G}} + 6-4\varepsilon\right)}\right. \nonumber\\ &\quad - ({-}2+ (3+\tau)\varepsilon) r^2] [ 2 {\beta}^2 (1+ a {\alpha}_{\varepsilon}) + {\alpha}_{\varepsilon}^2 (1+ a\beta + a^2 {\beta}^2)] \nonumber\\ &\quad + 4\,\frac{{\alpha}_{\varepsilon}^2}{{\beta}^2}\,(\varepsilon -1) [\tau ( 3 (\varepsilon -1)(1+ a \beta) + (\varepsilon -3) a^2 {\beta}^2 ) \nonumber\\ &\quad -2 a^2 {\beta}^2] + 24 (\varepsilon -1) (1+\tau) (1+ {\alpha}_{\varepsilon} r) \exp({- {\alpha}_{\varepsilon} (r-a)}) \nonumber\\ &\quad -2(1+\tau) {\alpha}_{\varepsilon}^2 r^2 \left(\left({\varepsilon}^2 \tau + \frac{\tilde{\lambda}}{\tilde{G}}+2\right) {\alpha}_{\varepsilon} r + \left({\varepsilon}^2 \tau + \frac{\tilde{\lambda}}{\tilde{G}} + 6\,{-}\,4\varepsilon\right)\right) \exp({- {\alpha}_{\varepsilon} (r\,{-}\,a)}) \nonumber\\ &\quad \left.\vphantom{\left({\varepsilon}^2 \tau + \frac{\tilde{\lambda}}{\tilde{G}} + 6-4\varepsilon\right)} -4\,\frac{{\alpha}_{\varepsilon}^2}{{\beta}^2}\,{(\varepsilon -1)}^2 \tau (3+ 3\beta r + {\beta}^2 r^2) \exp({-\beta (r-a)})\right] \cos\theta, \end{align}
 \begin{align} {\tilde{\sigma}}_{r\theta}^{n} &= \tilde{G} \left( \frac{1}{r}\, \frac{\partial \tilde{v}_{n,r}}{\partial\theta} + \frac{\partial \tilde{v}_{n, \theta}}{\partial r} - \frac{ \tilde{v}_{n, \theta}}{r} \right) \nonumber\\ &= \frac{3a \tilde{G} }{2 {\beta}^2 r^4}\,\frac{ \tilde{U} (s)}{{\varDelta}_{\varepsilon}} \left[12 (1+\tau) (1+ a {\alpha}_{\varepsilon}) -2 a^2 {\beta}^2 {\tau}_{\varepsilon} (\varepsilon -1) (1+ a {\alpha}_{\varepsilon}) \vphantom{\frac{{\alpha}_{\varepsilon}^2}{{\beta}^2}}\right.\nonumber\\ &\quad - a^2 {\alpha}_{\varepsilon}^2 {\tau}_{\varepsilon} (\varepsilon -1) (1+ a\beta+ a^2 {\beta}^2) \nonumber\\ &\quad -2\,\frac{{\alpha}_{\varepsilon}^2}{{\beta}^2} \left[\tau \left(3(\varepsilon -1)(1+ a\beta) + (\varepsilon -3) a^2 {\beta}^2 \right) -2 a^2 {\beta}^2\right] +\tau\,\frac{{\alpha}_{\varepsilon}^2}{{\beta}^2}\,(\varepsilon -1) \nonumber\\ &\quad \times \exp({-\beta (r-a)}) \left(6+ 6\beta r + 3 {\beta}^2 r^2 + {\beta}^3 r^3 \right) - 4(1+ \tau) \nonumber\\ &\quad \left.\vphantom{\frac{{\alpha}_{\varepsilon}^2}{{\beta}^2}} \times\exp({- {\alpha}_{\varepsilon} (r-a)}) \left( 3 + 3 {\alpha}_{\varepsilon} r + {\alpha}_{\varepsilon}^2 r^2 \right)\right] \sin\theta. \end{align}
Appendix C. Short- and long-time responses
The velocity fields of fluid and network for a rigid sphere moving with velocity  $\tilde {U} (s)$ in a PVE medium are given in (3.2). The limiting values of all these quantities at
  $t=0$ and
  $t\to \infty$ can be computed analytically using the following limits in
  $s$-space:
  $f(t=0^+) =\lim _{s\to \infty } s\,\tilde {f}(s)$ and
  $f(t\to \infty ) =\lim _{s\to 0} s\,\tilde {f}(s)$. For a sphere moving with constant force
  ${F}_{\circ }$, the time-dependent velocity of the sphere would be
  $U (s)= {{R}^{-1}(s)\,F (s) \equiv M (s)\,({F_{\circ }}/{s})}$. The sphere starts to move with velocity
 \begin{equation} U (t \to 0) = \frac{F_{{\circ}}}{6{\rm \pi} \eta a} \left( \frac{9 {\phi}^2 + 6 a {\beta}_{{\circ}} \phi + 3 a^2 {\beta}_{{\circ}}^2 }{ 8 {\phi}^2 + 8 a {\beta}_{{\circ}} \phi + 3 a^2 {\beta}_{{\circ}}^2 }\right), \end{equation}
and at  $t \to \infty$ stops with total displacement
  ${x} (t \to \infty ) = ({F_{\circ }}/{6{\rm \pi} \eta a}) \tau ({(5-6\nu )}/ {4(1-\nu )})$. At
  $t \to \infty$, the velocity fields of the fluid and network are zero, and the fluid and network displacements are
 \begin{gather} \hspace{-1pc} u_{r,f}^{\infty} = \frac{F_{{\circ}} \tau }{6{\rm \pi} \eta a} \left(\frac{a }{4 {\beta}_{{\circ}}^2 r^3 (\nu -1)(\phi -1)}\right) \bigl(3(1-2\nu ) (1+ a {\beta}_{{\circ}}) + a^2 {\beta}_{{\circ}}^2 (\phi -1) \nonumber\\ \hspace{2pc} + 6 {\beta}_{{\circ}}^2 r^2 (1-\nu )(1-\phi) +3(2\nu -1) (1+ {\beta}_{{\circ}} r) \exp({- {\beta}_{{\circ}} (r-a)})\bigr), \end{gather}
 \begin{gather} u_{\theta ,f}^{\infty} = \frac{F_{{\circ}} \tau}{6{\rm \pi} \eta a} \left(\frac{a }{8 {\beta}_{{\circ}}^2 r^3 (\nu -1) (\phi -1)} \right) \bigl(3(1-2\nu) (1+ a {\beta}_{{\circ}}) + a^2 {\beta}_{{\circ}}^2 (\phi -1) \nonumber\\ \hspace{-5pc} -6 {\beta}_{{\circ}}^2 r^2 (1-\nu ) +3 \phi {\beta}_{{\circ}}^2 r^2 (3-4\nu) +3(2\nu -1) \nonumber\\ (1+ {\beta}_{{\circ}} r + {\beta}_{{\circ}}^2 r^2 ) \exp({- {\beta}_{{\circ}} (r-a)})\bigr), \end{gather}
 \begin{gather} u_{r,n}^{\infty} = \frac{F_{{\circ}} \tau }{6{\rm \pi} \eta a} \left(\frac{a^3 + 6 a r^2 (\nu -1)}{4 r^3 (\nu -1)}\right),\\ u_{\theta ,n}^{\infty} = \frac{F_{{\circ}} \tau }{6{\rm \pi} \eta a} \left( \frac{a^3 + 3 a r^2 (3-4\nu )}{8 r^3 (\nu -1)} \right) . \end{gather}
At  $t=0$, the velocity of the fluid and network is a Stokes velocity field; when the volume fraction of the network is zero,
  $\phi \to 0$.
Appendix D. Relaxation dynamics of the fluid and network phases
Figure 4 shows the relaxation of the fluid displacement fields induced by the probe's motion in parallel (figure 4a) and perpendicular (figure 4b) directions for different values of permeability  $\beta _\circ$, separation distance
  $r/a$, and Poisson ratio
  $\nu$. As can be seen, in all instances and in both the parallel and perpendicular directions, the displacement relaxation is almost entirely (down to
  $1-u^{(\parallel,\perp )}_f/u_f^\infty \approx 0.001$) controlled by the relaxation time scale of shear forces
  $\tau$.
Figure 5(a) shows the ratio of parallel to perpendicular fluid displacements,  $\varGamma _f=u^\parallel _f/u^\perp _f$, as a function of
  $t/\tau$. The main plot is for different values of
  $t/\tau$, taking
  $\beta _\circ =2$ and
  $\nu =0.3$. In the inset, we plot this ratio for different values of permeability, with
  $r/a=10$ and
  $\nu =0.3$. We see that this ratio remains nearly 2 (within 2 % error), indicating a VE response.
Figure 5(b) shows the relaxation of the sphere as a function of time for different values of viscosity, when the friction coefficient  $\xi$ and shear modulus of the network
  $G$ are constant. We see that decreasing the viscosity leads to faster initial relaxation and does not affect the long-time relaxation as long as
  $\xi$ remains unchanged.
Figure 6 shows the relaxation of the network displacement fields induced by the probe's motion in parallel (figures 6a,b) and perpendicular (figures 6c,d) directions for different values of permeability  $\beta _\circ$, and Poisson ratio
  $\nu$ at distance
  $r/a=10$. Similar to the probe's dynamics, the initial relaxation is determined by shear modes given by the VE model (dashed line), and for long times the network displacements exhibit slow relaxation dynamics. In the direction of applied force (
 $u_n^{\parallel }$), we see non-monotonic behaviour (a local minimum, followed by a local maximum).

Figure 6. Relaxation of displacements of the network in the parallel (a,b) and perpendicular (c,d) directions to the applied force, for different values of permeability  ${\beta } _{\circ }$ and Poisson ratio
  $\nu$.
Figure 7 shows the fluid pressure relaxation time on the surface of the spherical probe (when it is normalized by Stokes pressure  $p_{{st}}= {F_{\circ }\cos \theta }/{4{\rm \pi} a^2}$). Each main plot corresponds to pressure relaxation as a function of
  $t/\tau$, and in the inset we plot the pressure as a function of PVE diffusion time scale
  ${\tau }_{D}^{r} = a^2 {\alpha }^2 \tau$. Also, we plot the (normalized) pressure as a function of time for different values of distance
  $r$, when we put
  ${\beta }_{\circ }=2$ and
  $\nu =0.3$. As we can see from (3.4), the pressure relaxation is controlled entirely by a diffusion process corresponding to propagation of the network compressibility. (Note that the Laplacian of the pressure satisfies a diffusion equation, like
  $q$; see (2.7).)

Figure 7. Pressure relaxation on the surface of the sphere,  $r=a$, moving with constant force in a PVE medium for different values of (a) permeability, and (b) Poisson ratio of the medium. Each main plot is the pressure relaxation when the time is normalized with shear relaxation time
  $\tau$, whereas the inset is pressure relaxation when it is normalized by PVE diffusion time scale
  ${\tau }_{D} = a^2 {\alpha }^2 \tau$. (c) Pressure relaxation for different values of distance from the sphere. The main plot shows pressure as a function of
  $t/\tau$, and the inset when time is normalized by PVE diffusion time scale
  ${\tau }_{D}^{r}= r^2 {\alpha }^2 \tau$. Pressure is normalized by the applied constant force pressure in Stokes flow, i.e.
  $p_{st}={F_{\circ } \cos \theta }/{4{\rm \pi} r^2}$, and we take
  ${\beta }_{\circ }=2$ and
  $\nu =0.3$ for fixed values.


