


1. Introduction
Understanding the fluid dynamics at the neck and inside the sac of intracranial aneurysms, and its dependence on anatomical and physiological parameters that change from case to case, is essential to quantify the changes in haemodynamics introduced by endovascular treatment, and in particular by flow diverting stents (Fukuda et al. Reference Fukuda2019; Texakalidis et al. Reference Texakalidis, Sweid, Mouchtouris, Peterson, Sioka, Rangel-Castilla, Reavey-Cantwell and Jabbour2019; Wan et al. Reference Wan, Ge, Huang, Jiang, Leng, Feng, Xiang and Zhang2019). Flow patterns such as strong inflow jets in the aneurysmal sac have been found to be detrimental to treatment with flow diverters (Chen et al. Reference Chen, Zhang, Tian, Li, Zhang, Zhang, Liu and Yang2019; Su et al. Reference Su, Reymond, Brina, Bouillot, Machi, Delattre, Jin, Lövblad and Vargas2020), whose goal is the formation of a stable thrombus for successful treatment (Rajah, Narayanan & Rangel-Castilla Reference Rajah, Narayanan and Rangel-Castilla2017). These studies provide evidence that the haemodynamics has a controlling effect on thrombosis through the Lagrangian residence time of platelets and the Eulerian wall shear stress (WSS) on endothelial cells (Ngoepe et al. Reference Ngoepe, Frangi, Byrne and Ventikos2018).
More generally, despite not being fully understood, the mechanisms involved in the initiation, growth and rupture of aneurysms are considered to be strongly linked to the mechanical stresses applied on the vessel wall by the fluid, and more specifically their tangential component, WSS (Meng et al. Reference Meng, Tutino, Xiang and Siddiqui2014).
To understand the fluid mechanics of intracranial aneurysms, specifically sidewall aneurysms, flow in the aneurysmal sac can be interpreted as a combination of two canonical flows: flow over a cavity (the aneurysmal sac) and flow in a curved pipe (the parent vessel). These two flow configurations are relevant in a number of industrial and engineering processes, including internal flows through pipe networks, and external flows over wheel wells, fuel vents and landing gear bays (Sarno & Franke Reference Sarno and Franke1994). As a result, they have both been studied and characterized extensively, but independently (Eustice Reference Eustice1910; Dean Reference Dean1928; Weiss & Florsheim Reference Weiss and Florsheim1965; Burggraf Reference Burggraf1966; Pan & Acrivos Reference Pan and Acrivos1967; McConalogue & Srivastava Reference McConalogue and Srivastava1968; Collins & Dennis Reference Collins and Dennis1975).
The defining characteristics of steady viscous flow in a curved circular pipe are a shift in the maximum axial velocity towards the outer wall and the development of secondary flow vortices (Williams, Hubbell & Fenkell Reference Williams, Hubbell and Fenkell1902; Eustice Reference Eustice1910, Reference Eustice1911). In a theoretical analysis performed by Dean (Reference Dean1927, Reference Dean1928), and later expanded upon by McConalogue & Srivastava (Reference McConalogue and Srivastava1968), the flow solutions are shown to be dependent on a single non-dimensional number, later termed the Dean number,  $De = Re\sqrt {\kappa D/2}$, where
  $D$ is the pipe diameter,
  $\kappa$ is the pipe centreline curvature and
  $Re$ is the Reynolds number of the flow in the pipe. The magnitude of the secondary flow or Dean vortices and the outward radial shift of the maximum axial velocity were shown to increase with
  $De$ up to
  $De=606$ in these first analytic solutions. Later, finite-difference solutions showed that these trends continue for the entirety of the laminar range,
  $De=0\text {--}5000$ (Collins & Dennis Reference Collins and Dennis1975).
Pulsatile flows in a straight pipe have also been widely studied, and theoretical analysis showed that they depend on a single non-dimensional number: the Womersley number  $Wo = R \sqrt {{2 {\rm \pi}}/{T \nu }}$, where
  $R$ is the radius of the pipe,
  $T$ is the period of the flow and
  $\nu$ is the kinematic viscosity of the fluid (Womersley Reference Womersley1955). In addition to the dependence on the Womersley number
  $Wo$, pulsatile flows in curved pipes have also been shown to depend on the Dean number
  $De$ (Hamakiotes & Berger Reference Hamakiotes and Berger1988).
Flow over and inside of square cavities has been studied exhaustively since the 1960s, with some of the more notable early works showing that two primary flow topologies exist for cavities of finite aspect ratio (Weiss & Florsheim Reference Weiss and Florsheim1965; Burggraf Reference Burggraf1966; Pan & Acrivos Reference Pan and Acrivos1967; Shen & Floryan Reference Shen and Floryan1985). At  $Re \gtrapprox 100$, the bulk flow separates near the cavity–free stream interface and a primary recirculating vortex develops near the centre of the cavity, growing to fill more of its volume with increasing Re. At sufficiently high Re, the cavity consists of an inviscid vortex, and viscous effects are isolated to the boundaries. However, at low
  $Re$, the bulk flow expands into the cavity at the leading edge, exits at the trailing edge, and does not separate into a recirculating vortex. At all Re, small recirculation vortices are found in the corners (Moffat vortices). In a problem with greater relevance to aneurysm flow, Higdon (Reference Higdon1985) studied shear flow over a flat plate with a circular cavity. Flow patterns inside the cavity were studied at different depression angles, with a depression angle
  $\alpha = 0$ representing the limiting case of no cavity (just the flat plate) and
  $\alpha = 90^{\circ }$ representing a semicircular cavity. Below
  $\alpha = 68^{\circ }$, flow enters the cavity at the leading edge and exits at the trailing edge, remaining attached to the cavity wall. At deeper angles of depression, flow separation occurs and recirculation, counter-rotating to the free stream, occurs. At
  $\alpha = 135^{\circ }$, a geometry that largely resembles an idealized aneurysm, the cavity flow is dominated by a single recirculating vortex and very little disturbance to the free-stream flow field.
Sobey (Reference Sobey1980) extended the analysis of flow over a cavity by investigating the effect of unsteady, or pulsatile, free-stream flow. This work showed that the occurrence of separation for unsteady flow is dependent on the relationship between two opposing pressure gradients: a positive pressure gradient that is proportional to the acceleration of the free-stream flow, and a negative pressure gradient at the leading edge of the expansion due to a deceleration of the fluid entering the cavity. Separation may occur when the magnitude of the free-stream flow pressure gradient (rate of acceleration) decreases below a certain threshold and the adverse pressure gradient dominates. This condition for separation was shown to be a function of  $\textit {Re}$ and Strouhal (Womersley) numbers.
More recently, the haemodynamics of intracranial aneurysms has been studied numerically and experimentally, for idealized or patient-specific geometries (Sforza, Putman & Cebral Reference Sforza, Putman and Cebral2009). Asgharzadeh & Borazjani (Reference Asgharzadeh and Borazjani2016) numerically investigated the effect of  $\textit {Re}$ and
  $Wo$ for a straight parent vessel and a patient-specific geometry, and showed that these parameters impact the propagation of the vortex ring formed at the neck. These results differ from the observations made by Le, Borazjani & Sotiropoulos (Reference Le, Borazjani and Sotiropoulos2010), showing that
  $Wo$ does not affect the flow dynamics but that the amplitude of the pulsatile inflow does. Other studies on the haemodynamics of idealized aneurysmal geometry investigated the effect of different geometrical parameters (Imai et al. Reference Imai, Sato, Ishikawa and Yamaguchi2008; Nair et al. Reference Nair2016). More specifically, Imai et al. (Reference Imai, Sato, Ishikawa and Yamaguchi2008) highlighted the impact of the geometry of the parent vessel on the inflow pattern and flux, in a numerical study. By studying the haemodynamics in a spherical aneurysmal sac attached to parent vessels with different curvatures and orientations and for steady inflows, they observed that the secondary flow generated in the parent artery dominates the inflow into the aneurysm cavity. Epshtein & Korin (Reference Epshtein and Korin2018) also demonstrated, in their experimental study performed in idealized aneurysm geometries, that higher curvature of the parent vessel led to a lower washout time, but that changes in the pulsatility of the inflow had negligible effect on the washout.
In this context, the present study aims to investigate the full parameter range of inertia – convective, pulsatile and centrifugal – through a wide range of values in the physiological and anatomical range. Thus, the effect of the centreline curvature, flow rate and pulsatility of the parent vessel (i.e. a curved pipe) on the intra-aneurysmal haemodynamics is studied quantitatively (i.e. the fluid dynamics inside the spherical cavity), and its effect on the treatment with flow-diverting stents (addressed in the Part 2 companion paper, Barbour et al. Reference Barbour, Chassagne, Chivukula, Machicoane, Kim, Levitt and Aliseda2021). The effect of the curvature, characterized by the Dean number,  $De$, is assessed for different flow rates in the parent vessel and under steady and unsteady flow conditions, i.e. for varying
  $Re$ and
  $Wo$ numbers.
2. Experimental methods
2.1. Flow model
Four models with varying curvature  $\kappa$ were created for the study. In all models, the spherical cavity had a diameter of 7 mm and the round pipe had a diameter of 4 mm (figure 1). The spherical cavity was connected to the curved pipe so that the cavity opening length (along the flow path) was constant at 5 mm, corresponding to an angle between the spherical surface and the pipe equal to
  $\alpha = 144^{\circ }$. The pipe diameter, cavity diameter and cavity opening width are chosen such that the models are representative of a typical sidewall aneurysm found within the circle of Willis (Parlea et al. Reference Parlea, Fahrig, Holdsworth and Lownie1999). The curvature of the pipe centreline varied in the range
  $\kappa = 0,0.0625,0.14$ and
  $0.22 \ \textrm {mm}^{-1}$ (
 $R_c = \infty,16,7,4.5\ \textrm {mm}$, respectively). The angle between the two straight sections of the pipe upstream and downstream of the cavity was constant at 60
 $^{\circ }$. As a result, the arclength of the curved section of the pipe differed between models.

Figure 1. Sketch of the curved pipe with a spherical cavity, with the key geometrical parameters used to define the study and the four different models with varying centreline curvatures ( $\kappa = 0,0.0625,\ 0.14$ and
  $0.22\ \textrm {mm}^{-1}$).
To create the transparent flow models, a ‘positive’ print of the interior of the model was first made from polylactic acid (PLA; Flashforge, Rowland Heights, CA, USA). This part was coated with mould release (XTC-3D, Smooth-on, Macungie, PA, USA) and cast in silicone rubber (OOMOO 25, Smooth-on, Macungie, PA, USA). This mould was then carefully split along the pipe centreline, the PLA positive was extracted, and water-soluble wax (Freeman Optical Soluble Wax, Freeman Manufacturing and Supply Co., Avon, OH, USA) was poured into the negative silicone rubber mould and cured. The positive wax part was removed from the mould, placed in the centre of an acrylic box and cast into an optically transparent silicone elastomer (Sylgard 184, Dow Corning Corp., Auburn, MI, USA). The resultant silicone model was placed in a water bath to dissolve the positive wax part and produced an optically clear in vitro flow model with the characteristics of the geometry under study (Chivukula et al. Reference Chivukula2019).
The working fluid was a 47.5 : 35.8 : 16.7 water : glycerine : NaCl mixture (by weight) with a viscosity of 3.8 cP. This was chosen to match the index of refraction of the silicone models, avoiding refraction artifacts in the imaging of the flow.
2.2. Flow analysis
Steady flow was generated by a constant hydrostatic pressure in a reservoir connected through an open flow loop to the model. Flow rate was controlled using a high-precision needle valve and measured using an ultrasonic flow meter (Titan, Dorset, UK) downstream of the flow phantom. The flow rates used in the experiments were chosen to produce  $Re_{pipe}$ equal to 120, 240, 360 and 480, covering the full range of
  $Re$ in the human internal carotid artery (Ford et al. Reference Ford, Alperin, Lee, Holdsworth and Steinman2005).
Unsteady flow conditions were created by a pulsatile pump (Harvard Apparatus, Boston, MA, USA) that was connected to the flow model in the test section by rigid tubing (figure 2). The time-averaged Reynolds number,  $\overline {Re}_{pipe}$, was controlled to match exactly the four values of
  $\textit {Re}$ used in the steady experiments: 120, 240, 360 and 480. Two frequencies were chosen for the periodic unsteady inflow:
  $0.8$ Hz and
  $1.6$ Hz (approximately 50 and 100 cycles per minute). These frequencies resulted in Womersley numbers
  $Wo$ equal to 0 (steady), 2.6 and 3.6. The peak
  $\textit {Re}$ for all unsteady experiments was set to be double the time average. The acceleration phase was set to be shorter than the deceleration phase (40 %/60 % of the time period) to accentuate the unsteady acceleration and move away from a pure harmonic inflow.

Figure 2. Schematic of the experimental configuration.
Stereoscopic particle image velocimetry (PIV) measurements of flow inside the flow phantoms were made with a solid-state dual-head laser emitting short ( $O(10^{-8}~\textrm {s})$) pulses of visible light at 527 nm (TerraPIV, Continuum, San Jose, CA, USA), and two high-resolution, high-speed cameras (Phantom v641, Vision Research, Wayne, NJ, USA). The models and laser plane were arranged so that the laser plane was oriented in the streamwise direction, traversing down through the top of the cavity and across the pipe, as sketched in figure 2. PIV measurements were collected at the plane of symmetry of the model, with a laser plane thickness of 1.5 mm. The fluid was seeded with 10
  $\mathrm {\mu }$m diameter spherical hollow glass particles (TSI, Shoreview, MN, USA). For the analysis of the steady flow, 2500 image pairs were recorded for each experimental condition, with the frame rate of the cameras varying from 200 to 500 Hz as the
  $\textit {Re}$ or
  $Wo$ numbers increased. For the pulsatile flow, a total of 5800 image pairs were analysed for each case, to achieve fully converged phase-averaged statistics.
The quality of the measurements depends critically on the stereoscopic calibration procedure. A clear target with a grid of black dots was submerged in the tank, filled with the same water : glycerine : NaCl fluid as used inside the flow models. The target was traversed perpendicular to the imaging plane and imaged at nine positions spanning the laser plane thickness.
Velocity fields,  ${\boldsymbol {u}}$, were calculated at the plane of symmetry for each of the four models and all flow conditions. The experimental parameters varied with the length of the cycle (frequency of the inflow) and the
  $\textit {Re}$ in the free stream. For the steady inflow conditions, velocity measurements were obtained separately in the free stream and in the cavity. As the velocity magnitude inside the cavity is almost an order of magnitude lower than that in the curved pipe, PIV image collection and analysis were performed separately, with different experimental parameters (acquisition frequency and
  ${\rm \Delta} t$ between each pair of images), for the curved free stream and the cavity flow domains. For the pulsatile inflow conditions, velocity fields were only obtained inside the cavity.
2.3. Analysis of velocity fields
The stereo PIV measurements provide the three components of the velocity field in the plane of symmetry of the aneurysm geometry figure 3. Several metrics were derived from the analysis of these two-dimensional velocity fields. The fields obtained for several cycles were averaged onto one cycle. The velocity at the opening of the cavity (i.e. the aneurysm neck),  $\bar {u}$, was computed by integrating the inward velocities along the opening of the cavity:
 \begin{equation} \bar{u} = \frac{1}{L_1-L_0}\int_{L_0}^{L_1} {\boldsymbol{u}} \boldsymbol{\cdot} {\boldsymbol{n}} \, {\textrm{d}}l,\end{equation}
with the boundaries  $L_0$ and
  $L_1$ of
  ${\boldsymbol {u}} \boldsymbol {\cdot } {\boldsymbol {n}}$ being positive. This velocity is representative of the amount of flow entering the cavity. The Reynolds number at the opening
  $Re_{opening}$ was computed from this velocity:
  $Re_{opening}= \bar {u} D_{opening} / \nu$. The circulation in the aneurysm
  $\varGamma$ was computed as the space integral of the vorticity over the area of the cavity. Finally, the location of the centre of the vortex was defined as the location of the minimum velocity magnitude in the cavity.

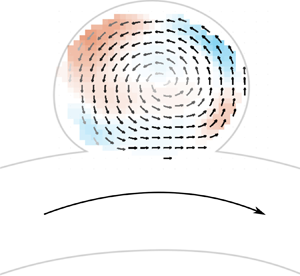
Figure 3. Velocity fields in the cavity in the plane of symmetry of the aneurysm geometry (highlighted in red in the schematic of the aneurysm geometry). The colours represent the magnitude of the out-of-plane velocity and the vectors represent the in-plane velocity. The vectors’ grey intensity is proportional to the in-plane velocity magnitude. Columns from left to right correspond to increasing free-stream curvature  $\kappa$ and the rows from top to bottom correspond to increasing inflow
  $Q_{pipe}$ (i.e. increasing Re).
3. Results
3.1. Steady flow
3.1.1. Flow field topology
The velocity fields in the spherical cavity are shown in figure 3. The colour represents the out-of-plane velocity and the vectors represent the in-plane velocity. The grey intensity of the vectors is proportional to the in-plane velocity magnitude. The flow in the curved pipe is from left to right. For all experimental conditions (flow rates,  $Q_{pipe}$ and pipe curvatures), the flow separates at the leading edge of the cavity. The flow enters the cavity at the trailing edge (downstream), expands into it, rotating anticlockwise, and exits at the leading edge (upstream) (figure 3). The flow separation from the pipe wall at the leading edge brings the vorticity from the pipe wall into the cavity and forms a single counter-rotating vortex. As the pipe
  $\textit {Re}$ increases (down the rows), the flow topology remains unchanged but the velocity and vorticity in the cavity increase. The same is true for increasing pipe
  $De$ (curvature increases by columns from left to right), as the Dean flow along the centre of the curved pipe shifts the peak free-stream velocity towards the upper wall, increasing the magnitude of the velocity near the wall as it reaches the cavity, mimicking the effect of increasing the overall flow rate in the pipe. There is, however, an important difference: the out-of-plane velocity evolves in a complex manner with increasing pipe curvature. The flow rotation is three-dimensional and not contained in the cavity's plane of symmetry. As the curvature increases, the flow becomes more three-dimensional, with the flow entering the cavity transitioning from having a negative out-of-plane velocity component (shown in blue in figure 3) to a positive out-of-plane velocity component at the highest curvature (shown in red). Additionally, an increase in curvature results in an increase in the percentage of flow that is entering the aneurysm. This can be observed in the zero or positive vertical velocity component of the vectors at the cavity–free stream interface in the two highest curvatures, compared to the negative vertical velocity component at the cavity entrance for the two lowest curvatures.
This single counter-rotating vortex has been described for steady laminar flow in a spherical or square cavity (Sobey Reference Sobey1980; Stephanoff, Sobey & Bellhouse Reference Stephanoff, Sobey and Bellhouse1980; Higdon Reference Higdon1985; Tippe & Tsuda Reference Tippe and Tsuda2000), as well as in aneurysm geometries (Hoi et al. Reference Hoi, Meng, Woodward, Bendok, Hanel, Guterman and Hopkins2004; Imai et al. Reference Imai, Sato, Ishikawa and Yamaguchi2008). The flow topology was found to depend on the opening angle of the cavity and the ratio between the depth and the width of the cavity. For small  $\textit {Re}\ (\textit {Re} \leq 5)$ Stephanoff et al. (Reference Stephanoff, Sobey and Bellhouse1980) observed no separation between the flow in the pipe and the flow in the cavity. Similarly, for small opening angle of the cavity
  $(\alpha = 65^{\circ })$ and at very low
  $\textit {Re}$, Higdon (Reference Higdon1985) described no separation of the flow from the walls at the leading edge of the cavity. However, separation was described for all higher opening angles, which agrees very well with the experimental observations in this study.
Figure 4 shows the velocity field in the curved pipe for the different free-stream  $\textit {Re}$ (flow rates) and
  $De$ (curvature values,
  $\kappa$). For the case with zero curvature
  $(\kappa = 0.0\ \textrm {mm}^{-1})$, the maximum velocity is at the pipe axis, following a Poiseuille flow velocity profile. By increasing the curvature of the pipe, the maximum velocity is shifted towards the outer wall of the pipe, towards the cavity opening. This asymmetry in the free-stream flow leads to increased flow rate entering the cavity and an increased velocity inside, as can be observed in figure 3. This phenomenon is dominated by the Dean number,
  $De$, and, as it increases (diagonally from top left to bottom right in figure 4), the velocity shift towards the outer edge of the curved pipe is magnified and the velocity gradient at the wall near the cavity increases, and, as a result of these changes, the slope of the velocity profile at the leading edge of the cavity becomes steeper.

Figure 4. Free-stream velocity (in the parent vessel, highlighted in red on the aneurysm schematic) for different pipe curvatures and inflow rates. The colours represent the velocity magnitude, and the arrows represent the direction of the in-plane velocity (columns, from left to right) corresponding to increasing pipe curvature  $\kappa$ (Dean number increases diagonally from top left to bottom right) and (rows, from top to bottom) corresponding to increasing Reynolds number (inflow rate,
  $Q_{pipe}$).
The location of the centre of the vortex was computed from the velocity field, shown in figure 5 for the four values of curvature  $\kappa$ (colours) and the four free-stream
  $\textit {Re}$ (symbols). As the Dean number increases, the location of the vortex centre moves further into the cavity (further from the opening of the cavity). The behaviour with increasing Reynolds number is not as clearly defined, corresponding to the strong effect that the Dean number has on this flow (note that, as the Reynolds number increases, the Dean number also increases even for a constant curvature value). For the lowest and highest curvature values (blue and orange in figure 5), the motion of the centre of the vortex is anticlockwise, that is, it follows the sense of rotation of the cavity vortex. For the intermediate curvature values, the centre of the vortex moves clockwise inside the cavity in the direction contrary to the sense of rotation of flow inside the cavity. This difference in the direction of motion of the centre of the vortex is associated with the strong increase in the three-dimensionality of the cavity flow with Reynolds number, visible by the out-of-plane velocity measurements described above.

Figure 5. Location of the centre of the vortex for the different  $\textit {Re}$ and
  $De$ (curvature of the pipe) numbers.
The relocation of the centre of the vortex for an increased  $\textit {Re}$ in the pipe has been described for the flow in a furrow (Sobey Reference Sobey1980). By increasing
  $Re_{pipe}$, the centre of the single vortex formed inside the furrow moved downstream and deeper in the cavity. In our study, the effect of the curvature of the parent vessel on the velocity profile changes the momentum and the vorticity injected at the trailing edge of the cavity, and these changes tend to relocate the centre of the vortex deeper in the cavity, with a stronger effect than the increase in the
  $\textit {Re}$ of the free stream outside the cavity.
3.1.2. Velocity characterization
The flow velocity injected into the cavity is computed along a line at the cavity opening. Figure 6 shows the velocity at the opening for the different experimental conditions. The flow enters the cavity at the trailing edge (downstream) over a narrow region but with high net inflow velocity. It then recirculates anticlockwise, slows down and exits the cavity at the leading edge (upstream) over a wider area and with a lower velocity. The velocity profile at the opening of the cavity thus presents a strong asymmetry from the trailing-edge inflow to the leading-edge outflow. The profiles show a strong effect of the Dean number, causing a large increase of the velocity entering the cavity. For low  $De$, the flow entering the cavity is localized at the trailing edge. As
  $De$ increases, the flow entering the cavity occupies a larger area, growing towards the centre of the cavity opening. The direction of the velocity vectors entering the cavity is also influenced by the curvature of the pipe. For higher Dean number, the flow entering the cavity is directing towards the downstream part of the wall. The change of direction of the inflow jet may impact the growth of the aneurysm (increased WSS in these areas and over a larger area). These observations are consistent with the numerical analysis by Hoi et al. (Reference Hoi, Meng, Woodward, Bendok, Hanel, Guterman and Hopkins2004), showing that increasing the curvature leads to a larger impact zone (i.e. an increased flow impingement). This important impinging jet entering the cavity, which becomes more important with the curvature of the parent vessel, has been found to impact the outcomes of treatment with flow diverters (Chen et al. Reference Chen, Zhang, Tian, Li, Zhang, Zhang, Liu and Yang2019; Su et al. Reference Su, Reymond, Brina, Bouillot, Machi, Delattre, Jin, Lövblad and Vargas2020). Hence, aneurysms attached to a vessel with high curvature may be more likely to fail when being treated with diverters.

Figure 6. Velocity at the opening of the cavity (highlighted in red in the aneurysm schematic). The lines are coloured as a function of  $\boldsymbol {u} \boldsymbol {\cdot } \boldsymbol {n}$, blue meaning that the flow is exiting the cavity (
 $\boldsymbol {u} \boldsymbol {\cdot } \boldsymbol {n} < 0$) and red meaning that the flow is entering through the opening (
 $\boldsymbol {u} \boldsymbol {\cdot } \boldsymbol {n} > 0$).
Figure 7(a) shows that the average inflow velocity into the cavity,  $\bar {u}$ (2.1), is proportional to the flow rate in the curved pipe
  $Q_{pipe}$, but this proportionality varies with the curvature of the pipe. In the straight model, the radial velocity component is zero upstream of the cavity. However, even at very low
  $Re_{pipe}$, the flow separates and enters the cavity. Because the radial component of the velocity upstream is zero for the straight pipe (no curvature), the velocity at the opening
  $\bar {u}$ is only slightly influenced by an increase in the free-stream
  $\textit {Re}$ (figure 7a). When the pipe is curved, the flow in the cavity is driven by the upstream asymmetrical flow in the pipe, which is shifted towards the cavity, and as the curvature increases, the free-stream flow becomes more asymmetrical. Consequently, the flow into the cavity becomes more sensitive to the inertia of the free-stream flow (i.e.
  $Re$).

Figure 7. (a) Velocity of the flow entering the cavity as a function of the flow rate in the pipe for the four different curvatures. (b) Reynolds number  $\textit {Re}$ at the opening of the cavity as a function of
  $De$.
$De$.
The velocity at the opening of the cavity  $Re_{opening}$ was found to be proportional to the Dean number (figure 7b). By increasing
  $De$, the shift in axial velocity towards the outer wall in a curved pipe is accompanied by secondary vortices transporting the fluid along the centre plane from the inner to the outer wall. The magnitude of the outward radial velocity component at the midplane of the pipe increases with increasing curvature. As a result, the magnitude of flow entering the aneurysm also increases.
4. Unsteady flow
4.1. Flow structure over a cycle
Figure 8 shows the circulation in the spherical cavity over time (a whole cycle), for the four different Reynolds numbers at a single value of pipe curvature ( $\kappa = 0.063 \ \textrm {mm}^{-1}$) and Womersley number (
 $Wo = 2.5$). The pulsatile flow in the free stream is forced in such a way that the acceleration phase is shorter than the deceleration (
 $40\,\%/60\,\%$). This results in a steeper slope for the velocity increase than for the velocity decrease. The peak circulation and variation of circulation over the course of the flow cycle increase with increasing free-stream
  $Re$.
$Re$.

Figure 8. Circulation in the cavity ( $Wo = 2.5$) over the cycle for four different
  $\textit {Re}$ in the curved pipe (
 $\kappa = 0.063 \ \textrm {mm}^{-1}$).
As observed for steady inflow, the flow in the cavity always separates at the leading edge (figure 9), for all experimental conditions and cavity–pipe geometries. Flow enters the cavity near the trailing edge and rotates anticlockwise inside the spherical cavity (in the direction opposite to the free-stream flow) before exiting the cavity near the leading edge, reattaching to the free-stream flow in the curved pipe. The aspect ratio of the cavity will have an effect on the number of vortices formed inside the cavity, and this will be studied in a follow-up experiment; but for the current spherical shape and range of Reynolds numbers, there is a single three-dimensional vortex that fills the cavity, and that is maintained during the entire period. The observations differ from previous numerical studies run for a straight parent vessel (Asgharzadeh & Borazjani Reference Asgharzadeh and Borazjani2016; Asgharzadeh et al. Reference Asgharzadeh, Asadi, Meng and Borazjani2019), for which a single counter-rotating vortex was only observed during the acceleration of the flow in the vessel. However, the geometry of the aneurysmal sac and more specifically the opening (i.e. the neck of the aneurysm) were larger than in the present study.

Figure 9. Velocity field in the cavity at four points of the cycle for  $\textit {Re} = 240, Wo = 2.5$ and
  $\kappa = 0.063\ \textrm {mm}^{-1}$.
During the acceleration phase (from A to B in figure 9), the velocity inside the cavity increases. The acceleration of the flow in the pipe and the asymmetry of the velocity profile in the pipe due to its curvature lead to the motion of the centre of the vortex, which rotates in the same direction as the flow recirculation. The centre is pushed deeper into the cavity by the flow in the pipe (further from the opening of the cavity), as shown in figure 9. This relocation of the centre of the vortex is similar to that observed for the steady case as the free-stream  $Re$ increased.
During the deceleration phase (from B to C in figure 9), as the velocity in the cavity decreases, the centre of the vortex rotates back towards the cavity entrance, still following the sense of rotation of the recirculation, which is maintained throughout the deceleration phase. At the very end of the deceleration phase, the centre of the vortex is very close to the cavity opening and the velocity is very low, but the flow in the cavity remains separated from the flow in the pipe (D in figure 9). This is consistent with the observations made for the steady case, for which the flow in the cavity is always separated from the flow in the curved pipe, even at low free-stream  $Re$ and low Dean number (i.e. low curvature of the pipe).
The motion of the centre of the vortex during the flow cycle is consistent with the description of pulsatile flow in a furrowed channel in Sobey (Reference Sobey1980). However, in that study, the flow in the furrow separated during the acceleration phase and then reattached at the end of the deceleration phase. This is likely to be due to the significantly lower free-stream  $Re$ examined in that study and the lack of curvature. Further investigation into the effect of a lower cavity Reynolds number is explored in Part 2 of this work (Barbour et al. Reference Barbour, Chassagne, Chivukula, Machicoane, Kim, Levitt and Aliseda2021).
For steady flow, the location of the centre of the vortex is influenced by the Reynolds and Dean numbers (the flow rate and curvature in the pipe). In the unsteady inflow case, the centre of the vortex moves across the cavity during the cycle, exhibiting a certain amount of hysteresis, as shown in figure 10. As discussed for one of the cases in figure 9, the trajectory of the centre differs between the acceleration and deceleration phases. This hysteresis is influenced by the experimental conditions and the geometry of the models. At low Dean number (low curvature of the pipe or at low free-stream  $\textit {Re}$), a non-stationary vortex is formed, with its centre moving over a wide range during the period (figure 10, A). At increasing free-stream
  $\textit {Re}$ (increasing inertia), the vortex centre follows a more confined trajectory (figure 10, B). But despite increasing inertia, the location of the centre of the vortex persistently moves during the cycle. Shortening the length of the cycle (i.e. increasing the Womersley number by increasing the frequency of the pulsatile forcing) tends to shorten the trajectory of the centre of the vortex but does not stop this hysteretic motion (figure 10, D). Finally, increasing the Dean number (increasing the curvature of the pipe while keeping the Reynolds number constant) leads to a more stationary vortex, with the least range of motion of its centre (figure 10, C). As a consequence of the increased centrifugal inertia in the free stream, the asymmetry of the flow in the pipe at the leading edge impacts the flow entering the cavity, its velocity and amount of circulation. In this high-Dean-number case, the inertia of the vortex is so high that the circulation remains high throughout the cycle, even during the deceleration phase, minimizing the motion of the vortex centre.

Figure 10. Location of the centre of the vortex in the spherical cavity for a pulsatile flow in the pipe: A,  $Re = 240, Wo = 2.5, \kappa = 0.063 \ \textrm {mm}^{-1}$; B,
  $Re = 480, Wo = 2.5, \kappa = 0.063 \ \textrm {mm}^{-1}$; C,
  $Re = 480, Wo = 2.5, \kappa = 0.22 \ \textrm {mm}^{-1}$; and D,
  $Re = 240, Wo = 3.2, \kappa = 0.063 \ \textrm {mm}^{-1}$.
The relocation of the centre of the vortex during the acceleration phase was numerically observed by Asgharzadeh & Borazjani (Reference Asgharzadeh and Borazjani2016). In their simulations, on a straight parent vessel, the vortex is not maintained throughout the cycle. However, during the acceleration, the centre of the vortex is relocated towards the downstream aneurysm wall and deeper in the cavity.
4.2. Inertial effects (Dean and Reynolds numbers)
Figure 11(a) shows the non-dimensional spatial average of the velocity inside the cavity, temporally averaged over the flow cycle (Reynolds number in the cavity  $\textit {Re}_{cavity}$), as a function of
  $\textit {Re}_{pipe}$. Similar to the steady inflow results, the velocity in the cavity is found to be proportional to
  $Re_{pipe}$ for a given value of pipe curvature. The magnitude of velocity in the cavity also becomes more sensitive to increases of free-stream inertia with increasing pipe curvature (i.e. the slope of lines increases with curvature). Indeed, with increasing curvature, the flow in the pipe becomes more asymmetric, with more inertia contained in the upper half of the pipe, resulting in a larger part of the pipe flow entering and recirculating in the cavity. Both the extent of flow into the cavity and its velocity magnitude increase with the pipe curvature, as described previously for steady flow.

Figure 11. Plots of (a)  $\textit {Re}$ in the cavity as a function of
  $\textit {Re}$ in the curved pipe, and (b) circulation in the cavity as a function of
  $De$.
$De$.
The flow topology in the free stream, including the asymmetry of the velocity profile at the leading edge of the cavity, which strongly impacts the recirculation in the spherical cavity, is dominated by the combination of flow inertia in the free stream and centrifugal inertia near the outer wall of the curved pipe, which determines the flow at the cavity opening. This combination points to the Dean number,  $De$, as the controlling non-dimensional parameter for this phenomenon. Figure 11(b) shows that the time-averaged circulation in the cavity collapses for all cases when plotted against the Dean number,
  $De$, and, in fact, is directly proportional to it. However, even if the trend is similar between steady and pulsatile inflows, the average circulation is generally higher for cases with steady inflow, as shown in figure 12, where circulation in the cavity,
  $\varGamma$, is shown for steady flow (
 $Wo = 0$), and time-averaged over the flow cycle for both pulsatile conditions (
 $Wo = 2.6$ and 3.6). At a given value of
  $De$, higher values of circulation are seen in the steady inflow condition when compared to the two pulsatile conditions. This means that the circulation injected into the cavity during the acceleration phase does not compensate for the decrease in circulation introduced during deceleration. This could partly be caused by the instability of the vortex associated with pulsatile inflow, compared to the very stationary vortex induced by the steady inflow. The fact that the circulation is higher for steady versus pulsatile, even for the highest-Dean-number case (figure 12), where the vortex motion is significantly reduced, shows that the amount of circulation brought by the flow in the pipe over a cycle is lower for unsteady conditions than the quasi-steady injection of vorticity in the cavity associated with steady inflow.

Figure 12. Circulation  $\varGamma$ averaged over the cycle for the three Womersley numbers
  $Wo = 0, 2.6$ and
  $3.6$ as a function of
  $De$.
$De$.
The values of the circulation for  $Wo = 2.6$ and
  $Wo = 3.6$ are very similar. This supports the finding of a very limited impact of the frequency of the pulsatile inflow on the flow in the cavity, within the range of frequencies studied in these experiments. The main impact of the variation of the inflow frequency on the flow topology is on the motion of the centre of the vortex. The length of the path of the vortex centre trajectory along the period is reduced by 25 % when
  $Wo$ was increased from
  $2.6$ to
  $3.6$ (doubling the frequency of the inflow from 50 to 100 cycles per minute).
The  $\textit {Re}$ in the pipe also impacts the trajectory of the centre of the vortex during the cycle, as previously described for figure 10. Figure 13 shows the ratio between the area covered by the centre of the vortex during the cycle and the area of the cavity. At low Reynolds number and for the lowest curvature of the pipe, the location of the centre of the vortex is strongly influenced by the acceleration and deceleration of the flow in the pipe, resulting in a large area covered by the centre during the cycle. For low
  $Re_{pipe}$ but high Dean number, the inertia brought by the curvature of the flow in the pipe results in a more stationary vortex and a smaller area covered by the centre during the cardiac cycle.

Figure 13. Area covered by the motion of the centre of the vortex across the cycle as a function of  $\textit {Re}_{pipe}$.
By increasing  $Re$ in the free stream, the influence of
  $Wo$ (acceleration and deceleration) of the inflow on the flow topology is reduced and the area covered by the centre of the vortex is reduced, for all Dean numbers. The increased inertia brought by the free-stream flow increases the stability of the vortex in the cavity, minimizing its motion throughout the flow cycle.
5. Conclusion
Flow in a spherical cavity attached to a curved circular pipe, used as an idealized aneurysm, has been investigated for intermediate Reynolds numbers ( $\textit {Re} = 100\text {--}500$). The analysis focuses on the effect of the curvature of the centreline of the pipe on the flow patterns in the cavity, and includes both steady and pulsatile inflow conditions.
For every value of pipe curvature and  $\textit {Re}_{pipe}$, a single counter-rotating vortex is observed in the cavity. This flow pattern agrees well with previous observations made for spherical or square cavities (Sobey Reference Sobey1980; Stephanoff et al. Reference Stephanoff, Sobey and Bellhouse1980; Higdon Reference Higdon1985; Tippe & Tsuda Reference Tippe and Tsuda2000) and idealized aneurysm geometries (Imai et al. Reference Imai, Sato, Ishikawa and Yamaguchi2008; Epshtein & Korin Reference Epshtein and Korin2018).
As described in canonical Dean flows, the curvature of the pipe centreline leads to an asymmetrical velocity profile, with peak axial velocity shifting outwards towards the outer wall and the spherical cavity opening. As a consequence, higher values of pipe curvature result in more momentum entering the cavity and influencing the strength and location of the vortex centre. With increasing values of pipe curvature, the centre of the vortex moves deeper into the cavity. The centre also relocates as the Reynolds number of the free stream increases, as was described for the flow in a furrow (Sobey Reference Sobey1980). For pulsatile inflows, the location of the centre varies between the acceleration and deceleration phase of the inflow and is influenced by the free-stream  $\textit {Re}$ and
  $Wo$, as well as the
  $De$ (curvature of the pipe centreline). During acceleration, the centre moves deeper in the cavity and then relocates towards the opening of the cavity during deceleration. Increases in
  $Wo$ shorten the trajectory of the vortex centre, while increases in
  $De$ stabilize the vortex, with high values of
  $De$ producing minimal vortex motion.
As a consequence of the asymmetry of the velocity profile induced by the curvature of the pipe, the strength of circulation in the cavity and magnitude of velocity at the cavity neck are dominated by the Dean number for both steady and pulsatile inflows. However, even if this trend is similar for steady and pulsatile inflows, the time-averaged circulation is higher for steady inflow cases, suggesting that the circulation injected in the cavity during the acceleration phase does not compensate for the decrease in circulation induced by the deceleration of the free stream. For pulsatile inflow cases, the effect of the Womersley number  $Wo$ on the circulation in the cavity is very small.
This study, which has focused on the effect of pipe curvature, flow rate ( $Re$) and inertia (
 $Wo$), shows that the flow in a spherical cavity attached to a curved pipe is dominated by the Dean number
  $De$. Other geometrical parameters, such as the shape of the cavity or the size of the opening, may impact the flow patterns in the cavity, but were not studied here.
The geometry studied here, namely flow in a curved pipe connected to a spherical cavity, is an idealized representation of a common biofluid mechanics problem: sidewall cerebral aneurysms. Understanding the fluid mechanics of cerebral aneurysms is crucial to advancing our knowledge of the disease's progression and our ability to design optimal treatment options. In Part 2 of this study (Barbour et al. Reference Barbour, Chassagne, Chivukula, Machicoane, Kim, Levitt and Aliseda2021), we expand upon our work by incorporating aneurysm treatment methods that drastically reduce the flow into the spherical cavity and create entirely new flow features.
Funding
This work has been financially supported by the NIH/NINDS (grants 1R03NS078539 and 1R01NS088072) and by the American Heart Association via a Postdoctoral fellowship (19POST34450082). This work was supported by an unrestricted grant in the form of the pipeline devices to our academic institution from Medtronic Inc., which had no role in the experimental design, data analysis or scholarship of this work. F.C. and M.C.B. contributed equally to this paper.
Declaration of interest
The authors report no conflict of interest.


