Introduction
Worry is defined as a chain of thoughts and images that are negatively affect-laden, emerging when one anticipates a potential threat, but doubts his/her ability to cope (Borkovec et al., Reference Borkovec, Ray and Stober1998; Brosschot et al., Reference Brosschot, Gerin and Thayer2006). Although emotionally disturbing, previous studies suggest that worry has its adaptive functions and could be considered a compensatory strategy employed in response to perceived danger (Newman et al., Reference Newman, Llera, Erickson, Przeworski and Castonguay2013). However, worry can become chronic and intolerable if not effectively regulated, which results in discomfort, disruption, and a decline in quality of life (Borkovec et al., Reference Borkovec, Ray and Stober1998). Indeed, worry constitutes an important transdiagnostic process that pervades many anxiety and mood disorders (Ehring and Watkins, Reference Ehring and Watkins2008; Sharp et al., Reference Sharp, Miller and Heller2015; Barlow et al., Reference Barlow, Allen and Choate2016). For instance, the central feature of generalized anxiety disorder (GAD) is chronic, excessive, and uncontrollable worry (Borkovec and Inz, Reference Borkovec and Inz1990; Borkovec et al., Reference Borkovec, Alcaine, Behar, Heimberg, Turk and Mennin2004). Likewise, worry has frequently been associated with major depression (Chelminski and Zimmerman, Reference Chelminski and Zimmerman2003) and neuroticism (Servaas et al., Reference Servaas, Riese, Ormel and Aleman2014).
Taken together, worry is a pervasive experience in humans, and yet, individuals exhibit wide heterogeneity in their propensity to experience worrisome thoughts. Therefore, establishing predictive models to assess current worry symptoms would have potential clinical value. In the current study, we aimed to decode dispositional worry from neuroimaging data. Our purpose was to establish potential neural markers that are indicative of worry as a core symptom of psychiatric disorders.
Previous neuroimaging studies revealed the correlation of worry propensity with activity and structural changes in emotion processing (e.g. amygdala) and regulation (e.g. prefrontal cortex) regions. Also shown previously, is the correlation of worry propensity with functional and structural connectivity between these neural networks. Stronger worry tendencies were associated with lower activation in response to aversive events in the prefrontal cortex and anterior cingulate cortex (ACC) (Schienle et al., Reference Schienle, Schäfer, Pignanelli and Vaitl2009), as well as lower ACC and prefrontal cortex volumes, and higher striatal volume (Hilbert et al., Reference Hilbert, Pine, Muehlhan, Lueken, Steudte-Schmiedgen and Beesdo-Baum2015; Andreescu et al., Reference Andreescu, Tudorascu, Sheu, Rangarajan, Butters, Walker, Berta, Desmidt and Aizenstein2017). Furthermore, functional couplings between prefrontal and limbic regions account for worry tendencies, such that higher dispositional worry is correlated with weaker functional connectivity in the prefrontal–limbic pathway (Makovac et al., Reference Makovac, Meeten, Watson, Herman, Garfinkel, Critchley and Ottaviani2016; Meeten et al., Reference Meeten, Davey, Makovac, Watson, Garfinkel, Critchley and Ottaviani2016). Lastly, evidence derived from diffusion tensor imaging (DTI) research has indicated that worry propensity is related to white matter (WM) integrity in the frontal cortex, ACC, and amygdala (Zhang et al., Reference Zhang, Li, Yu, Liu, Tang, Tan, Liao, Yang and Shan2013a, Reference Zhang, Liao, Tang, Yang, Liao, Shan, Liu and Lib; Andreescu et al., Reference Andreescu, Tudorascu, Sheu, Rangarajan, Butters, Walker, Berta, Desmidt and Aizenstein2017). In particular, higher worry severity was associated with decreased mean diffusivity (MD) in the left orbital frontal cortex and ACC, as well as increased MD in the right putamen (Andreescu et al., Reference Andreescu, Tudorascu, Sheu, Rangarajan, Butters, Walker, Berta, Desmidt and Aizenstein2017), and increased fractional anisotropy (FA) in the amygdala (Zhang et al., Reference Zhang, Li, Yu, Liu, Tang, Tan, Liao, Yang and Shan2013a, Reference Zhang, Liao, Tang, Yang, Liao, Shan, Liu and Lib). Furthermore, previous DTI studies revealed that GAD is associated with lower FA in the uncinate fasciculus, a primary WM tract connecting the amygdala and frontal cortex (Ayling et al., Reference Ayling, Aghajani, Fouche and van der Wee2012; Hettema et al., Reference Hettema, Kettenmann, Ahluwalia, McCarthy, Kates, Schmitt, Silberg, Neale, Kendler and Fatouros2012; Tromp et al., Reference Tromp, Grupe, Oathes, McFarlin, Hernandez, Kral, Lee, Adams, Alexander and Nitschke2012; Liao et al., Reference Liao, Yang, Zhang, He, Su and Li2014). Additionally, compared with controls, GAD patients also exhibited reduced FA in the inferior fronto-occipital fasciculus, inferior longitudinal fasciculus, and corona radiate (Liao et al., Reference Liao, Yang, Zhang, He, Su and Li2014). Besides previous studies on dispositional worry or GAD, there is also evidence showing that mood and anxiety disorder is associated with WM integrity in other tracts implicated in emotional processing, including fornix and cingulum (Abe et al., Reference Abe, Yamasue, Kasai, Yamada, Aoki, Iwanami, Ohtani, Masutani, Kato and Ohtomo2006; Yu et al., Reference Yu, Lee and Lee2017). Taken together, previous findings suggest that mood and anxiety disorder is closely associated with interactions between networks responsible for emotion regulation and processing (e.g. prefrontal and limbic networks), and thus provide potential candidates for the neuromarkers of trait worry.
Importantly however, previous findings on the neural basis of dispositional worry were based on the univariate correlational approach, which is subject to several serious limitations. First, univariate analysis possesses limited sensitivity to identify subtle and spatially distributed effects. Subtle and distributed information across large-scale neural networks might play a critical role in maintaining worry tendencies. This is especially pertinent considering that worry is a multi-faceted construct, and presumably relies on the functional and structural integrity of distributed networks. In agreement with this assertion, previous studies using the univariate approach often reported inconsistent findings on the neural substrates of worry propensity (Paulesu et al., Reference Paulesu, Sambugaro, Torti, Danelli, Ferri, Scialfa, Sberna, Ruggiero, Bottini and Sassaroli2010; Zhang et al., Reference Zhang, Zhang, Li, Li, Li, Ma, Hou, Zhang, Zhang and Wang2011; Liao et al., Reference Liao, Yang, Zhang, He, Su and Li2014; Bergamino et al., Reference Bergamino, Farmer, Yeh, Paul and Hamilton2017). Second, the traditional in-sample correlation approach is prone to overfitting, and the correlational results do not always allow for out-of-sample generalizations (Gabrieli et al., Reference Gabrieli, Ghosh and Whitfield-Gabrieli2015; Dubois and Adolphs, Reference Dubois and Adolphs2016; Yarkoni and Westfall, Reference Yarkoni and Westfall2017). In this case, previous correlational findings are not readily applicable to clinical practice, where doctors require individualized assessment of symptom severity (Paulus, Reference Paulus2015, Reference Paulus2017; Huys et al., Reference Huys, Maia and Paulus2016). To address these issues, we implemented a multivariate pattern analysis (MVPA) approach to identify DTI features that are predictive of current dispositional worry at the individual level.
In particular, the current approach provides the following advantages. First, the multivariate nature of the analysis enables the detection of subtle and spatially distributed effects. MVPA approaches are particularly suitable for examining neural mechanisms underlying complex traits such as dispositional worry and relevant mental disorders (e.g. GAD), thought to be rooted in disturbed functional and structural integrity of distributed networks (Etkin et al., Reference Etkin, Prater, Schatzberg, Menon and Greicius2009; Hilbert et al., Reference Hilbert, Lueken and Beesdo-Baum2014). In line with this conjecture, a recent review proposed that machine learning algorithms and multivariate tools could be eminently useful for characterizing neuroanatomy of GAD (Fonzo and Etkin, Reference Fonzo and Etkin2017). Second, the machine learning approach allows for the prediction of unseen participants, offering information at the individual level rather than group level. More specifically, the machine learning approach typically implements cross-validation procedures to estimate the model with training samples, and to test the model performance with independent samples (i.e. test samples). As such, the current work aimed to identify brain measures, i.e. WM connectivity, that are predictive of current worry symptoms at the individual level, rather than to predict future worry symptoms. Moreover, discriminating features adopted by the model can be employed as neuroimaging markers for worry tendencies.
In light of previous studies on worry symptoms and WM integrity (Zhang et al., Reference Zhang, Li, Yu, Liu, Tang, Tan, Liao, Yang and Shan2013a, Reference Zhang, Liao, Tang, Yang, Liao, Shan, Liu and Lib; Andreescu et al., Reference Andreescu, Tudorascu, Sheu, Rangarajan, Butters, Walker, Berta, Desmidt and Aizenstein2017; Bergamino et al., Reference Bergamino, Farmer, Yeh, Paul and Hamilton2017), we hypothesized that dispositional worry scores would be predicted by structural integrity within the emotion processing and regulation neural network, particularly the prefrontal cortex, ACC, and amygdala. Moreover, based on previous DTI studies on mood and anxiety disorders (Hettema et al., Reference Hettema, Kettenmann, Ahluwalia, McCarthy, Kates, Schmitt, Silberg, Neale, Kendler and Fatouros2012; Tromp et al., Reference Tromp, Grupe, Oathes, McFarlin, Hernandez, Kral, Lee, Adams, Alexander and Nitschke2012; Liao et al., Reference Liao, Yang, Zhang, He, Su and Li2014), we further hypothesized that WM tracts, including the uncinate fasciculus, inferior fronto-occipital fasciculus, inferior longitudinal fasciculus, cingulum, fornix, and corona radiate, would contribute to the prediction of current trait worry.
Material and methods
Participants
Fifty-nine adult participants (35 females; age 26.19 ± 7.13 years, range: 18–49 years) were recruited. All the participants were right handed, had received junior high school or above education, and used Chinese as their first language. All were clear of organic brain diseases or any abnormal nervous system manifestations. The study was conducted in accordance with the 1964 Declaration of Helsinki and its later amendments, and was approved by the Ethics Committee of Beijing Normal University. Written informed consent was obtained from all participants.
Penn State Worry Questionnaire
To assess individual dispositional worry, we administered the Chinese version of the Penn State Worry Questionnaire (PSWQ) (Meyer et al., Reference Meyer, Miller, Metzger and Borkovec1990), which measures general tendency toward frequent and excessive worry in both clinical and non-clinical samples. The PSWQ consists of 16 items; each item is scored on a five-point Likert scale ranging from 1 (not at all typical) to 5 (very typical). The reliability and validity of the PSWQ have been demonstrated by previous studies (Meyer et al., Reference Meyer, Miller, Metzger and Borkovec1990; Brown et al., Reference Brown, Antony and Barlow1992).
MRI data acquisition
Images were acquired with a Siemens TRIO 3-Tesla scanner at the Beijing Normal University Imaging Center for Brain Research. High-resolution structural images were acquired through a 3D sagittal T1-weighted magnetization-prepared rapid acquisition with gradient-echo sequence, using the following parameters: sagittal slices, 144; TR, 2530 ms; TE, 3.39 ms; slice thickness, 1.33 mm; voxel size, 1 mm × 1 mm × 1.33 mm; flip angle, 7°; inversion time, 1100 ms; FOV, 256 mm × 256 mm. In addition, for DTI scans, a single-shot, twice-refocused spin-echo diffusion echo-planar imaging sequence was applied with the following parameters: TR, 8000 ms; TE, 89 mm; 30 optimal diffusion-weighted directions with a b-value of 1000 s/mm2 and one image with a b-value of 0 s/mm2; data matrix, 128 × 128; FOV, 282 mm × 282 mm; slice thickness, 2.2 mm; 62 axial slices with no interslice gap; voxel size, 2.2 mm × 2.2 mm × 2.2 mm. To increase the signal-to-noise ratio, two repetitions were performed, with a total imaging time of 12 min.
Image preprocessing
Processing of the diffusion MRI dataset was implemented using PANDA (http://www.nitrc.org/projects/panda), which is a pipeline toolbox for diffusion MRI analysis (Cui et al., Reference Cui, Zhong, Xu, Gong and He2013) based on FSL (Jenkinson et al., Reference Jenkinson, Beckmann, Behrens, Woolrich and Smith2012). The procedure included skull-stripping, simple-motion and eddy-current correction, and diffusion tensor/parameter calculation. The following two diffusion metrics were calculated: (i) FA, a measure of the fraction of the magnitude of the tensor that can be attributed to the anisotropic diffusion (Basser, Reference Basser1995); (ii) MD, a measure of average diffusion across different directions (Basser et al., Reference Basser, Mattiello and LeBihan1994). FA and MD are the most commonly used diffusion parameters, and are thought to provide complementary information about diffusion (Beaulieu, Reference Beaulieu2002; Alexander et al., Reference Alexander, Hurley, Samsonov, Adluru, Hosseinbor, Mossahebi, Tromp, Zakszewski and Field2011). Tract-based spatial statistics was employed to extract the core (skeleton) of WM (Smith et al., Reference Smith, Jenkinson, Johansen-Berg, Rueckert, Nichols, Mackay, Watkins, Ciccarelli, Cader, Matthews and Behrens2006). In detail, all FA images were registered to the template, and then averaged to generate a mean FA image. The FA skeleton, which represented the core tracts that were common to all subjects, was calculated using the mean FA. This skeleton was then thresholded (FA value >0.2) to further remove non-WM regions. Each individual subject's registered FA and MD images were projected to this skeleton, and FA and MD skeleton images were produced for each subject. Following this, we calculated the regional average FA and MD skeleton using the WM Parcellation Map (WMPM), which is a prior WM atlas defined in the MNI space with 50 ‘core WM’ regions (Mori et al., Reference Mori, Oishi, Jiang, Jiang, Li, Akhter, Hua, Faria, Mahmood and Woods2008). As each subject's FA/MD skeleton and the WMPM atlas were both in MNI space and both with a resolution of 1 mm × 1 mm × 1 mm, we overlaid the skeleton images on the atlas to categorize each skeleton voxel into the 50 WM regions (Huang et al., Reference Huang, Fan, Williamson and Rao2011; Tseng et al., Reference Tseng, Gundapuneedi, Khan, Diaz-Arrastia, Levine, Lu, Huang and Zhang2013). For each participant, the mean FA and MD skeletons were acquired for each of the 50 WM regions.
Multivariate relevance vector regression analysis
The average FA and MD values for the 50 regions were concatenated to yield a feature vector for each subject (Cui et al., Reference Cui, Xia, Su, Shu and Gong2016). The feature vector therefore consisted of 50 FA features and 50 MD features. The use of different types of features together in the model likely improves prediction performance, since distinct features putatively capture complementary aspects of WM tissue (Alexander et al., Reference Alexander, Hurley, Samsonov, Adluru, Hosseinbor, Mossahebi, Tromp, Zakszewski and Field2011). Indeed, previous studies indicate that using FA and MD features together resulted in higher model performance than using each type of features alone (Ross and Jain, Reference Ross and Jain2003; Damoiseaux and Greicius, Reference Damoiseaux and Greicius2009; Wee et al., Reference Wee, Yap, Li, Denny, Browndyke, Potter, Welsh-Bohmer, Wang and Shen2011; Dai et al., Reference Dai, Yan, Wang, Wang, Xia, Li and He2012; Xie et al., Reference Xie, Cui, Zhang, Sun, Sheng, Li, Gong, Han and Jia2015; Cui et al., Reference Cui, Xia, Su, Shu and Gong2016).
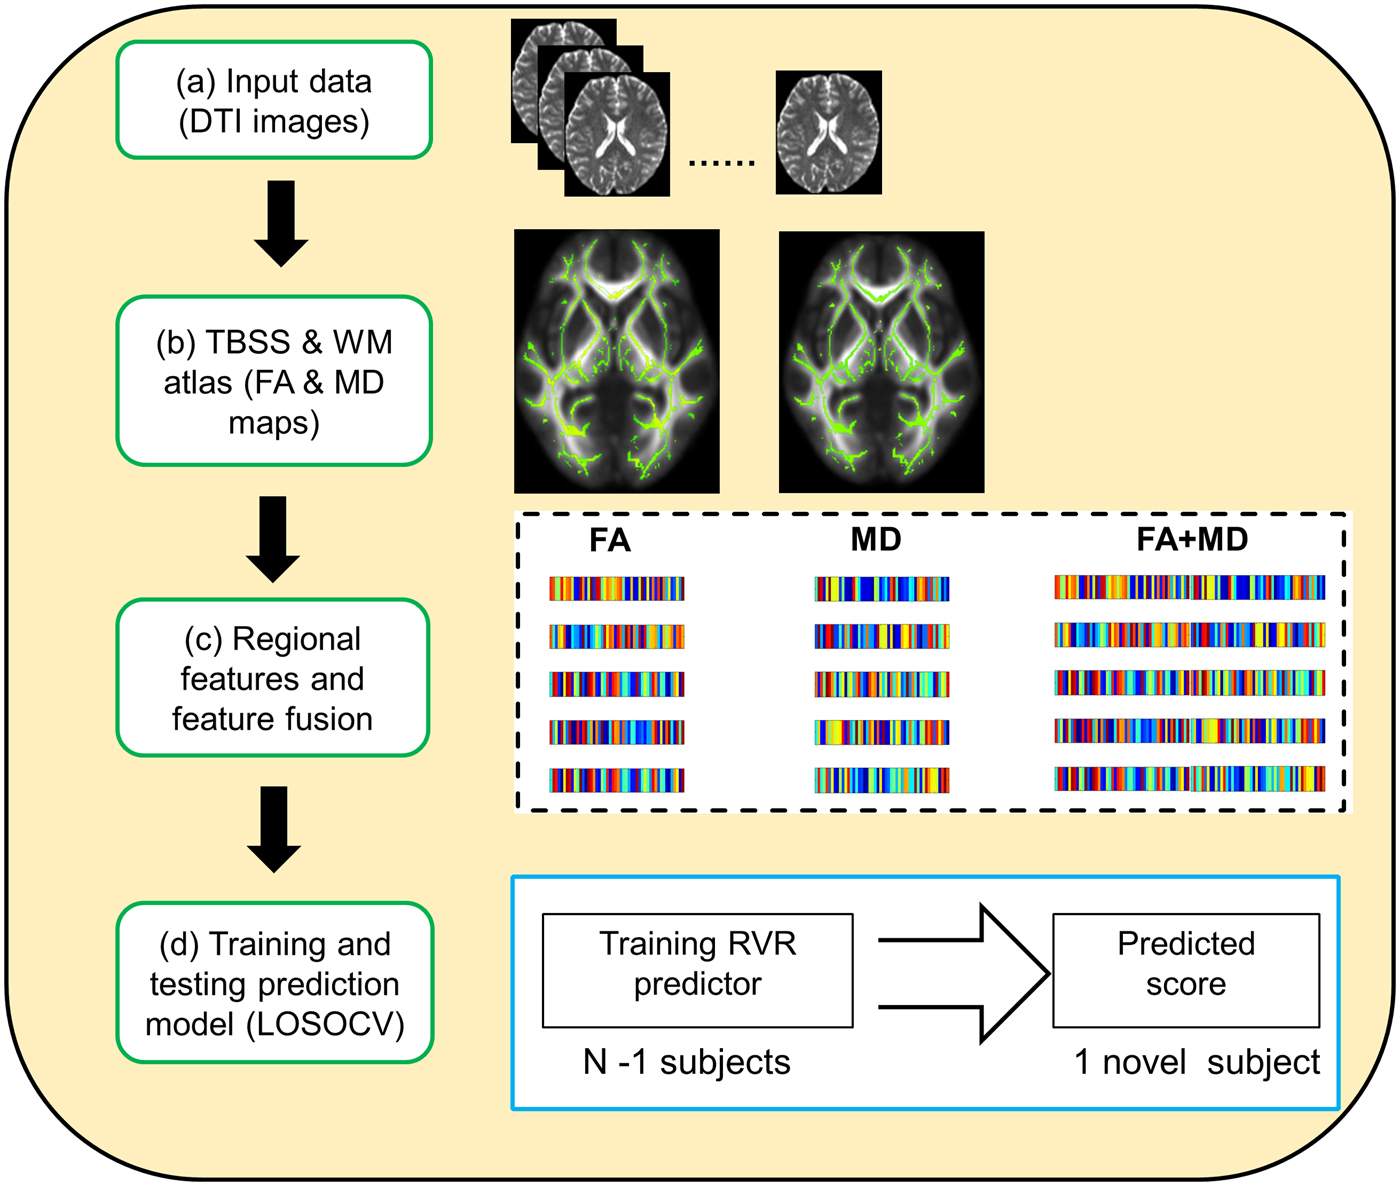
The relationship between PSWQ scores and microstructural WM properties was examined using multivariate relevance vector regression (RVR) with a linear kernel as implemented in PRoNTo (http://www.mlnl.cs.ucl.ac.uk/pronto/) and in-house scripts running under Matlab environment (Mathworks, 2016 release) (Fig. 1). RVR is a sparse kernel learning multivariate regression method set in a fully probabilistic Bayesian framework (Tipping, Reference Tipping2001). In this framework, a zero-mean Gaussian prior is introduced over the model weights, and is governed by a set of hyper-parameters, one for each weight. The most probable values for these hyper-parameters are then iteratively estimated from the training data, with sparseness achieved due to posterior distributions of many of the weights peaking sharply around zero. Those training vectors associated with non-zero weights are referred to as ‘relevance’ vectors. The optimized posterior distribution of the weights can then be used to predict the target value (e.g. anxiety score) for a previously unseen feature vector, by computing the predictive distribution (Tipping, Reference Tipping2001).

Fig. 1. Schematic overview of the prediction framework. DTI, diffusion tensor imaging; TBSS, tract-based spatial statistics; WM, white matter; FA, fractional anisotropy; MD, mean diffusivity; LOSOCV, leave-one-subject-out cross-validation.
In the current work, a leave-one-subject-out cross-validation (LOSOCV) was used to evaluate the out-of-sample prediction performance. N-1 subjects (where N is the number of subjects) were used as the training set, with the remaining individual used as the testing sample. During the training procedure, each feature was linearly scaled to a range of zero to one across the training set, and then a RVR prediction model was constructed using this training set. During the testing procedure, each testing subject's feature vector was scaled using the scaling parameter acquired during the training procedure. Following this, the RVR prediction model was used to predict the testing subjects’ PSWQ score (Gong et al., Reference Gong, Li, Du, Pettersson-Yeo, Crossley, Yang, Li, Huang and Mechelli2014; Cui et al., Reference Cui, Su, Li, Shu and Gong2018). The training and testing procedures were repeated N times such that each subject was used once as the testing subject.
The accuracy of prediction was measured with three frequently used statistics (Franke et al., Reference Franke, Ziegler, Klöppel, Gaser and Initiative2010; Gong et al., Reference Gong, Li, Du, Pettersson-Yeo, Crossley, Yang, Li, Huang and Mechelli2014; Cui et al., Reference Cui, Su, Li, Shu and Gong2018): (i) mean absolute error (MAE):  $\scriptstyle{1 \over n}\sum\nolimits_{i = 1}^n {\vert y_i - {\hat y}_i \vert} $; (ii) root mean squared error (RMSE):
 ${\rm \;} \sqrt {\scriptstyle{1 \over n}\sum\nolimits_{i = 1}^n {{\lpar {y_i - \; {\hat y}_i} \rpar }^2}} $; (iii) prediction R 2:
  $1 - \scriptstyle{{\mathop \sum \nolimits_{i = 1}^n {\lpar {y_i - \; {\hat y}_i} \rpar }^2} \over {\mathop \sum \nolimits_{i = 1}^n {\lpar {y_i - \; \overline y} \rpar }^2}}$. Please note that n indicates sample size, y i indicates actual worry score of the ith subject, ŷ i indicates predicted worry score of the ith subject, and ȳ indicates mean of the actual worry scores across all subjects. The permutation test was applied to determine whether the obtained metrics were significantly better than those expected by chance. More specially, we permuted PSWQ scores across training samples without replacement 1000 times, and each time re-applied the above LOSOCV prediction procedure. The permutation resulted in a distribution of MAE, RMSE, and prediction R 2 values reflecting the null hypothesis that the model did not exceed chance level. The number of times that the permuted value was greater than (or, with respect to MAE and RMSE values, less than) the true value, was then divided by 1000, providing an estimated p value for each statistic.
Contributing features and corresponding weights
To quantify the contribution of each feature to prediction, we constructed a new RVR model using all subjects. The absolute value of the RVR weight of each feature quantifies its contribution to the model (Gong et al., Reference Gong, Li, Du, Pettersson-Yeo, Crossley, Yang, Li, Huang and Mechelli2014; Cui and Gong, Reference Cui and Gong2018; Cui et al., Reference Cui, Su, Li, Shu and Gong2018). Please note that RVR calculates the weight for samples. As RVR is a sparse model in the sample space, most weight will be zero; remaining samples with non-zero weight were used to fit the model. The regression coefficients of all features were determined as the weighted sum of the feature vector of the non-zero weighted samples (see also Gong et al., Reference Gong, Li, Du, Pettersson-Yeo, Crossley, Yang, Li, Huang and Mechelli2014; Cui and Gong, Reference Cui and Gong2018). A larger absolute value of weight indicates a greater contribution of the corresponding feature to prediction, in the context of every other feature (Gong et al., Reference Gong, Li, Du, Pettersson-Yeo, Crossley, Yang, Li, Huang and Mechelli2014; Erus et al., Reference Erus, Battapady, Satterthwaite, Hakonarson, Gur, Davatzikos and Gur2015; Cui and Gong, Reference Cui and Gong2018; Cui et al., 2018). The feature was selected for visualization if the absolute value of its weight was higher than 30% of the maximum absolute weight value across features (i.e. 0.293, observed on the left posterior limb of internal capsule); this was consistent with previous studies (Ecker et al., Reference Ecker, Marquand, Mourao-Miranda, Johnston, Daly, Brammer, Maltezos, Murphy, Robertson, Williams and Murphy2010; Gong et al., Reference Gong, Li, Du, Pettersson-Yeo, Crossley, Yang, Li, Huang and Mechelli2014). We applied this threshold to eliminate noise components for a better visualization of the most discriminating regions (Ecker et al., Reference Ecker, Marquand, Mourao-Miranda, Johnston, Daly, Brammer, Maltezos, Murphy, Robertson, Williams and Murphy2010; Gong et al., Reference Gong, Li, Du, Pettersson-Yeo, Crossley, Yang, Li, Huang and Mechelli2014).
Validation
A 10-fold cross-validation was applied to validate our prediction results. All subjects were divided into 10 subsets, in which nine were used as the training set, and the remaining one was used as the testing set. The training set was scaled and used to train a RVR prediction model, which was then used to predict the scores for the scaled testing data. The scaling of testing data used parameters acquired from training data. This procedure was repeated 10 times, so that each subset was used as testing set once. Finally, the correlation r and MAE between the true and predicted scores were calculated across all subjects. Since the full dataset was randomly divided into 10 subsets, performance might have depended on data division. Therefore, the 10-fold cross-validation was repeated 100 times, and the results were averaged to produce a final prediction performance. A permutation test was applied 1000 times to test the significance of the prediction performance.
Results
Multivariate RVR analysis
The application of RVR to the combined FA and MD features allowed individualized prediction of PSWQ scores (MAE = 10.46, p < 0.001; RMSE = 12.82, p < 0.001; prediction R 2 = 0.17, p < 0.001; Fig. 2). Prediction performance worsened when using the single-type metric (FA or MD) (Table 1). The permutation test revealed a higher correlation coefficient and lower MAE for the combined features, as compared with the FA or MD feature alone (combined v. FA: p MAE = 0.029, p RMSE = 0.014, p prediction R2 = 0.019; combined v. MD: p MAE = 0.011, p RMSE = 0.027, p prediction R2 = 0.039).
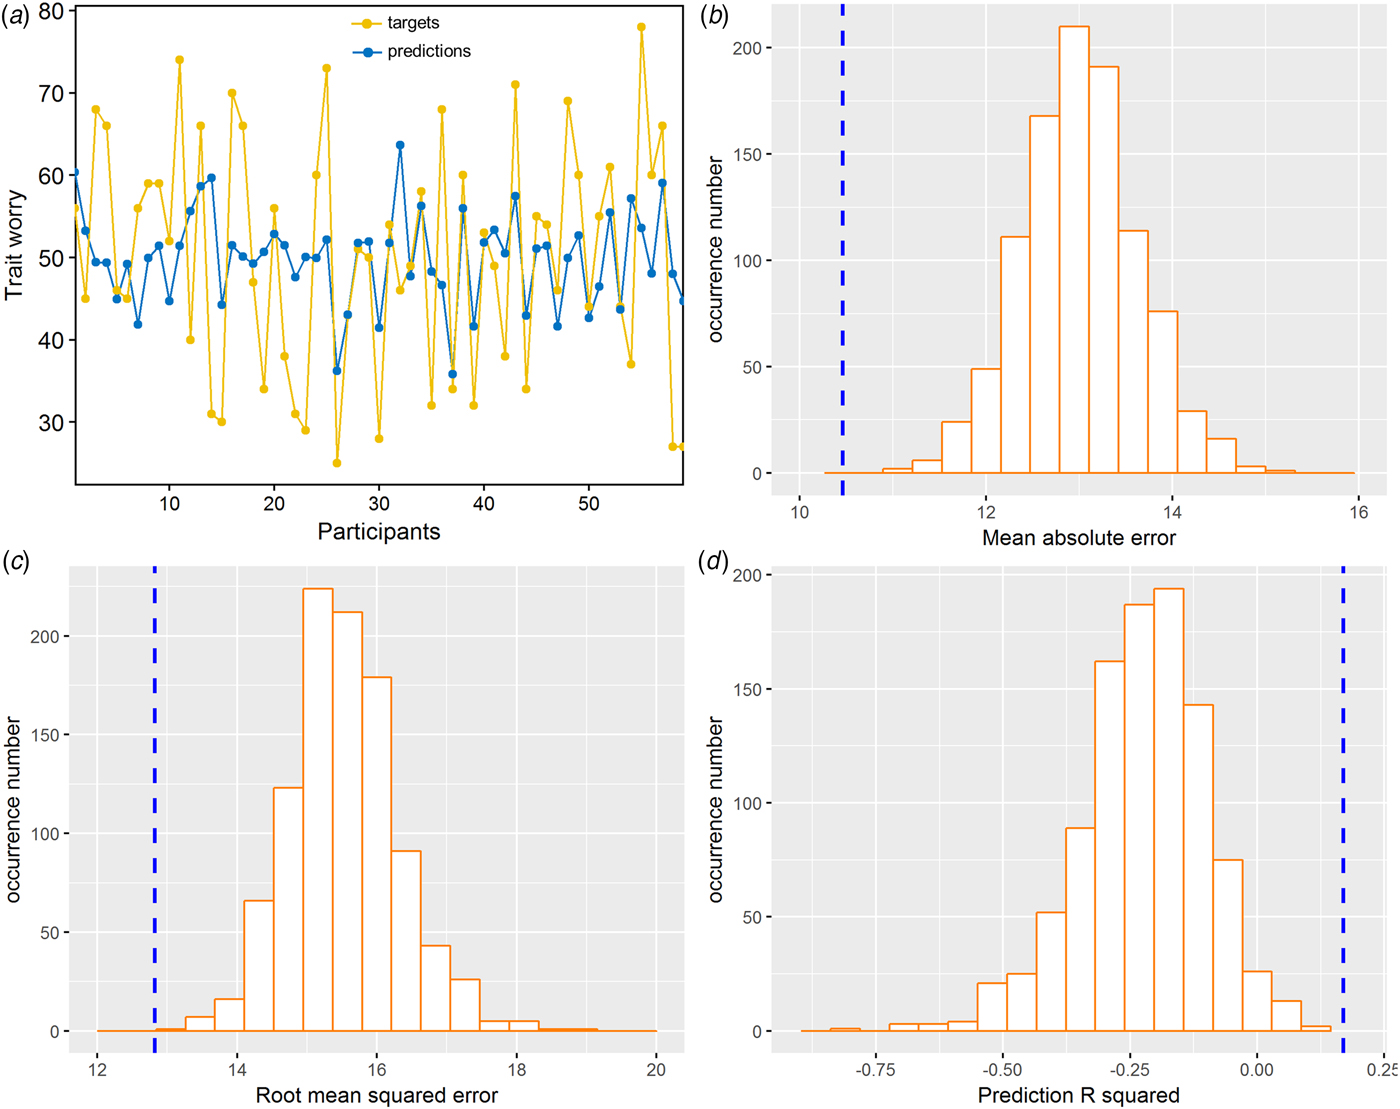
Fig. 2. RVR findings of the multivariate regression analysis in dispositional worry prediction using leave-one-subject-out cross-validation procedures. (a) Line plot showing consistency between actual and predicted dispositional worry scores. (b) Distribution of permutation of the mean absolute error. (c) Distribution of permutation of the root mean squared error. (d) Distribution of permutation of the prediction R 2. The values obtained using real scores are indicated by the blue dashed line.
Table 1. Results of RVR prediction using combined WM features or a single WM feature

LOSOCV, leave-one-subject-out cross-validation; FA, fractional anisotropy; MD, mean diffusivity; MAE, mean absolute error; RMSE, root mean squared error.
Contributing WM features
Thirty-five WM features were selected, including 17 FA features and 18 MD features (Table 2 and Fig. 3). The 17 FA features were derived from the following WM regions (Fig. 3a): bilateral genu of corpus callosum, posterior limbic of internal capsule, anterior corona radiata, superior cerebellar peduncle, and pontine crossing tract; left inferior fronto-occipital fasciculus, left uncinate fasciculus, left superior fronto-occipital fasciculus, and left cerebral peduncle; right cingulum, right sagittal stratum, right retrolenticular part of internal capsule, and right inferior cerebellar peduncle. The 18 MD features were derived from the following WM regions (Fig. 3b): bilateral genu of corpus callosum, splenium of corpus callosum, and body of fornix; left fornix/stria terminalis, left cerebral peduncle, left inferior cerebellar peduncle, left cingulum, left superior corona radiata, left cerebral peduncle, left inferior fronto-occipital fasciculus, left tapetum, left uncinate fasciculus, left posterior thalamic radiation, left superior cerebellar peduncle, left cingulum, left superior fronto-occipital fasciculus, left anterior and superior corona radiate; right posterior thalamic radiation, right cerebral peduncle, and right posterior limb of internal capsule.
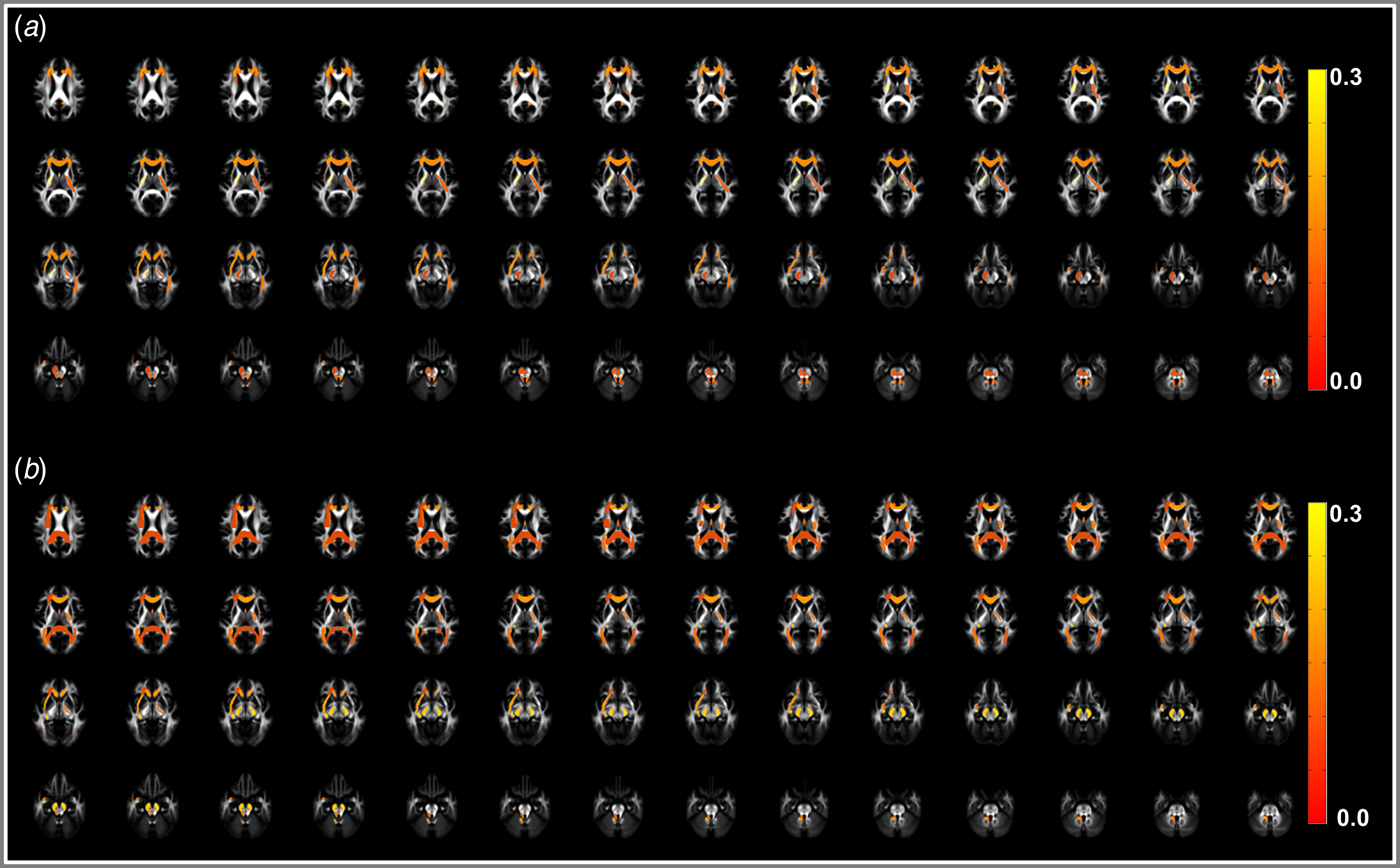
Fig. 3. Contributing white matter connectivity features with an absolute weight score higher than 30% of the maximum absolute weight value for RVR to predict dispositional worry. (a) FA features. (b) MD features.
Table 2. Contributing white matter connectivity features with an absolute weight score higher than 30% of the maximum absolute weight value for RVR to predict dispositional worry
WM, white matter; L, left; R, right; FA, fractional anisotropy; MD, mean diffusivity.
Validation
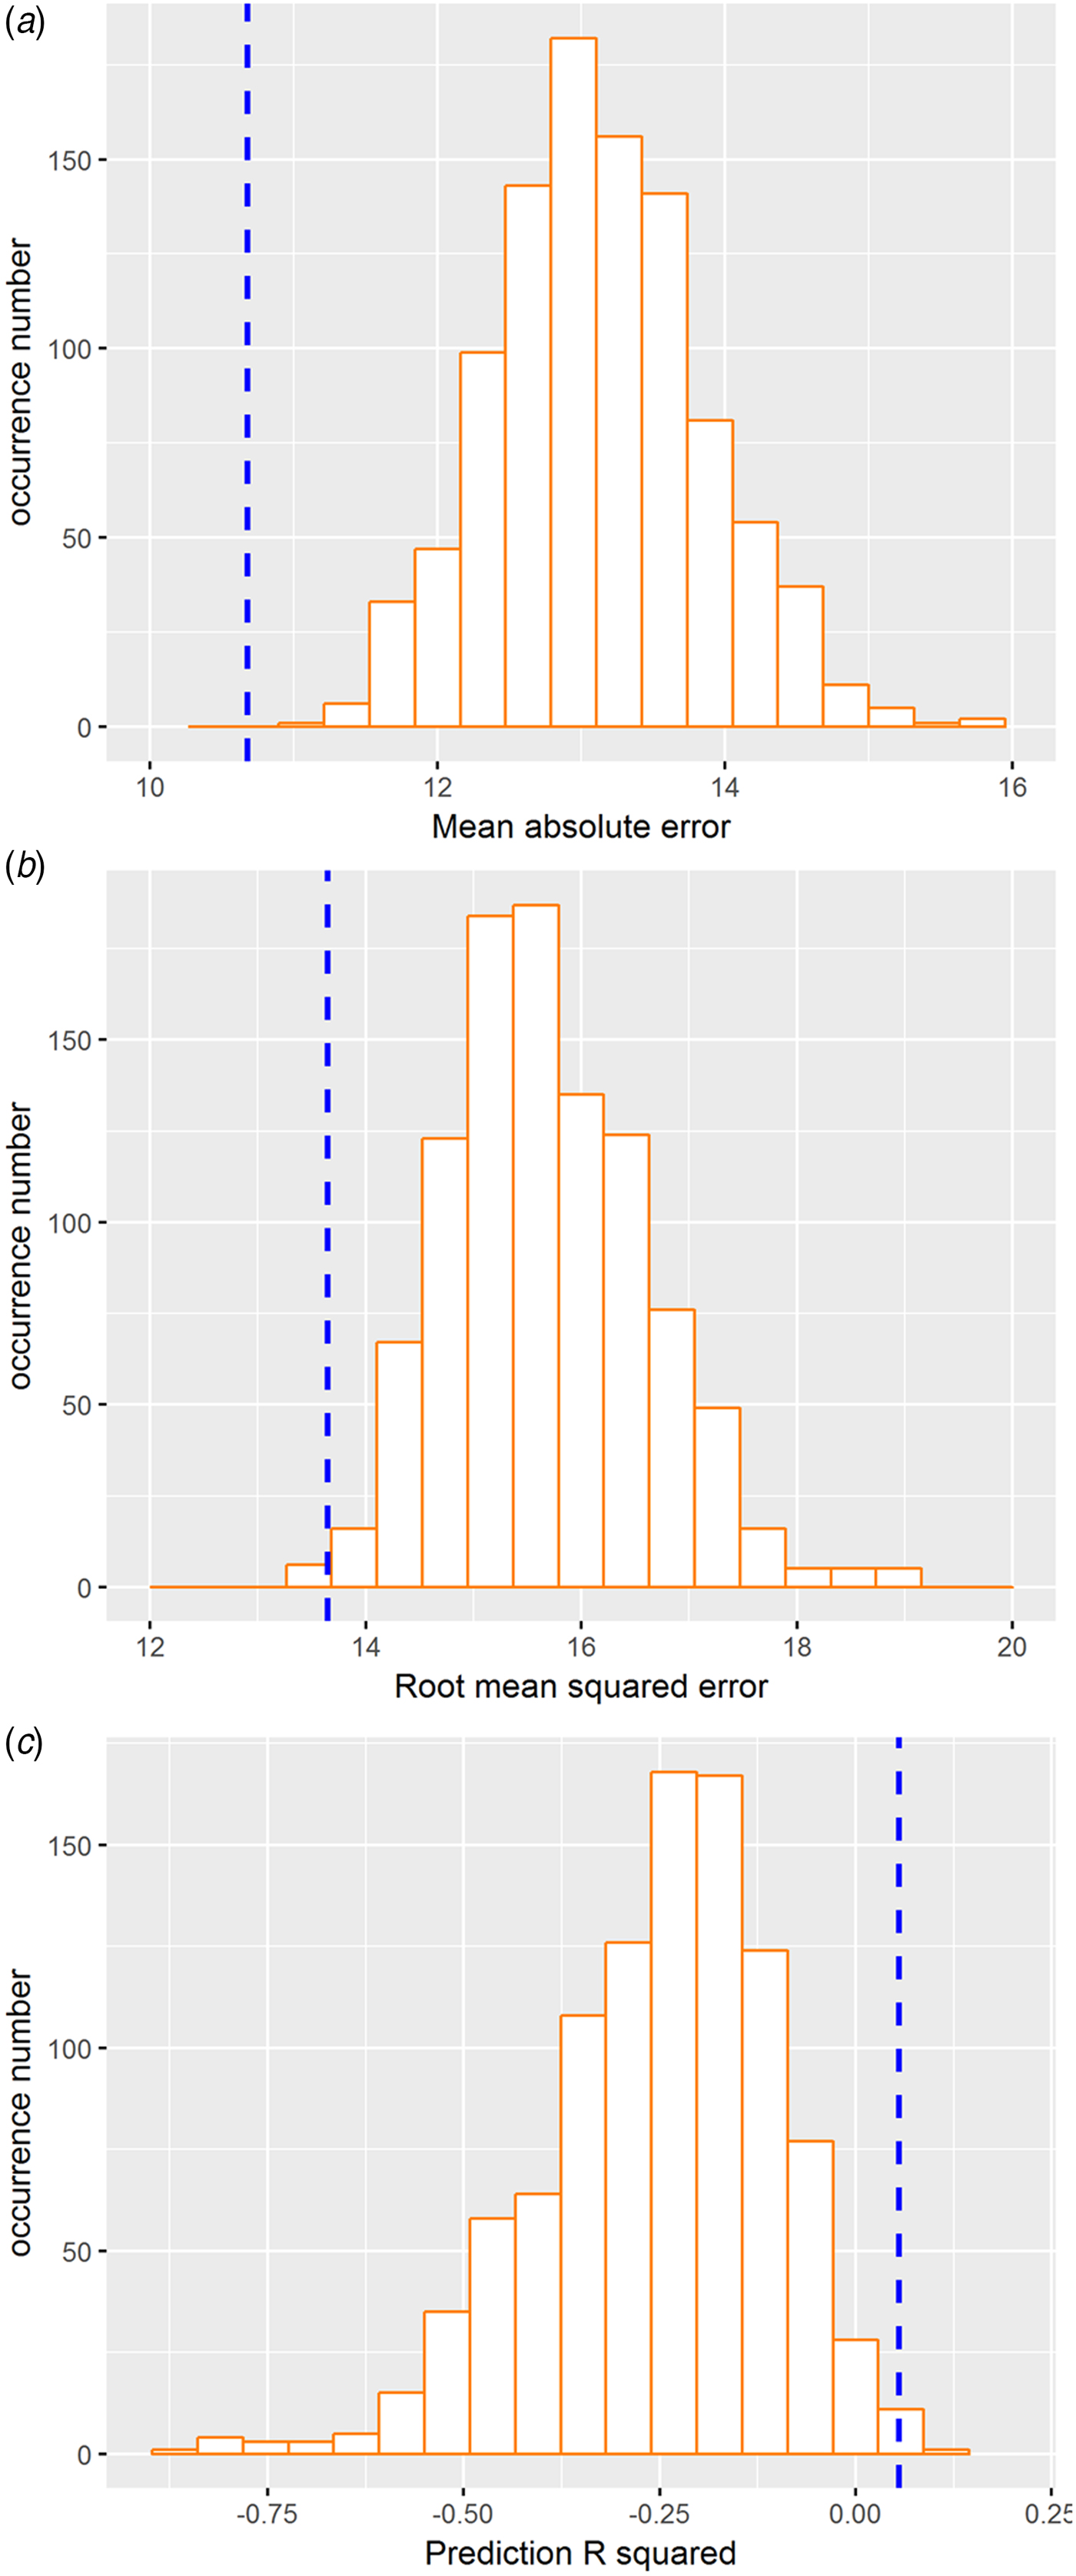
The 10-fold cross-validation was used to re-estimate the performance of prediction. The resultant correlation coefficient and MAE values remained significant (MAE = 11.09, p < 0.005; RMSE = 13.65, p < 0.005; prediction R 2 = 0.055, p < 0.005; Fig. 4), thus validating the main findings derived from the LOSOCV approach.

Fig. 4. RVR findings of the validation analysis using 10-fold cross-validation procedures. (a) Distribution of permutation of the mean absolute error. (b) Distribution of permutation of the root mean squared error. (c) Distribution of permutation of the prediction R 2. The values obtained using real scores are indicated by the blue dashed line.
Discussion
Excessive worry is a defining feature of GAD, and contributes to a wide range of other psychiatric disorders (Ehring and Watkins, Reference Ehring and Watkins2008; Sharp et al., Reference Sharp, Miller and Heller2015; Barlow et al., Reference Barlow, Allen and Choate2016). However, the neurobiological markers of worry propensity remain largely unknown. In the current study, we employed WM microintegrity in a machine learning framework to make continuously valued predictions on dispositional worry. Our aim was to establish neuromarkers that are predictive of worry propensity at the individual level. We demonstrated that multivariate patterns of WM structural connectivity extracted from DTI data were sufficient to decode individual worry tendencies. In particular, inter-individual variation in trait worry was predicted by microstructural properties of widely distributed WM tracts. These tracts included the posterior limb of internal capsule, anterior corona radiate, and cerebral peduncle, as well as the corticolimbic pathways (e.g. uncinate fasciculus, cingulum, and fornix) already known to be critical for emotion processing and regulation.
It has been hypothesized that the neural pathways associated with emotion processing and regulation play a critical role in developing and maintaining chronic/dispositional worry and GAD (Etkin et al., Reference Etkin, Prater, Schatzberg, Menon and Greicius2009; Schienle et al., Reference Schienle, Schäfer, Pignanelli and Vaitl2009; Etkin et al., Reference Etkin, Prater, Hoeft, Menon and Schatzberg2010; Makovac et al., Reference Makovac, Meeten, Watson, Herman, Garfinkel, Critchley and Ottaviani2016; Meeten et al., Reference Meeten, Davey, Makovac, Watson, Garfinkel, Critchley and Ottaviani2016). This is in line with our findings that WM tracts in the prefrontal–limbic pathway contribute to the predictions of worry propensity. For instance, the uncinate fasciculus is the primary WM tract that connects the ventral regions of the prefrontal cortex and ACC to the amygdala and other limbic regions (Ghashghaei et al., Reference Ghashghaei, Hilgetag and Barbas2007). Disrupted integrity of the uncinate fasciculus has been reliably identified in anxiety and depression disorders (Kim and Whalen, Reference Kim and Whalen2009; Phan et al., Reference Phan, Orlichenko, Boyd, Angstadt, Coccaro, Liberzon and Arfanakis2009; Ayling et al., Reference Ayling, Aghajani, Fouche and van der Wee2012; Carballedo et al., Reference Carballedo, Amico, Ugwu, Fagan, Fahey, Morris, Meaney, Leemans and Frodl2012; Hettema et al., Reference Hettema, Kettenmann, Ahluwalia, McCarthy, Kates, Schmitt, Silberg, Neale, Kendler and Fatouros2012; Tromp et al., Reference Tromp, Grupe, Oathes, McFarlin, Hernandez, Kral, Lee, Adams, Alexander and Nitschke2012). Furthermore, integrity of the uncinate fasciculus predicts the functional connectivity strength of prefrontal regions and the amygdala (Tromp et al., Reference Tromp, Grupe, Oathes, McFarlin, Hernandez, Kral, Lee, Adams, Alexander and Nitschke2012), which has been associated with trait worry scores and emotion regulation ability (Makovac et al., Reference Makovac, Meeten, Watson, Herman, Garfinkel, Critchley and Ottaviani2016). The cingulum bundle is the most prominent WM tract in the limbic system, and connects the ACC to the amygdala and hippocampus. Previous studies have revealed altered cingulum bundle integrity in post-traumatic stress disorder, and found the correlation between cingulum integrity and symptom severity (Abe et al., Reference Abe, Yamasue, Kasai, Yamada, Aoki, Iwanami, Ohtani, Masutani, Kato and Ohtomo2006; Kim et al., Reference Kim, Jeong, Sim, Bae, Chung, Kim, Chang, Ryu, Renshaw and Lyoo2006). The fornix is a fiber tract originating from hippocampus and projecting to the hypothalamus and cingulate cortex among other regions (Saunders and Aggleton, Reference Saunders and Aggleton2007). As an important part of the Papez circuit in the limbic system, the fornix is thought to contribute to emotion regulation through higher order frontal regions (Dalgleish, Reference Dalgleish2004). In accordance with this, WM tract integrity in the fornix has been related to trait anxiety, depression, harm avoidance, and early trauma experiences (Kazlouski et al., Reference Kazlouski, Rollin, Tregellas, Shott, Jappe, Hagman, Pryor, Yang and Frank2011; Modi et al., Reference Modi, Trivedi, Singh, Kumar, Rathore, Tripathi and Khushu2013; Hoogenboom et al., Reference Hoogenboom, Perlis, Smoller, Zeng-Treitler, Gainer, Murphy, Churchill, Kohane, Shenton and Iosifescu2014; Yu et al., Reference Yu, Lee and Lee2017).
Notably, WM tracts in the prefrontal–limbic pathway are not the only features contributing to the predictive model. Instead, the current approach demonstrated the involvement of widely distributed WM tracts, in line with the multi-faceted nature of worry. Specifically, we revealed the following fiber tracts as potential neuromarkers of dispositional worry: the inferior fronto-occipital fasciculus, posterior thalamic radiation, corpus callosum, and those in the motor system (e.g. corona radiata, internal capsule, cerebellar peduncle, cerebral peduncle, and pontine crossing tract).
The microstructure of the inferior fronto-occipital fasciculus has been linked to obsessive–compulsive disorder, depression, and anxiety-related personality traits (Bae et al., Reference Bae, MacFall, Krishnan, Payne, Steffens and Taylor2006; Garibotto et al., Reference Garibotto, Scifo, Gorini, Alonso, Brambati, Bellodi and Perani2010; Westlye et al., Reference Westlye, Bjørnebekk, Grydeland, Fjell and Walhovd2011). This WM tract has been considered a ‘multi-function’ bundle that subserves semantic and emotional processing among other functions (Martino et al., Reference Martino, Brogna, Robles, Vergani and Duffau2010; Sarubbo et al., Reference Sarubbo, De Benedictis, Maldonado, Basso and Duffau2013). These putative functions fit well with the abstract, verbal-linguistic, and valenced nature of worry (Borkovec et al., Reference Borkovec, Alcaine, Behar, Heimberg, Turk and Mennin2004; Sibrava and Borkovec, Reference Sibrava, Borkovec, Davey and Wells2006). Moreover, disrupted integrity of the posterior thalamic radiation and corpus callosum has been consistently identified in depression disorders (Liao et al., Reference Liao, Huang, Wu, Yang, Kuang, Du, Lui, Yue, Chan and Kemp2013; Sarıçiçek et al., Reference Sarıçiçek, Zorlu, Yalın, Hıdıroğlu, Çavuşoğlu, Ceylan, Ada, Tunca and Özerdem2016; Hermesdorf et al., Reference Hermesdorf, Berger, Szentkirályi, Schwindt, Dannlowski and Wersching2017), suggesting the importance of these tracts in emotion processing. Finally, abnormalities of WM connectivity in the motor system have frequently been reported in a wide range of psychiatric disorders, including depression (Bae et al., Reference Bae, MacFall, Krishnan, Payne, Steffens and Taylor2006; Shen et al., Reference Shen, Reus, Adams, Cox, Deary, Liewald, Bastin, Smith, Whalley and McIntosh2017) and anxiety (Westlye et al., Reference Westlye, Bjørnebekk, Grydeland, Fjell and Walhovd2011; Zhang et al., Reference Zhang, Zhang, Li, Li, Li, Ma, Hou, Zhang, Zhang and Wang2011; Liao et al., Reference Liao, Yang, Zhang, He, Su and Li2014). In particular, the fiber tracts in the corona radiata and internal capsule of the motor system wire the cortex and thalamus (Goh et al., Reference Goh, Bansal, Xu, Hao, Liu and Peterson2011), and are critical in filtering sensory information and regulating emotions (Herrero et al., Reference Herrero, Barcia and Navarro2002). Furthermore, an increasing body of empirical evidence has indicated the involvement of the cerebellum in emotion processing and regulation (Schutter and Van Honk, Reference Schutter and Van Honk2005), such that integrity of cerebellar fiber tracts has been linked to emotion processing ability (Peng et al., Reference Peng, Zheng, Ning, Zhang, Shan, Zhang, Yang, Liu, Li and Zhou2013; Laricchiuta et al., Reference Laricchiuta, Petrosini, Picerni, Cutuli, Iorio, Chiapponi, Caltagirone, Piras and Spalletta2015). Taken together, these WM tracts might contribute to different aspects of emotion appraisal and regulation that are related to dispositional worry.
Interestingly, the current results reveal that WM features that are predictive of PSWQ scores are predominantly located in the left hemisphere. Many other studies have also found left hemisphere asymmetry to be associated with worry, in both resting state and during tasks (Hoehn-Saric et al., Reference Hoehn-Saric, Schlund and Wong2004, Reference Hoehn-Saric, Lee, McLeod and Wong2005; Mohlman et al., Reference Mohlman, Price, Eldreth, Chazin, Glover and Kates2009). For instance, Mohlman et al. (Reference Mohlman, Price, Eldreth, Chazin, Glover and Kates2009) found a strong correlation between the activation of the left medial orbitofrontal cortex and worry scores among GAD patients. Also, Hoehn-Saric et al. (Reference Hoehn-Saric, Schlund and Wong2004) reported that after clinical treatment using citalopram, GAD patients showed a reduction of brain activation, mostly in the left hemisphere, in response to experimental stimuli. To explain this pattern of asymmetry, Hoehn-Saric et al. (Reference Hoehn-Saric, Lee, McLeod and Wong2005) pointed out that worry is a thought process that is primarily verbal-semantic. Therefore, the involvement of verbal thought activity might be more predominately associated with left hemisphere activation. That being said, it should be noted that the current evidence on the worry and hemisphere asymmetry is rather preliminary, and future studies are needed to address the issue.
Several limitations and future directions should be noted in relation to this study. First, our prediction was obtained from a relatively small subclinical sample. Therefore, generalization of the current findings requires further validation using a larger independent sample and other cross-validation methods. Second, although our results indicated that the performance of our model was significantly better than chance level, the MAE and RMSE scores were relatively large and the prediction R 2 score was moderate. Therefore, future studies are needed to improve the performance of the model by combining data from different levels of measure (e.g. behavioral and brain measures), different modalities (e.g. functional and structural connectivity), and different statistics (e.g. mean and variance). For instance, the current study employed the mean values of FA and MD from each fiber tract as features, since these metrics are known to reflect structural integrity (Assaf and Pasternak, Reference Assaf and Pasternak2008; Khong et al., Reference Khong, Odenwald, Hashim and Cusimano2016; Martin et al., Reference Martin, Aleksanderek, Cohen-Adad, Tarmohamed, Tetreault, Smith, Cadotte, Crawley, Ginsberg and Mikulis2016). However, other measures, such as the variance of these metrics within each tract might also be biologically meaningful, and could be explored in future studies. Nevertheless, the model proposed in the present study serves as a starting point, and should inspire further investigation to improve prediction accuracy and generalizability. On a related note, predicted scores exhibited smaller variance than the actual scores, which could be attributed to regression prediction models shrinking estimates toward the mean, as well as the fact that the current predictive model based on WM integrity did not fit perfectly with the actual worry scores (for additional observation and discussion on this issue, see also Rowen et al., Reference Rowen, Brazier and Roberts2009; Brazier et al., Reference Brazier, Yang, Tsuchiya and Rowen2010; Versteegh et al., Reference Versteegh, Rowen, Brazier and Stolk2010; Fayers and Hays, Reference Fayers and Hays2014). Finally, future clinical research should also examine whether the effectiveness of treatments used to reduce worry (e.g. cognitive behavior therapy; see Querstret and Cropley, Reference Querstret and Cropley2013 for a review) could be affected by the individual differences in structural networks revealed in this study.
Despite these limitations, we here demonstrate that integrity of widely distributed WM tracts effectively predict dispositional worry at individual level. As such, the current work provides potential neuromarkers for clinical assessment of worry symptoms across a wide range of psychiatric disorders. In addition to the potential clinical applications, the current multivariate approach compared with previous mass-univariate techniques revealed more distributed pathways underlying worry propensity. Thus, these move us toward a better understanding of the neurobiological mechanisms of worry.
Acknowledgement
The authors thank two anonymous reviewers for their comments, which have helped improve the quality of the manuscript.
Author contributions
CF and RX designed the study. CF and RX performed the experiment. CF and ZC analyzed the data. CF, RX, ZC, and RG wrote the manuscript. DC provided suggestions on the revision of manuscript.
Financial support
This study was funded by the National Natural Science Foundation of China (81503480, 31571124, 31500920, 31700977), the Major Program of Chinese National Social Science Foundation (17ZDA324), the National Postdoctoral Program for Innovative Talents (BX201600019), the China Postdoctoral Science Foundation (2017M610055), the Beijing National Science Foundation (7154227), the Project of Institute of Basic Research in Clinical Medicine, and the China Academy of Chinese Medical Sciences (Z0414).
Conflict of interest
None.