Introduction
Microporous titanosilicates (MTs) constitute an important class of molecular sieves whose frameworks are composed from [SiO4] tetrahedra and [TiO6] octahedra (Anderson et al., Reference Anderson, Terasaki, Ohsuna, Malley, Philippou, Mackay, Ferreira, Rocha and Lidin1995; Clearfield, Reference Clearfield2001). Currently more than 100 mineral species can be considered as MTs, which crystallise in 30 different framework types (Chukanov and Pekov, Reference Chukanov, Pekov, Ferraris and Merlino2005). In many cases, their synthetic analogues were synthesised after their mineralogical discoveries and found extensive applications in catalysis, adsorption, separation and ion-exchange (Rocha and Anderson, Reference Rocha and Anderson2000; Milne et al., Reference Milne, Griffith, Hanna, Skyllas-Kazacos and Luca2006; Anson et al., Reference Anson, Lin, Kuznicki and Sawada2009; Lin et al., Reference Lin, Dambrowitz and Kuznicki2012; Popa and Pavel, Reference Popa and Pavel2012). The most studied mineral analogues in material science are the synthetic counterparts of zorite (Engelhard titanium silicate, ETS-4), ivanyukite (Grace titanium silicate, GTS, synthetic ivanyukite, SIV), kamenevite (Aveiro and Manchester, AM-2, Surfactant-templated silica, STS) and sitinakite (ion sieve, IONSIV-911, Texas A and M,TAM-5, Surfactant-templated silica, STS, crystalline titanosilicate material, CST) (Oleksiienko et al., Reference Oleksiienko, Wolkersdorfer and Sillanpää2017). All the mineral species that served as prototypes of synthetic materials were first discovered in the Khibiny or Lovozero alkaline massifs of Kola Peninsula, Russia. Less well known and less studied in chemistry are minerals of the lovozerite group (tisinalite), hilairite group (pyatenkoite-(Y)), and labuntsovite group that also have pronounced ion-exchange and photocatalytic properties (Chukanov and Pekov, Reference Chukanov, Pekov, Ferraris and Merlino2005; Gerasimova et al., Reference Gerasimova, Nikolaev, Shchukina, Maslova, Kalashnikova, Samburov and Ivanyuk2019).
The MT materials based on the pharmacosiderite framework topology (Behrens et al., Reference Behrens, Sylvester and Clearfield1998a) possess outstanding ion-exchange properties (Majzlan et al., Reference Majzlan, Haase, Plášil and Dachs2019). Chapman and Roe (Reference Chapman and Roe1990) first synthesised ivanyukite-K and reported on the formation of its H- and Cs- exchanged phases. Later studies provided data on preparation, crystal structures and ion-exchange properties of the A 3H[Ti4O4(XO4)3](H2O)n compounds, where A = H, Na, K, Rb and Cs; X = Si and Ge (Behrens et al., Reference Behrens, Poojary and Clearfield1996, Reference Behrens, Poojary and Clearfield1998b; Behrens and Clearfield, Reference Behrens and Clearfield1997; Dadachov and Harrison, Reference Dadachov and Harrison1997). These compounds have been considered as prospective materials for the selective removal of Cs and Sr from radioactive waste aqueous solutions. Calcination of Cs- and Sr-exchanged synthetic ivanyukite up to 1000°C results in the formation of stable titanate ceramics akin to synthetic rock (synroc) composed of rutile, tausonite, pyrochlore, hollandite and ‘leucite’ (Britvin et al., Reference Britvin, Gerasimova, Ivanyuk, Kalashnikova, Krzhizhanovskaya, Krivovivhev, Mararitsa, Nikolaev, Oginova, Panteleev, Khandobin, Yakovenchuk and Yanicheva2016).
There are three ivanyukite-group minerals currently approved by the IMA–CNMNC: (ivanyukite-Na (IMA-2007-041), ivanyukite-K (IMA-2007-042) and ivanyukite-Cu (2007-043). In nature, these minerals occur in natrolitised microcline–aegirine–sodalite veins within an orthoclase-bearing urtite of the Koashva apatite mine (Fig. 1), Khibiny alkaline massif, Kola Peninsula, Russia (Yakovenchuk et al., Reference Yakovenchuk, Nikolaev, Selivanova, Pakhomovsky, Korchak, Spiridonova, Zalkind and Krivovichev2009). They are found in a hyperagpaitic low-temperature hydrothermal assemblage in association with natrolite, villiaumite, sitinakite, djerfisherite, sazykinaite-(Y), lucasite-(Ce), and amorphous bitumens. According to Yakovenchuk et al. (Reference Yakovenchuk, Selivanova, Krivovichev, Pakhomovsky, Spiridonova, Kasikov and Ivanyuk2011), all ivanyukite-group minerals crystallise during later stages of hydrothermal activity. In the original study by Yakovenchuk et al. (Reference Yakovenchuk, Nikolaev, Selivanova, Pakhomovsky, Korchak, Spiridonova, Zalkind and Krivovichev2009), the crystal structure was reported for ivanyukite-Na-T only.

Fig. 1. The Koashva career, Khibiny alkaline massif, Kola Peninsula, Russia. The red star indicates the holotype location for the ivanyukite-group minerals. Photo by Gregory Ivanyuk.
Herein we report the results of crystal-structure refinements of ivanyukite-Na-C, -Na-T, -K and Cu-rich ivanyukite-K obtained during the course of ion-exchange experiments. The new finds of ivanyukite-Na and ivanyukite-K, from the Oleniy Ruchey and Koashva mines allowed the acquisition of additional chemical and structural data. The new samples have been deposited at the Museum and Exhibition Center (MEC) in Kirovsk, Murmansk region, Russia under catalogue no MEC-3184 (ivanyukite-Na-T), MEC-3183 (ivanyukite-Na-C), MEC-517 (ivanyukite-K). The results of the current study provide an important insight into the transformational nature of the ivanyukite-group minerals.
Samples and experimental
Four samples of ivanyukite-group minerals were extracted from the aegirine–microcline–natrolite vein of the Koashva apatite mine, Khibiny, Kola Peninsula, Russia (Fig. 2). In all samples, ivanyukite-group minerals form blocky crystals up to 1 mm in size, which grow on the surface of natrolite or form inclusions in it. Ivanyukite-group minerals are associated closely with pectolite, vinogradovite, sazykinaite-(Y), djerfisherite and chlorbartonite. Ivanyukite-Na-T forms epitaxial colourless crusts up to 100 μm thick on the surfaces of pseudo-cubic crystals of sitinakite (Fig. 2c) or are present as individual colourless rhombohedral crystals. Ivanyukite-Na-C forms blocky pale-orange (Fig. 2a) or milky-pink cubic crystals growing on natrolite. Ivanyukite-K occurs as pale-blue crystals associated with chlorbartonite (Fig. 2b), whereas ivanyukite-Cu was found as emerald green or light green cubic crystals in a cavity within partially decomposed djerfisherite (Fig. 2d). The amount of natural material of ivanyukite-K and ivanyukite-Cu in natural samples was rather small and their analogues were prepared by ion-exchange reactions using crystals of ivanyukite-Na-T.
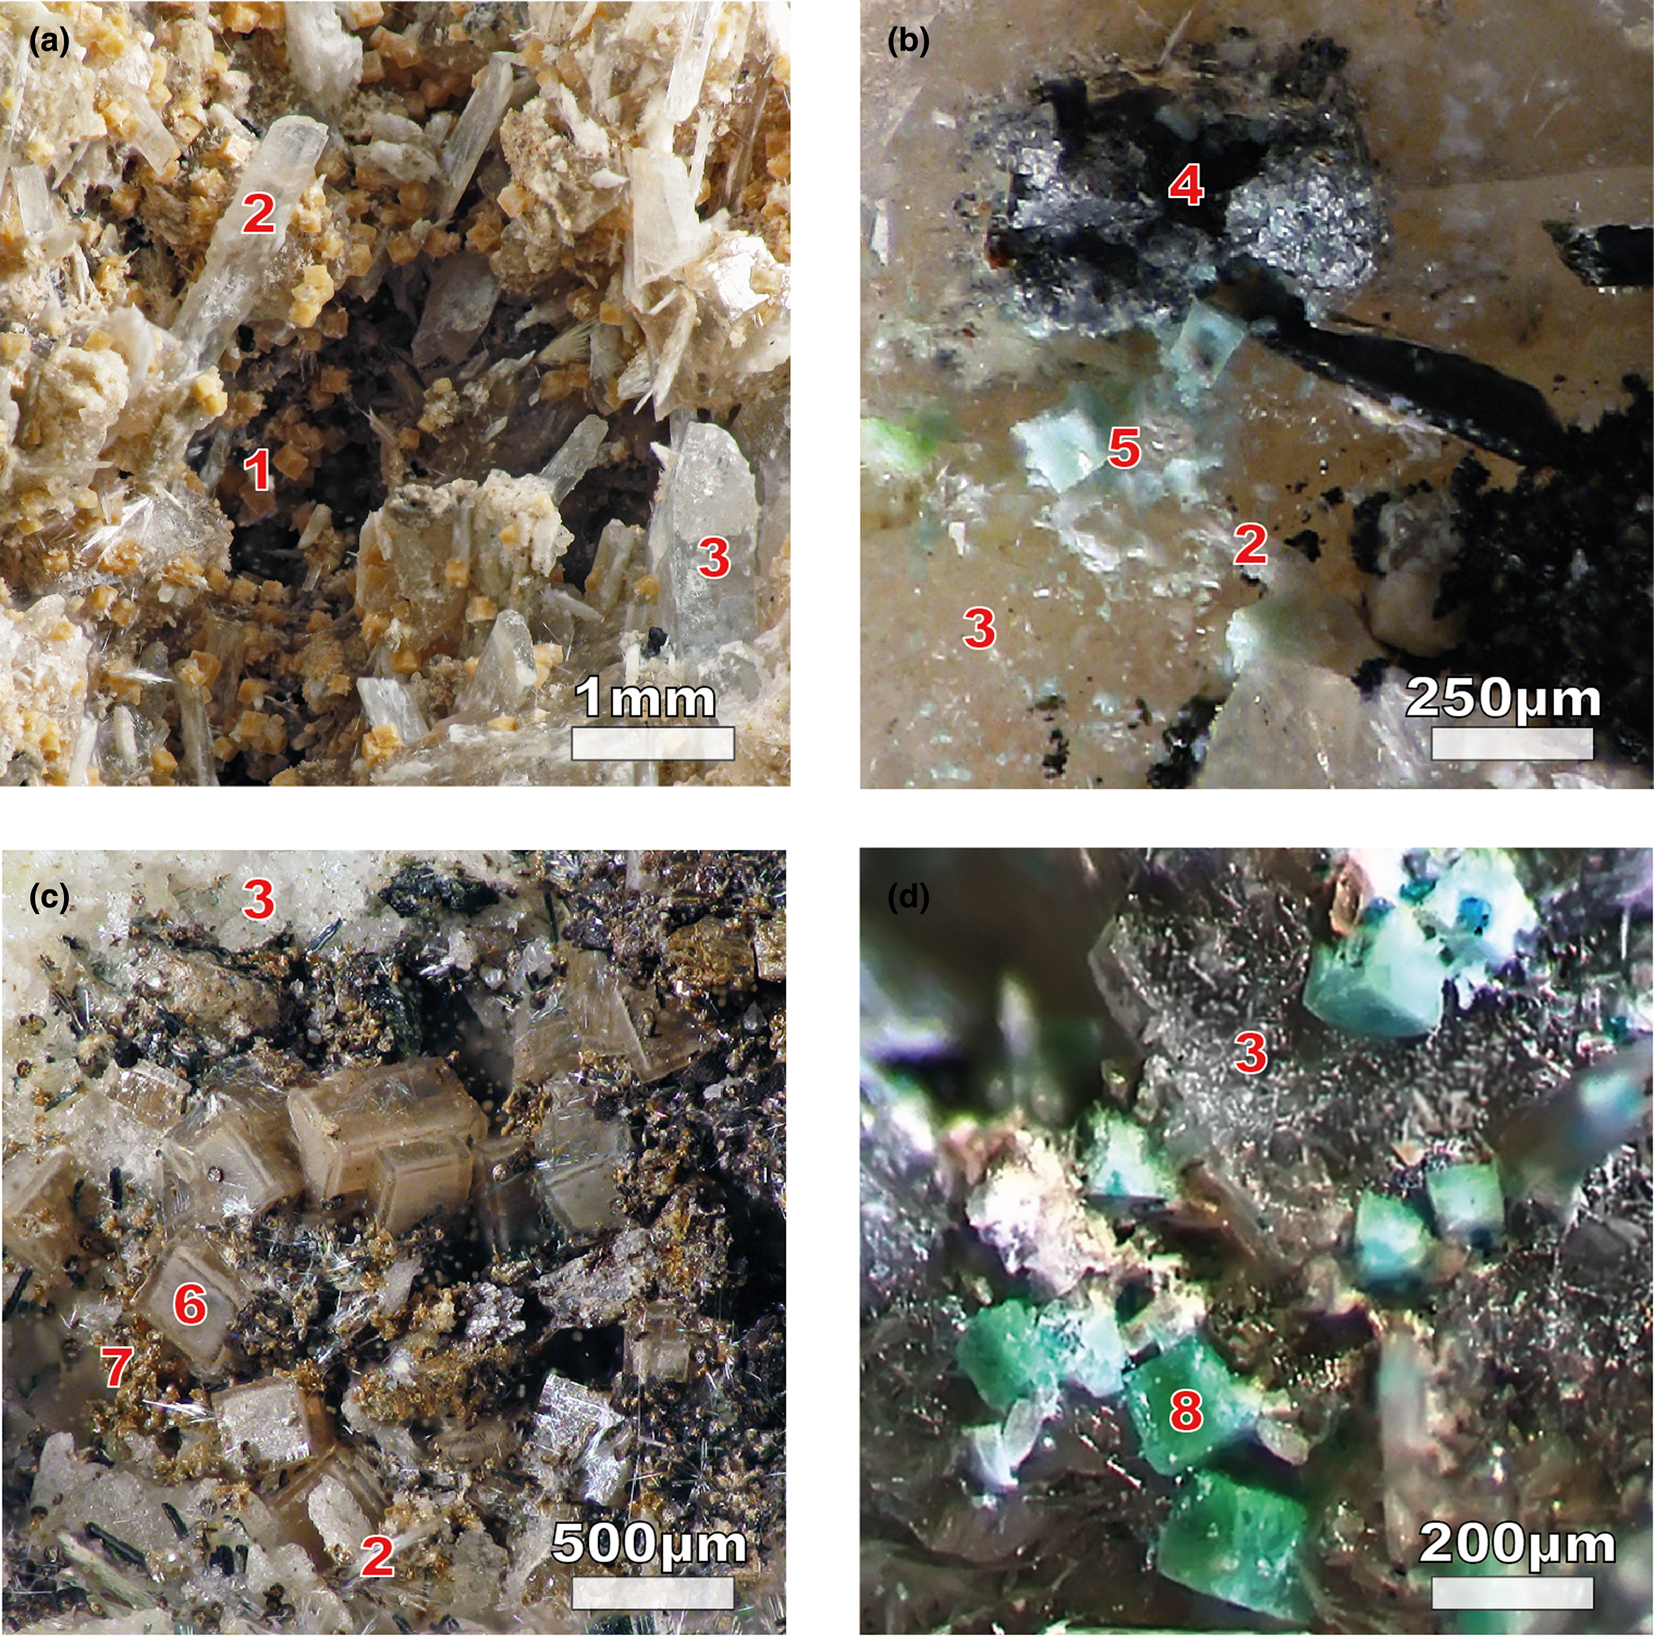
Fig. 2. Photos of ivanyukite-group samples: (a) MEC-3183, orange crystals of ivanyukite-Na-C (1) with vinogradovite (2) and natrolite (3); (b) crystals of chlorbartonite (4) with light blue ivanyukite-K (5); (c) MEC-3184 ivanyukite-Na-T (6) epitactic crusts growing on sitinakite crystals (not marked) with lucasite-(Ce) (7); and (d) ivanyukite-Cu (8) found in the cavity with altered djerfisherite. Photos by Gregory Ivanyuk.
For the structural studies, the colourless crusts of ivanyukite-Na-T and blocky pale-orange crystals of ivanyukite-Na-C were selected. In order to prepare an analogue of ivanyukite-K, the crystals of ivanyukite-Na-T used in the structural study were kept in water for 1 hour. Throughout this process, the crystals did not change their colour. The Cu-rich ivanyukite-K was prepared by placing crystals of ivanyukite-Na-T into 1M solution of CuCl2 for 96 hours under ambient conditions. The resulting crystals had a distinctly green colour.
The chemical composition of the samples studied was determined by wavelength-dispersive spectrometry using a Cameca MS-46 electron microprobe (Geological Institute, Kola Science Centre, Russian Academy of Sciences, Apatity) operating at 20 kV, 20–30 nA, with a 20 μm beam diameter. The following standards were used: lorenzenite (Na, Ti), pyrope (Al), wollastonite (Si, Ca), wadeite (K), synthetic MnCO3 (Mn), hematite (Fe), metallic copper (Cu) and synthetic LiNbO3 (Nb). Analyses were performed with the probe defocused up to 20 μm, and by continuous movement (up to 100 μm from start point) of the sample to minimise mineral damage and the loss of Na and H2O during the 10 s counting time. Compositions of exchanged forms were investigated with a Hitachi S-3400N scanning electron microscope (Geomodel Resource Center, St. Petersburg State University) equipped with an INCA 500 WDS detector operating at 20–30 nA and 20 kV. The analyses were performed with a beam size of 5–20 μm and with a counting time of 10–20/10 s on peaks/background, respectively, for each chemical element. The following standards were used: albite (Na, Al), benitoite (Ti), olivine (Fe), diopside (Si, Ca), orthoclase (K), rhodonite (Mn), metallic niobium (Nb) and copper (Cu). The presence of OH groups and molecular H2O was confirmed by Raman spectroscopy. The H2O content was calculated according to the crystal-structure data.
The Raman spectra were obtained from the surface of the crystals at room temperature using a wavelength of 514 nm in the range from 4000 to 80 cm−1 using a Horiba Jobin-Yvon LabRam HR 800 spectrometer, 8 mW laser power and a counting time of 60 s (Geomodel Resource Center, St. Petersburg State University). The baseline correction was carried out using the algorithms in the OriginPro 8.1 software package (OriginLab Corporation, Northampton, MA, USA).
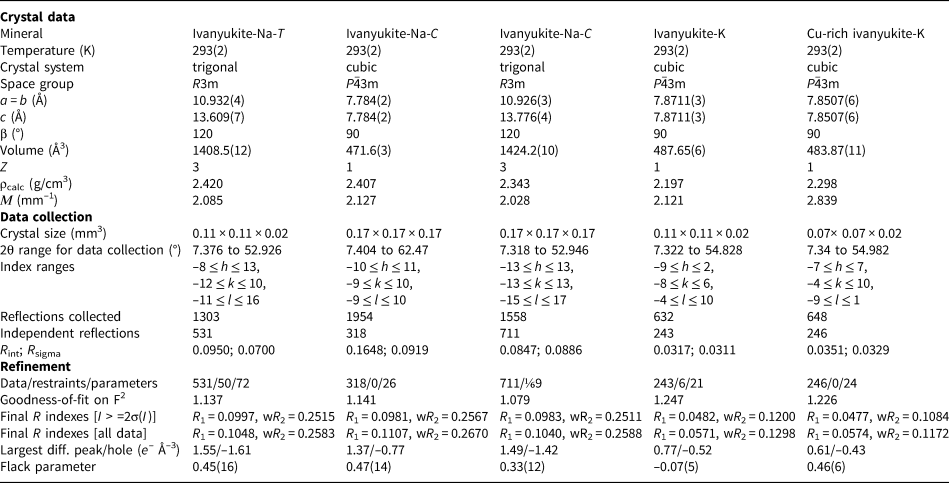
The crystal-structure studies were carried out at the X-ray Diffraction Resource Centre of St. Petersburg State University by means of the Oxford diffraction Xcalibur EOS and Supernova diffractometers equipped with CCD detectors using monochromatic MoKα radiation (λ = 0.71069 Å) at room temperature. More than a quarter of the diffraction sphere was collected for the cubic crystals and more than half for the trigonal crystals (scanning step 1°, exposure time 10–100 s). The data were integrated and corrected using the CrysAlisPro program package, an empirical absorption correction using spherical harmonics was applied, as implemented in the SCALE3 ABSPACK scaling algorithm (Agilent Technologies, 2014). The crystal structures were refined using the SHELXL software package (Sheldrick, Reference Sheldrick2015). The crystal structures were drawn using the VESTA 3 program (Momma and Izumi, Reference Momma and Izumi2011). Occupancies of the cation sites were calculated from the experimental site-scattering factors (except for the low-occupied sites) in accordance with the empirical chemical composition. The H sites could not be located.
The crystal structure of ivanyukite-Na-T was refined to R 1 = 0.099 (R int = 0.095) for 1303 independent reflections with F o > 4σ(F o) in space group R3m. The crystal structures of ivanyukite-Na-C, ivanyukite-K and Cu-rich ivanyukite-K were refined to R 1 = 0.098 (R int = 0.16), R 1 = 0.048 (R int = 0.031) and R 1 = 0.047 (R int = 0.035) for 1954, 632 and 648 independent reflections, respectively, in space group P $\bar{4}3m$ . The data obtained for ivanyukite-Na-C were also integrated in the space group R3m (R 1 = 0.098, R int = 0.085, 711 independent reflections), which, however, did not improve the refinement notably. Soft restraints were applied to thermal ellipsoids of extra-framework sites in the crystal structure of ivanyukite-Na-T. Atom labels are given according to Yakovenchuk et al. (Reference Yakovenchuk, Nikolaev, Selivanova, Pakhomovsky, Korchak, Spiridonova, Zalkind and Krivovichev2009).
Nomenclature
Ivanyukite-group minerals belong to pharmacosiderite supergroup (Rumsey et al., Reference Rumsey, Mills and Spratt2010). According to Yakovenchuk et al. (Reference Yakovenchuk, Nikolaev, Selivanova, Pakhomovsky, Korchak, Spiridonova, Zalkind and Krivovichev2009) the nomenclature of the ivanyukite-group minerals is based on the dominant extra-framework cation (Na, K or Cu) and the symmetry of the crystal structure. Ivanyukite-Na may crystallise in the cubic P $\bar{4}3m$ and trigonal R3m space groups with modifiers T = trigonal and C = cubic used to distinguish between two modifications (Nickel and Grice, Reference Nickel and Grice1998). The ordering of the extra-framework cations over two or more sites was not taken into account.
For microporous zeolite-group minerals disordered extra-framework cations with low occupancies are considered jointly. In this work we use a dominant-valency rule for the definition of ivanyukite-group minerals. The rule states that the dominant ion (vacancy) of the dominant valence state is considered for nomenclature purposes (Hatert and Burke, Reference Hatert and Burke2008; Bosi et al., Reference Bosi, Hatert, Hålenius, Pasero, Miyawaki and Mills2019). For example, in the original description, the Cu2+ is the dominant extra-framework cation for ivanyukite-Cu (Cu0.62K0.43Na0.04Ca0.03). In our case, (K0.76Cu0.45Ca0.04), the dominant root charge is 1+ (61%) and the sample studied is Cu-rich ivanyukite-K.
The ivanyukite-group minerals manifest zeolitic properties, leading to variable H2O content for different crystals of the same mineral depending on its extra-framework cation contents (Coombs et al., Reference Coombs, Alberti, Armbruster, Artioli, Colella, Galli, Grice, Liebau, Mandarino, Minato, Nickel, Passaglia, Peacor, Quartieri, Rinaldi, Ross, Sheppard, Tillmanns and Vezzalini1998).
Chemical composition
Analytical results for the structurally characterised ivanyukite-group minerals are provided in Table 1 in comparison with the previously determined compositions of ivanyukite-K and ivanyukite-Cu (Yakovenchuk et al., Reference Yakovenchuk, Nikolaev, Selivanova, Pakhomovsky, Korchak, Spiridonova, Zalkind and Krivovichev2009). The empirical formulas of the ivanyukite-group minerals were calculated on the basis of Si = 3 (instead of Si+Al = 3 used by Yakovenchuk et al. (Reference Yakovenchuk, Nikolaev, Selivanova, Pakhomovsky, Korchak, Spiridonova, Zalkind and Krivovichev2009), as all analyses are deficient with respect to the octahedral cations). The following empirical formulas have been obtained:

Table 1. Chemical composition of ivanyukite-group minerals.

*Calculated according to structural data for investigated samples in this work.
**Reference data – ivanyukite-K contains 0.19 wt.% SrO and Ivanyukite-Cu 0.20 wt.% SO3.
n/d – not detected
Raman spectroscopy
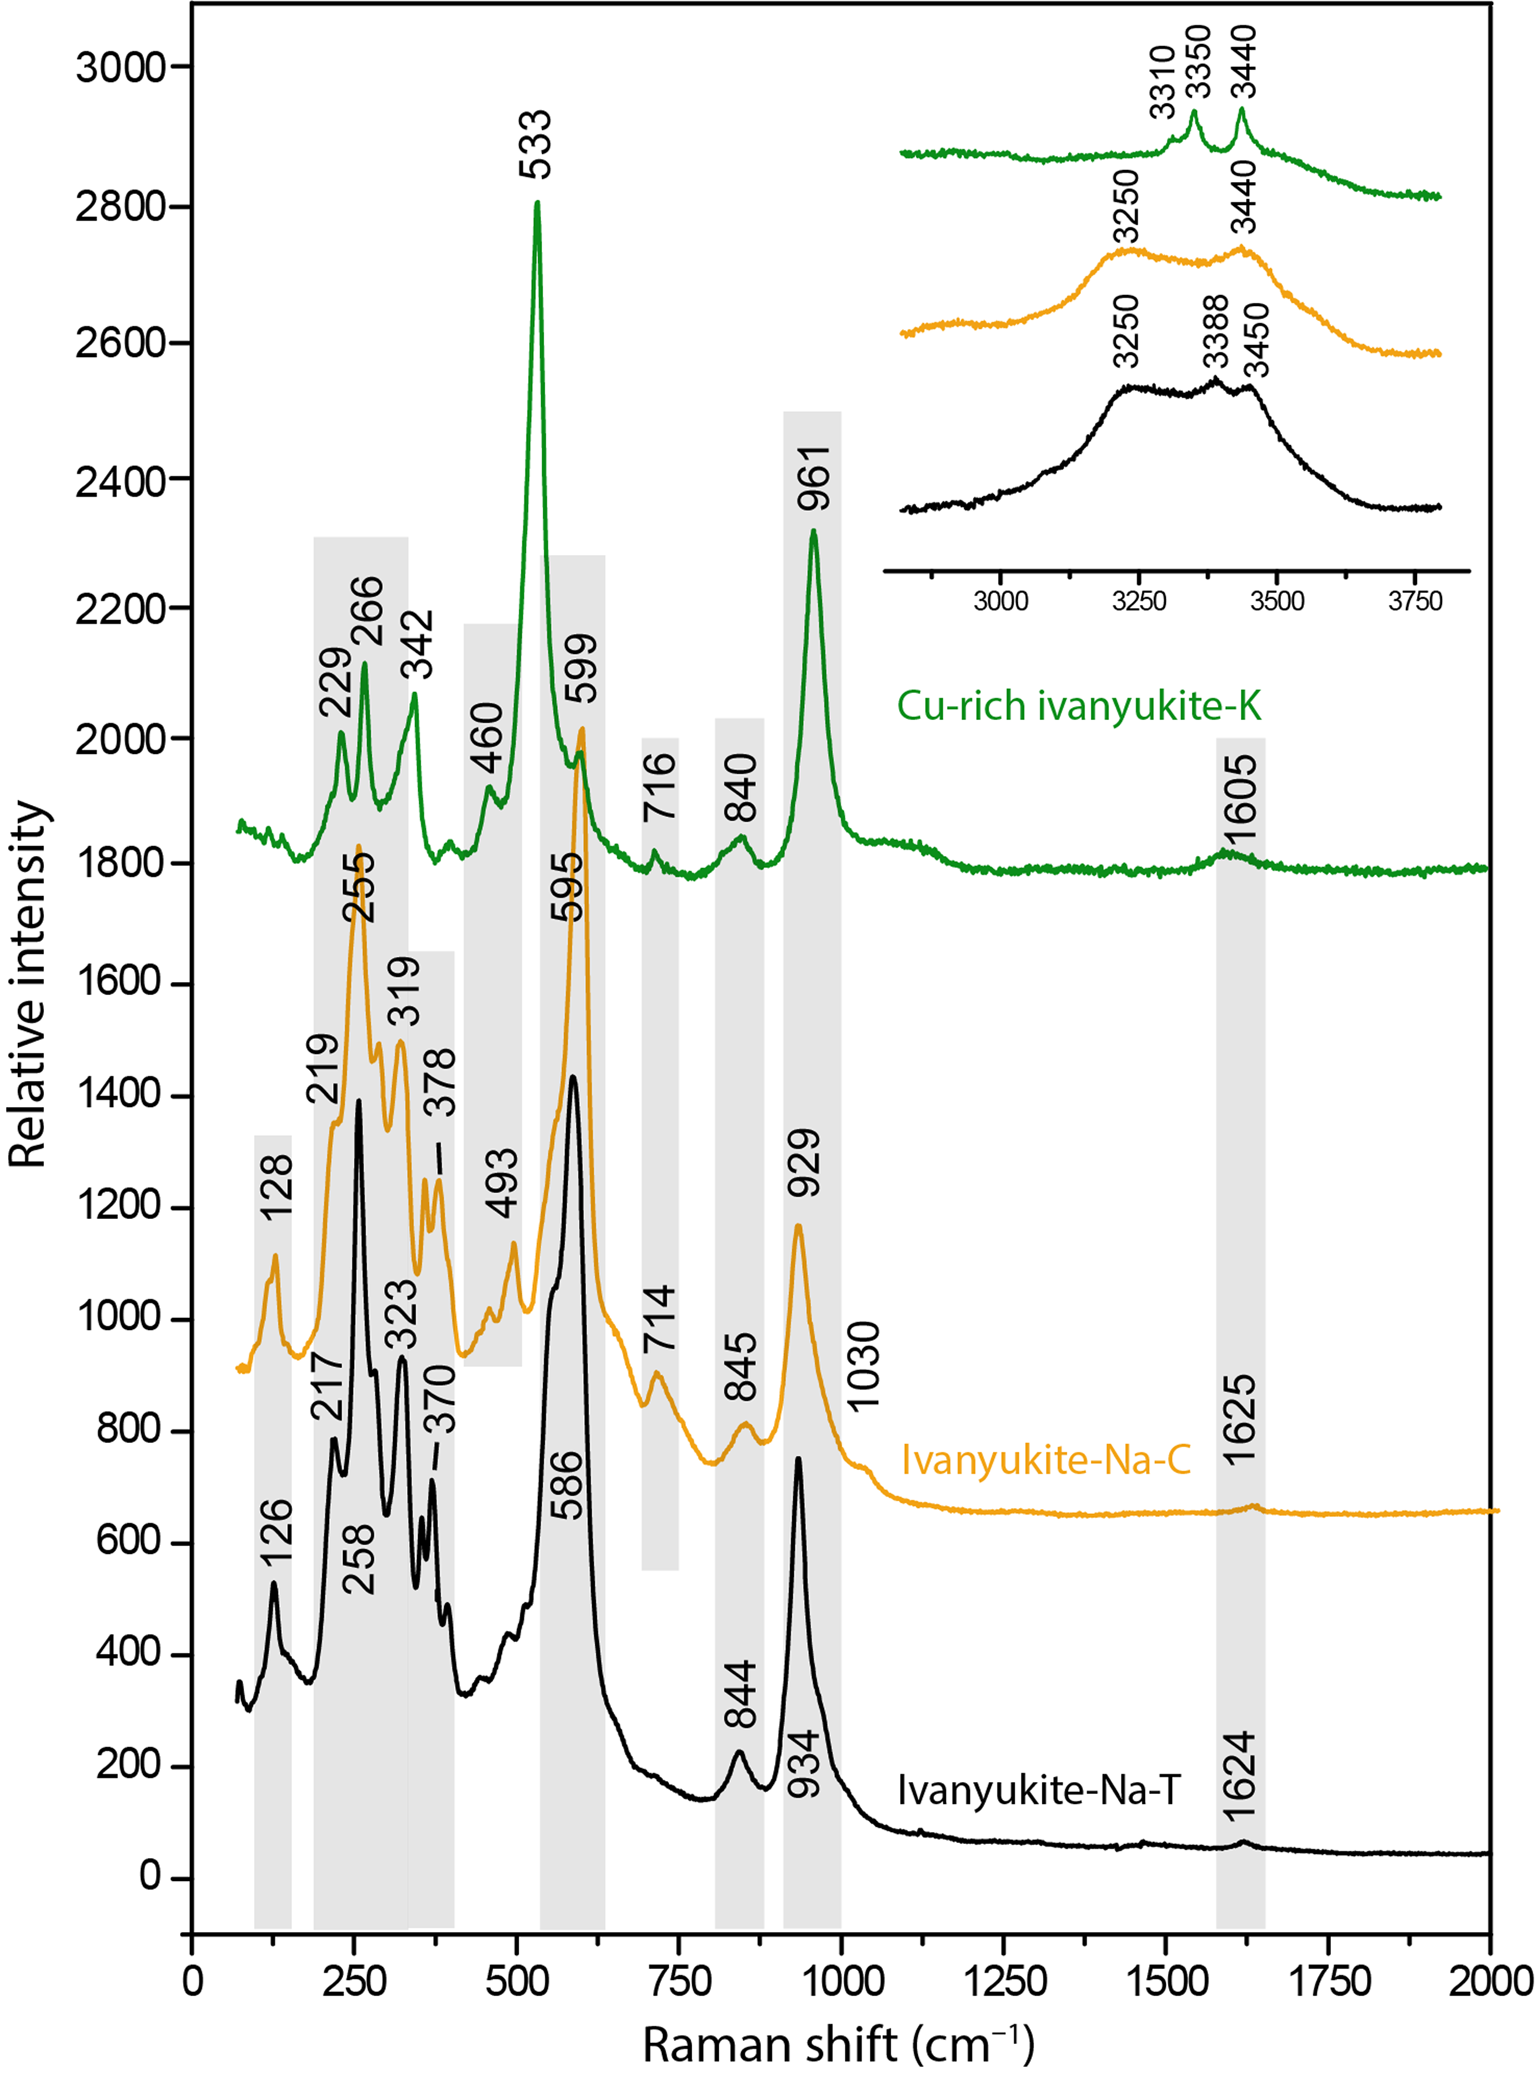
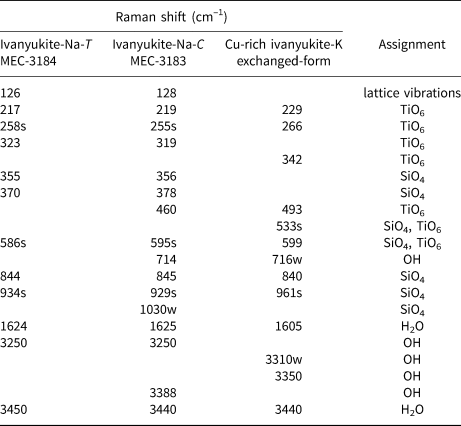
The Raman spectra of ivanyukite-Na-T, ivanyukite-Na-C, and Cu-rich ivanyukite-K are shown in Fig. 3. The spectrum of cubic Cu-rich ivanyukite-K is similar to that of pharmacosiderite from Cornwall, England, taken from sample R050574 of the RRUFF project (Lafuente et al., Reference Lafuente, Downs, Yang, Stone and De Gruyter2015). The assignments of the absorption bands were made by analogy with structurally related pharmacosiderite (Frost and Kloprogge, Reference Frost and Kloprogge2003; Filippi, Reference Filippi2004; Filippi et al., Reference Filippi, Doušová and Machovič2007) and titanosilicates (Celestian et al., Reference Celestian, Powers and Rader2013; Pakhomovsky et al., Reference Pakhomovsky, Panikorovskii, Yakovenchuk, Ivanyuk, Mikhailova, Krivovichev, Bocharov and Kalashnikov2018; Yakovenchuk et al., Reference Yakovenchuk, Pakhomovsky, Panikorovskii, Zolotarev, Mikhailova, Bocharov, Krivovichev and Ivanyuk2019) and are given in Table 2.

Fig. 3. Raman spectra of ivanyukite-group minerals.
Table 2. Raman shifts in the ivanyukite-group minerals spectra and their assignment.
sh = shoulder. s = strong intensity. w = weak
The intense vibrational bands at 961, 929, 924 and 1030 cm‒1 can be attributed to asymmetric stretching vibrations of SiO4 tetrahedra, while the bands at 840, 844, and 845, 941 cm−1 are assigned to symmetric vibration modes involving the same bonds (Filippi, Reference Filippi2004; Celestian et al., Reference Celestian, Powers and Rader2013). Weak bands at 714 and 716 cm−1 observed for ivanyukite-Na-C and Cu-rich ivanyukite-K may be attributed to the hydroxyl deformation (librational) mode (Frost and Kloprogge, Reference Frost and Kloprogge2003; Seki et al., Reference Seki, Chiang, Yu, Yu, Okuno, Hunger, Nagata and Bonn2020). The most intense bands at 595 and 599 cm−1 for rhombohedral and cubic ivanyukite-Na are significantly shifted (by ~60 cm−1) in comparison with the band at 533 cm−1 observed in the spectrum of Cu-rich ivanyukite-K and are related to the asymmetric bending vibrations of Si‒O bonds or overlapping stretching vibrations of Ti‒O bonds (Filippi et al., Reference Filippi, Doušová and Machovič2007; Celestian et al., Reference Celestian, Powers and Rader2013). This band also can be due to Cu−O stretching vibrations of mixed Cu−O−Ti stretching vibrations involving a Cu−O3 bond. The bands in the range 350‒500 cm−1 correspond to symmetric bending vibrations of O‒Si‒O bonds and overlapping stretching vibrations of Ti‒O bonds (Filippi et al., Reference Filippi, Doušová and Machovič2007; Pakhomovsky et al., Reference Pakhomovsky, Panikorovskii, Yakovenchuk, Ivanyuk, Mikhailova, Krivovichev, Bocharov and Kalashnikov2018; Yakovenchuk et al., Reference Yakovenchuk, Pakhomovsky, Panikorovskii, Zolotarev, Mikhailova, Bocharov, Krivovichev and Ivanyuk2019). The bands at 460 and 494 cm−1 assigned to different modes of Ti‒O stretching vibrations. Bands of different intensities in the region of 200‒350 cm−1 belong to the different bending vibration modes of the Ti‒O bonds in TiO6 octahedra (Frost and Kloprogge, Reference Frost and Kloprogge2003; Filippi, Reference Filippi2004). The bands with the wave numbers below 200 cm−1 belong to translational vibrations. The band at 126–128 cm−1 is observed in the Raman spectra of Na-bearing samples and is absent in the Raman spectrum of the Na-free Cu-rich ivanyukite-K and probably responds to translation modes of Na.
In the spectra, there are weak characteristic bands of the ν2 bending vibrations of the H−O−H bonds in the range of 1600−1625 cm−1. The bands in the region of 3250–3400 cm−1 (Fig. 3) correspond to the stretching vibrations in the O−H bonds of hydroxyl groups, whereas bands in the range 3440–3450 cm−1 correspond to the same vibrations in the H2O molecules (Seki et al., Reference Seki, Chiang, Yu, Yu, Okuno, Hunger, Nagata and Bonn2020).
In general, the spectrum of ivanyukite-Na-C is intermediate between the spectra of rhombohedral ivanyukite-Na-T and cubic Cu-rich ivanyukite-K. It contains bands near 128, 340, 370 and 590 cm−1 that are characteristic of ivanyukite-Na-T and at the same time has bands near 490 and 714 cm−1 that are characteristic of Cu-rich ivanyukite-K. This can be explained by the presence of domains with both trigonal and cubic symmetries within the same crystals of ivanyukite-Na-C.
Crystal structure
The crystal data, data collection and structure refinement details are given in Table 3, atom coordinates are in Tables 4–8. Anisotropic displacement parameters, selected bond lengths and other details of the structure refinement are in crystallographic information files deposited with the Principal Editor of Mineralogical Magazine and are available as Supplementary material (see below).
Table 3. Data collection information and structure-refinement parameters for the ivanyukite group of minerals.

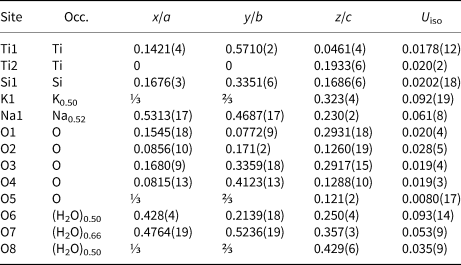
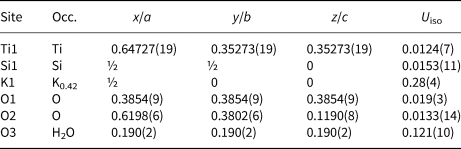
Table 4. Atomic coordinates, displacement parameters (Å2), and site occupation for ivanyukite-Na-T.

Table 5. Atomic coordinates, displacement parameters (Å2), and site occupation for cubic ivanyukite-Na-C.

Table 6. Atomic coordinates, displacement parameters (Å2), and site occupation for trigonal ivanyukite-Na-C.
Table 7. Atomic coordinates, displacement parameters (Å2), and site occupation for ivanyukite-K.

Table 8. Atomic coordinates, displacement parameters (Å2), and site occupation for Cu-rich ivanyukite-K.
The crystal structures of all ivanyukite-group minerals studied (Fig. 4) possess a pharmacosiderite structure topology and are based upon topologically identical three-dimensional frameworks (Krivovichev, Reference Krivovichev, Ferraris and Merlino2005). The main structural feature of the group is the presence of cubane-like [Ti4O4]8+ clusters formed by four edge-sharing TiO6 octahedra (Oleksiienko et al., Reference Oleksiienko, Wolkersdorfer and Sillanpää2017). The [Ti4O4]8+ clusters are connected by sharing corners with SiO4 tetrahedra and form a negatively charged [(TiO)4(SiO4)3]4− framework. The framework has a 3-dimensional system of channels defined by 8-membered rings (8-MRs) with a free (suitable for migration) crystallographic diameter of ~3.5 Å (Yakovenchuk et al., Reference Yakovenchuk, Nikolaev, Selivanova, Pakhomovsky, Korchak, Spiridonova, Zalkind and Krivovichev2009). The channels are occupied by extra-framework cations (e.g. Na+, K+, Cu2+) and H2O molecules.

Fig. 4. A general view of crystal structures of ivanyukite-group minerals: (a) ivanyukite-Na-T; (b) ivanyukite-Na-C; (c) ivanyukite-K; (d) Cu-rich ivanyukite-K in cation-centred polyhedral representation (TiO6 octahedra are light blue, SiO4 tetrahedra are blue, oxygen sites shown as red spheres, K – lilac, Na – yellow and Cu - teal. The spheres are filled according to atom occupancy.
Ivanyukite-Na-T
Ivanyukite-Na-T crystallises in the non-centrosymmetric R3m space group. In contrast to the cubic compounds (Behrens et al., Reference Behrens, Poojary and Clearfield1996; Rocha and Anderson, Reference Rocha and Anderson2000; Xu et al., Reference Xu, Navrotsky, Nyman and Nenoff2004), the crystal structure contains two crystallographically independent Ti sites (Fig. 4a). Both TiO6 octahedra have very similar average <Ti−O> bond lengths of 1.959 and 1.931 Å, but their polyhedral volumes are somewhat different, 9.77 and 9.36 Å3 for Ti1O6 and Ti2O6 polyhedra, respectively. The framework contains one independent Si and five independent O sites. The Si−O bond lengths are in the range 1.63–1.68 Å with the mean <Si−O> distance of 1.655 Å. In contrast to the previously reported structure (Yakovenchuk et al., Reference Yakovenchuk, Nikolaev, Selivanova, Pakhomovsky, Korchak, Spiridonova, Zalkind and Krivovichev2009), there is an additional half-populated O8 (H2O) site present located near (1.45 Å) the K1 site. The additional H2O site is likely to be populated when the K1 site is vacant. The geometry of the extra-framework cation configuration is very close to that described by Yakovenchuk et al. (Reference Yakovenchuk, Nikolaev, Selivanova, Pakhomovsky, Korchak, Spiridonova, Zalkind and Krivovichev2009), with Na atoms in fivefold and K atoms in sevenfold coordination. The K site forms bonds to three framework O sites, two of which are bonded to the Ti2 site of the smaller Ti2O6 octahedron. Dadachov and Harrison (Reference Dadachov and Harrison1997) pointed out that the symmetry reduction from cubic to trigonal observed for the Na4[(TiO)4(SiO4)3]⋅6H2O compound occurs as a result of inclusion of an additional guest Na1 cation and its interaction with the framework O atoms. The same is the case for the crystal structure of ivanyukite-Na-T, where extra-framework cations are located in the framework cavities (Fig. 5a) and interact with framework O atoms, inducing the rhombohedral distortion. The structural formula of ivanyukite-Na-T determined from the structure refinement can be written as Na1.60K0.50[Ti4O2.10(OH)1.90(SiO4)3]⋅5.5H2O.
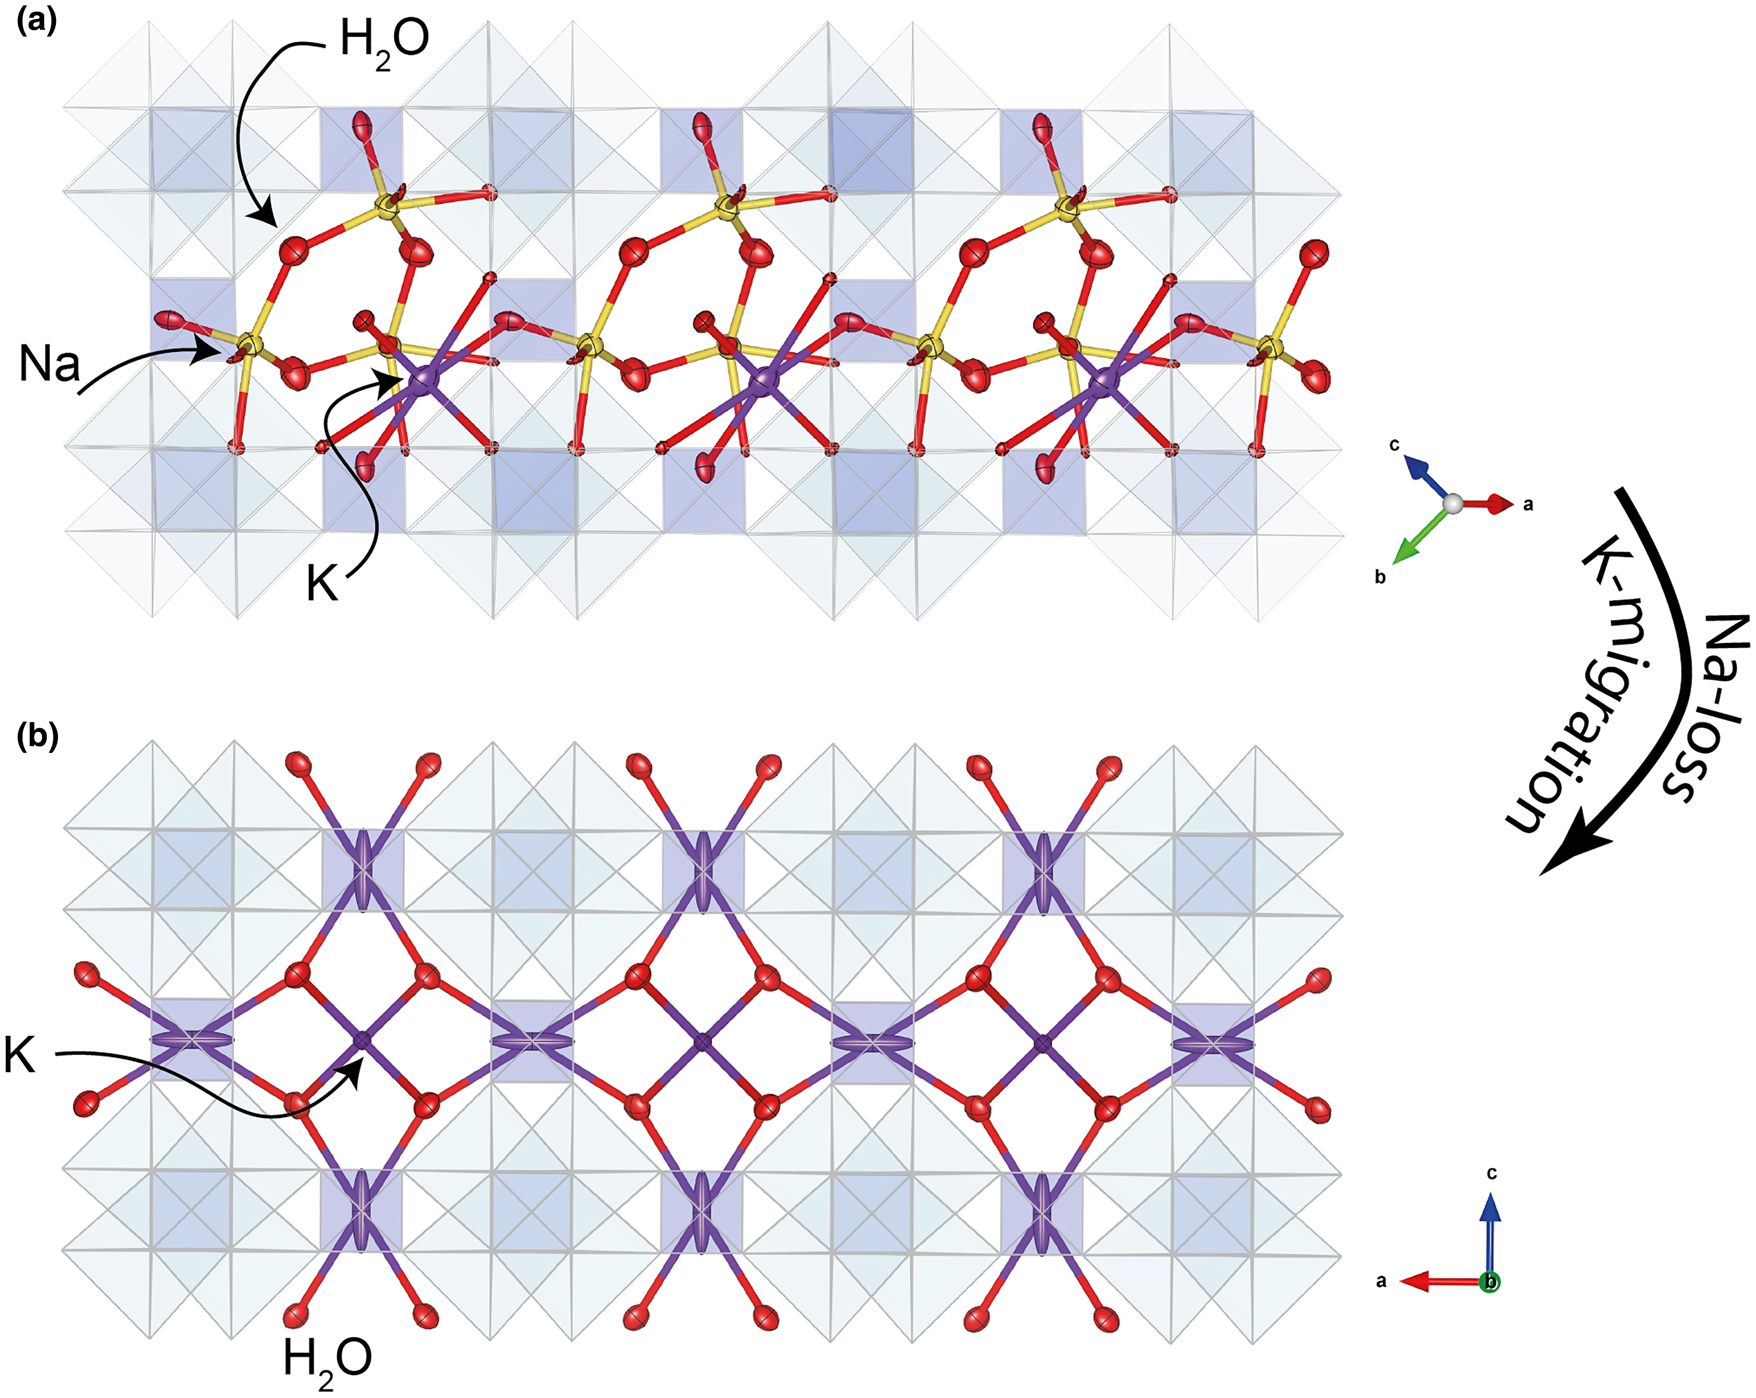
Fig. 5. Arrangement of extra-framework cations in the crystals structures of (a) ivanyukite-Na-T and (b) ivanyukite-K.
Ivanyukite-Na-С
Like the majority of the pharmacosiderite-supergroup minerals (Rumsey et al., Reference Rumsey, Mills and Spratt2010), cubic ivanyukite-Na-C crystallises in the P $\bar{4}3m$ space group (Fig. 4b). The framework sites contain one symmetrically independent Si1 and one Ti1 site coordinated by the O1 and O2 atoms. The mean bond lengths for SiO4 tetrahedra, <1.640> Å, and TiO6 octahedra, <1.947> Å, are in good agreement with their full occupancies. The K1 site is situated at the centre of the 8-MR with the site occupation factor (s.o.f.) = 0.42 and is bonded to eight O2 and four O3(H2O) atoms with the bond lengths of 3.228(3) and 3.185(4) Å, respectively. The Na atoms occupy the 24j site located at 1.51 Å from the K1 site. Due to the short Na1–Na1 distance (~1.5 Å), this site is predominantly vacant with the assigned occupancy Na0.10H2O0.15. The Na atoms are 6-coordinated by two O2, two O3 (H2O) and two O4 (H2O) atoms. Such a coordination of Na in pharmacosiderite-type compounds has not been observed previously. In the crystal structure of a Na germanate compound (Nowotny and Wittmann, Reference Nowotny and Wittmann1954), two Na sites are located at the centres of the 8-MRs (also one site disordered), whereas, in the structure of natropharmacosiderite, Na occupies a split site at the centre of the 8-MR (Hager et al., Reference Hager, Leverett, Williams, Mills, Hibbs, Raudsepp, Kampf and Birch2010). The refined crystal chemical formula of ivanyukite-Na-C can be written as Na1.20K0.75[Ti4(OH)2.05O1.95(SiO4)3]⋅5.8H2O.
Refinement of the same material in the R3m space group yields a model similar to that of ivanyukite-Na-T, but with the slightly different extra-framework composition. The O8 site is vacant, but the O6 and O7 H2O sites are fully populated. The increasing H2O content is associated with the slight increase in the unit-cell volume from 1408.5(12) (for ivanyukite-Na-T) to 1424.2(10) Å3. Compared to ivanyukite-Na-T, the occupancies of the Na1 and K1 sites decrease slightly. The crystal chemical formula can be written as Na1.50K0.40[Ti4(OH)2.10O1.90(SiO4)3]⋅6H2O.
Ivanyukite-K
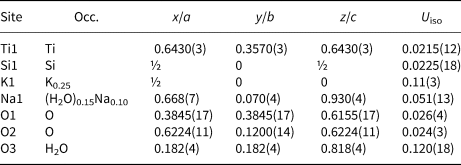
Ivanyukite-K was obtained through decationisation of the crystal of ivanyukite-Na-T used for the structure refinement. The crystal structure was solved in the P $\bar{4}3m$ space group (Fig. 4b) and refined to R 1 = 0.048. The crystal structure of ivanyukite-K has the same framework as ivanyukite-Na-C and contains independent Si and Ti sites and two O sites. The extra-framework content (Fig. 5b) is composed from the fully populated O3 (H2O) site and the K1 site with s.o.f. = 0.42. The refined formula can be written as K1.26[Ti4(OH)2.74O1.26(SiO4)3]⋅4H2O.
Cu-rich ivanyukite-K
For the initial refinement of the crystal structure of Cu-exchanged ivanyukite, the structure model of ivanyukite-K was used. The K1 site has an occupancy of 0.25. An additional electron-density peak of 4 e− was observed near the K1 site (1.17 Å) (Fig. 6b) that was interpreted as an additional O3 (H2O) site with s.o.f. = 0.5. Cu was assigned to the O4 site (identical to the O3 site in the crystal structure of ivanyukite-K) with mixed occupancy (H2O)0.19Cu0.14. According to the structure refinement, the Cu atoms are coordinated by three O3 and one O2 sites with the Cu–O distances of 2.46 and 2.62 Å, respectively. The refined formula of Cu-rich ivanyukite-K can be written as Cu0.54K0.75[Ti4(OH)2.17O1.83(SiO4)3]⋅3.76H2O.
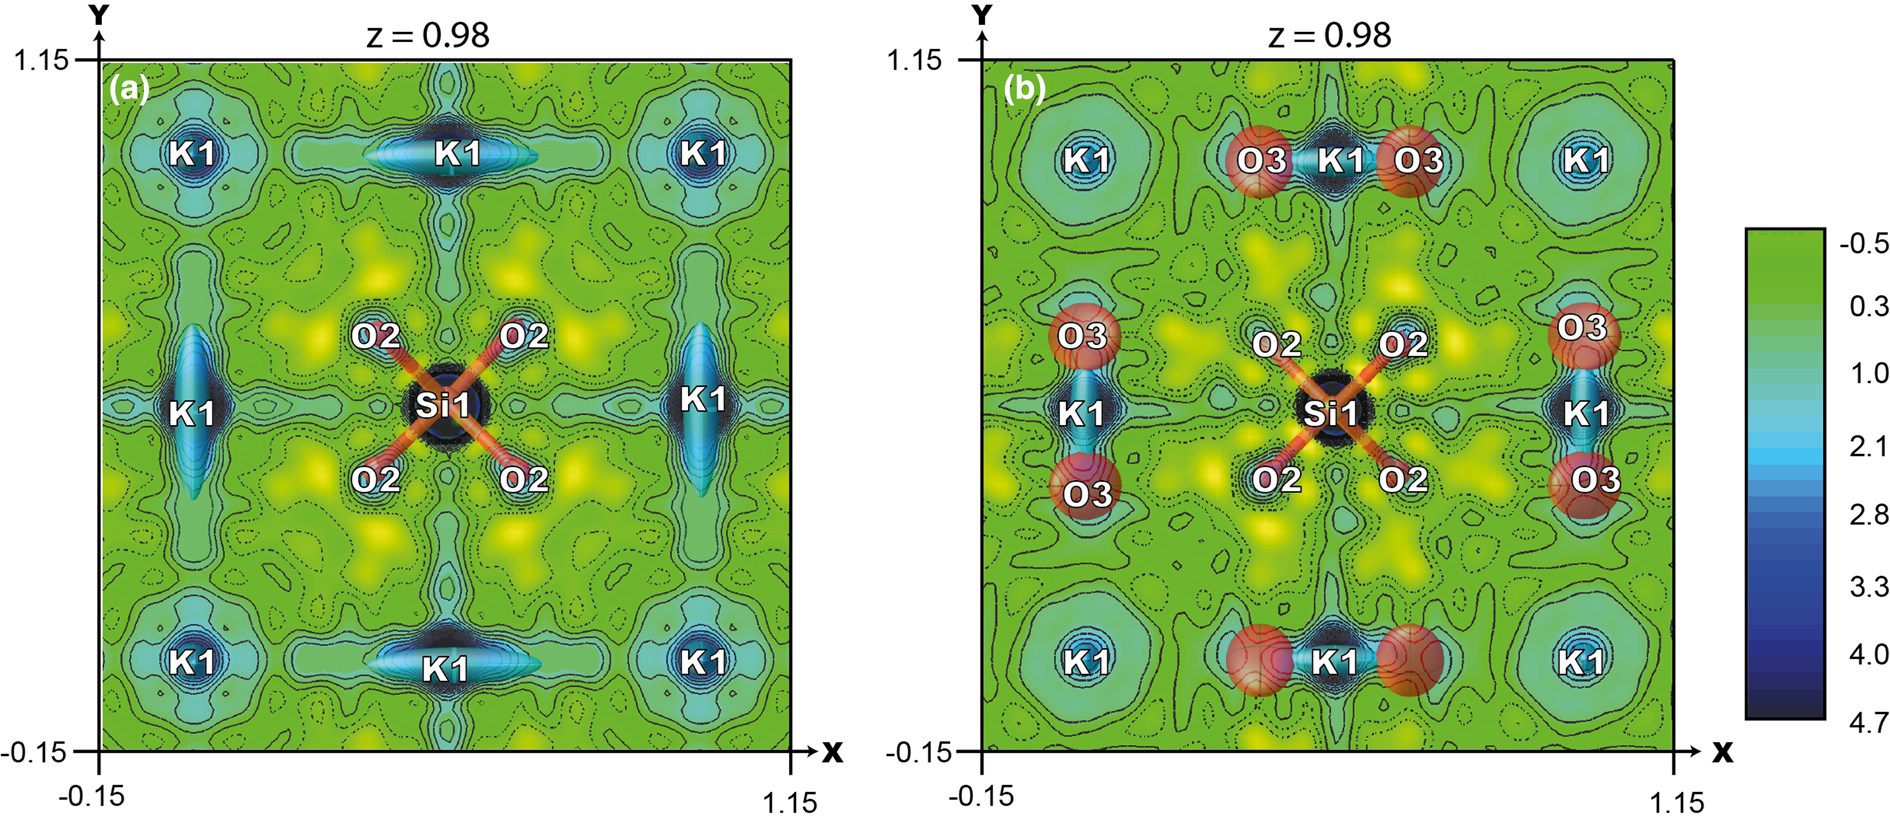
Fig. 6. Observed electron density map around K1 and O3 sites (projection on (001) plane), contour intervals are 0.5 e – Å–3 in the crystal structures of (a) ivanyukite-K and (b) Cu-rich ivanyukite-K.
Discussion
Twinning and symmetry of ivanyukite-Na-C
The Raman spectrum of ivanyukite-Na-C (Fig. 3) contains bands corresponding to both rhombohedral and cubic ivanyukite-type structures. As the beam diameter is 2–5 μm, this duality may be related to the regular intergrowths of the two ivanyukite-Na polymorphs or to the presence in the same crystal of domains with different symmetries.
In the course of single-crystal X-ray diffraction experiment, a total of 2205 reflections were collected, of which 940 were indexed in the cubic cell and 669 in the rhombohedral cell; 338 reflections overlapped. During data reduction, it was found that the crystal of ivanyukite-Na-С was a two-component twin (with the R3m and P $\bar{4}3m$ symmetries) related by a threefold axis (in both cells) with the twinning matrix [0.6697 0.3264 0.3307 / 0.3427 –0.3281 –0.3287 / 0.3668 0.6858 –0.3155] [~ ⅔ ⅓ ⅓ / ⅓ –⅓ –⅓ / ⅓ ⅔ –⅓]. The observed difference in the unit-cell parameters of the trigonal and cubic polymorphs results in the significant splitting of intense reflections at high angles of 2θ. For example, the $\bar{1}$
 00 and $\bar{1}$
 0$\bar{1}$
 peaks of the cubic and trigonal unit cells correspond to the same reflection, whereas the $\bar{4}$
 00 and $\bar{4}$
 0$\bar{4}$
 peaks are separated from each other (Fig. 7c). It is of interest that the refined crystal chemical formulas for ivanyukite-Na-T and ivanyukite-Na-C are very close to each other: (Na1.20K0.75[Ti4(OH)2.05O1.95(SiO4)3]⋅5.8H2O and Na1.50K0.40[Ti4(OH)2.10O1.90(SiO4)3]⋅6H2O, respectively. It is quite probable that this composition is on the border of stability between the two forms. It can be hypothesised that ivanyukite-Na was initially trigonal and transformed into the cubic form after partial loss of Na. The transformation was accompanied by the migration of K+ cations. The further decrease of the extra-framework Na content through the Na+ + O2− ↔ □ + OH− substitution mechanism (protonation) results in the formation of ivanyukite-K.

Fig. 7. (a) Reconstructed hk0 section of reciprocal space obtained from the ivanyukite-Na-C crystal studied. (b) Generation of a reciprocal lattice with cubic (black) and trigonal (yellow) symmetry oriented on the hk0 section of reciprocal space; (c) h0l section of reciprocal space, and (d) reciprocal lattices oriented on the h0l section of reciprocal space.
Ion-exchange induced transition R3m → P$\bar{4}3m$

The transformation of ivanyukite-Na-T into a cubic form owing to the release of Na in aqueous solutions of NH4Cl, CsCl, RbCl, CuSO4, and Clerici solutions was reported previously by Yakovenchuk et al. (Reference Yakovenchuk, Selivanova, Ivanyuk, Pakhomovsky, Spiridonova and Krivovichev2008). Additionally, Spiridonova et al. (Reference Spiridonova, Krivovichev, Yakovenchuk and Pakhomovsky2011) demonstrated the R3m → P $\bar{4}3m$ space-group change for the Sr- and Rb-exchanged forms of ivanyukite-Na-T. The partial loss of Na in ivanyukite-Na-T in our experiments leads to the significant reorganisation of the extra-framework cations with K atoms migrating to the centres of 8-MRs (Fig. 5). This migration leads to the weakening of the interaction with the framework oxygen atoms, leading to the relaxation of the structure and its adoption of a higher (cubic) symmetry. The transformation results in the deformation of the −Ti−O−Ti−O− rhombus and the elongation of the Ti ⋅⋅⋅ Ti distance from 3.114 Å in ivanyukite-Na-T to 3.279 Å in ivanyukite-K and shrinking along the O−O direction (Fig. 8). The transition was observed in situ by means of a polarising microscope; the release of Na and the increase in symmetry was confirmed by the birefringence disappearing under crossed polars during the course of ion-exchange.

Fig. 8. Distortion of a cubane-like cluster in the rhombohedral structure of ivanyukite-Na-T in comparison to its ideal cubic symmetry in the crystal structure ivanyukite-K.
Evolution of chemical composition
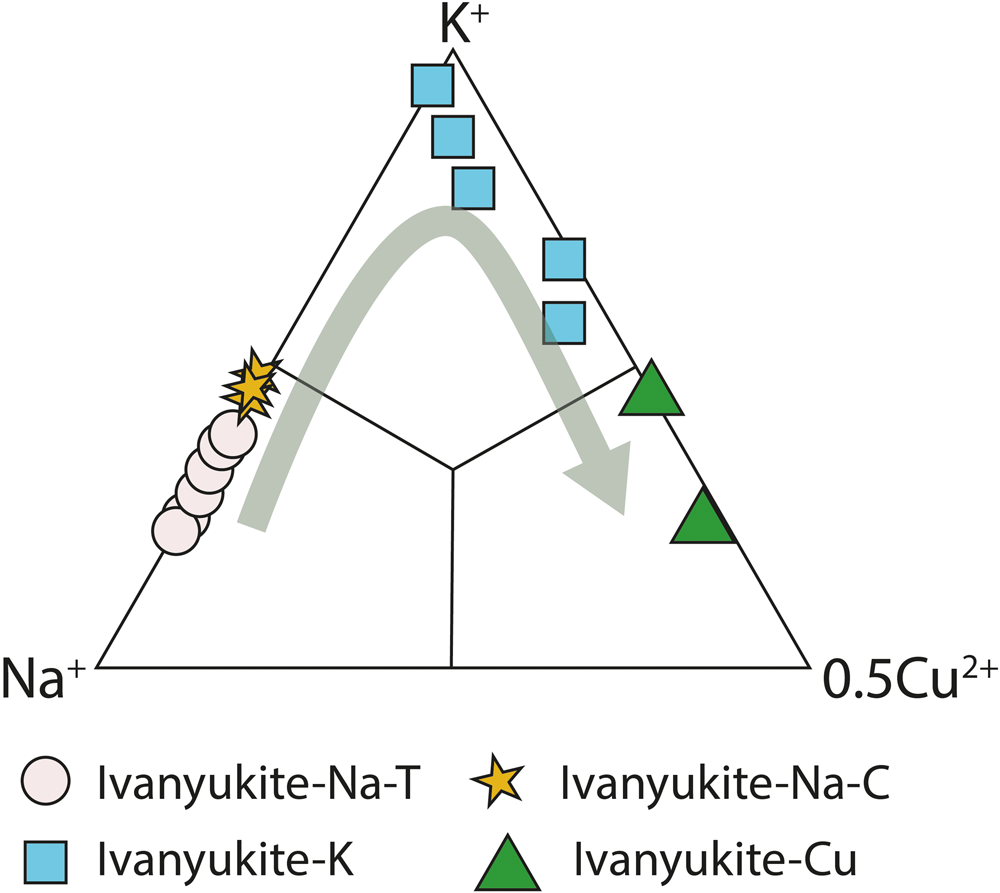
The key point in the chemical evolution of the ivanyukite-group minerals is the permanent decrease of the Na content along the series ivanyukite-Na-T → ivanyukite-Na-C → ivanyukite-K → Cu-rich ivanyukite-K → ivanyukite-Cu. The relationships between the chemical compositions of these minerals are shown in Fig. 9. Both ivanyukite-K and ivanyukite-Cu may form directly from ivanyukite-Na-T. The cation-exchange experiments with progressive addition of Cu to natural ivanyukite-K produces a green colour indicative of the decationisation process in the series ivanyukite-Na-T to Cu-rich ivanyukite-K and potentially ivanyukite-Cu. The addition of Cu to natural ivanyukite-K produces a light-blue colour (Fig. 9) and the subsequent addition of Cu leads to formation of ivanyukite-Cu with a distinctly green colour (Fig. 2d, Fig. 9). The decrease in the total cationic charge excluding hydrogen atoms from 18.44 (ivanyukite-Na-T), 17.54 (ivanyukite-Na-C) to 16.73 (ivanyukite-K) and 16.92 (Cu-rich ivanyukite-K) indicates the significant role of hydrogen atoms in these substitutions that enter the structure through the protonation of the O framework sites.

Fig. 9. Relation between content of main extra-framework cations K, Na and Cu in the ivanyukite-group minerals after Yakovenchuk et al. (Reference Yakovenchuk, Nikolaev, Selivanova, Pakhomovsky, Korchak, Spiridonova, Zalkind and Krivovichev2009) with our data plotted. Green arrow indicates evolution of chemical composition through time.
The ivanyukite-group minerals possess outstanding ion-exchange properties exemplified by several different species/polymorphs appearing in the same physical sample (Fig. 10). Ivanyukite-Na with both R3m and P $\bar{4}3m$ domains loses Na by the substitution Na+ + O2− ↔ □ + OH−, leading to the formation of ivanyukite-K. The incorporation of Cu derived from alteration of primary minerals (such as djerfisherite, chalcopyrite or chlorbartonite) leads to the formation of ivanyukite-Cu.

Fig. 10. Evolution of ivanyukite-group minerals: three species in one sample, Koashva mine, Khibiny. The sample is from a private collection (VNY, under study). Photo by Gregory Ivanyuk .
Conclusions
The observed mineralogical and structural relations between ivanyukite-Na-T, ivanyukite-Na-C, ivanyukite-K and Cu-rich ivanyukite-K have confirmed the existence of the ‘ivanyukite-Na-T → ivanyukite-Na-C → ivanyukite-K → Cu-rich ivanyukite-K → ivanyukite-Cu’ transformational series (similar to the ‘kazakovite → tisinalite’ (Khomyakov et al., Reference Khomyakov, Semenov, Es'kova and Voronkov1974), ‘zirsinalite → lovozerite’ (Khomyakov, Reference Khomyakov1977), ‘parakeldyshite → keldyshite’ (Kabanova et al., Reference Kabanova, Panikorovskii, Shilovskikh, Vlasenko, Yakovenchuk, Aksenov, Bocharov and Krivovichev2020) series). The evolution is governed by the outstanding ion-exchange properties of the pharmacosiderite-structured microporous titanosilicate framework. Ivanyukite-Na-T (R3m) loses Na by the substitution Na+ + O2− ↔ □ + OH−, which is accompanied by the migration of K atoms, resulting in its transformation into ivanyukite-Na-C (P $\bar{4}3m$ ). The further loss of Na+ by the same process leads to the formation of ivanyukite-K. The ion-exchange reaction K+ + OH− ↔ Cu2+ + O2− results in the formation of ivanyukite-Cu. The nature of the ivanyukite-Na-C crystals with separate R3m and P $\bar{4}3m$
 domains was confirmed by Raman spectroscopy and optical observations.
The experimental results of this study are relevant to the understanding of the post-crystallisation processes in the hyperagpaitic rocks of the Kola alkaline massifs and the genesis of new mineral species, leading to the increased mineralogical diversity in these geochemical environments.
Supplementary material
To view supplementary material for this article, please visit https://doi.org/10.1180/mgm.2021.51
Acknowledgements
The research is supported by the Russian Foundation for Basic Research, grant 18-29-12039 and President of Russia grant for the leading scientific schools (grant NSh-2526.2020.5). X-ray diffraction studies have been performed at the XRD Research Resource Centre of St. Petersburg State University.