


It is an honour to present this landmark lecture at the 7th World Congress of Pediatric Cardiology and Cardiac Surgery, and in particular to represent my colleagues in cardiac anaesthesia and intensive care. The theme of the World Congress has been centred around “bridging together”, and I wish to build upon this, particularly around aspects of transferring information, our interaction with technology, and how we may be able to generate new insights with the analysis of continuous physiologic signals.
First and foremost, our focus in the ICU and the operating room has to be on the individual patient we are caring for. It is easy to assign certain expectations and outcomes based on a population of patients, but within these populations, individual patients and their phenotypes can be quite variable. It is also important to observe the patient rather than simply the technology that surrounds them. We rely on a wide range of monitors and devices, most of which are not linked or integrated. Indeed, the integration of physiologic signals is the responsibility of clinicians at the bedside and we all know that this can be problematic. As clinicians, we vary in our ability to absorb a range of information, let alone interpret the relationship of these signals and act upon them in a timely fashion.
Continuum of care
The cardiac operating room and the ICU are highly complex environments where the interaction between humans and technology is critical. These are environments in which specialised individuals come together to perform their tasks. However, there should be seamless integration and transfer of information between these areas. Coordinated care is essential and in many respects the critical care management starts in the operating room. We should see the operating room and the ICU as a continuum of care, and to facilitate the transfer of information and care requires common understanding of the environments. It starts with common management plans, such as the use of invasive lines and monitoring, the type of anaesthesia and impact this may have on postoperative care, strategies around mechanical ventilation and early extubation, and strategies around fluid management and transfusion requirements. Almost all centres will have a formalised process for the handoff of information from the operating room to the critical care team. Often a checklist is used to facilitate this, but the right information must be transferred. Transferring understanding about the physiologic state of the patient and the haemodynamic trajectory is critical. There is a large amount of data generated in the operating room, particularly from continuous physiologic signals, that stay locked within the operating room and are not transferred with the patient to the ICU.
Patient journey
To improve the way we transfer information and interact with technology, I think it is first important to understand the patient journey and the current state in which we work (Fig 1). In this figure, the patient is central, our focus for the care we deliver. On admission, we try to assign severity of illness indices according to the disease or procedures that may help us determine the expected outcome of the patient. And then at discharge, we look at various outcomes, benchmarks, and indices to determine and compare the quality of care we have delivered. Overlaying this is the structure of the environment and systems for care, teams, and workflow, supported by various guidelines and protocols, early warning systems and quality metrics. We rely on categorical data generated within the electronic health record and the information streaming from monitors and devices to help us make decisions. As noted in the figure, and despite the structure overlaying patient care as outlined, our decision nodes can bounce around and may not be consistent between providers. Variability in decision-making is well recognised and is often cited as the cause for practice variability. Indeed, practice variability is a focus for improving the quality of care we deliver and reducing costs as well as unintended resource utilisation. This, however, is too simplistic. Practice variability may indeed be idiosyncratic; however, I believe it is physiologic variability within patients that leads to variability in decisions; this is normal and appropriate for the management of patients and allows for us to adapt care as needed. The key therefore is being able to understand and convey the evolving physiologic state of a patient, and this is the where analysis of continuous physiologic signals in either the operating room or ICU will be beneficial.
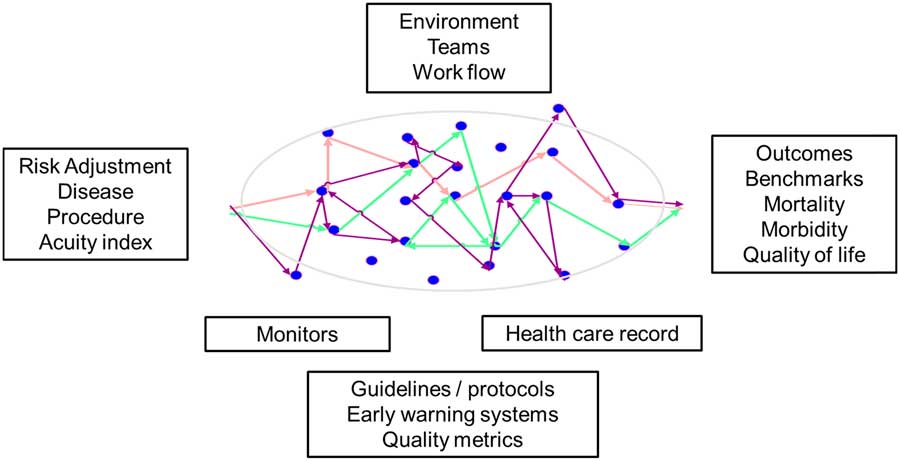
Figure 1 Components to delivering a safe and efficient journey for a patient in the ICU. Decision nodes can be seen in colour, and while they can reflect variability in decision making by clinicians, more commonly they reflect patient variability in physiology and response to management. Characterising the physiologic variability is a goal of data science in critical care.
Understanding the physiologic state
One of our goals in the cardiac operating room and ICU is to understand the haemodynamic response to our therapies and the trajectory of a patient relative to our management decisions. Let’s take the management of cardiac output as a good example and where variability in practice has been described.
Low cardiac output after paediatric cardiac surgery is commonly referred to nowadays as a “syndrome” for reasons that are not clear to me. A syndrome can be defined as a set of features and characteristics that appear together and characterise a disease or medical condition. Hypoplastic left heart is a syndrome. Trisomy 21 is a syndrome. I don’t believe that is the case with cardiac output, particularly as the low cardiac output “syndrome” is very poorly defined. As an example, in a recent Cochrane review of the prophylactic use of milrinone to prevent low cardiac output syndrome in children undergoing surgery for CHD by Burkhardt et al:Reference Burkhardt, Rucker and Stiller 1 they listed the various definitions used to define low cardiac output syndrome in the papers they reviewed for their analysis. These are shown in Table 1. There is no single defining set of characteristics and usually a number of different features are used to lump patients within the diagnostic category of this low cardiac output syndrome.
Table 1 Clinical characteristics that have been used to define low cardiac output syndrome, as adapted from Burkhardt et al.Reference Wernovsky, Wpij and Jonas 5

A number of studies have examined low cardiac output “syndrome” following paediatric cardiac surgery. Gaies et alReference Gaies, Pasquali and Donohue 2 recently reported on seminal postoperative complications following cardiac surgery and the relationship to mode of death. In their study of two centres (University of Michigan and Children’s Hospital of Philadelphia) over a 5-year period, they identified 191 patients who died (87% were neonates) and the seminal complications that contributed to downstream complications and mortality. The median time to a seminal complication was less than 2 hours and 73% of these seminal complications occurred within 24 hours. They noted that low cardiac output syndrome occurred at any time in 71% of their patients and as the initial sentinel event in 38% of the patients. Common definitions were used as defined in the PC4 dictionary, but of note, there is no unifying definition for low cardiac output syndrome and for the purposes of their study this was determined by consensus. Clearly, low cardiac output is an early problem seen following paediatric congenital cardiac surgery, and an early detection and intervention may improve outcomes.
This is not new information; low cardiac output following paediatric cardiac surgery has been known for many years. In 1959, Boyd et al from John Hopkins University published the first paper measuring cardiac output soon after intracardiac surgery with cardiopulmonary bypass in patients with CHD; none of these patients were newborns or infants as this was the very early days of cardiopulmonary bypass. Nevertheless, they measured cardiac output and mixed venous oxygen content and demonstrated a decrease that occurred some hours before clinical signs became evident.Reference Boyd, Tremblay, Spencer and Bahnson 3 A “sudden death syndrome” after cardiopulmonary bypass was described, and it was surmised that this was invariably preceded by a period of low cardiac output. Another study published in 1975 by Grant et al also characterised changes in cardiac index and mixed venous oxygen saturation in the immediate postoperative period, demonstrating that a low cardiac output occurred soon after completion of surgery with a threshold level of around 2 L/min/m2.Reference Grant, Parr, Blackstone and Kirklin 4 Perhaps the most well-documented evidence of low cardiac output after paediatric cardiac surgery was the study by Wernovsky et alReference Wernovsky, Wpij and Jonas 5 in the Boston Circulatory Arrest Study, published in 1995. Cardiac output was monitored in the immediate postoperative period by thermodilution. In 122 patients they demonstrated a fall in cardiac index up to 20% within the first 6–12 hours after surgery and this was associated with a rise in systemic vascular resistance and pulmonary vascular resistance. It is important to note that this appeared to be time limited and that within 24 hours of surgery, cardiac index had generally recovered to baseline and that the systemic vascular resistance and pulmonary vascular resistance had both fallen. It is also important to understand the era in which these studies were undertaken. In general, the bypass strategy was quite different 20 years ago with larger priming volumes in the cardiopulmonary bypass circuit, with low haematocrits and with faster cooling and rewarming times, and ultrafiltration was not routinely used; it is therefore hard to relate these findings to the current era. Over the past 20 years there have been considerable changes to the bypass circuits, haematocrit, temperature management, and myocardial protection, yet there has been no subsequent follow-up studies that demonstrate whether or not the decrease in cardiac index that was reported 20 years ago is still evident in our patient populations today.
A summary of currently used measures to assess cardiac output at the bedside and their correlation with objective measures is well described by Hoffman et al.Reference Hoffman, Ghanayem and Tweddell 6 A handful of studies have demonstrated that clinical examination may have a poor correlation with objective measures of cardiac output.Reference Tibby, Hatherill, Marsh and Murdoch 7 Hoffman et alReference Hoffman, Ghanayem and Tweddell 6 showed that routinely monitored physiologic signals in general also show poor correlation with measured cardiac output. There is a weak positive correlation with heart rate. Near infrared spectroscopy is a non-invasive method for measuring oxygen delivery to tissue beds, and may trend with changes in mixed venous oxygen saturation but particular threshold levels have varied. Serum lactate levels are used commonly as a marker for low cardiac output state but it must be remembered that it is the rate of change of lactate that is important as well as the absolute level,Reference Munoz, Laussen, Palacio, Zienko, Piercey and Wessel 8 and that it is a late marker. In other words, once the lactate level starts to rise, there has already been a period of inadequate oxygen delivery to the mitochondria. This level is also confounded by a well-described metabolic uncoupling, especially if patients are hyperglycaemic in the immediate postoperative period.Reference Palermo, Palac and Wald 9 Of all the biomarkers available, mixed venous oxygen saturation is probably the best index to correlate with cardiac output, although it is limited by intermittent sampling. The continuous measurement with oxymetric catheters as advocated by Hoffman et al is rarely undertaken in centres these days because of the potential complications associated with these catheters.
It is not surprising therefore that there is variability in our assessment and the measurement of cardiac output when there is no unifying definition and limited correlation with clinical indices. After all, cardiac output is determined by a complex relationship between cardiorespiratory interactions, interventricular interactions, and ventricular vascular coupling. It is determined by the interactions between end diastolic fibre length as the measure of preload, the elastance of the arterial circulation as the index of afterload, and the contractility of the myocardium or ventricular elastance.
Conundrum
If we can’t define the “syndrome”, let alone accurately measure it, how can we target a therapy to prevent or treat it? Indeed, it is my view that we should stop referring to low cardiac output as a “syndrome” but refer to it as a physiologic state. Low cardiac output in its simplest terms refers to the adequacy of oxygen delivery and utilisation to meet metabolic demand. As a physiologic “state” it is dynamic, subject to variability as all physiologic signals are, and has multiple inputs. Understanding this state is particularly important if we are to understand the modifiable risks associated with the care we deliver both in the operating room and the ICU. It is also possible to better understand this state by utilising continuous physiologic data and machine learning technique.
The promise of utilising big physiologic data
It is possible to utilise the data generated by continuous physiologic signals at the bedside to help us understand physiologic states and phenotypes in our patients following cardiac surgery. At the same time, it is important to also understand that using big physiologic data to determine these states will not replace the clinician at the bedside, rather it will augment our decision making, improve communication and information transfer, and to a large extent, level the playing field and reduce learning curves with respect to our experience and capability as clinicians.
We all know that there is a huge amount of data streaming from various monitors and devices at the bedside in our patients. This data are often described as being large in volume, variety, velocity, veracity, and is therefore vexing. If we describe data in these terms (“v’s”), then we subconsciously assign difficulty and uncertainty to the data. This should not be the case and our work in the Department of Critical Care Medicine at the Hospital for Sick Children has been focussed on changing this view of big data so that we can use continuous physiologic data to describe a physiologic state and predict events within that state. Our goal is to quantify “certainty” by ensuring reliable, robust, and relevant data capture.
A platform for using physiologic data
Before embarking on a programme to utilise continuous physiologic data, I think it is important that organisations have an understanding of what they are trying to achieve. At SickKids, we use the approach as outlined in Figure 2. We capture data streaming from all devices at the bedside and store this data permanently. Our view is that this is patient data, that it should be stored permanently rather than purged at certain intervals or for defined research protocols, and that at this point in time we cannot be assured that we know all the features or characteristics of a physiologic signal. Storing the data permanently allows for later use, although it creates problems related to data storage and access, which I will address below. Our view is that the data will be for clinical use, which is the case using the T3 platform (Etiometry LLC, Boston, Massachusetts, United States of America), that it will be used for research, and be available for sharing; and these data will be used for iterative modelling, which would then allow us to utilise this data real-time for online information and understanding of the trajectory of a patient, and ultimately for additional understanding and new knowledge about the care of a patient.
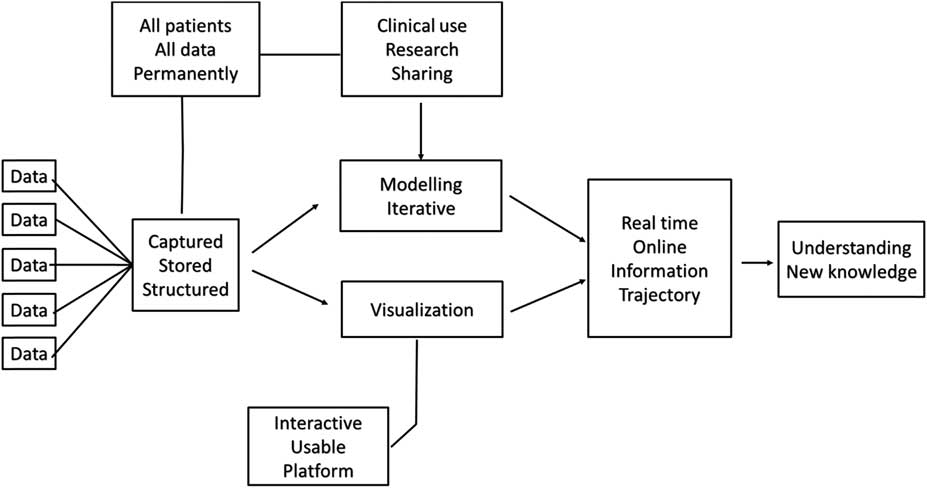
Figure 2 The approach taken to harnessing continuous physiologic data in the Department of Critical Care Medicine at The Hospital for Sick Children, Toronto.
Can we trust the data?
Being able to trust the data is critical. Ying Ling Lin et al undertook a study evaluating the barriers to the implementation of new technology (the T3 platform), and the utilisation of continuous physiologic data in critical care.Reference Lin, Guerguerian, Tomasi, Laussen and Trbovich 10 For nurses and respiratory therapists, the primary concern was around usability of a data science platform. For the physicians, however, the primary concern related to functionality of the data platform, such as what the data actually meant or whether data modelling provided new information beyond that they were otherwise already aware of.
Understanding the data journey is also key. The idealised state, perhaps one that monitoring companies would have us believe, is that data are somehow seamlessly captured at the bedside, transferred through a data pipeline into an analytic platform of neural networks for research and for clinical purposes. Practically, this is not as simple as it sounds.
Data in motion
In fact, we deal with data in motion, time series data. As a result, there are a number of bottlenecks from input through to output of this data (the data is I/O bound). Each of these bottlenecks needs to be understood and solved if we are to make sure that we have robust data available for analysis. These bottlenecks in data flow include:
-
∙ Data continuity: This starts with the correct association of the patient with the monitoring system. It includes the correct placement of various leads and sensors and the attention to detail to make sure that the signal being generated accurately reflects the system being measured. An example is the use of intra-arterial catheters and the potential for damping of the signal within the line if incorrectly managed or appreciated. At the Hospital for Sick Children, we are developing a system that enables us to look for data gaps and loss of continuity in a graphical format for each bed space. Knowing this information real-time then allows for any gaps in data or problems with continuity of data to be addressed at the point of care rather than trying to make assumptions later on during analysis, or worse, not having that data available for analysis at all.
-
∙ Data quality and labelling: Signal processing is important to derive the features of the signal, such as amplitude and frequency, but also the quality of the signal with respect to artefacts, phase shifting, or problems with time stamping. Another component is appropriate and real-time data labelling to facilitate supervised machine learning. An example is a patient with heart block being externally paced after surgery. It was noted by one of our data scientists that there were a group of patients who had no variability in their heart rate signals. Remember, that physiologic variability is normal; loss of variability may indicate an evolving disease state, and it is possible that recovery of variability indicates appropriate response to therapy. In this particular circumstance, we realised that the problem was not with the patient and the generation of the signal, rather that these patients were all receiving fixed atrial pacing for various reasons; if we lumped the data from these patients into an algorithm which used variability of heart rate as an output, then the algorithm would clearly be inaccurate. Being able to label this type of signal is critical for later analysis.
-
∙ Data architecture: This is key for any data storage platform to ensure the data are accessible and analysis ready. The data science team at the Hospital for Sick Children has developed an architecture that allows the continuous physiologic data to be highly compressed and indexed such that it is readily accessible for analysis. In our current development, we are processing over 200,000 bytes/second of physiologic data, which is around 55 terabytes/year of uncompressed data. Using our unique compression algorithms, we are able to compress this to 1/100 of the size, which immediately solves problems related to the storage of massive amounts of data over time. As important, the compression of the data and the indexing of the files facilitates rapid retrieval.
I would like to recognise the data science team in the Department of Critical Care Medicine at SickKids (see acknowledgements). This team is critical to the meaningful use of physiologic data and they are embedded directly within the daily life of our unit. They bring expertise in data architecture, computer programming and engineering, signal processing, and machine learning that allows us to make sense of all the data streaming from devices and monitors at the bedside. Moreover, this clinical engineering team has enabled us to move from describing data in terms of “v’s” to one that I refer to as “r’s”, i.e., reliability, robust and responsive, relational, and relevant. In other words, rather than thinking of this data in terms of quantifying uncertainty, we can now use it to quantify certainty. I think this is a very important concept, particularly if we are to trust the data.
Data analysis
Once the data has been obtained and you’ve ensured continuity, quality, and the architecture, the next step is to make sure that the data can be readily analysed. This involves developing specific application program interfaces to facilitate the analysis of the data using distributive computing networks. We are fortunate at the Hospital for Sick Children to partner with the Center for Computational Medicine at the Research Institute, which will enable us to undertake very detailed analyses in shorter time frames. I therefore believe we are getting closer to a model that resembles Google; our goal should be to have online analytics at the bedside whereby we ask a specific question about a patient or a patient population, and results are accessible almost immediately.
A number of centres are working on ways in which to utilise continuously streaming physiologic data to develop predictive algorithms. One of the first papers published around this work in paediatric cardiac critical care was by Rusin et al from Texas Children’s Hospital. They demonstrated a predictive algorithm of imminent deterioration by the real-time processing of physiologic data in a small number of patients after Stage I palliation for hypoplastic left heart syndrome.Reference Rusin, Acosta and Shekerdemian 11 The strength of their work demonstrates that changes in physiologic signals occurred earlier than were detected by the clinician at the bedside before the critical event.
Physiologic phenotype and personalised physiology
Part of our work to date at The Hospital for Sick Children has focussed on describing the physiologic phenotype, and in particular developing iterative targets or boundaries for physiologic signals. Currently, the “normal” range of a physiologic signal is derived from standard nomograms, although it’s important to appreciate that these have been developed from healthy children and may not apply at all to the patients we manage following cardiac surgery. We have examined the distributions of heart rate and systolic blood pressure on admission to the CCCU (Fig 3).Reference Eytan, Goodwin, Greer, Guerguerian and Laussen 12 In our subsequent work analysing over one billion data points (in press), the centiles and boundaries for heart rate and blood pressure according to diagnosis and time in the ICU have been developed. A new finding is that despite the wide range across a population of patients, individual patients within that population actually maintain a much tighter range for their heart rate and systolic blood pressure. We can therefore describe the boundaries for physiologic signals for a population of patients, and within that population, the target ranges for particular patients.

Figure 3 Centile curves for heart rate and systolic blood pressure for patients admitted to the ICU at The Hospital for Sick Children, Toronto.
The physiologic phenotype is clearly going to vary by age and weight, but also by diagnosis and procedure, the treatments we delivery, by clinician preference, and by time (i.e. postoperative day 1 versus subsequent days). It is important to understand therefore that the targets and boundaries for physiologic signals are dynamic and it should be possible to utilise population-based and individual data to know what the targets for a physiologic variable should be for any point in time. Indeed, this is a demonstration of personalised physiology.
Challenges in cardiac critical care
Two important challenges in cardiac critical care include:
-
∙ Being able to define our modifiable risk; in other words, what is the contribution of our management decisions to either harm or outcomes in patients that we care for. This is a potential target for improvement and could be facilitated by understanding the physiologic state of our patients.
-
∙ While “failure-to-rescue” is an important measure of systems and how we respond to an event, more important is perhaps our “failure-to-predict”. I contend this should be our primary metric of clinical performance, that is, being able to predict an evolving clinical state. To do so will only be augmented from the wise utilisation of big physiologic data.
To understand modifiable risk and have a low failure-to-predict, we need to understand the physiologic phenotype and state of our patients. Our current work we are undertaking in this regard is to define a state of inadequate oxygen delivery and to evaluate the coupling (or uncoupling) between systems such as cardiorespiratory interactions. The capture and utilisation of big physiologic data enables us to do this. The ultimate goal of collecting and structuring physiologic data for analysis is that we can create a physiologic databank that will be open source for shared learning. Thereby, we will leverage our expertise across critical care and really start to learn from our practices and from each other.
Acknowledgement
The author wishes to acknowledge the contributions to the work described in this presentation by the Data Science team in the department of Critical Care Medicine at the Hospital for Sick Children: Dr Mjaye Mazwi, MBChB, Dr Danny Eytan, MD, PhD, Andrew Goodwin, BE, Robert Greer, BE, Msc, Anirudh Thommandram, BE, MSc, Azadeh Assadi, HBSc, BScN, RN (EC), MN-NP (paediatrics), and Dr Sebastian Goodfellow, BE, PhD.
Conflicts of Interest
P.L. is the co-inventor of the T3 data platform, developed at Boston children’s Hospital and licensed to Etiometry LLC, Boston, Massachusetts, and for which he is eligible to a royalty payment from Boston Children’s Hospital.
Financial Support
Funding for some of the work described in this lecture was in part made possible through the David and Stacey Cynamon Chair in Critical Care Medicine.


