


1. Introduction
Physical erosion, climate change and tectonic deformation (rock uplift) in the Himalaya–Karakoram Mountains in SW Asia interplayed during the Cenozoic Era. The dominant forcing process may have varied over different timescales, but has not yet been determined (Thiede et al. Reference Thiede, Bookhagen, Arrowsmith, Sobel and Strecker2004, Reference Thiede, Arrowsmith, Bookhagen, Mcwilliams, Sobel and Strecker2005; Thiede & Ehlers, Reference Thiede and Ehlers2013; Clift, Reference Clift2017; Schildgen et al. Reference Schildgen, Van Der Beek, Sinclair and Thiede2018). SW Asia, which has experienced rapid tectonic uplift of mountain ranges, is an ideal place to investigate these intertwined processes. Strong surface erosion and rapid basin filling during the Cenozoic Era were thought to be closely associated with large-scale mountain uplift and the origin and evolution of the monsoon (Molnar et al. Reference Molnar, England and Martinod1993; Boos & Kuang, Reference Boos and Kuang2010; Clift et al. Reference Clift, Wan and Blusztajn2014; Botsyun et al. Reference Botsyun, Sepulchre, Donnadieu, Risi, Licht and Rugenstein2019; Valdes et al. Reference Valdes, Ding, Farnsworth, Spicer, Li and Su2019). In 2015, the International Ocean Discovery Program (IODP) Expedition 355 drilled two deep-sea cores in the Laxmi Basin in the east Arabian Sea in order to understand the interaction between Earth-surface processes and the evolution of the South Asian (summer) monsoon (SASM) (Pandey et al. 2015, Reference Pandey, Clift, Kulhanek, Pandey, Clift and Kulhanek2016a, b). Previous studies have demonstrated that SASM variations during late Cenozoic time played a key role in controlling surface erosion and exhumation at a tectonic timescale in mountain ranges in SW Asia (e.g. Thiede et al. Reference Thiede, Bookhagen, Arrowsmith, Sobel and Strecker2004, Reference Thiede, Arrowsmith, Bookhagen, Mcwilliams, Sobel and Strecker2005; Clift et al. Reference Clift, Giosan, Blusztajn, Campbell, Allen, Pringle, Tabrez, Danish, Rabbani and Alizai2008; Clift & VanLaningham, Reference Clift and Vanlaningham2010; Clift, Reference Clift2017). IODP Expedition 355 cores can therefore provide more evidence for understanding the interactions between tectonic uplift, monsoon evolution and physcial erosion in Asia.
Regarding the SASM evolution, early palaeo-oceanographic investigations suggested that intense upwelling, which is presently linked to the monsoon, began at c. 8.0 Ma in the Arabian Sea (Kroon et al. Reference Kroon, Steens, Troelstra, Prell, Niitsuma, Emeis, Al-Sulaiman, Al-Tobbah, Anderson, Barnes, Bilak, Bloemendal, Bray, Busch, Clemens, de Menocal, Debrabant, Hayashida, Hermelin, Jarrad, Krissek, Kroom, Murray, Nigrini, Pedersen, Ricken, Shimmield, Spaulding, Takayama, Haven and Weedon1991; Prell et al. Reference Prell, Murray, Clemens, Anderson, Duncan, Rea, Kidd, von Rad and Weissel1992), although more recently this appears to have begun after c. 13 Ma (Gupta et al. Reference Gupta, Yuvaraja, Prakasam, Clemens and Velu2015; Betzler et al. Reference Betzler, Eberli, Kroon, Wright, Swart, Nath, Alvarez-Zarikian, Alonso-García, Bialik, Blättler, Guo, Haffen, Horozal, Inoue, Jovane, Lanci, Laya, Mee, Lüdmann, Nakakuni, Niino, Petruny, Pratiwi, Reijmer, Reolid, Slagle, Sloss, Su, Yao and Young2016) or even earlier (Huber & Goldner, Reference Huber and Goldner2012; Roe et al. Reference Roe, Ding, Battisti, Molnar, Clark and Garzione2016). These proxy records and modelling studies indicate strengthened wind velocity rather than an increase in monsoon precipitation, which is very important in modulating environment in SW Asia (Clift, Reference Clift2017). Limited onshore work also supports an earlier, Palaeogene onset to the monsoon in East Asia (Licht et al. Reference Licht, Van Cappelle, Abels, Ladant, Trabucho-Alexandre, France-Lanord, Donnadieu, Vandenberghe, Rigaudier, Lécuyer, Terry, Adriaens, Boura, Guo, Soe, Quade, Dupont-Nivet and Jaeger2014; Lu et al. Reference Lu, Zhang, Wang, Zhao, Wang, Sun and Zhang2018). At a millennial timescale, it is well documented that the strengthened SASM intensity and increasing monsoon precipitation determined rates of surface erosion and deposition in river deltas such as the Indus River (Goodbred & Kuehl, Reference Goodbred and Kuehl2000; Clift et al. Reference Clift, Giosan, Blusztajn, Campbell, Allen, Pringle, Tabrez, Danish, Rabbani and Alizai2008, Reference Clift, Wan and Blusztajn2014, Reference Clift, Zhou, Stockli and Blusztajn2019). Moreover, enhanced monsoon precipitation has generally intensified surface erosion and led to increased sedimentation rates in the marginal seas around South Asia (Colin et al. Reference Colin, Turpin, Bertaux, Desprairies and Kissel1999; Thiede et al. Reference Thiede, Bookhagen, Arrowsmith, Sobel and Strecker2004, Reference Thiede, Arrowsmith, Bookhagen, Mcwilliams, Sobel and Strecker2005; Blöthe et al. Reference Blöthe, Munack, Korup, Fülling, Garzanti, Resentini and Kubik2014; Clift et al. Reference Clift, Wan and Blusztajn2014). Sediments eroded by glaciers were then reworked to the ocean and resulted in a higher sediment accumulation rate when the summer monsoon rainfall was strong during interglacial times (Molnar, Reference Molnar2001; Jonell et al. Reference Jonell, Carter, Böning, Pahnke and Clift2017). On a large spatial scale, the glacial–interglacial climate alternations might have strengthened physical erosion under imbalanced conditions of runoff, vegetation and flooding (Zhang et al. Reference Zhang, Molnar and Downs2001; Lu et al. Reference Lu, Wang, An, Miao, Zhu, Ma, Li, Tan and Wang2004, Reference Lu, Chang, Guo and Zhang2015); however, the quantitative evaluation and specific forcing mechanism of weathering intensity, surface erosion and sediment production since late Pliocene time needs to be investigated (Thiede et al. Reference Thiede, Bookhagen, Arrowsmith, Sobel and Strecker2004, Reference Thiede, Arrowsmith, Bookhagen, Mcwilliams, Sobel and Strecker2005; Thiede & Ehlers, Reference Thiede and Ehlers2013; Schildgen et al. Reference Schildgen, Van Der Beek, Sinclair and Thiede2018).
The large difference in elevation between the western Himalaya, Karakoram and associated mountain ranges and the deep-sea basins of the Arabian Sea and Bay of Bengal makes South Asia ideal for investigating climate–tectonic–erosion interactions, under the forcing of the SASM precipitation variations, during the late Cenozoic Era. The deep-sea cores drilled during IODP Expedition 355 provide a good opportunity to examine these relationships and forcing mechanisms over a number of glacial–interglacial cycles and the longer (tectonic) timescale (Li et al. Reference Li, Clift, Böning, Blusztajn, Murray, Ireland, Pahnke and Giosan2018, Reference Li, Clift and O’Sullivan2019; Yu et al. Reference Yu, Colin, Wan, Saraswat, Song, Xu, Clift, Lu, Lyle, Kulhanek, Hahn, Tiwari, Mishra, Miska and Kumar2019; Clift et al. Reference Clift, Zhou, Stockli and Blusztajn2019). Samples were collected from IODP Hole U1456A in this study. This core recovered a length of 365.25 m and has been dated by biostratigraphic and magnetostratigraphic methods (Pandey et al. Reference Pandey, Clift, Kulhanek, Pandey, Clift and Kulhanek2016a, b). Over 908 samples were obtained covering the late Pliocene (c. 3.4 Ma) to late Pleistocene (c. 0.1 Ma) period; each sample spans on average 3.6 ka. Multiple proxies including grain size distribution, hematite content, uranium (U) and lead (Pb) dating of zircon, and bulk sediment neodymium (Nd) and strontium (Sr) isotopes are described in order to reconstruct and examine the relationship between erosion and monsoon rainfall since late Pliocene time at the tectonic timescale and glacial–interglacial alternations, and to isolate the associated forcing mechanism. Our study also allows us to investigate the interplay between climatic change, surface erosion and tectonic deformation.
2. Materials and methods
2.a. Sampling and dating Hole U1456A
IODP Hole U1456A (latitude, 16° 37.2855′ N; longitude, 68° 50.3272′ E; water depth, 3639.23 m; cored interval, 426.60 m; recovered length, 365.25 m; Fig. 1a) lies offshore the western margin of India, c. 475 km from the Indian coast and c. 820 km from the modern mouth of the Indus River. Based on earlier provenance work, the latter is presumed to be the primary source of sediment in the drilling site, with lesser input from rivers such as the Tapti and Narmada that originate from the Indian Peninsula (Clift et al. Reference Clift, Zhou, Stockli and Blusztajn2019) (Fig. 1a; see Discussion). The studied deposits are predominantly composed of sand, silt and clay, interpreted as turbidites interbedded with biogenic carbonate (nannofossil ooze or chalk, nannofossil-rich clay or claystone) and hemipelagic muds (Fig. 2; Pandey et al. Reference Pandey, Clift, Kulhanek, Andò, Bendle, Bratenkov, Griffith, Gurumurthy, Hahn, Iwai, Khim, Kumar, Kumar, Liddy, Lu, Lyle, Mishra, Radhakrishna, Routledge, Saraswat, Saxena, Scardia, Sharma, Singh, Steinke, Suzuki, Tauxe, Tiwari, Xu, Yu, Pandey, Clift and Kulhanek2016b). A relative reduction in siliciclastic sediment content occurred at c. 100 m below the seafloor (mbsf) (Fig. 2), which might represent a time of reduced Indus discharge. However, this could equally reflect higher sea levels sequestering sediment on the shelf, avulsion of the fan depositional lobes away from the Laxmi Basin into the Arabian Basin, or a bloom in biogenic productivity offshore western India, diluting the clastic flux (Pandey et al. Reference Pandey, Clift, Kulhanek, Andò, Bendle, Bratenkov, Griffith, Gurumurthy, Hahn, Iwai, Khim, Kumar, Kumar, Liddy, Lu, Lyle, Mishra, Radhakrishna, Routledge, Saraswat, Saxena, Scardia, Sharma, Singh, Steinke, Suzuki, Tauxe, Tiwari, Xu, Yu, Pandey, Clift and Kulhanek2016b). The 365.25 m core was subsequently sampled at an interval of 40 cm, resulting in 908 samples obtained for grain size distribution and diffuse reflectance spectroscope (DRS) analyses. Eight samples were picked from interglacial-era deposits, four samples were selected from glacial sediment on the basis of stable oxygen isotope analysis for Sr and Nd isotopic analyses, and eight samples were collected throughout Hole U1456A for detrital zircon U–Pb dating analysis (Fig. 2).
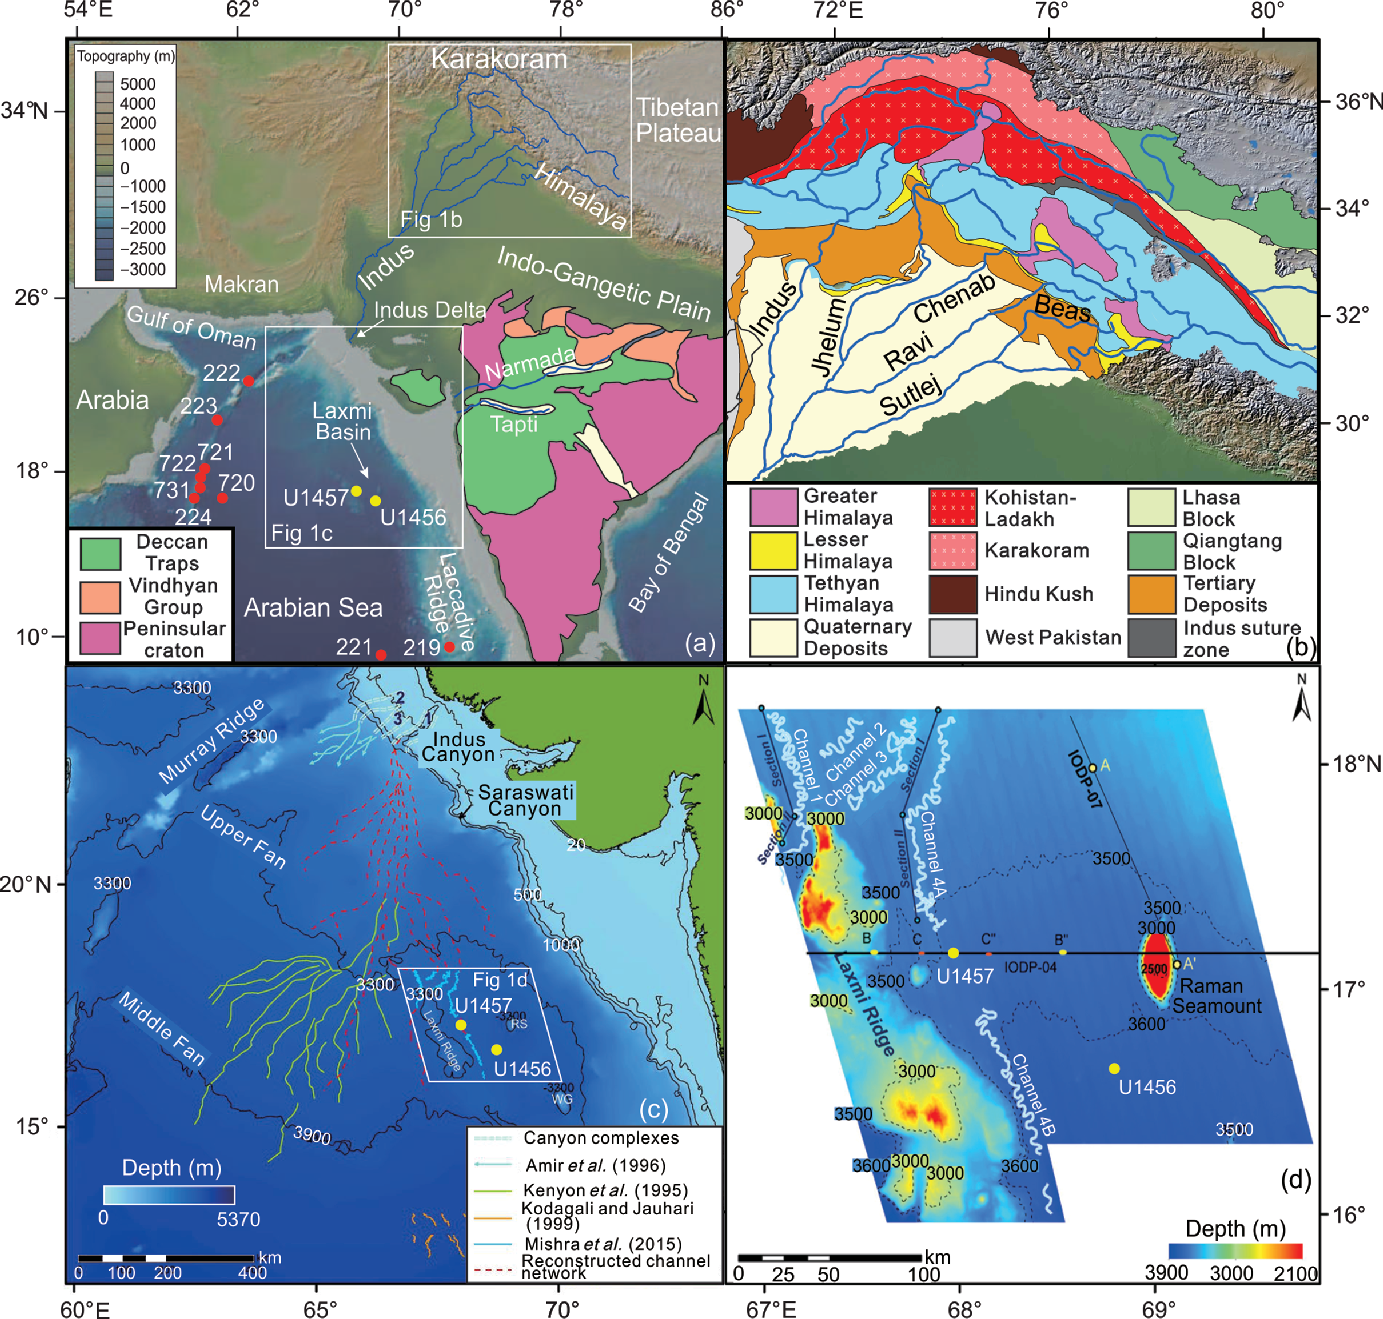
Fig. 1. Watershed of Indus River, sediment sources, IODP Expedition 355 Hole U1456A and Indus channel system at Laxmi Basin, east Arabian Sea. (a) Shaded relief of South Asia with tectonics blocks in Indian Peninsula (revised from Pandey et al. Reference Pandey, Clift, Kulhanek, Andò, Bendle, Bratenkov, Griffith, Gurumurthy, Hahn, Iwai, Khim, Kumar, Kumar, Liddy, Lu, Lyle, Mishra, Radhakrishna, Routledge, Saraswat, Saxena, Scardia, Sharma, Singh, Steinke, Suzuki, Tauxe, Tiwari, Xu and Yu2015, fig. F1). Red dots indicate previous IODP drilled sites, and yellow dots represent the IODP 355 drilled sites. (b) Tectonic blocks within the Indus River drainage basin, based on IGMA5000 (Ren, Reference Ren2013) and Yin (Reference Yin2006). (c) Indus channel system from global bathymetry data (revised from Mishra et al. Reference Mishra, Pandey, Ramesh and Clift2016, fig. 1b). (d) Bathymetry map of the study area showing submarine channels (revised from Mishra et al. Reference Mishra, Pandey, Ramesh and Clift2016, fig. 2a).

A high-resolution age model for this depositional sequence was constructed by linear interpolation between 23 independent age control points; these ages were obtained from biostratigraphy and magnetostratigraphic constraints (Pandey et al. Reference Pandey, Clift, Kulhanek, Pandey, Clift and Kulhanek2016a, b), resulting in a precise timescale (Table 1, Fig. 2). The time series has an average time resolution of 3.6 ka, which is large enough to investigate the glacial–interglacial variations of monsoon, surface erosion and sediment sources. Samples used for Sr–Nd isotopic composition analysis and zircon dating are listed in Table 2.
Table 1. Age control points from the biostratigraphy and palaeomagnetic stratigraphy data from Hole U1456A deposit sequence in east Arabian Sea (Pandey et al. Reference Pandey, Clift, Kulhanek, Pandey, Clift and Kulhanek2016a, b)

Table 2. Samples analysed for Sr–Nd isotopic composition and zircon particle dating

2.b. Hematite content estimated by diffuse reflectance spectroscopy
Hematite is derived from ferrihydrite through dehydration and crystallization during weathering of iron-containing minerals and rocks (Deaton & Balsam, Reference Deaton and Balsam1991), and is preferentially preserved under a warm and dry climate with oxidizing conditions. Chemical weathering and iron oxide formation were controlled by both temperature and precipitation. Because temperature remains relatively stable in subtropical SW Asia, variations of hematite contents were expected to be regulated mostly by precipitation changes over a temperature threshold (Ji et al. Reference Ji, Balsam, Chen and Liu2002; Ji, Reference Ji2004; Long et al. Reference Long, Mcquarrie, Tobgay and Grujic2011). Hematite content can therefore be regarded as an indicator of warm and dry climate in SW Asia.
DRS is a rapid, precise and well-established method for measuring the hematite content of sediments and/or soils, and is commonly used in both qualitative and quantitative analyses of deep-sea sediments, mineral dust deposits and soils. The obtained spectra are especially sensitive to Fe oxides and oxyhydroxides in soils and sediments (Deaton & Balsam, Reference Deaton and Balsam1991; Ji et al. Reference Ji, Balsam, Chen and Liu2002), and the detection limit can be as low as 0.01 wt% (Balsam & Deaton, Reference Balsam and Deaton1996). As a primary Fe oxide, hematite exhibits peaks at 565 or 575 nm in the visible (400–700 nm) diffuse reflectance spectra, which have been used as the typical spectra for determining absolute concentration of hematite (Deaton & Balsam, Reference Deaton and Balsam1991; Ji et al. Reference Ji, Balsam, Chen and Liu2002).
The determination of hematite using DRS is mainly based on first and/or second derivatives of the reflectance spectrum (Deaton & Balsam, Reference Deaton and Balsam1991; Scheinost, Reference Scheinost1998). However, many studies noticed that sample reflectance can be affected by other admixed minerals (referred to as the ‘matrix effect’), which impeded the quantitative estimate of Fe oxides. Ji et al. (Reference Ji, Balsam, Chen and Liu2002) introduced a calibration technique based on a series of experiments where a batch of natural samples from Hole U1456A were processed by totally removing iron oxides before adding hematite to a known concentration. A transfer function can be derived using a linear regression for determining hematite content. This method has proven to be effective in removing the matrix effect and has been used to obtain more precise concentrations of hematite in South China Sea sediments (Zhang et al. Reference Zhang, Ji, Balsam, Liu and Chen2007), providing important information on regional climate change.
Here we apply this method to sediments from Hole U1456A. The sample preparation, analysis and data processing were performed at Nanjing University. All the dried samples were first ground in an agate mortar to a particle diameter of less than 30 µm. We selected 19 samples for the calibration. For these calibration samples, iron oxides were removed by citrate–bicarbonate–dithionite (CBD) reagent (Mehra & Jackson, Reference Mehra and Jackson1960) and the resulting residues provided a natural matrix material. Subsequently, known quantities of pigment-grade hematite were added to the matrix material to produce calibration standards. The hematite pigment used was standard Pfizer R1599 (Ji et al. Reference Ji, Balsam, Chen and Liu2002).
Reflectance spectra were analysed for 19 calibration samples and 908 actual samples from Site U1456A using a Perkin–Elmer Lambda 900 spectrophotometer (Perkin-Elmer Corporation, Norwalk, CT) with a diffuse reflectance attachment from 400 to 700 nm at 2 nm intervals. Reflectance data were processed to obtain percent reflectance in standard colour bands (Judd & Wyszecki, Reference Judd and Wyszecki1975), that is: violet, 400–450 nm; blue, 450–490 nm; green, 490–560 nm; yellow, 560–590 nm; orange, 590–630 nm; and red, 630–700 nm. Percent reflectance in the standard colour bands was calculated by dividing the percentage of reflectance in each colour band accordingly. Total reflectance of a sample or brightness was calculated by summing the reflectance value of a sample from 400 to 700 nm. For the calibration samples, a multiple linear regression model was built using the Statistical Product and Service Solutions (SPSS) program (http://www.ndtimes.com.cn/news/162.html) to relate independent variables (percent reflectance (%) in standard colour bands) to dependent variables (the known component values (wt%) of added hematite). The transfer function is defined: hematite (wt%) = 4.203 – [0.271 ×green (%)] + [0.167 × orange (%)] (coefficient of determination, R 2 = 0.886). When we plot estimated hematite contents against the actual iron oxide concentration mixed into the calibration samples (Fig. 3), R 2 is 0.95 with a root mean square of error (RMSE) of 0.0301, where hematite concentration is within the range 0–0.25 wt%. The transfer function is therefore robust in providing reliable estimates of hematite in our sediments.

Fig. 3. Comparison between iron oxide content in the prepared samples with the predicted iron oxide content calculated according to the transfer function.
2.c. Zircon U–Pb dating and Sr–Nd isotopic composition analysis
Zircon U–Pb dating and Sr–Nd isotopic compositions are regarded as two of the best approaches for determining sediment provenance (Chen et al. Reference Chen, Li, Yang, Rao, Lu, Balsam, Sun and Ji2007; Clift et al. Reference Clift, Giosan, Blusztajn, Campbell, Allen, Pringle, Tabrez, Danish, Rabbani and Alizai2008; Zhang et al. Reference Zhang, Lu, Xu, Liu, Yang, Stevens, Bird, Xu, Zhang, Lei and Feng2016, Reference Zhang, Lu, Stevens, Feng, Fu, Geng and Wang2018). Because there are large differences in typical zircon U–Pb ages as well as in Sr–Nd isotopic compositions (DeCelles et al. Reference DeCelles, Gehrels, Quade, Lareau and Spurlin2000; Clift et al. Reference Clift, Lee, Hildebrand, Shimizu, Layne, Blusztajn, Blum, Garzanti and Khan2002, Reference Clift, Zhou, Stockli and Blusztajn2019; Alizai et al. Reference Alizai, Carter, Clift, Vanlaningham, Williams and Kumar2011) in tectonic blocks in South Asia, we can distinguish between the different sources in the eastern Arabian Sea deposits using these methods. We selected eight samples for zircon dating and 12 samples for Sr–Nd isotopic composition at Nanjing University. However, Sr isotopic composition is liable to change as a result of fractionation during chemical weathering (Derry & France-Lanord, Reference Derry and France-Lanord1996), and shows some dependency on grain size (Meyer et al. Reference Meyer, Davies and Stuut2011). Nd isotopes are stable during erosion and chemical weathering (Goldstein et al. Reference Goldstein, O’Nions and Hamilton1984), but are known to be moderately dependent on grain size variations in the Indus Basin (Jonell et al. Reference Jonell, Li, Blusztajn, Giosan and Clift2018).
2.c.1. Zircon U–Pb dating
For each sample, standard water and magnetic separations were first used to extract heavy and non-magnetic minerals, from which more than 200 zircon grains were randomly picked using a microscope to ensure statistical adequacy (Andersen, Reference Andersen2005; Zhang et al. Reference Zhang, Lu, Xu, Liu, Yang, Stevens, Bird, Xu, Zhang, Lei and Feng2016, Reference Zhang, Lu, Stevens, Feng, Fu, Geng and Wang2018). The zircon grains were then mounted in epoxy resin and polished for dating. All pre-treatments were performed by the same individual to make any artificial preference bias uniform.
The samples were measured using an Agilent 7700× inductively coupled plasma mass spectrometer (ICP-MS) with a New Wave 193-nm laser ablation system at Nanjing University. The laser beam diameter was 30 µm with a 10 Hz repetition rate (Zhang et al. Reference Zhang, Lu, Xu, Liu, Yang, Stevens, Bird, Xu, Zhang, Lei and Feng2016, Reference Zhang, Lu, Stevens, Feng, Fu, Geng and Wang2018). Zircon 91500 was used as an external standard for isotopic fractionation correction, while NIST 610 (Pearce et al. Reference Pearce, Perkins, Westgate, Gorton, Jackson, Neal and Chenery1997) was used as the standard for normalizing unknown U, Th and Pb content. Glitter 4.4.2 was used to process the raw ICP-MS data. Common Pb was corrected following the methods of Andersen (Reference Andersen2002). We accept zircon ages that follow Andersen (Reference Andersen2002), that is: (1) individual zircon discordance values are < 15%, which agrees with the concordant ages from published data of potential sources; and (2) 206Pb/238U ages (or 207Pb/206Pb ages for older grains) for zircon grains are < 1000 Ma. Most of the zircon samples measured in this study do not have the 110 minimum particles required by Vermeesch (Reference Vermeesch2004), because at the fine grain size of these samples there were not enough particles large enough to date. We use the data as an approximate estimate of the sediment sources.
2.c.2. Sr–Nd isotopic composition analysis
The samples (c. 2 g) were first dissolved in 0.5 mol L–1 acetic acids for 24 hours followed by 5% hydrogen peroxide for 24 hours to remove carbonates and organic matter, respectively. The remaining silicate fractions (c. 0.1 g) were digested in a mixture of HNO3 and HF for 36 hours in tightly closed teflon vials at 115°C (Zhang et al. Reference Zhang, Chen and Li2015). The digested solution was then loaded into ion-exchange columns to separate Sr and Nd elements using Sr-Spec, Ln-Spec and Tru-Spec resins (Aciego et al. Reference Aciego, Bourdon, Lupker and Rickli2009). The determination of Sr and Nd isotopes were performed by a Neptune plus multi-collector ICP-MS at Nanjing University.
The instrumental mass biases for Sr and Nd isotopes were corrected by normalizing the 86Sr/88Sr ratio to 0.1194 and the 146Nd/144Nd ratio to 0.7219, respectively. The Sr standard SRM987 and Nd standard JMCNd2O3 were periodically measured to check the reproducibility and accuracy of isotopic analyses with mean 87Sr/86Sr ratio of 0.710239 ± 42 (2σ, n = 10) and mean 143Nd/144Nd ratio of 0.512099 ± 15 (2σ, n = 15), respectively. The standard material BCR-2 was used to verify the chemical procedure. Measurements of 10 replicates yielded a mean 87Sr/86Sr value of 0.705018 ± 20 (2σ, n = 10) and a mean 143Nd/144Nd value of 0.512626 ± 15 (2σ, n = 10). Epsilon Nd (εNd) values were calculated using chondritic values of 143Nd/144Nd = 0.512638.
3. Results
The results of zircon U-Pb ages (Fig. 4), DRS, hematite content estimation and grain size (Figs 5–7), as well as Sr–Nd isotopic composition (Table 3, Fig. 8), are presented. The distributions of zircon U–Pb ages for all the samples are similar through time, with most ages distributed between 0–200 Ma and 300–1000 Ma (Fig. 4). εNd values range between −12.8 and −8.7 and 86Sr/87Sr varies between 0.727230 and 0.713162 (Table 3, Fig. 8). Grain size is highly variable over the range 5.9–190.8 μm, with an average mean value of 36.0 μm (Fig. 5) (Liu et al. Reference Liu, Lu, Wang, Yu, Xu, Feng and Hu2018). The hematite content varied over 0.00–0.59% with an average of 0.27% (Fig. 5), and was coupled with grain size over glacial–interglacial cycles and the longer timescale, in particular during c. 1.8–1.1 Ma (Fig. 6). Both hematite content and grain size show a three-step evolution, comprising phases of 3.4–2.4 Ma, 1.8–1.1 Ma and 1.1–0.1 Ma (Figs 5–7).

Fig. 4. Kernel density estimates for U–Pb zircon age distributions of samples from U1456A (orange) in this study and potential sources (see online Supplementary Table S1, available at http://journals.cambridge.org/geo), compared with samples from previous studies (violet) including Indus River mouth (Clift et al. Reference Clift, Giosan, Blusztajn, Campbell, Allen, Pringle, Tabrez, Danish, Rabbani and Alizai2008), IODP 355 (Clift et al. Reference Clift, Zhou, Stockli and Blusztajn2019) and Indus Submarine Canyon (Li et al. Reference Li, Clift, Böning, Blusztajn, Murray, Ireland, Pahnke and Giosan2018). Peak ages are shown at the top (Ma).

Fig. 5. (a) Grain size, (b) hematite content and (c) DRS variations from Hole U1456A deposit sequence since late Pliocene time (c. 3.4 Ma).

Fig. 6. (a) Grain size and (b) hematite content for Hole U1456A deposit sequence, and (c) global ice volume and temperature (Lisiecki & Raymo, Reference Lisiecki and Raymo2005) during 1.8–1.1 Ma.

Fig. 7. (a) Grain size, (b) hematite content, (c) global ice volume and temperature (Lisiecki & Raymo, Reference Lisiecki and Raymo2005), (d) Nd and (e) Sr isotopic composition variations for Hole U1456A deposition sequence during 1.1–0.3 Ma.
Table 3. Sr–Nd isotopic compositions of samples from Hole U1456A

a εNd values calculated using chondritic values of 143Nd/144Nd = 0.512638; εNd = [(143Nd/144Nd−0.512638) /0.512638] × 10000.

Fig. 8. Sr–Nd isotopic composition of selected samples from Hole U1456A (white stars) and potential sediment sources in SW Asia.
4. Discussion
4.a. Provenance of deposits and implication for erosion
The identification of NW–SE-aligned deep-sea channel systems in Laxmi Basin supports the idea that most deposits in the basin were supplied from the Indus drainage basin (Fig. 1c) (Mishra et al. Reference Mishra, Pandey, Ramesh and Clift2016; Pandey et al. Reference Pandey, Clift, Kulhanek, Pandey, Clift and Kulhanek2016a; Clift et al. Reference Clift, Zhou, Stockli and Blusztajn2019; Yu et al. Reference Yu, Colin, Wan, Saraswat, Song, Xu, Clift, Lu, Lyle, Kulhanek, Hahn, Tiwari, Mishra, Miska and Kumar2019). Five main tectonic blocks – Greater Himalaya, Tethyan Himalaya, Lesser Himalaya, Karakoram and Karakoram–Kohistan–Ladakh (KKL) (Fig. 1b) – characterize sediment composition in the Indus River drainage basin. Each block has a different provenance proxy character. The zircon age distribution and Sr–Nd isotopic composition of these blocks are presented in Figures 4, 8 and 9. The Himalayan blocks (including the Greater Himalaya, Tethyan Himalaya and Lesser Himalaya) have much more radiogenic εNd and 87Sr/86Sr values, and older zircon ages (mainly > 300 Ma, with 520–600, 800–1000, c. 1600–1800 and c. 2500 Ma peaks for Himalaya sedimentary and metamorphic rocks and c. 290, c. 450 and c. 800 Ma for Himalayan granites; Fig. 4). In contrast, the KKL, which is located within the Eurasian Plate, has less radiogenic εNd and 87Sr/86Sr values and younger zircon ages, mostly < 200 Ma (Figs 4, 8). The zircon age distribution of Hole U1456A sediments is characterized by peaks of < 200, c. 450, c. 800, 1600–1800 and c. 2500, suggesting mixed sediment sources from at least two end-members from both the KKL and the Greater, Tethyan and Lesser Himalaya (Figs 4, 9). The εNd and 87Sr/86Sr values of sediments at Hole U1456A fall roughly in the middle between the bedrocks of the Himalaya (mainly the Greater and Tethyan Himalaya) and the KKL (Fig. 8), in agreement with our interpretations for the zircon data (Figs 4, 9).

Fig. 9. Multidimensional scaling map based on calculated Kolmogorov–Smirnov test between U–Pb age spectra, showing samples of U1456A in this study compared with samples from previous studies, including Indus River mouth (Clift et al. Reference Clift, Giosan, Blusztajn, Campbell, Allen, Pringle, Tabrez, Danish, Rabbani and Alizai2008), IODP Expedition 355 (Clift et al. Reference Clift, Zhou, Stockli and Blusztajn2019) and Indus Submarine Canyon (Li et al. Reference Li, Clift, Böning, Blusztajn, Murray, Ireland, Pahnke and Giosan2018). Samples and sources with similar U–Pb age distributions are plotted closer together.
The other potential sediment sources for deposits in Laxmi Basin were the Indian Peninsula (including the Deccan Traps, Vindhyan Group and the Peninsular Craton; Fig. 1a) and eolian dust from the Arabian Peninsula. However, we argue that these sources were not the major contributions to sediments in Laxmi Basin for the following reasons.
First, some of the zircon age peaks (c. 1150 Ma in the Vindhyan Group and > 3000 Ma in the Peninsular Craton; Fig. 4) of the tectonic blocks in the Indian Peninsula are not prominent in sediments at Hole U1456A, precluding their major contribution to the Laxmi Basin. The Deccan Traps are characterized by c. 65 Ma zircon ages (Fig. 4) and have much lower radiogenic εNd and 87Sr/86Sr values than Hole U1456A sediments (Fig. 8). The Deccan Traps are not a major provenance candidate for the sands at Hole U1456A, but could have supplied some of the finer-grained material (Clift et al. Reference Clift, Zhou, Stockli and Blusztajn2019; Yu et al. Reference Yu, Colin, Wan, Saraswat, Song, Xu, Clift, Lu, Lyle, Kulhanek, Hahn, Tiwari, Mishra, Miska and Kumar2019). Arabian dust has similar zircon age distributions to Hole U1456A deposits (Fig. 4), but is characterized by a wide range of 87Sr/86Sr values and less radiogenic εNd values, meaning it is dissimilar to the U1456A deposits (Figs 8, 9).
Second, no active deep-sea channel system has yet been identified along the western margin of the Indian Peninsula (Fig. 1c, d; Mishra et al. Reference Mishra, Pandey, Ramesh and Clift2016), suggesting that the rivers from the Indian Peninsula do not transport large volumes of coarse-grained sediments as far as the Laxmi Basin. This is probably because the extremely broad shelf on the western continental margin of the Indian Peninsula buffers river-transported sediments (Fig. 1a), although deposition of fine-grained sediment from hypopycnal plumes is still possible.
Third, the Tapti and Narmada rivers draining the Indian Peninsula contribute more sediments to the Arabian Sea than the Indus River at present (Khim et al. Reference Khim, Horikawa, Asahara, Kim and Ikehara2019), but the reduction of the Indus River contribution could be caused by human activity such as building dams along the Indus River (Mahar & Zaigham, Reference Mahar and Zaigham2014). The damming is quite recent and had no impact on the sediment input to the Arabian Sea in the geological past.
The abovementioned points suggest that the sediments at Hole U1456A were mainly derived by erosion from the Himalaya–Karakoram Mountains via the Indus River. There were contributions from the Arabian Peninsula and the Indian Peninsula, but these were not the dominant sources (Figs 4, 8).
4.b. Changes of sediment provenance during glacial–interglacial cycles
The surface sediments eroded from the Himalaya–Karakoram Mountains could not be instantaneously deposited in the deep Arabian Sea because of the long-distance transport from source to sink, during which sediment recycling and mixing would occur. It is possible that most of the sediments were stored on the continental shelf for a long time and that the fan deposits must therefore have lagged the erosion processes onshore (Covault et al. Reference Covault, Craddock, Romans, Fildani and Gosai2013). In the Holocene Indus canyon, the lag time for fine-grained Holocene sediment between the canyon and the river mouth was < 10 ka (Li et al. Reference Li, Clift, Böning, Blusztajn, Murray, Ireland, Pahnke and Giosan2018). Holocene sediments in Indus Canyon isotopically resemble deposits in the Indus River mouth since c. 8 ka. However, fine sediment only reached the canyon and not the upper fan during the Holocene period, and would be expected to be redeposited when sea level fell during the following glaciations, possibly after c. 100 ka. In addition, sand in the canyon is not similar to that from the river mouth in terms of zircon U–Pb ages, suggesting that sand is stored near the river mouth and is only reworked into the fan during sea-level lowstands, potentially on timescales of 100 ka (Li et al. Reference Li, Clift and O’Sullivan2019).
The other recycling scenario is one in which turbidite flow was episodic and transport of sediments was accompanied by mixing older and younger deposits. However, the turbidite events in the Indus deep-sea fan are estimated to have occurred every c. 5–10 ka during the past 100 ka (Bourget et al. Reference Bourget, Zaragosi, Rodriguez, Fournier, Garlan and Chamot-Rooke2013). The turbidite events in the sub-basin analysed by Bourget et al. (Reference Bourget, Zaragosi, Rodriguez, Fournier, Garlan and Chamot-Rooke2013) occurred much less frequently than those of glacial–interglacial alternations (100–400 ka), although coring suggests that much of the upper fan has been inactive since 11 ka (Prins et al. Reference Prins, Postma, Cleveringa, Cramp and Kenyon2000). More frequent turbidites on the lower fan, such as those dated by Bourget et al. (Reference Bourget, Zaragosi, Rodriguez, Fournier, Garlan and Chamot-Rooke2013), cannot be sourced from the Indus Canyon or River. Sediment recycling and mixing processes could have resulted in mixed sediment spanning glacial or interglacial phases.
Our results show small source shifts at the glacial–interglacial alternations, demonstrated by the Nd–Sr isotopic composition (Table 3, Fig. 7). The range of compositions lies within those noted by Yu et al. (Reference Yu, Colin, Wan, Saraswat, Song, Xu, Clift, Lu, Lyle, Kulhanek, Hahn, Tiwari, Mishra, Miska and Kumar2019), and closer to the interglacial end-member composition of the Indus River noted by Li et al. (Reference Li, Clift, Böning, Blusztajn, Murray, Ireland, Pahnke and Giosan2018). Given that no major tectonic deformation occurred over such short periods, and no drainage system reorganization occurred (Clift, Reference Clift2017), the variations may not be interpreted by tectonic forcing. A possible reason for the changing sediment sources may be the migration of the maximum monsoon rainfall belt, associated with global temperature and the glacial–interglacial cycles, and documented to have forced a shift in sediment source since the Last Glacial Maximum (Clift et al. Reference Clift, Giosan, Blusztajn, Campbell, Allen, Pringle, Tabrez, Danish, Rabbani and Alizai2008). The samples with the most negative εNd values are interpreted to be dominated by erosion from the Himalayan ranges. This probably occurred during interglacial periods when the monsoon rainfall is focused in the Lesser Himalaya, so that relatively less sediment is derived from the KKL region (Fig. 1a). During glacial times it seems erosion is more dominated by the Karakoram; εNd values are higher in this case, which may be caused by the monsoon rainfall belt and the migrations of westerlies (Clift et al. Reference Clift, Zhou, Stockli and Blusztajn2019), but further investigation is required.
4.c. SASM precipitation variations at tectonic timescales from late Pliocene time
The SASM variation at glacial–interglacial timescales has been well documented (Prell & Kutzbach, Reference Prell and Kutzbach1987; Clemens & Oglesby, Reference Clemens and Oglesby1992; Gupta et al. Reference Gupta, Das and Anderson2005; Clemens et al. Reference Clemens, Prell and Sun2010). Insolation, global ice volume (global temperature), sea level and Southern Hemisphere atmospheric circulation have been hypothesized to force monsoon variations. However, the debate concerning monsoon variations in terms of both timing and intensity continues. At longer timescales (longer than orbital timescales), the relationship between climate, erosion and tectonics is not clear because of a lack of high-resolution records of these processes. Here, we use hematite content and grain size as indicators of regional aridity and deep-sea depositional environment (Figs 5–7) that were associated with the SASM at the orbital timescale. Hematite (α-Fe2O3) favours a dry and warm climate (Ji, Reference Ji2004). Moreover, sediment particles transported from the Indus River might be expected to be coarser grained during times of greater runoff, although this is stored near the river mouth and does not reach the deep sea during the interglacial highstands (Li et al. Reference Li, Clift and O’Sullivan2019). However, sediment budgets for the last deglacial period indicate that the vast majority of sediments reaching the ocean were stored in delta and shelf clinoforms (Clift & Giosan, Reference Clift and Giosan2014). This implies that the large-scale redeposition into deeper water occurred during sea-level lowstands when the climate was cold (Prins et al. Reference Prins, Postma, Cleveringa, Cramp and Kenyon2000). The Holocene carbonate drape found over much of the upper fan (Kolla et al. Reference Kolla, Ray and Kostecki1981) was consistent with this and indicated that sedimentation on the deep-sea fan, including the Laxmi Basin, is at least partly controlled by sea level. It is well established that global temperature, sea level and monsoon precipitation vary synchronously with glacial–interglacial cycles in South Asia (Wang et al. Reference Wang, Wang, Cheng, Fasullo, Guo, Kiefer and Liu2017), and that sea level and monsoon precipitation also co-vary with glacial–interglacial alternation. In this case, the hematite content and grain size indicated variations in sea level and depositional environment, and therefore changes in the SASM.
It is apparent that the SASM experienced three distinct phases since late Pliocene time (c. 3.4 Ma), associated with the glacial–interglacial alternations based on our grain size and hematite records (Figs 5–7). A phase with low monsoon precipitation and medium variation in monsoon amplitude occurred during c. 3.4–2.4 Ma, followed by increased precipitation and amplitude variation at 1.8–1.1 Ma, and finally reduced precipitation and amplitude variation during 1.1–0.1 Ma. Hematite content has also undergone three phases (Fig. 5): sediment high in hematite was deposited during 3.4–2.4 Ma, intermediate in hematite during c. 1.8–1.1 Ma and low in hematite during 1.1–0.1 Ma.
4.d. Variations in SASM precipitation, weathering and surface erosion
We undertook spectral and cross-spectral analyses of the hematite content and grain-size time series (Fig. 10). The cycles of periods c. 100 and c. 41 ka, dominated by sea level and insolation, were evident and exceeded 90% confidence levels, showing that the weathering intensity and stream flow transporting the sediments varied with these orbital frequencies. In the frequency domain, anti-phase variations of the grain size and hematite content provide some clues concerning the forcing mechanism for changes in sea level, the SASM and surface erosion. We suggest that the co-variations in hematite content and grain-size changes may have been controlled by sea-level changes since late Pliocene time, and that sea-level changes were closely associated with the SASM intensity at tectonic and orbital timescales; these proxy indicators therefore describe the long-term evolution of the SASM (Figs 5–7).

Fig. 10. Spectral analysis, cross-spectral analysis and wavelet transforms of the hematite content and grain-size time series since c. 3.4 Ma (blue curves) with red lines showing the 90% confidence level. Spectral analyses of (a, g, e) hematite content and (b, e, h) grain size time series, and (c, f, i) cross-spectral analysis between these two records during (a–c) 1.1–0.1 Ma, (d–f) 1.8–1.1 Ma and (g–i) 3.4–2.4 Ma. The lower panels represent the evolving spectrum power with time derived from wavelet transform of (left) hematite content and (right) grain size time series during 1.8–0.1 Ma.
Our multi-technique analyses of sediment proxies from Hole U1456A show varying sea level, SASM precipitation and weathering intensity in SW Asia over orbital-dominated cycles (Fig. 10). The co-variations between the weathering intensity and sea level provide direct evidence that sea level and associated monsoon circulation controlled the environmental variation over glacial–interglacial alternations.
5. Conclusions
On the basis of our new data, the evolution of the SASM precipitation and weathering intensity in the Himalaya–Karakoram Mountains can be divided into three phases since late Pliocene time. Weak summer monsoon precipitation with small amplitude fluctuations and enhanced formation of hematite occurred during c. 3.4–2.4 Ma; increased monsoon rainfall, with greater variation in amplitude as shown by variability in hematite content, occurred during 1.8–1.1 Ma; and average monsoon rainfall decreased and experienced small variations in amplitude, as tracked by hematite formation, during 1.1–0.1 Ma. We interpret our results to indicate that sea level and weathering intensity co-varied with the glacial–interglacial alternations since late Pliocene time, in particular at 1.8–1.1 Ma, in SW Asia. Variations of hematite content and grain size were originally determined by weathering intensity, monsoon rainfall and runoff velocity, and were modulated by changes in sea level and ocean environment. Our findings demonstrate the interplay between monsoon precipitation, mountain weathering and surface erosion over tectonic and glacial–interglacial timescales in SW Asia.
Acknowledgements
We thank China-IODP for supporting HY Lu to participate in the IODP 355 expedition during April–June 2015 in the Arabian Sea. This research is supported by the National Natural Science Foundation of China (grant nos 41888101, 41690111 and 41920104005) and the post-cruise research grant to HY Lu.
Supplementary material
To view supplementary material for this article, please visit https://doi.org/10.1017/S0016756820000291


