


1. INTRODUCTION
Navigation provides the best possible estimate of the moving object in terms of its position, velocity and attitude (Titterton and Weston, 1997) by measurement systems such as Inertial Navigation Systems (INS) and the Global Positioning System (GPS). The current market for integrated positioning and navigation systems is clearly dominated by GPS as one of the major components to provide absolute positioning information about the vehicle. Besides being globally available, GPS provides good navigation accuracies at very low cost. It is also highly portable, has low power consumption, and is well suited for integration with other sensors, communication links, and databases (Aggarwal et al, 2006). At this point in the development of navigation technology, the need for alternative positioning systems only arises because GPS does not work in all environments. One promising development is the emergence of Micro-Electro-Mechanical Systems (MEMS) technology. MEMS is an enabling technology with a massive global market, predicted to be US $180 billion in 2007. A portion of this market will support inertial sensor technology since INS technology is capable of working in environments where GPS has difficulties.
MEMS-based INS provides accurate navigation data over short time intervals but suffers from accuracy degradation with time due to the combined effects of errors like noises, biases, drifts and scale factor instabilities (Nassar et al, 2006; Godha, Reference Godha2006). Due to the integration of inertial measurements, any residual deterministic error will accumulate and grow without bound, resulting in ever increasing position and orientation errors. These errors can be corrected using frequent updates from external sources like GPS, which forms the basis of many integrated INS/GPS systems. In the past two decades, the use of cost effective MEMS based inertial sensors has made the integrated navigation systems more affordable. With the most desired features for civilian navigation including small size, low cost and light weight, these sensors still have to make their way in the field due to their significant error sources such as turn-on biases or scale factors variations. These errors are considerably larger than those of their navigation grade predecessors.
Inertial sensor errors can be divided into two parts: random and deterministic or systematic (Nassar, 2003). In order to integrate MEMS inertial sensors with GPS, and to provide a continuous and reliable navigation solution, the characteristics of different error sources and the understanding of the stochastic variation of these errors are of significant importance (Park, Reference Park2004). The random errors include bias-drifts or scale factor drifts, (El-Sheimy, Reference El-Sheimy2003) and the rate at which these errors change with time. These random errors have to be modelled stochastically. The deterministic error sources include the bias and the scale factor errors which can be removed by specific calibration procedures in a laboratory environment. However, for low cost sensors such as MEMS sensors, these errors are quite large and their repeatability is typically poor because of environmental factors dependence, especially temperature, which makes frequent calibration a necessity (El-Diasty et al, 2006). More explicitly, the actual value of the bias and the scale factor varies from that obtained through the calibration process due to the difference between the operational and calibration temperatures (Walid, Reference Walid2005). Hence there is a need for the development of accurate, reliable and efficient thermal models to be used for online and post processing applications. Since these errors accumulate with time, the position accuracy degrades if the thermal variations for both accelerometer and gyroscope biases and scale factors are not modelled and compensated (Shcheglov et al, Reference Shcheglov, Evans, Gutierrez and Tang2000).
In this paper, we aim at establishing a standard testing/calibration procedure for MEMS inertial sensors that will be used for inertial navigation applications. This includes the six-position calibration, Allan variance analysis, and thermal testing. Also the effect of varying temperature on the MEMS inertial sensor errors is examined in detail and a thermal model is developed to compensate for the effects of biases and scale factor errors due to temperature variation.
2. METHODOLOGY
In this section the basic calibration methods of a modified six-position static test, the angle rate test, stochastic modelling and thermal testing are explained.
2.1. Calibration Methods
The calibration of inertial instruments is required to reduce the errors in the INS derived position, velocity and attitude of moving platforms. Calibration is the process of comparing instrument outputs with known reference information and determining the coefficients that force the output to agree with the reference information over a range of output values. To determine the bias, scale factor and non-orthogonal error parameters, the first step in inertial navigation is to calibrate its sensors. Generally, calibration methods such as the local level frame (LLF) method; the six-position static method and rate tests are used for this purpose.
The common methods used for calibrating Inertial Measurement Units (IMUs) were primarily designed for in-lab tests and for high quality sensors, such as navigation or tactical grade IMUs. These tests often require the use of special references such as alignment to a given frame or specialized equipment. The six-position static and rate tests are among the most commonly used (Titterton and Weston, 1997).
2.1.1. Six-Position Static Test
The six-position method requires the inertial system to be mounted on a levelled table with each sensitive axis pointing alternately up and down. For a triad of orthogonal sensors this results in a total of six positions. The bias (b) and scale (S) factors can then be calculated using the following equations:
Where l upf is the sensor measurement when the sensitive axis is pointed upward, l downf is the measurement when the sensitive axis is pointed downwards and K is the known reference signal. For accelerometers, K is the local gravity constant and for gyroscopes K is the magnitude of the earth rotation rate at the given latitude. However, the earth rotation rate can only be used for navigation and tactical grade gyroscopes, since low grade gyroscopes such as MEMS suffer from bias instability and noise levels that can completely mask the earth's reference signal.
The six-position calibration accuracy depends on how well the axes are aligned with the vertical axes of the local level frame. For accurate results a perfect cube shaped mounting frame is required. This standard calibration method can be used to determine the bias and scale factors of the sensors, but cannot estimate the axes misalignments (non-orthogonalities). To estimate the non-orthogonalities an improved six-position test can be performed which takes into account all three types of errors. In matrix form the output of a triad of sensors (e.g. accelerometers) can be represented as:
![\eqalign{ \left[ {\matrix{ {l_{ax} } \cr {l_{ay} } \cr {l_{az} } \cr } } \right] \equals \tab\left[ {\matrix{ {m_{xx} } \tab {m_{xy} } \tab {m_{xz} } \cr {m_{yx} } \tab {m_{yy} } \tab {m_{yz} } \cr {m_{zx} } \tab {m_{zy} } \tab {m_{zz} } \cr } } \right] \left[ {\matrix{ {ax} \cr {ay} \cr {az} \cr } } \right] \plus \left[ {\matrix{ {b_{ax} } \cr {b_{ay} } \cr {b_{az} } \cr } } \right]{\rm or}\cr \left[ {\matrix{ {l_{ax} } \cr {l_{ay} } \cr {l_{az} } \cr } } \right] \equals\tab \left[ {\matrix{ {m_{xx} } \tab {m_{xy} } \tab {m_{xz} } \tab {b_{ax} } \cr {m_{yx} } \tab {m_{yy} } \tab {m_{yz} } \tab {b_{ay} } \cr {m_{zx} } \tab {m_{zy} } \tab {m_{zz} } \tab {b_{az} } \cr } } \right]\left[ {\matrix{ {ax} \cr {ay} \cr {az} \cr 1 \cr } } \right]}](https://static.cambridge.org/binary/version/id/urn:cambridge.org:id:binary:20151022093746704-0274:S0373463307004560_eqn3.gif?pub-status=live)
The diagonal m elements represent the scale factors, the off diagonal m elements are the non-orthogonalities and the b components are the biases. By aligning the IMU using the standard six-position method the accelerometers measurements will be:
![\left[ {\matrix{ { \minus g} \cr 0 \cr 0 \cr } } \right]\comma \left[ {\matrix{ { \plus g} \cr 0 \cr 0 \cr } } \right]\comma \left[ {\matrix{ 0 \cr { \minus g} \cr 0 \cr } } \right]\comma \left[ {\matrix{ 0 \cr { \plus g} \cr 0 \cr } } \right]\comma \left[ {\matrix{ 0 \cr 0 \cr { \minus g} \cr } } \right]\comma \left[ {\matrix{ 0 \cr 0 \cr { \plus g} \cr } } \right]](https://static.cambridge.org/binary/version/id/urn:cambridge.org:id:binary:20151022093746704-0274:S0373463307004560_eqn4.gif?pub-status=live)
The output of the sensors would be measured as a vector U:
The desire is to extract the components of the matrix in Equation 3 (call it matrix M) and this can be done using the well-known method of least squares:
Angular rate tests are used for calibrating the scale factors and non-orthogonalities of the gyroscopes. If both rate tests and the improved six-position static method are used together, one can determine all the inertial sensors' errors.
2.1.2. Angle Rate Test
Rate tests are typically done using a precision rate turntable. By rotating the unit through precisely known angles the reference turning rates can be developed. By comparing the outputs of the IMU to these references, the biases, scale factors and non-orthogonalities of the gyroscopes can be estimated using the same principle as the six-position method. This is typically accomplished by rotating the table through a defined angle in both the clockwise and counter clockwise directions as given by Equation 7.
where w ref(clockwise) represents gyroscope output on rotating the turntable by w ref in the clockwise direction while w ref(anticlockwise) represents gyroscope output on rotating the turntable by w ref in the anticlockwise direction and S gyro is gyroscope scale factor error.
These methods provide an estimate of the deterministic errors only and hence stochastic error models are required to determine random errors.
2.2. Stochastic Modelling
The basic difference between deterministic and stochastic modelling is that in deterministic modelling, relationship has to be established between one or more inputs and one or more outputs, whereas in stochastic modelling, there may not be any direct relationship between input and output (Hou, Reference Hou2004). A model is theorized as if the system is being excited by white noise, having the same output characteristics as the IMU under evaluation. Allan variance (IEEE Std 952-1997) is a time domain analysis technique and can be used to determine the characteristic of the underlying random processes, such as data noise. It helps identify the source of a given noise term in the data. The source may be inherent in the instrument, but in the absence of a plausible mechanism within the instrument, its origin should be sought in the test set up (Hou, Reference Hou2004). The root mean square random drift error is represented as a function of averaging times. In this method, it is assumed that the uncertainty in the data is generated by noise sources of specific characters. The magnitude of each noise source covariance is then estimated from the data. The five basic noise terms considered are angular random walk, velocity random walk, bias instability, quantization noise and drift rate ramp. In MEMS sensors, the stochastic models for gyro and accelerometers random errors are defined in terms of angle and velocity random walk processes.
2.3. Methods of Thermal Testing
The purpose of thermal testing is to determine the variation of the basic sensor parameters when operated under different temperatures. There are two main approaches for thermal testing:
(1) Allow the IMU enclosed in the thermal chamber to stabilize at a particular temperature corresponding to the temperature of the thermal chamber and then record the data. This method of recording the data at specific temperature points is called the Soak method.
(2) In the second method, called the Thermal Ramp method, the IMU temperature is linearly increased or decreased for a certain period of time (Titterton and Weston, Reference Titterton and Weston1997).
In this study, the Soak method was used to investigate thermal effect of sensors and to evaluate piecewise local temperature drift compensation models. A linear interpolation method was used in the thermal model as more advanced methods gave similar results. In order to compensate for the thermal drifts of the low-cost MEMS sensor, thermal calibration was conducted to calculate the biases and scale factors variations of the sensors over a range of temperature from −25°C to 70°C.
In order to evaluate the biases and the scaling factor values for the accelerometers and the gyroscopes, a local linear interpolation of the calculated values over the temperature range −25°C to 70°C was performed. In this linear interpolation method if two parameters p o and p 1 are known at temperatures t o and t 1, then an intermediate value is given by Equation 8:
where, t is the required temperature point and p(t) is the calculated value at that point. Other advanced methods like Cubic Spline Interpolation and Piecewise Cubic Hermite Interpolation were also tried but comparable results were observed for all the cases. Hence the simplest method of linear interpolation was used in this paper.
3. EXPERIMENTAL SETUP AND RESULTS
Tests were conducted first to identify noise terms existing in the custom built MEMS unit ADI MEMS IMU Sensor Triad (ADI) (Niu and El-Sheimy, 2005). This unit was designed by the members of MMSS research group at the University of Calgary and was built as a very low-cost alternative using MEMS inertial sensor chips. The IMU used surface micromachined MEMS gyroscopes (ADXRS150) and accelerometers (ADXL105) made by Analog Devices, Inc.
3.1. Sensor Random Noise Estimation (Allan Variance)
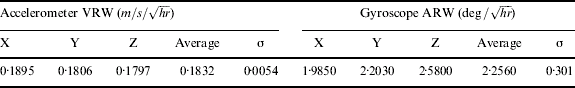
Eighteen hours of static data with the sampling frequency of 100 Hz was collected from the ADI IMU at room temperature. The data was analyzed using the Allan variance method to evaluate various random noise components. The raw outputs from ADI IMUs (i.e., voltage values) were converted to acceleration and angular rate. The mean was subtracted from the data before the analysis. Figure 1 illustrates a log-log plot of σ (T) versus time for the ADI accelerometers and gyroscopes. It can be observed from these graphs that the angular random walk is the dominant noise term. Using these plots, the Allan variance values fit a straight line with slope of −1/2 (from parametric least square fitting). The fitted Allan variance line meets T=1 at a value called Velocity Random Walk (VRW) for accelerometer sensors and Angular Random Walk (ARW) for gyroscope sensors. The calculated VRW and ARW values are listed in Table 1. These parameters are required for designing the process noise matrix Q to be used in the Extended Kalman Filter algorithm in the GPS/INS integrated navigation systems.

Figure 1. ADI accelerometer (left) and gyroscope (right) Allan variance results.
Table 1. Velocity random walk for accelerometers and angular random walk for gyroscopes.
3.2. Sensor Deterministic Errors Estimation (Six-position Estimation)
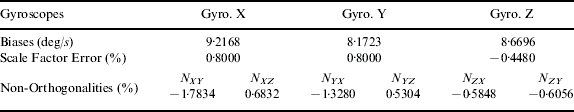
The modified six-position static test and angle rate tests were used to calculate the deterministic sensor errors for the ADI sensor unit namely, biases, scale factor errors and non-orthogonalities. These values for the accelerometers and gyroscopes are given in Tables 2a and 2b respectively, and were calculated at room temperature (22°C).
Table 2a. Accelerometer Deterministic Errors.
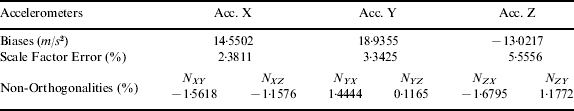
Table 2b. Gyroscope Deterministic Errors.
3.3. Thermal Calibration
The process of characterizing the stochastic variation at different temperatures is one of the most important steps in developing a reliable low cost integrated navigation system. The actual value of the bias and the scale factor varies from that obtained through the calibration process (six-position method) due to the difference between the operational and calibration temperatures (Walid, 2005). Unless an accurate temperature-dependent stochastic model is developed, the mechanization parameters will have higher error and could potentially degrade system performance.
In the test setup, a turntable and a thermal chamber are assembled together to form a Thermal-Turntable Unit as shown in Figure 2. The rotating axle of the turntable is extended into the thermal chamber through a narrow round opening in the chamber's side wall. The ADI MEMS is placed in the chamber and is fixed on the extended tabletop of the turntable. This placement of the IMU allows the freedom to rotate it under controlled temperature. The data was collected in the Inertial Lab at the University of Calgary. The IMU signals were sampled at 100 Hz at different temperatures and saved on a laptop via a 16-Bit A/D card (DAQCard-6036E) from National Instrument for post processing. The variation of bias and scale factor with temperature is evaluated for the low cost ADI MEMS unit. The calculated biases for accelerometers and gyroscopes at different temperatures are shown in Figure 3. The constant bias estimated from the conventional six-position static test was first removed from each calculated bias at different temperature points and then the values were plotted with respect to temperature.

Figure 2. Thermal test setup.

Figure 3. Variation of accelerometer (left) and gyroscope (right) biases with temperature.
As observed from Figure 3, the biases of accelerometers and gyroscopes vary significantly with temperature and hence should be modelled to get accurate navigation results. For accelerometers, the biases drift can be as high as 1 m/s2 while for gyroscopes, the drift in biases can reach 5 degs/sec over the whole temperature range. Hence there is a need to design an accurate thermal calibration model for low cost MEMS sensors to compensate for these biases and scale factor drift with temperatures. Scale factors were previously calculated for these inertial sensors. For further details, please refer to Aggarwal et al, Reference Aggarwal, Syed, Niu and El-Sheimy2007.
4. RESULT VERIFICATION
This section covers the results obtained on applying the proposed models to field test data.
4.1. Field Test Description
For the evaluation of the methodology explained above for calibrating MEMS sensors, kinematic data was collected in March and December 2005 by MMSS group using the ADI sensor triad, a higher grade IMU and GPS receivers. The ADI MEMS sensor was installed in the cargo area of the test van on a rigid platform along with the batteries and the laptops needed to record the data. The OEM4 GPS receiver and a navigation grade IMU (CIMU from Honeywell) were installed on the roof. For the first dataset (Run 1, December 2005) the test was performed around the University of Calgary campus and consisted of typical kinematic motion around the research park. The second dataset, Run 2 (March 2005) was also collected around the University of Calgary research park area in mainly open sky conditions with several short (<10 seconds) real GPS signal blockage periods. Two separate loops were followed in clockwise and counter-clockwise directions along the same trajectory. Both loops involved stops for four to six minutes near the same open sky area. This Run 2 trajectory is a typical low speed scenario which mimics driving in residential areas. Figure 4 shows the trajectory for Runs 1 and 2 together with the location of GPS signal outages.

Figure 4. The ADI IMU trajectories for Run 1 (left) and 2 (right).
The positional accuracy of the integrated solution mainly depends on the accuracy level of the GPS position during GPS signal availability. Therefore the quality of the position estimation is often evaluated by simulating a set of short term GPS signal outages and by checking the position drifts during these GPS signal outages where the INS has to work as a stand-alone navigation system. In order to test the MEMS IMU performance with the uncalibrated and calibrated data, a few short term GPS signal outages were simulated as shown in Figure 4. The IMU position errors during GPS signal outages were obtained by comparing the corresponding solution to the reference trajectory acquired from the smoothed best estimate of the CIMU/DGPS data processed by Applanix Corporation POSPac™ software. AINS™, an Aided Inertial Navigation system Toolbox for MatLab® Software, was used to integrate GPS and INS data (Shin and El-Sheimy, Reference Shin and El-Sheimy2005). AINS™ is a flexible toolbox that can deal with different INS grades with multiple aiding sources such as GPS, odometer, and heading sensor. The MEMS version of AINS™, which has some special functionality to deal with the large uncertainty of MEMS inertial sensors, was used in this paper.
4.2. Comparison between Calibrated data and Un-Calibrated Data
The performance of the MEMS IMU was tested under the different scenarios listed in Table 3 by simulating various short-term GPS signal outages. Run 1 had four, 30 second GPS outages, carefully selected to cover the characteristic dynamics in the system. In Run 2, four 60 second GPS outages were simulated by removing the GPS updates from the Kalman filter. Due to the similar trend in the results, only the typical results from Run 1 are presented for all scenarios. The detailed results for both runs are provided in Section 4.2.6. in Tables 5 and 6.
4.2.1. Scenario 1
As previously stated, four 30 sec GPS signal outages were applied at selected locations as shown in Figure 4 for Run 1 and four 60 sec outages were applied for Run 2. The raw data was compensated according to the manufacturer specified nominal biases and scale factors. But this was not effective as the AINS™ output diverged after few seconds. This showed that compensation according to the manufacturer's specifications are not enough and calibration of low cost MEMS sensors is essential to obtain reliable vehicle navigation information.
4.2.2. Scenario 2
In the second condition, six-position static test biases and the nominal scale factors specified in Table 4 were used to compensate the raw signal. Figure 5 shows the position error obtained for Run 1. On comparison of the results obtained from scenario 1 and 2, it was observed that biases are the dominant stochastic error without which the filter diverges.
Table 3. The five test scenarios.
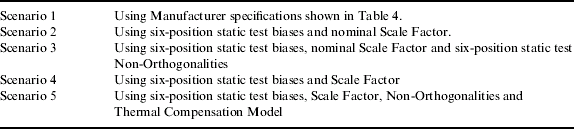
4.2.3. Scenario 3
For the third scenario, six-position static test biases, non-orthogonalities and nominal scale factor values were used to calibrate the raw Run 1 signal. Figure 6 shows the results. Comparison between Figures 5 and 6 shows a reduction of 5·7% in drift errors. If this is compared with scenario 1 where the filter failed to converge, it can be concluded that non-orthogonalities are not as dominant errors as biases.
4.2.4. Scenario 4
Here, six-position static test biases and six-position static test scale factor are compensated, and the results are in Figure 7. Upon comparing Figures 5 and 7, we see a 6·6% improvement by using six-position static test scale factor values instead of using the nominal scale factor.
4.2.5. Scenario 5
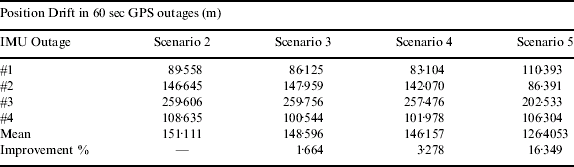
In this case we applied all the six-position biases, scale factor and non-orthogonalities along with the thermal model residual temperature dependant biases and scale factors; the results are in Figure 8. A comparison of Figures 7 and 8 shows 4·3% improvement in the results. It is evident that this improvement was due to the thermal compensation model (Aggarwal et al, 2007) and cannot be due to the non-orthogonalities as this is the major difference between scenarios 4 and 5. We also observed that the result obtained on using condition 5 had the least error when compared with any other scenario. In Run 1, the total temperature variation during the trajectory was 4°C. Therefore the improvement due to thermal model was not as significant as that for the Run 2 (16·3%), where the maximum temperature variation was 8°C. Table 5 summarizes the position errors obtained for Run 1 under the conditions described in Table 3.
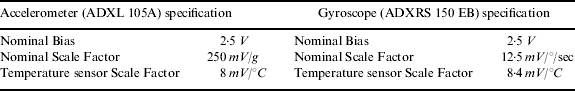
Table 4. Manufacturer specifications for ADI units.
4.2.6. Summary of Position Errors for Run 2
Similarly all the position errors obtained for Run 2 are given in Table 6. On comparing the Run 2, condition 2 and condition 3 position errors, a 1·7% improvement is observed when the modified six-position static test non-orthogonalities were used. The comparison between six-position scale factor and nominal scale factor values, yielded 3·3% improvement. Condition 5, from Table 6 shows us the improvement in position error reduction by almost 16·3% on using six-position static test non-orthogonalities and the thermal compensation model. The main effect in these values is due to the thermal model where biases and scale factors are evaluated at each temperature point.
Table 5. Position Errors for Run 1.
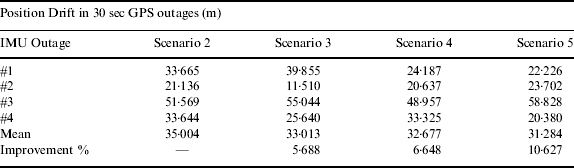
Table 6. Position Errors for Run 2.
5. DISCUSSIONS
MEMS inertial sensors are inexpensive, compact and rugged, and therefore, can be used to complement GPS in civilian vehicle navigation when the signals are not available. The difficulty in using the MEMS sensors is that they exhibit significant time and temperature varying errors. In order to effectively use these sensors, the errors need to be calibrated and modelled before the data can be used in the integration software. The primary objective of this paper was to compare the improvements in performances achieved using calibrated data on the un-calibrated data. Various conditions were analyzed to determine the contribution of each error source and hence the need for obtaining calibrated data.
The first steps in the design of Kalman filters for INS/GPS integration are the stochastic error models and the design of Q matrix. The Q matrix should contain the VRW and ARW, their standard errors along with other error parameters. Table 1 shows that the VRW of the accelerometers have a small standard error of only 0·0054 ![]() while the ARW for the gyroscopes have a considerably larger standard error of 0·301 (
while the ARW for the gyroscopes have a considerably larger standard error of 0·301 (![]() . These values were used in the Kalman filter design and therefore, were utilized irrespective of the inertial data compensation for deterministic sensor errors such as biases, scale factors or non-orthogonalities.
. These values were used in the Kalman filter design and therefore, were utilized irrespective of the inertial data compensation for deterministic sensor errors such as biases, scale factors or non-orthogonalities.
Figure 3 shows the variations in biases for accelerometers and gyroscopes over the temperature range from −25 to +70°C. The accelerometer bias changed approximately 0·94 m/s2 over the temperature range while the changes in gyroscope drift were about 5°/s. Such a temperature dependency of the bias and drift clearly indicates a need to develop a thermal model. To develop a thermal model, a piecewise local model based on linear interpolation method was used. Other advanced methods yielded similar results and hence have not been discussed here.
Figure 5 to 8 show the performances by using un-calibrated and calibrated data. Table 5 and 6 give the values obtained under various test conditions for Run 1 and Run 2. Initially, manufacturer specified nominal scale and biases were compensated and processed in AINS® software. However the filter did not converge due to large errors. Consequently, the six-position static test biases were removed before processing the inertial data. This made the convergence of the AINS® filter possible. six-position static biases and nominal scale factor were then compensated and compared with six-position biases, non-orthogonalities and nominal scale factor compensated data to show that the effects of non-orthogonalities were not significant. Similarly nominal scale factor and six-position static test scale factor were compared and the improvement was not as significant as that obtained by biases compensation. Finally, the proposed thermal model evaluated biases and scale factor were used to calibrate the raw inertial data. The biases and drifts were computed at the exact temperatures that were recorded during the field tests and then the data was calibrated. The best results were obtained by use of the proposed thermal model.

Figures 5–8. Position errors for Run 1 with different compensations applied.
6. CONCLUSIONS
MEMS sensors are lightweight and low cost but have large errors compared to higher grade inertial sensors. These deterministic errors have to be calibrated and compensated to get acceptable navigation results. This paper analyzed the stochastic errors in MEMS sensors and found that angular random walk (ARW) is the dominant noise term. Further six-position static test calibration processes were applied to find the deterministic errors namely, bias, scale factor, and non-orthogonalities. The effects of each of these error sources were investigated by processing the inertial data in AINS® filter. The results show that bias is the most dominant error source and without its compensation, the filter diverges. The effect of scale factor and non-orthogonalities are not as significant as that of the biases. Furthermore, an efficient thermal model was used to calibrate data along with the six-position static test parameters and further reduction in the navigation errors was observed. This shows that the effects of thermal variations on biases and scale factor errors are significant for MEMS sensors and need to be precisely modelled. However the improvement obtained by using the thermal model depends on the total temperature variation in the raw data.
ACKNOWLEDGMENT
This study was supported in part by research fund from the Natural Science and Engineering Research Council of Canada (NSERC) and Geomatics for Informed Decisions (GEOIDE), Network Centers of Excellence (NCE) to Dr. Naser El-Sheimy. Dr. Eun-Hwan Shin is acknowledged as a co-author of the AINSTM toolbox used in this paper. The authors would like to thank Mr. Haiying Hou for helping during the field test.


