


1. Introduction
The evaporation of a liquid droplet on a solid substrate is a common physical phenomenon encountered in a vast variety of situations; it is therefore unsurprising that it has received significant attention in the literature. For this reason, only the publications most relevant to the subject of the present work will be highlighted here; the reader is referred to Dunn et al. (Reference Dunn, Wilson, Duffy, David and Sefiane2009), Cazabat & Guena (Reference Cazabat and Guena2010) and Erbil (Reference Erbil2012) for other recent and comprehensive reviews of the topic. In addition, the discussion will be restricted to investigations of relatively slowly evaporating drops in which the surface remains (quasi-) saturated; the transport of vapour away from the drop is the rate-limiting mass-transfer mechanism. It should be noted, nonetheless, that there is another body of work concerning the complementary situation of more rapidly evaporating liquids showing thermodynamic discontinuities at the interface (Fang & Ward Reference Fang and Ward1999; Ward & Fang Reference Ward and Fang1999). Representative investigations are those by Burelbach, Bankoff & Davis (Reference Burelbach, Bankoff and Davis1988), Anderson & Davis (Reference Anderson and Davis1995) and Ajaev (Reference Ajaev2005).
A milestone investigation of sessile drops was performed by Picknett & Bexon (Reference Picknett and Bexon1977), who experimentally and theoretically examined this problem in the late 1970s. They addressed the two extreme modes of evaporation, namely ‘constant-angle’ (CA) and ‘constant-radius’ (CR) modes. In the former, the droplet evaporates with a receding contact radius
 $R$
while the contact angle remains fixed at
$R$
while the contact angle remains fixed at
 ${\it\theta}={\it\theta}_{0}$
. In the latter, the contact angle
${\it\theta}={\it\theta}_{0}$
. In the latter, the contact angle
 ${\it\theta}$
decreases with time while the base radius remains pinned at
${\it\theta}$
decreases with time while the base radius remains pinned at
 $R=R_{0}$
. Picknett & Bexon (Reference Picknett and Bexon1977) observed that, when the drop evaporates, the drop mass varies linearly in the CR mode but according to a power law in the CA mode. They also examined the lifetime of the drop as a function of the initial (equilibrium) contact angle
$R=R_{0}$
. Picknett & Bexon (Reference Picknett and Bexon1977) observed that, when the drop evaporates, the drop mass varies linearly in the CR mode but according to a power law in the CA mode. They also examined the lifetime of the drop as a function of the initial (equilibrium) contact angle
 ${\it\theta}_{0}$
, concluding that, in general, for the same
${\it\theta}_{0}$
, concluding that, in general, for the same
 ${\it\theta}_{0}$
, the lifetime of a drop evaporating in the CR mode is shorter than that of same drop evaporating in the CA mode. Only when the level of hydrophobicity is very high,
${\it\theta}_{0}$
, the lifetime of a drop evaporating in the CR mode is shorter than that of same drop evaporating in the CA mode. Only when the level of hydrophobicity is very high,
 ${\it\theta}>140^{\circ }$
, is this behaviour inverted. Bourgès-Monnier & Shanahan (Reference Bourgès-Monnier and Shanahan1995) conducted experiments to study the impact of the substrate roughness and showed that a droplet could also evaporate in a more complicated fashion, mixing CR and CA modes. This mechanism is usually referred to as stick–slip (SS) mode. They focused their attention on the CR stage, and obtained an approximate analytical solution for the total mass flux across the droplet surface.
${\it\theta}>140^{\circ }$
, is this behaviour inverted. Bourgès-Monnier & Shanahan (Reference Bourgès-Monnier and Shanahan1995) conducted experiments to study the impact of the substrate roughness and showed that a droplet could also evaporate in a more complicated fashion, mixing CR and CA modes. This mechanism is usually referred to as stick–slip (SS) mode. They focused their attention on the CR stage, and obtained an approximate analytical solution for the total mass flux across the droplet surface.
Significant insights into the drop dynamics were provided by Deegan et al. (Reference Deegan, Bakajin, Dupont, Huber, Nagel and Witten1997, Reference Deegan, Bakajin, Dupont, Huber, Nagel and Witten2000) in their investigation of the so-called ‘coffee-ring’ effect, i.e. the patterns left by pinned drops when the evaporating liquid contains a suspension of colloidal particles. This was explained via the radial outward flow induced to replenish the liquid eliminated by evaporation from the edge of the drop. Hu & Larson (Reference Hu and Larson2002) adopted the evaporation flux distribution along the droplet surface presented by Deegan et al. (Reference Deegan, Bakajin, Dupont, Huber, Nagel and Witten2000). With the help of their numerical results, they suggested approximate analytical expressions to determine the temporal evolution of the evaporation rate as a function of the contact angle
 ${\it\theta}$
, in the range
${\it\theta}$
, in the range
 $0<{\it\theta}<90^{\circ }$
. The authors compared their results with experiments, numerical simulations, and the theory by Picknett & Bexon (Reference Picknett and Bexon1977), finding reasonably good agreement without parameter fitting. Subsequently, Hu & Larson (Reference Hu and Larson2005a
,Reference Hu and Larson
b
) neglected inertial effects and employed lubrication theory to investigate the flow field within the drops, in the absence (Hu & Larson Reference Hu and Larson2005b
) and presence (Hu & Larson Reference Hu and Larson2005a
) of Marangoni stresses. The lubrication approximation restricted the validity of their analysis to
$0<{\it\theta}<90^{\circ }$
. The authors compared their results with experiments, numerical simulations, and the theory by Picknett & Bexon (Reference Picknett and Bexon1977), finding reasonably good agreement without parameter fitting. Subsequently, Hu & Larson (Reference Hu and Larson2005a
,Reference Hu and Larson
b
) neglected inertial effects and employed lubrication theory to investigate the flow field within the drops, in the absence (Hu & Larson Reference Hu and Larson2005b
) and presence (Hu & Larson Reference Hu and Larson2005a
) of Marangoni stresses. The lubrication approximation restricted the validity of their analysis to
 ${\it\theta}<40^{\circ }$
. Following on from these works, Hu & Larson (Reference Hu and Larson2006) also showed that spontaneous, evaporation-induced thermocapillarity could invert the typical coffee-ring depositions, therefore driving the suspended particles to the centre of the drop rather than towards the contact line. Ristenpart et al. (Reference Ristenpart, Kim, Domingues, Wan and Stone2007) concluded that the direction of the flow depends on the relative thermal conductivities of the substrate and liquid, and provided the critical conditions that demarcate the outward/inward flow regimes.
${\it\theta}<40^{\circ }$
. Following on from these works, Hu & Larson (Reference Hu and Larson2006) also showed that spontaneous, evaporation-induced thermocapillarity could invert the typical coffee-ring depositions, therefore driving the suspended particles to the centre of the drop rather than towards the contact line. Ristenpart et al. (Reference Ristenpart, Kim, Domingues, Wan and Stone2007) concluded that the direction of the flow depends on the relative thermal conductivities of the substrate and liquid, and provided the critical conditions that demarcate the outward/inward flow regimes.
Other works important to the subject of this investigation are those by Birdi, Vu & Winter (Reference Birdi, Vu and Winter1989) and Rowan, Newton & McHale (Reference Rowan, Newton and McHale1995), who conducted experiments showing that the evaporation rate varies with the size of the drops. Erbil, McHale & Newton (Reference Erbil, McHale and Newton2002) observed the CA evaporation mode, which is normally more unusual, in
 $n$
-butanol, toluene,
$n$
-butanol, toluene,
 $n$
-nonane, and
$n$
-nonane, and
 $n$
-octane drops on a polytetrafluoroethylene (PTFE) surface with equilibrium contact angle
$n$
-octane drops on a polytetrafluoroethylene (PTFE) surface with equilibrium contact angle
 ${\it\theta}_{0}<90^{\circ }$
. More work on evaporating drops of pure, completely wetting fluids with receding contact lines was later completed by Poulard, Benichou & Cazabat (Reference Poulard, Benichou and Cazabat2003). Under such conditions, they observed that the dynamics is controlled not only by the volatility of the liquid, but also by the properties of the wetting film left on the substrate. The role of the substrate temperature on the wetting and evaporation behaviour of volatile droplets was examined by Crafton & Black (Reference Crafton and Black2004), with water and heptane drops on aluminium and copper surfaces, and by Mollaret et al. (Reference Mollaret, Sefiane, Christy and Veyret2004), with water drops on aluminium and PTFE. David, Sefiane & Tadrist (Reference David, Sefiane and Tadrist2007) demonstrated a strong influence of the substrate’s thermal conductivity on the evaporation rate. This important finding pointed out deficiencies of previous theoretical models (Picknett & Bexon Reference Picknett and Bexon1977; Bourgès-Monnier & Shanahan Reference Bourgès-Monnier and Shanahan1995; Rowan et al.
Reference Rowan, Newton and McHale1995; Hu & Larson Reference Hu and Larson2002), which failed to take this into account. Later, Dunn et al. (Reference Dunn, Wilson, Duffy, David and Sefiane2009) provided further insights into this problem by means of experiments and numerical work.
${\it\theta}_{0}<90^{\circ }$
. More work on evaporating drops of pure, completely wetting fluids with receding contact lines was later completed by Poulard, Benichou & Cazabat (Reference Poulard, Benichou and Cazabat2003). Under such conditions, they observed that the dynamics is controlled not only by the volatility of the liquid, but also by the properties of the wetting film left on the substrate. The role of the substrate temperature on the wetting and evaporation behaviour of volatile droplets was examined by Crafton & Black (Reference Crafton and Black2004), with water and heptane drops on aluminium and copper surfaces, and by Mollaret et al. (Reference Mollaret, Sefiane, Christy and Veyret2004), with water drops on aluminium and PTFE. David, Sefiane & Tadrist (Reference David, Sefiane and Tadrist2007) demonstrated a strong influence of the substrate’s thermal conductivity on the evaporation rate. This important finding pointed out deficiencies of previous theoretical models (Picknett & Bexon Reference Picknett and Bexon1977; Bourgès-Monnier & Shanahan Reference Bourgès-Monnier and Shanahan1995; Rowan et al.
Reference Rowan, Newton and McHale1995; Hu & Larson Reference Hu and Larson2002), which failed to take this into account. Later, Dunn et al. (Reference Dunn, Wilson, Duffy, David and Sefiane2009) provided further insights into this problem by means of experiments and numerical work.
New theoretical expressions to predict the evaporation rate, correcting the deviations due to thermal effects, have been recently presented by Sefiane & Bennacer (Reference Sefiane and Bennacer2011), and Sobac & Brutin (Reference Sobac and Brutin2012). Xu & Luo (Reference Xu and Luo2007) showed a weak Marangoni flow experienced by water drops via fluorescent nanoparticles added to the liquid. Sefiane et al. (Reference Sefiane, Wilson, David, Dunn and Duffy2009) performed experiments to elucidate the effect of the atmosphere on pinned water drops released onto various substrates. They observed that reducing the atmospheric pressure increased the molecular diffusion coefficient of the vapour and, therefore, the evaporation rate. Different evaporation rates were also reported for different ambient gases, namely nitrogen, helium, and carbon dioxide. Shanahan, Sefiane & Moffat (Reference Shanahan, Sefiane and Moffat2011) revised the CA and CR pure modes of evaporation and derived new analytical expressions to demonstrate that the droplet lifetime changes with the hydrophobicity of the substrate. Like Picknett & Bexon (Reference Picknett and Bexon1977), they also concluded that the CR mode leads to shorter drop lifetimes. In an attempt to investigate the more complex SS mode, Nguyen & Nguyen (Reference Nguyen and Nguyen2012) proposed a more sophisticated theoretical analysis to predict the lifetime of droplets evaporating via a combined pinned-receding mode. Under these conditions, Stauber et al. (Reference Stauber, Wilson, Duffy and Sefiane2014) have recently proposed a master diagram for the lifetimes of drops in all possible modes, showing that the lifetime of a drop may not always be constrained by the lifetimes of the extreme modes.
A number of experimental investigations have also revolved around the complex pinning-depinning behaviour of the triple line (SS mode), e.g. Sefiane & Tadrist (Reference Sefiane and Tadrist2006), Moffat, Sefiane & Shanahan (Reference Moffat, Sefiane and Shanahan2009) and Orejon, Sefiane & Shanahan (Reference Orejon, Sefiane and Shanahan2011). The dynamics of this is dictated by a competition between pinning forces on one hand and depinning forces on the other. The former are usually due to the contact line being anchored to the substrate because of chemical and surface heterogeneities; the depinning forces are normally the result of the deviation of the droplet profile from equilibrium (Orejon et al. Reference Orejon, Sefiane and Shanahan2011). Before these works, Shanahan (Reference Shanahan1995) had already developed a simple theory to explain the jumps characteristic of the SS mode experienced by the drops in the last stages of the evaporation process. Recently, Jansen, Zandvliet & Kooij (Reference Jansen, Zandvliet and Kooij2014) examined elongated droplets on chemically stripe-patterned surfaces. The contact-line dynamics of these drops is intimately connected to the pattern’s characteristic direction. After an initial stage in which the whole contact line is motionless, these drops evaporate with fragments of its contact line pinned (segments parallel to the stripe pattern) while the rest moves (segments perpendicular to the pattern).
Most of the aforementioned theoretical works essentially focus on predicting the evaporation flux and lifetime of the drops regardless of their internal dynamics, except for Deegan et al. (Reference Deegan, Bakajin, Dupont, Huber, Nagel and Witten1997, Reference Deegan, Bakajin, Dupont, Huber, Nagel and Witten2000), Mollaret et al. (Reference Mollaret, Sefiane, Christy and Veyret2004), Hu & Larson (Reference Hu and Larson2005a ,Reference Hu and Larson b , Reference Hu and Larson2006) and Karapetsas et al. (Reference Karapetsas, Matar, Valluri and Sefiane2012), who also provide some insights into the dynamics of bulk flow via numerical simulations. Other authors have also directed their attention to revealing the underlying mechanisms taking place within the liquid, e.g. Ruiz & Black (Reference Ruiz and Black2002), Girard et al. (Reference Girard, Antoni, Faure and Steinchen2006, Reference Girard, Antoni, Faure and Steinchen2008a ), Girard, Antoni & Sefiane (Reference Girard, Antoni and Sefiane2008b ) and Girard & Antoni (Reference Girard and Antoni2008). At this point, it is important to realize the restrictions common to these numerical works. Firstly, most of these investigations completely neglected the dynamics of the gas phase by addressing the free-surface problem. In some cases, the authors use empirical heat-transfer coefficients to approximate the energy balance. Only Girard & Antoni (Reference Girard and Antoni2008) and Girard et al. (Reference Girard, Antoni, Faure and Steinchen2008a ,Reference Girard, Antoni and Sefiane b ) solve Laplace’s equation for the temperature in the gas phase, to calculate the energy transfer across the free surface more realistically. Regarding the evaporation flux, this is computed either via the Laplace solution of the vapour field (Hu & Larson Reference Hu and Larson2002, Reference Hu and Larson2005a ,Reference Hu and Larson b , Reference Hu and Larson2006; Mollaret et al. Reference Mollaret, Sefiane, Christy and Veyret2004), or by use of an empirical mass-transfer coefficient (Ruiz & Black Reference Ruiz and Black2002; Girard et al. Reference Girard, Antoni, Faure and Steinchen2006, Reference Girard, Antoni, Faure and Steinchen2008a ,Reference Girard, Antoni and Sefiane b ; Girard & Antoni Reference Girard and Antoni2008; Karapetsas et al. Reference Karapetsas, Matar, Valluri and Sefiane2012). In thermocapillary flows, however, the Marangoni effect may induce significant convective transport of vapour in the gas parallel to the interface, which can alter the evaporation flux distribution, as was shown by Sáenz et al. (Reference Sáenz, Valluri, Sefiane, Karapetsas and Matar2014). Thus, the full advection–diffusion solution for the vapour concentration (and temperature) in the gas is necessary to verify how the resulting local interface mass-transfer rate (calculated purely based on a local temperature/concentration balance at the interface) compares with that from the solution of the diffusion equation.
The reader should also note that relevant works available in the literature, such as Hu & Larson (Reference Hu and Larson2002, Reference Hu and Larson2005a ,Reference Hu and Larson b , Reference Hu and Larson2006) or Girard et al. (Reference Girard, Antoni, Faure and Steinchen2006, Reference Girard, Antoni, Faure and Steinchen2008a ,Reference Girard, Antoni and Sefiane b ) and Girard & Antoni (Reference Girard and Antoni2008), provide pseudo-transient solutions to the droplet development in time, i.e. their transient solution is the sum of a set of steady-state solutions rather than the result of a pure transient approach, such as those by Ruiz & Black (Reference Ruiz and Black2002), Mollaret et al. (Reference Mollaret, Sefiane, Christy and Veyret2004) and Karapetsas et al. (Reference Karapetsas, Matar, Valluri and Sefiane2012). Pseudo-transient works additionally require the external imposition of the drop geometry. Thus, these models are not well suited to capturing transient phenomena, e.g. thermocapillary instabilities, such as those recently discovered by Sefiane et al. (Reference Sefiane, Moffat, Matar and Craster2008), or interfacial deformations, e.g. for larger drops in which gravity is not negligible, such as those investigated by Gatapova et al. (Reference Gatapova, Semenova, Zaitsev and Kabov2014). Very recently, Yang, Hong & Cheng (Reference Yang, Hong and Cheng2014) conducted finite-element simulations of a fully coupled three-phase model (solid–liquid–gas), restricted to two dimensions, to describe the liquid and gas flow with and without Marangoni effects. They analysed the non-heated problem and reported an increasing evaporation rate due to the Marangoni effect.
The simulation of evaporating drops with a moving contact line (MCL) has been undertaken by Murisic & Kondic (Reference Murisic and Kondic2011) and Karapetsas et al. (Reference Karapetsas, Matar, Valluri and Sefiane2012), via the ‘one-sided’ approach. Murisic & Kondic (Reference Murisic and Kondic2011) investigated the two traditional evaporation models (equilibrium and non-equilibrium interface) with the help of the lubrication approximation, which limited their work to
 ${\it\theta}<40^{\circ }$
. Depending on the model, they found significantly different results, including drop evolution and thermal gradients along the liquid–gas interface. Karapetsas et al. (Reference Karapetsas, Matar, Valluri and Sefiane2012) conducted simulations providing insights for a mixed pinned-receding scenario. Focusing on rather thin drops,
${\it\theta}<40^{\circ }$
. Depending on the model, they found significantly different results, including drop evolution and thermal gradients along the liquid–gas interface. Karapetsas et al. (Reference Karapetsas, Matar, Valluri and Sefiane2012) conducted simulations providing insights for a mixed pinned-receding scenario. Focusing on rather thin drops,
 ${\it\theta}<23^{\circ }$
, they reported spontaneous emergence of unstable convective rolls in the two-dimensional axisymmetric flow for increasing Prandtl number. As pointed out by Sui, Ding & Spelt (Reference Sui, Ding and Spelt2014) in their recent review of the state of the art in the numerical simulation of flows with a moving contact line, the direct numerical simulation (DNS) of a fully coupled two-phase flow with a moving contact line and phase change remains a challenge. In addition, it is important to develop a model capable of resolving both pure CR and CA evaporation modes to examine how the dynamics compare for the extreme cases, similar to the work by Picknett & Bexon (Reference Picknett and Bexon1977) on the overall evaporation rate.
${\it\theta}<23^{\circ }$
, they reported spontaneous emergence of unstable convective rolls in the two-dimensional axisymmetric flow for increasing Prandtl number. As pointed out by Sui, Ding & Spelt (Reference Sui, Ding and Spelt2014) in their recent review of the state of the art in the numerical simulation of flows with a moving contact line, the direct numerical simulation (DNS) of a fully coupled two-phase flow with a moving contact line and phase change remains a challenge. In addition, it is important to develop a model capable of resolving both pure CR and CA evaporation modes to examine how the dynamics compare for the extreme cases, similar to the work by Picknett & Bexon (Reference Picknett and Bexon1977) on the overall evaporation rate.
All of the aforementioned numerical and theoretical work has been concerned with axisymmetric drops, with the exception of the linear-stability analysis performed by Karapetsas et al. (Reference Karapetsas, Matar, Valluri and Sefiane2012) in an attempt to shed light on the thermocapillary instabilities reported earlier by Sefiane et al. (Reference Sefiane, Moffat, Matar and Craster2008). In the majority of the cases and in most real-life applications, however, spherical evaporating drops are the exception rather than the rule. In the present investigation we address the more complex case of three-dimensional deformed droplets, and with moving contact lines. To the best of our knowledge, this is the first study of its kind in the literature.
The rest of this paper is organized as follows. In § 2 we describe a novel fully coupled two-phase model based on the diffuse-interface (DI) method. The results of an accompanying experimental investigation of evaporating drops in a controlled environment are presented in § 3. These are employed in § 4 to provide the validation of our model. The flow dynamics for two non-spherical pinned drops are examined in § 5. In addition, the versatility of our model also allows the resolution of the more complex case of drops evaporating with a moving contact line according to the pure CA mode, which is addressed in § 6. Finally, the conclusions resulting from this investigation are summarized in § 7.
2. Mathematical modelling
2.1. Problem statement
A sketch of the problem is provided in figure 1(a). A sessile drop of initial height
 ${\hat{H}}_{0}$
and contact radius
${\hat{H}}_{0}$
and contact radius
 $\hat{R}_{0}$
resting on a heated substrate evaporates into a non-saturated surrounding gas at atmospheric pressure; the caret denotes dimensional variables. The liquid is a pure substance (distilled water in the experiments) while the gas is modelled as a two-component mixture of variable composition: a non-condensable gas (nitrogen in the experiments) and the liquid’s vapour. All three pure substances are regarded as Newtonian fluids. The density, dynamic viscosity, thermal conductivity, and specific heat capacity for the liquid are denoted by
$\hat{R}_{0}$
resting on a heated substrate evaporates into a non-saturated surrounding gas at atmospheric pressure; the caret denotes dimensional variables. The liquid is a pure substance (distilled water in the experiments) while the gas is modelled as a two-component mixture of variable composition: a non-condensable gas (nitrogen in the experiments) and the liquid’s vapour. All three pure substances are regarded as Newtonian fluids. The density, dynamic viscosity, thermal conductivity, and specific heat capacity for the liquid are denoted by
 $\hat{{\it\rho}}_{l}$
,
$\hat{{\it\rho}}_{l}$
,
 $\hat{{\it\mu}}_{l}$
,
$\hat{{\it\mu}}_{l}$
,
 $\hat{k}_{l}$
, and
$\hat{k}_{l}$
, and
 ${\hat{c}}_{pl}$
, respectively. The equivalent physical properties for the non-condensable gas (designated by subscript ‘1’) and vapour (designated by subscript ‘2’) are represented by
${\hat{c}}_{pl}$
, respectively. The equivalent physical properties for the non-condensable gas (designated by subscript ‘1’) and vapour (designated by subscript ‘2’) are represented by
 $\hat{{\it\rho}}_{g1}$
,
$\hat{{\it\rho}}_{g1}$
,
 $\hat{{\it\mu}}_{g1}$
,
$\hat{{\it\mu}}_{g1}$
,
 $\hat{k}_{g1}$
,
$\hat{k}_{g1}$
,
 ${\hat{c}}_{pg1}$
, and
${\hat{c}}_{pg1}$
, and
 $\hat{{\it\rho}}_{g2}$
,
$\hat{{\it\rho}}_{g2}$
,
 $\hat{{\it\mu}}_{g2}$
,
$\hat{{\it\mu}}_{g2}$
,
 $\hat{k}_{g2}$
,
$\hat{k}_{g2}$
,
 ${\hat{c}}_{pg2}$
, respectively. The relative amount of the gaseous components is represented by the vapour mass fraction,
${\hat{c}}_{pg2}$
, respectively. The relative amount of the gaseous components is represented by the vapour mass fraction,
 ${\it\omega}$
, defined as the mass of vapour per unit mass of gas mixture. The coefficient of binary molecular diffusion is
${\it\omega}$
, defined as the mass of vapour per unit mass of gas mixture. The coefficient of binary molecular diffusion is
 $\hat{D}$
, and the specific latent heat is
$\hat{D}$
, and the specific latent heat is
 ${\rm\Delta}{\hat{h}}_{v}$
. The liquid–gas interface is endowed with a surface tension,
${\rm\Delta}{\hat{h}}_{v}$
. The liquid–gas interface is endowed with a surface tension,
 $\hat{{\it\sigma}}$
, which decreases monotonically with temperature,
$\hat{{\it\sigma}}$
, which decreases monotonically with temperature,
 $\hat{T}$
, according to
$\hat{T}$
, according to
 $\hat{{\it\sigma}}=\hat{{\it\sigma}}_{0}-\hat{{\it\gamma}}(\hat{T}-\hat{T}_{a})$
; here,
$\hat{{\it\sigma}}=\hat{{\it\sigma}}_{0}-\hat{{\it\gamma}}(\hat{T}-\hat{T}_{a})$
; here,
 $\hat{{\it\sigma}}_{0}$
is the surface tension at the reference temperature
$\hat{{\it\sigma}}_{0}$
is the surface tension at the reference temperature
 $\hat{T}_{a}$
, and
$\hat{T}_{a}$
, and
 $\hat{{\it\gamma}}=-\partial \hat{{\it\sigma}}/\partial \hat{T}$
denotes its temperature-dependence coefficient. The substrate is considered to remain isothermal at temperature
$\hat{{\it\gamma}}=-\partial \hat{{\it\sigma}}/\partial \hat{T}$
denotes its temperature-dependence coefficient. The substrate is considered to remain isothermal at temperature
 $\hat{T}_{w}$
while the gas far from the drop is at temperature
$\hat{T}_{w}$
while the gas far from the drop is at temperature
 $\hat{T}_{a}$
.
$\hat{T}_{a}$
.

Figure 1. Schematic of (a) the mathematical model and (b) the experimental set-up.
The following scaling is introduced to render the flow variables dimensionless:
 $$\begin{eqnarray}\left.\begin{array}{@{}lll@{}}\hat{\boldsymbol{x}}={\hat{H}}_{0}\,\boldsymbol{x}, & \hat{\boldsymbol{u}}=\hat{U} _{0}\,\boldsymbol{u}, & \hat{p}=\hat{{\it\rho}}_{l}\hat{U} _{0}^{2}\,p,\\ \hat{T}=T{\rm\Delta}\hat{T}+\hat{T}_{a}, & \displaystyle \hat{t}=\frac{{\hat{H}}_{0}}{\hat{U} _{0}}\,t, & \hat{{\it\sigma}}=\hat{{\it\sigma}}_{0}{\it\sigma}.\end{array}\right\}\end{eqnarray}$$
Here,
 $\boldsymbol{x}=(x,\,y,\,z)$
and
$\boldsymbol{x}=(x,\,y,\,z)$
and
 $\boldsymbol{u}=(u,\,v,\,w)$
are the coordinate and velocity vectors,
$\boldsymbol{u}=(u,\,v,\,w)$
are the coordinate and velocity vectors,
 $\hat{U} _{0}=\hat{{\it\gamma}}{\rm\Delta}\hat{T}/\hat{{\it\mu}}_{l}$
represents the characteristic thermocapillary velocity with
$\hat{U} _{0}=\hat{{\it\gamma}}{\rm\Delta}\hat{T}/\hat{{\it\mu}}_{l}$
represents the characteristic thermocapillary velocity with
 ${\rm\Delta}\hat{T}=\hat{T}_{w}-\hat{T}_{a}$
,
${\rm\Delta}\hat{T}=\hat{T}_{w}-\hat{T}_{a}$
,
 $p$
is the pressure, and
$p$
is the pressure, and
 $t$
denotes the time. The physical properties of the non-condensable gas and vapour are taken into consideration via the following ratios:
$t$
denotes the time. The physical properties of the non-condensable gas and vapour are taken into consideration via the following ratios:
 $$\begin{eqnarray}\left.\begin{array}{@{}llll@{}}\displaystyle {\it\Gamma}_{{\it\rho}}=\frac{\hat{{\it\rho}}_{l}}{\hat{{\it\rho}}_{g1}}, & \displaystyle {\it\Gamma}_{{\it\mu}}=\frac{\hat{{\it\mu}}_{l}}{\hat{{\it\mu}}_{g1}}, & \displaystyle {\it\Gamma}_{k}=\frac{\hat{k}_{l}}{\hat{k}_{g1}}, & \displaystyle {\it\Gamma}_{cp}=\frac{{\hat{c}}_{pl}}{{\hat{c}}_{pg1}},\\ \displaystyle {\it\Omega}_{{\it\rho}}=\frac{\hat{{\it\rho}}_{l}}{\hat{{\it\rho}}_{g2}}, & \displaystyle {\it\Omega}_{{\it\mu}}=\frac{\hat{{\it\mu}}_{l}}{\hat{{\it\mu}}_{g2}}, & \displaystyle {\it\Omega}_{k}=\frac{\hat{k}_{l}}{\hat{k}_{g2}}, & \displaystyle {\it\Omega}_{cp}=\frac{{\hat{c}}_{pl}}{{\hat{c}}_{pg2}}.\end{array}\right\}\end{eqnarray}$$
The gas-mixture properties, denoted by
 $\hat{{\it\rho}}_{g}$
,
$\hat{{\it\rho}}_{g}$
,
 $\hat{{\it\mu}}_{g}$
,
$\hat{{\it\mu}}_{g}$
,
 $\hat{k}_{g}$
and
$\hat{k}_{g}$
and
 ${\hat{c}}_{pg}$
, depend on the relative amount of each component as follows:
${\hat{c}}_{pg}$
, depend on the relative amount of each component as follows:
 $$\begin{eqnarray}\left.\begin{array}{@{}rcl@{}}{\it\rho}_{g}\, & =\, & [{\it\Gamma}_{{\it\rho}}(1-{\it\omega})+{\it\Omega}_{{\it\rho}}{\it\omega}]^{-1},\\ {\it\mu}_{g}\, & =\, & (1-{\it\omega})/{\it\Gamma}_{{\it\mu}}+{\it\omega}/{\it\Omega}_{{\it\mu}},\\ k_{g}\, & =\, & (1-{\it\omega})/{\it\Gamma}_{k}+{\it\omega}/{\it\Omega}_{k},\\ c_{pg}\, & =\, & (1-{\it\omega})/{\it\Gamma}_{cp}+{\it\omega}/{\it\Omega}_{cp}.\end{array}\right\}\end{eqnarray}$$
The initial drop geometry (
 $H_{0}$
,
$H_{0}$
,
 $R_{0}$
) and the dimensions of the computational domain (
$R_{0}$
) and the dimensions of the computational domain (
 $L_{x}$
,
$L_{x}$
,
 $L_{y}$
,
$L_{y}$
,
 $L_{z}$
) are
$L_{z}$
) are
 $$\begin{eqnarray}H_{0}=1,\quad R_{0}=\frac{\hat{R}_{0}}{{\hat{H}}_{0}},\quad L_{x}=\frac{\hat{l}_{x}}{{\hat{H}}_{0}},\quad L_{y}=\frac{\hat{l}_{y}}{{\hat{H}}_{0}},\quad L_{z}=\frac{\hat{l}_{z}}{{\hat{H}}_{0}},\end{eqnarray}$$
where
 $\hat{l}_{x}$
,
$\hat{l}_{x}$
,
 $\hat{l}_{y}$
and
$\hat{l}_{y}$
and
 $\hat{l}_{z}$
are the width, depth and height of the computational region.
$\hat{l}_{z}$
are the width, depth and height of the computational region.
2.2. Governing equations
The fully coupled two-phase dynamics of the drop and surrounding gas is modelled via DNS with a DI method (see Anderson, McFadden & Wheeler Reference Anderson, McFadden and Wheeler1998 for a review of this methodology). According to this method, the mathematically sharp interface is replaced with an interface of finite thickness, which can be prescribed (Jacqmin Reference Jacqmin1999). We use a DI method based on that developed by Ding, Spelt & Shu (Reference Ding, Spelt and Shu2007) for pure hydrodynamic problems (following Jacqmin Reference Jacqmin1999, and Badalassi, Ceniceros & Banerjee Reference Badalassi, Ceniceros and Banerjee2003), but with a number of extensions to address non-isothermal conditions and phase change.
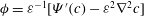
DI methods are grounded in two fundamental principles. The first was given by van der Waals (Reference van der Waals1979). If the interface between two fluids is regarded as a narrow layer of finite thickness, the volumetric free energy density
 $\hat{f}$
across it is dependent on the local composition (represented here by the order parameter
$\hat{f}$
across it is dependent on the local composition (represented here by the order parameter
 $c$
) and their gradients,
$c$
) and their gradients,
 $$\begin{eqnarray}\hat{f}=\hat{{\it\varepsilon}}^{-1}\hat{{\it\sigma}}_{0}{\it\alpha}{\it\Psi}(c)+{\textstyle \frac{1}{2}}\hat{{\it\varepsilon}}\hat{{\it\sigma}}_{0}{\it\alpha}|\hat{{\rm\nabla}}c|^{2},\end{eqnarray}$$
where
 $\hat{{\it\varepsilon}}$
is a measure of the interface thickness,
$\hat{{\it\varepsilon}}$
is a measure of the interface thickness,
 ${\it\Psi}(c)$
is the bulk energy density with minimum levels corresponding to the fluids’ two stable phases, and
${\it\Psi}(c)$
is the bulk energy density with minimum levels corresponding to the fluids’ two stable phases, and
 ${\it\alpha}$
is a dimensionless adjustment parameter. In addition, van der Waals (Reference van der Waals1979) hypothesized that equilibrium interface profiles are those that minimize the total free energy
${\it\alpha}$
is a dimensionless adjustment parameter. In addition, van der Waals (Reference van der Waals1979) hypothesized that equilibrium interface profiles are those that minimize the total free energy
 $\hat{\mathscr{F}}=\int _{{\it\Omega}}\hat{f}\,\text{d}\hat{V}$
, where
$\hat{\mathscr{F}}=\int _{{\it\Omega}}\hat{f}\,\text{d}\hat{V}$
, where
 ${\it\Omega}$
represents the interfacial domain. From the calculus of variations (Jacqmin Reference Jacqmin1999), these profiles must satisfy
${\it\Omega}$
represents the interfacial domain. From the calculus of variations (Jacqmin Reference Jacqmin1999), these profiles must satisfy
 $$\begin{eqnarray}\hat{{\it\phi}}=\hat{{\it\varepsilon}}^{-1}\hat{{\it\sigma}}_{0}{\it\alpha}{\it\Psi}^{\prime }(c)+\hat{{\it\varepsilon}}\hat{{\it\sigma}}_{0}{\it\alpha}\hat{{\rm\nabla}}^{2}c=\text{constant},\end{eqnarray}$$
where
 $\hat{{\it\phi}}=\partial \hat{\mathscr{F}}/\partial c$
is the chemical potential. The second key element of DI methods was given by Cahn & Hilliard (Reference Cahn and Hilliard1958, Reference Cahn and Hilliard1959) and Cahn (Reference Cahn1961), who extended the van der Waals hypothesis to time-dependent situations, postulating that irregular interface profiles recover equilibrium by virtue of diffusion fluxes which are proportional to chemical potential gradients. On these premises, and selecting the liquid volume fraction as an order parameter (
$\hat{{\it\phi}}=\partial \hat{\mathscr{F}}/\partial c$
is the chemical potential. The second key element of DI methods was given by Cahn & Hilliard (Reference Cahn and Hilliard1958, Reference Cahn and Hilliard1959) and Cahn (Reference Cahn1961), who extended the van der Waals hypothesis to time-dependent situations, postulating that irregular interface profiles recover equilibrium by virtue of diffusion fluxes which are proportional to chemical potential gradients. On these premises, and selecting the liquid volume fraction as an order parameter (
 $c=1$
in the liquid,
$c=1$
in the liquid,
 $c=0$
in the gas and
$c=0$
in the gas and
 $0<c<1$
in the interface region), it can be shown that the spatiotemporal evolution of
$0<c<1$
in the interface region), it can be shown that the spatiotemporal evolution of
 $c$
is governed by the phase-field, advection–diffusion Cahn–Hilliard equation (Ding et al.
Reference Ding, Spelt and Shu2007)
$c$
is governed by the phase-field, advection–diffusion Cahn–Hilliard equation (Ding et al.
Reference Ding, Spelt and Shu2007)
 $$\begin{eqnarray}\frac{\partial c}{\partial t}+\boldsymbol{{\rm\nabla}}\boldsymbol{\cdot }(c\boldsymbol{u})-\frac{1}{\mathit{Pe}}\boldsymbol{{\rm\nabla}}\boldsymbol{\cdot }(M\boldsymbol{{\rm\nabla}}{\it\phi})=0,\end{eqnarray}$$
where
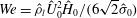
 $\mathit{Pe}=\hat{U} _{0}{\hat{H}}_{0}/(\hat{M}_{0}\hat{{\it\phi}}_{0})$
is the Péclet number,
$\mathit{Pe}=\hat{U} _{0}{\hat{H}}_{0}/(\hat{M}_{0}\hat{{\it\phi}}_{0})$
is the Péclet number,
 $M=c(1-c)$
is a diffusive coefficient referred to as ‘mobility’,
$M=c(1-c)$
is a diffusive coefficient referred to as ‘mobility’,
 ${\it\phi}={\it\varepsilon}^{-1}[{\it\Psi}^{\prime }(c)-{\it\varepsilon}^{2}{\rm\nabla}^{2}c]$
is the chemical potential, and
${\it\phi}={\it\varepsilon}^{-1}[{\it\Psi}^{\prime }(c)-{\it\varepsilon}^{2}{\rm\nabla}^{2}c]$
is the chemical potential, and
 ${\it\Psi}(c)={\textstyle \frac{1}{4}}c^{2}(1-c)^{2}$
. With appropriate boundary conditions, (2.7) conforms to a mass-conservative interface-capturing method, in which the interface profile is kept regular by means of the diffusive term. Some recent examples in which this equation has been used include droplet spreading (Ding & Spelt Reference Ding and Spelt2007a
), droplet motion under shear flow (Ding & Spelt Reference Ding and Spelt2008; Ding, Gilani & Spelt Reference Ding, Gilani and Spelt2010), and two-layer flows (Valluri et al.
Reference Valluri, Naraigh, Ding and Spelt2010).
${\it\Psi}(c)={\textstyle \frac{1}{4}}c^{2}(1-c)^{2}$
. With appropriate boundary conditions, (2.7) conforms to a mass-conservative interface-capturing method, in which the interface profile is kept regular by means of the diffusive term. Some recent examples in which this equation has been used include droplet spreading (Ding & Spelt Reference Ding and Spelt2007a
), droplet motion under shear flow (Ding & Spelt Reference Ding and Spelt2008; Ding, Gilani & Spelt Reference Ding, Gilani and Spelt2010), and two-layer flows (Valluri et al.
Reference Valluri, Naraigh, Ding and Spelt2010).
For an evaporating drop, the total mass of liquid and vapour is globally conserved, but the mass of liquid is not; this decreases in time due to the liquid-to-gas phase change. Thus, accounting for interface mass transfer requires adding an interface sink/source term in (2.7), which leads to the phase change version of the Cahn–Hilliard equation,
 $$\begin{eqnarray}\frac{\partial c}{\partial t}+\boldsymbol{{\rm\nabla}}\boldsymbol{\cdot }(c\boldsymbol{u})-\frac{1}{\mathit{Pe}}\boldsymbol{{\rm\nabla}}\boldsymbol{\cdot }(M\boldsymbol{{\rm\nabla}}{\it\phi})=-S,\end{eqnarray}$$
where
 $S$
is the volumetric interface mass-transfer rate (only computed in the interface region). The negative sign on the right-hand side of (2.8) results from our sign convention, namely
$S$
is the volumetric interface mass-transfer rate (only computed in the interface region). The negative sign on the right-hand side of (2.8) results from our sign convention, namely
 $S>0~(S<0)$
for evaporation (condensation). Following the traditional assumption that the gas at the interface is (quasi-) saturated with vapour (Deegan et al.
Reference Deegan, Bakajin, Dupont, Huber, Nagel and Witten1997; Picknett & Bexon Reference Picknett and Bexon1977; Hu & Larson Reference Hu and Larson2002; Cazabat & Guena Reference Cazabat and Guena2010), which is valid for slow evaporation cases like the one considered here,
$S>0~(S<0)$
for evaporation (condensation). Following the traditional assumption that the gas at the interface is (quasi-) saturated with vapour (Deegan et al.
Reference Deegan, Bakajin, Dupont, Huber, Nagel and Witten1997; Picknett & Bexon Reference Picknett and Bexon1977; Hu & Larson Reference Hu and Larson2002; Cazabat & Guena Reference Cazabat and Guena2010), which is valid for slow evaporation cases like the one considered here,
 $S$
is calculated as follows:
$S$
is calculated as follows:
 $$\begin{eqnarray}S=\frac{(1-c){\it\rho}_{g}}{t_{s}}\left[\frac{p_{s}}{p_{s}+\displaystyle \frac{1}{\mathscr{M}}\left(\displaystyle \frac{1}{\mathscr{P}}-p_{s}\right)}-{\it\omega}\right],\end{eqnarray}$$
where
 $p_{s}$
denotes the saturation vapour pressure,
$p_{s}$
denotes the saturation vapour pressure,
 $\mathscr{M}=\hat{M}_{g2}/\hat{M}_{g1}$
is the vapour-gas molar weight ratio,
$\mathscr{M}=\hat{M}_{g2}/\hat{M}_{g1}$
is the vapour-gas molar weight ratio,
 $\mathscr{P}=\hat{{\it\rho}}_{l}\hat{U} _{0}^{2}/\hat{p}_{r}$
, is a dimensionless group including the absolute pressure
$\mathscr{P}=\hat{{\it\rho}}_{l}\hat{U} _{0}^{2}/\hat{p}_{r}$
, is a dimensionless group including the absolute pressure
 $\hat{p}_{r}$
, and
$\hat{p}_{r}$
, and
 $t_{s}$
is a measure of interface mass-transfer rate small enough to maintain saturation condition at the interface. The first term within the brackets represents the saturation vapour mass fraction calculated using Raoult’s law and Dalton’s law of partial pressure, i.e. it is assumed that the gaseous components form an ideal mixture. The detailed justification of this expression is given in Sáenz et al. (Reference Sáenz, Valluri, Sefiane, Karapetsas and Matar2014). The saturation pressure dependence on
$t_{s}$
is a measure of interface mass-transfer rate small enough to maintain saturation condition at the interface. The first term within the brackets represents the saturation vapour mass fraction calculated using Raoult’s law and Dalton’s law of partial pressure, i.e. it is assumed that the gaseous components form an ideal mixture. The detailed justification of this expression is given in Sáenz et al. (Reference Sáenz, Valluri, Sefiane, Karapetsas and Matar2014). The saturation pressure dependence on
 $T$
is approximated with a standard Antoine expression,
$T$
is approximated with a standard Antoine expression,
 $\log _{10}(\hat{p}_{s})=\hat{A}-\hat{B}/({\hat{C}}+\hat{T})$
, where
$\log _{10}(\hat{p}_{s})=\hat{A}-\hat{B}/({\hat{C}}+\hat{T})$
, where
 $\hat{A}$
,
$\hat{A}$
,
 $\hat{B}$
and
$\hat{B}$
and
 ${\hat{C}}$
are the empirical coefficients.
${\hat{C}}$
are the empirical coefficients.
The overall mass balance is completed with the continuity equation, while the conservation of momentum is governed by the Navier–Stokes equations
 $$\begin{eqnarray}\displaystyle & \boldsymbol{{\rm\nabla}}\boldsymbol{\cdot }\boldsymbol{u}=-S(1-{\it\Omega}_{{\it\rho}}), & \displaystyle\end{eqnarray}$$
 $$\begin{eqnarray}\displaystyle & \displaystyle \frac{\partial ({\it\rho}\boldsymbol{u})}{\partial t}+\boldsymbol{{\rm\nabla}}\boldsymbol{\cdot }({\it\rho}\boldsymbol{u}\boldsymbol{u})=-\boldsymbol{{\rm\nabla}}p+\frac{1}{\mathit{Re}}\boldsymbol{{\rm\nabla}}\boldsymbol{\cdot }[{\it\mu}(\boldsymbol{{\rm\nabla}}\boldsymbol{u}+\boldsymbol{{\rm\nabla}}\boldsymbol{u}^{\text{T}})]+\frac{1}{\mathit{We}}{\it\phi}\boldsymbol{{\rm\nabla}}c-\frac{1}{\mathit{Re}}(\boldsymbol{{\rm\nabla}}_{~s}T){\it\delta},\qquad & \displaystyle\end{eqnarray}$$
 ${\it\rho}=c+{\it\rho}_{g}(1-c)$
and
${\it\rho}=c+{\it\rho}_{g}(1-c)$
and
 ${\it\mu}=c+{\it\mu}_{g}(1-c)$
are the one-fluid form of the density and viscosity respectively,
${\it\mu}=c+{\it\mu}_{g}(1-c)$
are the one-fluid form of the density and viscosity respectively,
 $\mathit{Re}=\hat{{\it\rho}}_{l}\hat{U} _{0}{\hat{H}}_{0}/\hat{{\it\mu}}_{l}$
is the Reynolds number,
$\mathit{Re}=\hat{{\it\rho}}_{l}\hat{U} _{0}{\hat{H}}_{0}/\hat{{\it\mu}}_{l}$
is the Reynolds number,
 $\mathit{We}=\hat{{\it\rho}}_{l}\hat{U} _{0}^{2}{\hat{H}}_{0}/(6\sqrt{2}\hat{{\it\sigma}}_{0})$
denotes the Weber number,
$\mathit{We}=\hat{{\it\rho}}_{l}\hat{U} _{0}^{2}{\hat{H}}_{0}/(6\sqrt{2}\hat{{\it\sigma}}_{0})$
denotes the Weber number,
 ${\it\phi}\boldsymbol{{\rm\nabla}}c$
is the DI interpretation of the mean surface tension stress enforcing (Jacqmin Reference Jacqmin1999; Ding et al.
Reference Ding, Spelt and Shu2007), and
${\it\phi}\boldsymbol{{\rm\nabla}}c$
is the DI interpretation of the mean surface tension stress enforcing (Jacqmin Reference Jacqmin1999; Ding et al.
Reference Ding, Spelt and Shu2007), and
 $(\boldsymbol{{\rm\nabla}}_{~s}T){\it\delta}$
models the thermocapillarity effect, with
$(\boldsymbol{{\rm\nabla}}_{~s}T){\it\delta}$
models the thermocapillarity effect, with
 $\boldsymbol{{\rm\nabla}}_{~s}=\boldsymbol{{\rm\nabla}}-\boldsymbol{n}(\boldsymbol{n}\boldsymbol{\cdot }\boldsymbol{{\rm\nabla}})$
being the gradient tangent to the interface,
$\boldsymbol{{\rm\nabla}}_{~s}=\boldsymbol{{\rm\nabla}}-\boldsymbol{n}(\boldsymbol{n}\boldsymbol{\cdot }\boldsymbol{{\rm\nabla}})$
being the gradient tangent to the interface,
 $\boldsymbol{n}=\boldsymbol{{\rm\nabla}}c/|\boldsymbol{{\rm\nabla}}c|$
the inwards unit vector normal to the interface, and
$\boldsymbol{n}=\boldsymbol{{\rm\nabla}}c/|\boldsymbol{{\rm\nabla}}c|$
the inwards unit vector normal to the interface, and
 ${\it\delta}=|\boldsymbol{{\rm\nabla}}c|$
. It should be noted that several authors (Jacqmin Reference Jacqmin2000; Ding & Spelt Reference Ding and Spelt2007a
; Yue, Zhou & Feng Reference Yue, Zhou and Feng2010) have already shown that the results from this DI approach converge to the sharp-interface limit in the limit of zero interfacial thickness.
${\it\delta}=|\boldsymbol{{\rm\nabla}}c|$
. It should be noted that several authors (Jacqmin Reference Jacqmin2000; Ding & Spelt Reference Ding and Spelt2007a
; Yue, Zhou & Feng Reference Yue, Zhou and Feng2010) have already shown that the results from this DI approach converge to the sharp-interface limit in the limit of zero interfacial thickness.
The conservation of energy in both phases is computed via
 $$\begin{eqnarray}\frac{\partial ({\it\rho}c_{p}T)}{\partial t}+\boldsymbol{{\rm\nabla}}\boldsymbol{\cdot }({\it\rho}c_{p}T\boldsymbol{u})=\frac{1}{\mathit{Re}\,\mathit{Pr}}\boldsymbol{{\rm\nabla}}\boldsymbol{\cdot }(k\boldsymbol{{\rm\nabla}}T)-\frac{1}{\mathit{Ja}}S.\end{eqnarray}$$
Here,
 $k=c+k_{g}(1-c)$
and
$k=c+k_{g}(1-c)$
and
 $c_{p}=(c+{\it\rho}_{g}c_{pg}(1-c))/(c+{\it\rho}_{g}(1-c))$
are the one-fluid form thermal conductivity and specific heat capacity, and
$c_{p}=(c+{\it\rho}_{g}c_{pg}(1-c))/(c+{\it\rho}_{g}(1-c))$
are the one-fluid form thermal conductivity and specific heat capacity, and
 $\mathit{Pr}=\hat{{\it\mu}}_{l}{\hat{c}}_{pl}/\hat{k}_{l}$
and
$\mathit{Pr}=\hat{{\it\mu}}_{l}{\hat{c}}_{pl}/\hat{k}_{l}$
and
 $\mathit{Ja}={\hat{c}}_{pl}{\rm\Delta}\hat{T}/{\rm\Delta}{\hat{h}}_{v}$
are the Prandtl and Jakob numbers, respectively. Finally, the vapour mass fraction,
$\mathit{Ja}={\hat{c}}_{pl}{\rm\Delta}\hat{T}/{\rm\Delta}{\hat{h}}_{v}$
are the Prandtl and Jakob numbers, respectively. Finally, the vapour mass fraction,
 ${\it\omega}$
, is governed by a general advection–diffusion transport equation only solved in the gas phase:
${\it\omega}$
, is governed by a general advection–diffusion transport equation only solved in the gas phase:
 $$\begin{eqnarray}\frac{\partial [{\it\rho}_{g}(1-c){\it\omega}]}{\partial t}+\boldsymbol{{\rm\nabla}}\boldsymbol{\cdot }[{\it\rho}_{g}(1-c){\it\omega}\boldsymbol{u}]=\frac{1}{\mathit{Re}\,\mathit{Sc}}\boldsymbol{{\rm\nabla}}\boldsymbol{\cdot }[{\it\rho}_{g}(1-c)\boldsymbol{{\rm\nabla}}{\it\omega}]+S,\end{eqnarray}$$
where
 $\mathit{Sc}=\hat{{\it\mu}}_{l}/(\hat{{\it\rho}}_{l}\hat{D})$
is the Schmidt number.
$\mathit{Sc}=\hat{{\it\mu}}_{l}/(\hat{{\it\rho}}_{l}\hat{D})$
is the Schmidt number.
2.3. Boundary and initial conditions
The boundary conditions are selected to mimic the experiments presented in § 3. The lower boundary (
 $z=0$
) is modelled as an isothermal
$z=0$
) is modelled as an isothermal
 $(T=1)$
, no-slip
$(T=1)$
, no-slip
 $(\boldsymbol{u}=0)$
solid substrate with non-penetration of mass
$(\boldsymbol{u}=0)$
solid substrate with non-penetration of mass
 $(\boldsymbol{n}_{z}\boldsymbol{\cdot }\boldsymbol{{\rm\nabla}}{\it\omega}=0)$
. Here,
$(\boldsymbol{n}_{z}\boldsymbol{\cdot }\boldsymbol{{\rm\nabla}}{\it\omega}=0)$
. Here,
 $\boldsymbol{n}_{x}$
,
$\boldsymbol{n}_{x}$
,
 $\boldsymbol{n}_{y}$
, and
$\boldsymbol{n}_{y}$
, and
 $\boldsymbol{n}_{z}$
denote the unit vectors in the principal directions. The Cahn–Hilliard equation requires the Neumann boundary condition
$\boldsymbol{n}_{z}$
denote the unit vectors in the principal directions. The Cahn–Hilliard equation requires the Neumann boundary condition
 $\boldsymbol{n}_{z}\boldsymbol{\cdot }\boldsymbol{{\rm\nabla}}{\it\phi}=0$
to guarantee the volume conservation of each fluid (Ding & Spelt Reference Ding and Spelt2007b
). Another condition on
$\boldsymbol{n}_{z}\boldsymbol{\cdot }\boldsymbol{{\rm\nabla}}{\it\phi}=0$
to guarantee the volume conservation of each fluid (Ding & Spelt Reference Ding and Spelt2007b
). Another condition on
 $c$
is necessary, this being a Dirichlet or Neumann condition in pinned or MCL configurations, respectively. A number of models have been proposed to solve the dynamics of moving contact lines, e.g. Qian, Wang & Sheng (Reference Qian, Wang and Sheng2006), Ding & Spelt (Reference Ding and Spelt2007b
), Carlson, Do-Quang & Amberg (Reference Carlson, Do-Quang and Amberg2009) and Yue et al. (Reference Yue, Zhou and Feng2010). The approach suggested by Ding & Spelt (Reference Ding and Spelt2007b
) is adopted here. The contact angle is therefore prescribed by virtue of the boundary condition
$c$
is necessary, this being a Dirichlet or Neumann condition in pinned or MCL configurations, respectively. A number of models have been proposed to solve the dynamics of moving contact lines, e.g. Qian, Wang & Sheng (Reference Qian, Wang and Sheng2006), Ding & Spelt (Reference Ding and Spelt2007b
), Carlson, Do-Quang & Amberg (Reference Carlson, Do-Quang and Amberg2009) and Yue et al. (Reference Yue, Zhou and Feng2010). The approach suggested by Ding & Spelt (Reference Ding and Spelt2007b
) is adopted here. The contact angle is therefore prescribed by virtue of the boundary condition
 $$\begin{eqnarray}\boldsymbol{n}_{w}\boldsymbol{\cdot }\boldsymbol{{\rm\nabla}}c=-\cos {\it\theta}_{s}|\boldsymbol{t}_{w}\boldsymbol{\cdot }\boldsymbol{{\rm\nabla}}c|/\sin {\it\theta}_{s},\end{eqnarray}$$
where
 ${\it\theta}_{s}$
is the microscale contact angle, and
${\it\theta}_{s}$
is the microscale contact angle, and
 $\boldsymbol{n}_{w}$
and
$\boldsymbol{n}_{w}$
and
 $\boldsymbol{t}_{w}$
are the unit vectors normal and tangential to the solid wall, respectively (Ding & Spelt Reference Ding and Spelt2007b
). It is important to emphasize that prescribing a slip velocity is unnecessary, given that the slow contact-line motion is solved by virtue of finite diffusion (Sui et al.
Reference Sui, Ding and Spelt2014). The temperature of the upper boundary
$\boldsymbol{t}_{w}$
are the unit vectors normal and tangential to the solid wall, respectively (Ding & Spelt Reference Ding and Spelt2007b
). It is important to emphasize that prescribing a slip velocity is unnecessary, given that the slow contact-line motion is solved by virtue of finite diffusion (Sui et al.
Reference Sui, Ding and Spelt2014). The temperature of the upper boundary
 $(z=L_{z})$
is set to the ambient temperature as recorded by the secondary thermocouple
$(z=L_{z})$
is set to the ambient temperature as recorded by the secondary thermocouple
 $(T=0)$
, while Neumann boundary conditions (
$(T=0)$
, while Neumann boundary conditions (
 $\boldsymbol{n}_{x}\boldsymbol{\cdot }\boldsymbol{{\rm\nabla}}T=0$
and
$\boldsymbol{n}_{x}\boldsymbol{\cdot }\boldsymbol{{\rm\nabla}}T=0$
and
 $\boldsymbol{n}_{y}\boldsymbol{\cdot }\boldsymbol{{\rm\nabla}}T=0$
) are used at the vertical walls of the computational domain (
$\boldsymbol{n}_{y}\boldsymbol{\cdot }\boldsymbol{{\rm\nabla}}T=0$
) are used at the vertical walls of the computational domain (
 $x=\pm L_{x}/2$
and
$x=\pm L_{x}/2$
and
 $y=\pm L_{y}/2$
).
$y=\pm L_{y}/2$
).
In the experimental set-up, the size of chamber was intentionally designed to be very large in comparison to that of the drop, so this would evaporate into a much larger volume of pure
 $\text{N}_{2}$
(dry gas). An approximately infinite amount of
$\text{N}_{2}$
(dry gas). An approximately infinite amount of
 $\text{N}_{2}$
surrounding the drop makes it reasonable to assume that the phase change does not result in a noteworthy increment in the bulk humidity. Thus, the zero Dirichlet boundary condition is imposed in the vertical and top boundaries (
$\text{N}_{2}$
surrounding the drop makes it reasonable to assume that the phase change does not result in a noteworthy increment in the bulk humidity. Thus, the zero Dirichlet boundary condition is imposed in the vertical and top boundaries (
 ${\it\omega}=0$
at
${\it\omega}=0$
at
 $x=\pm L_{x}/2$
,
$x=\pm L_{x}/2$
,
 $y=\pm L_{y}/2$
, and
$y=\pm L_{y}/2$
, and
 $z=L_{z}$
). Provided that the computational domain is large enough, the vapour distribution around the drop becomes independent of the far-field boundary conditions. For the same reason, it is considered that the flow far away from the drop is at rest (
$z=L_{z}$
). Provided that the computational domain is large enough, the vapour distribution around the drop becomes independent of the far-field boundary conditions. For the same reason, it is considered that the flow far away from the drop is at rest (
 $\boldsymbol{u}=0$
at
$\boldsymbol{u}=0$
at
 $x=\pm L_{x}/2$
,
$x=\pm L_{x}/2$
,
 $y=\pm L_{y}/2$
, and
$y=\pm L_{y}/2$
, and
 $z=L_{z}$
). Finally, the fact that the species equation is only solved in the gas phase requires the implicit imposition of the no-penetration condition (
$z=L_{z}$
). Finally, the fact that the species equation is only solved in the gas phase requires the implicit imposition of the no-penetration condition (
 $\boldsymbol{n}\boldsymbol{\cdot }\boldsymbol{{\rm\nabla}}{\it\omega}=0$
, and
$\boldsymbol{n}\boldsymbol{\cdot }\boldsymbol{{\rm\nabla}}{\it\omega}=0$
, and
 $\boldsymbol{n}\boldsymbol{\cdot }\boldsymbol{u}=0$
) along the species-field boundary in the liquid–gas interface (contour
$\boldsymbol{n}\boldsymbol{\cdot }\boldsymbol{u}=0$
) along the species-field boundary in the liquid–gas interface (contour
 $c=0.9$
).
$c=0.9$
).
Initial conditions are also prescribed. At
 $t=0$
, the drop is a spherical cap of height
$t=0$
, the drop is a spherical cap of height
 $H_{0}=1$
and base radius
$H_{0}=1$
and base radius
 $R_{0}$
; the two-phase flow is at rest
$R_{0}$
; the two-phase flow is at rest
 $(\boldsymbol{u}=0)$
, and the gas-mixture is completely dry
$(\boldsymbol{u}=0)$
, and the gas-mixture is completely dry
 $({\it\omega}=0)$
. The initial pressures in the gas, and within the drop are set to zero, and the Laplace pressure, respectively. In dimensionless form, the latter becomes
$({\it\omega}=0)$
. The initial pressures in the gas, and within the drop are set to zero, and the Laplace pressure, respectively. In dimensionless form, the latter becomes
 ${\rm\Delta}p=1/(3\sqrt{2}WeR_{s})$
with
${\rm\Delta}p=1/(3\sqrt{2}WeR_{s})$
with
 $R_{s}=(H_{0}^{2}+R_{0}^{2})/(2H_{0})$
. From the experiments, it is known that the chamber was allowed to reach thermal equilibrium before the drop was deposited onto the substrate, and that the liquid dosed through the pipette was pumped from a reservoir located outside the chamber and was therefore at ambient temperature. These two considerations led us to select the initial drop temperature as
$R_{s}=(H_{0}^{2}+R_{0}^{2})/(2H_{0})$
. From the experiments, it is known that the chamber was allowed to reach thermal equilibrium before the drop was deposited onto the substrate, and that the liquid dosed through the pipette was pumped from a reservoir located outside the chamber and was therefore at ambient temperature. These two considerations led us to select the initial drop temperature as
 $T=0$
, and the initial temperature of the gas as a linear distribution from the substrate to the ambient temperature, i.e.
$T=0$
, and the initial temperature of the gas as a linear distribution from the substrate to the ambient temperature, i.e.
 $T=(L_{z}-z)/L_{z}$
. Both conditions are simultaneously met with
$T=(L_{z}-z)/L_{z}$
. Both conditions are simultaneously met with
 $T=(1-c)(L_{z}-z)/L_{z}$
.
$T=(1-c)(L_{z}-z)/L_{z}$
.
2.4. Numerical method
The governing equations (2.8), (2.10)–(2.13), coupled with the volumetric interface mass-transfer rate calculated with (2.9), constitute a system of seven partial differential equations (PDEs) with seven unknowns (
 $c$
,
$c$
,
 $p$
,
$p$
,
 $u$
,
$u$
,
 $v$
,
$v$
,
 $w$
,
$w$
,
 $T$
and
$T$
and
 ${\it\omega}$
). This system of equations is simultaneously solved (DNS) with a finite-volume (FV) discretization of the physical domain by means of a staggered marker-and-cell (MAC) grid: scalar variables (
${\it\omega}$
). This system of equations is simultaneously solved (DNS) with a finite-volume (FV) discretization of the physical domain by means of a staggered marker-and-cell (MAC) grid: scalar variables (
 $c$
,
$c$
,
 $p$
,
$p$
,
 $T$
,
$T$
,
 ${\it\omega}$
) are stored in the cell centres while the velocity components (
${\it\omega}$
) are stored in the cell centres while the velocity components (
 $u$
,
$u$
,
 $v$
,
$v$
,
 $w$
) are defined at the control-volume faces. Spatial derivatives are approximated by a centred scheme. Mesh refinement tests are carried out to ensure that the results are grid-independent.
$w$
) are defined at the control-volume faces. Spatial derivatives are approximated by a centred scheme. Mesh refinement tests are carried out to ensure that the results are grid-independent.
The Cahn–Hilliard equation is solved numerically using the implicit–explicit strategy proposed by Badalassi et al. (Reference Badalassi, Ceniceros and Banerjee2003) with a second-order semi-backward difference formula (SBDF) scheme (see Ascher, Ruuth & Wetton Reference Ascher, Ruuth and Wetton1995). The convective term is explicitly computed approximating the fluxes at cell faces with an upwind (referred to the flow direction) fifth-order weighted essentially non-oscillatory (WENO) scheme (Liu, Osher & Chan Reference Liu, Osher and Chan1994) to increase the code’s stability to the shock-like nature of the
 $c$
profile across the interface (Ding et al.
Reference Ding, Spelt and Shu2007). The resolution of the velocity and pressure fields is achieved by a standard projection method, wherein the intermediate velocity (without considering
$c$
profile across the interface (Ding et al.
Reference Ding, Spelt and Shu2007). The resolution of the velocity and pressure fields is achieved by a standard projection method, wherein the intermediate velocity (without considering
 $p$
) is found with the second-order Crank–Nicolson Adams–Bashforth (CNAB) scheme to approximate the diffusive (implicitly) and advective (explicitly) terms, respectively. The pressure is then added to update the velocity to its final value ensuring that the continuity condition is satisfied. The energy and species fields are advanced in time with similar semi-implicit CNAB techniques.
$p$
) is found with the second-order Crank–Nicolson Adams–Bashforth (CNAB) scheme to approximate the diffusive (implicitly) and advective (explicitly) terms, respectively. The pressure is then added to update the velocity to its final value ensuring that the continuity condition is satisfied. The energy and species fields are advanced in time with similar semi-implicit CNAB techniques.
The solution strategy requires us to know the value of all the variables at the current time-step
 $(n)$
as well as
$(n)$
as well as
 $c$
at the previous time-step
$c$
at the previous time-step
 $(n-1)$
. The computation then proceeds by updating the volume fraction via (2.8) with
$(n-1)$
. The computation then proceeds by updating the volume fraction via (2.8) with
 $\boldsymbol{u}$
and
$\boldsymbol{u}$
and
 $S$
evaluated at
$S$
evaluated at
 $(n)$
. Equations (2.13) and (2.12) are then solved sequentially. This order results naturally from the fact that the former involves
$(n)$
. Equations (2.13) and (2.12) are then solved sequentially. This order results naturally from the fact that the former involves
 $c^{n+1}$
(to evaluate
$c^{n+1}$
(to evaluate
 ${\it\rho}_{g}$
) while the latter additionally requires
${\it\rho}_{g}$
) while the latter additionally requires
 ${\it\omega}^{n+1}$
(to evaluate
${\it\omega}^{n+1}$
(to evaluate
 ${\it\rho}$
,
${\it\rho}$
,
 $k$
and
$k$
and
 $c_{p}$
). Finally, with
$c_{p}$
). Finally, with
 $c^{n+1}$
,
$c^{n+1}$
,
 ${\it\omega}^{n+1}$
and
${\it\omega}^{n+1}$
and
 $T^{n+1}$
, the velocity is updated solving (2.10) and (2.11) with the surface tension and physical properties evaluated at
$T^{n+1}$
, the velocity is updated solving (2.10) and (2.11) with the surface tension and physical properties evaluated at
 $(n+1/2)$
, as recommended by Ding et al. (Reference Ding, Spelt and Shu2007). Following the study conducted by Ding et al. (Reference Ding, Spelt and Shu2007), the Péclet number is set to
$(n+1/2)$
, as recommended by Ding et al. (Reference Ding, Spelt and Shu2007). Following the study conducted by Ding et al. (Reference Ding, Spelt and Shu2007), the Péclet number is set to
 $\mathit{Pe}=1/{\it\varepsilon}^{2}$
, choosing
$\mathit{Pe}=1/{\it\varepsilon}^{2}$
, choosing
 ${\it\varepsilon}$
to be proportional to the grid resolution, i.e.
${\it\varepsilon}$
to be proportional to the grid resolution, i.e.
 ${\it\varepsilon}=0.5\min ({\rm\Delta}x,\,{\rm\Delta}y,\,{\rm\Delta}z)$
. This configuration leads to an interface thickness, i.e. a distance between contours of
${\it\varepsilon}=0.5\min ({\rm\Delta}x,\,{\rm\Delta}y,\,{\rm\Delta}z)$
. This configuration leads to an interface thickness, i.e. a distance between contours of
 $c=0.1$
and 0.9, of around three times the minimum grid spacing. The relevant time scales in the system are the viscous, conductive, convective, molecular diffusivity and evaporative time scales. The marching time is selected to be smaller than all of them, i.e.
$c=0.1$
and 0.9, of around three times the minimum grid spacing. The relevant time scales in the system are the viscous, conductive, convective, molecular diffusivity and evaporative time scales. The marching time is selected to be smaller than all of them, i.e.
 ${\rm\Delta}t<\min ({\rm\Delta}\hat{x}^{2}/\hat{{\it\nu}}_{l},\,{\rm\Delta}\hat{x}^{2}/\hat{{\it\alpha}}_{l},\,{\rm\Delta}\hat{x}/\hat{u} _{0},\,{\rm\Delta}\hat{x}^{2}/\hat{D},\,\hat{{\it\rho}}_{g}/{\hat{S}}_{max})/\hat{t}_{0}$
. This temporal scale is also used for
${\rm\Delta}t<\min ({\rm\Delta}\hat{x}^{2}/\hat{{\it\nu}}_{l},\,{\rm\Delta}\hat{x}^{2}/\hat{{\it\alpha}}_{l},\,{\rm\Delta}\hat{x}/\hat{u} _{0},\,{\rm\Delta}\hat{x}^{2}/\hat{D},\,\hat{{\it\rho}}_{g}/{\hat{S}}_{max})/\hat{t}_{0}$
. This temporal scale is also used for
 $t_{s}$
. The numerical method is coded in Fortran 90 for implementation on a shared-memory architecture, using Open Multi-Processing (OpenMP). The code is run on the supercomputer ARCHER (Cray XC30 Supercomputer) using a 2.7 GHz, 12-core E5-2697 v2 (Ivy Bridge) series processor for a typical simulation.
$t_{s}$
. The numerical method is coded in Fortran 90 for implementation on a shared-memory architecture, using Open Multi-Processing (OpenMP). The code is run on the supercomputer ARCHER (Cray XC30 Supercomputer) using a 2.7 GHz, 12-core E5-2697 v2 (Ivy Bridge) series processor for a typical simulation.
3. Experiments
3.1. Experimental apparatus
An experimental apparatus was designed to measure the profile of evaporating drops using optical techniques. A schematic of the set-up is presented in figure 1(b). Very small drops
 $(\hat{V}_{0}\sim 10~{\rm\mu}\text{l})$
of distilled water were gently deposited on a heated substrate, allowed to evaporate, and simultaneously recorded from the side by a CCD camera and from the top by an infrared (IR) camera. The substrate was a copper cylinder of dimensions 3.8 cm diameter and 3.8 cm length. This was maintained at constant temperature,
$(\hat{V}_{0}\sim 10~{\rm\mu}\text{l})$
of distilled water were gently deposited on a heated substrate, allowed to evaporate, and simultaneously recorded from the side by a CCD camera and from the top by an infrared (IR) camera. The substrate was a copper cylinder of dimensions 3.8 cm diameter and 3.8 cm length. This was maintained at constant temperature,
 $\hat{T}_{w}$
, by means of a cartridge heater inserted within the cylinder from below (Omega CSS-10120/120V, 20W, 2.54 cm length and 0.64 cm diameter), a PID controller
$\hat{T}_{w}$
, by means of a cartridge heater inserted within the cylinder from below (Omega CSS-10120/120V, 20W, 2.54 cm length and 0.64 cm diameter), a PID controller
 $\pm 0.2\,^{\circ }\text{C}$
(Omega CN77544-A2) and a K-type thermocouple located in a small hole 6 mm below the substrate’s upper surface. Copper and the cylinder dimensions were chosen to provide a substrate with very high thermal conductivity as well as very large thermal mass so that the surface remains isothermal throughout the evaporation process. To ensure a smooth finish, the copper substrate was progressively ground, and polished (with
$\pm 0.2\,^{\circ }\text{C}$
(Omega CN77544-A2) and a K-type thermocouple located in a small hole 6 mm below the substrate’s upper surface. Copper and the cylinder dimensions were chosen to provide a substrate with very high thermal conductivity as well as very large thermal mass so that the surface remains isothermal throughout the evaporation process. To ensure a smooth finish, the copper substrate was progressively ground, and polished (with
 $0.05~{\rm\mu}\text{m}$
colloidal alumina suspension in the final stage). The emissivities for water and polished copper are
$0.05~{\rm\mu}\text{m}$
colloidal alumina suspension in the final stage). The emissivities for water and polished copper are
 ${\it\epsilon}=0.96$
and 0.03, respectively, which results in high-contrast IR images wherein the interface temperature and contact line are sharply defined.
${\it\epsilon}=0.96$
and 0.03, respectively, which results in high-contrast IR images wherein the interface temperature and contact line are sharply defined.
The size of the drops was controlled via the pipette tip size, tube diameter, and peristaltic pump speed. In order to avoid imprecision in assessing the composition (physical properties), and relative humidity (driving force) of the air surrounding the drop, the substrate and dosing mechanism were placed within a closed, acrylic cubic chamber (dimensions
 $20\times 20\times 20~\text{cm}$
and 0.54 cm wall thickness) maintained at atmospheric pressure. A system of valves was attached to this chamber to allow the replacement of the ambient air by pure nitrogen (
$20\times 20\times 20~\text{cm}$
and 0.54 cm wall thickness) maintained at atmospheric pressure. A system of valves was attached to this chamber to allow the replacement of the ambient air by pure nitrogen (
 $\text{N}_{2}$
). The use of a closed chamber also guaranteed that the evaporation process was not distorted by externally induced convection currents and that the IR readings were not contaminated by radiation from the surroundings, since acrylic is opaque in the spectrum range of our IR camera. Inner reflections were also minimized by painting the interior of the chamber with black paint, except for two small gaps on opposite sides to allow the CCD recording and back-lighting of the drop, respectively.
$\text{N}_{2}$
). The use of a closed chamber also guaranteed that the evaporation process was not distorted by externally induced convection currents and that the IR readings were not contaminated by radiation from the surroundings, since acrylic is opaque in the spectrum range of our IR camera. Inner reflections were also minimized by painting the interior of the chamber with black paint, except for two small gaps on opposite sides to allow the CCD recording and back-lighting of the drop, respectively.
The drop profiles were captured with a CCD camera (
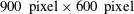 $900~\text{pixel}\times 600~\text{pixel}$
,
$900~\text{pixel}\times 600~\text{pixel}$
,
 $9~{\rm\mu}\text{m}~\text{pixel}^{-1}$
), capable of recording up to 30 frames per second (f.p.s.), connected to a video-digitizer board (frame grabber). LED back-lighting was employed to improve the video’s contrast without raising the temperature. The recorded side images were later post-processed using the Droplet Shape Analyser from Krüss (DSA v1.9, Krüss GmbH, Hamburg, Germany) in order to obtain the instantaneous height
$9~{\rm\mu}\text{m}~\text{pixel}^{-1}$
), capable of recording up to 30 frames per second (f.p.s.), connected to a video-digitizer board (frame grabber). LED back-lighting was employed to improve the video’s contrast without raising the temperature. The recorded side images were later post-processed using the Droplet Shape Analyser from Krüss (DSA v1.9, Krüss GmbH, Hamburg, Germany) in order to obtain the instantaneous height
 ${\hat{H}}$
, contact angle
${\hat{H}}$
, contact angle
 ${\it\theta}$
, base radius
${\it\theta}$
, base radius
 $\hat{R}$
and volume
$\hat{R}$
and volume
 $\hat{V}$
throughout the evaporation process. Simultaneously, a midwave IR camera mounted directly above the substrate and facing vertically downwards onto the drop (FLIR Silver SC5600, spectrum range
$\hat{V}$
throughout the evaporation process. Simultaneously, a midwave IR camera mounted directly above the substrate and facing vertically downwards onto the drop (FLIR Silver SC5600, spectrum range
 $3{-}5~{\rm\mu}\text{m}$
,
$3{-}5~{\rm\mu}\text{m}$
,
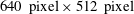 $640~\text{pixel}\times 512~\text{pixel}$
, 100 f.p.s.) was used to record the interface temperature field and contact-line dynamics.
$640~\text{pixel}\times 512~\text{pixel}$
, 100 f.p.s.) was used to record the interface temperature field and contact-line dynamics.
A cylindrical black body, as described in Kim et al. (Reference Kim, Kommer, Dessiatoun and Kim2012), was used to calibrate the IR readings. Before every experimental run,
 $\text{N}_{2}$
was blown through the chamber for a sufficiently long period of time to make sure that this was the only gas present within the test cell. The inlet and outlet valves were then closed and the system was allowed to reach equilibrium. Steady state was recognized by means of a secondary thermocouple located in the gas, 3.5 cm above the heated substrate, which also provided the real ‘bulk’ or ‘ambient’ temperature,
$\text{N}_{2}$
was blown through the chamber for a sufficiently long period of time to make sure that this was the only gas present within the test cell. The inlet and outlet valves were then closed and the system was allowed to reach equilibrium. Steady state was recognized by means of a secondary thermocouple located in the gas, 3.5 cm above the heated substrate, which also provided the real ‘bulk’ or ‘ambient’ temperature,
 $\hat{T}_{a}$
. Only after the system reached equilibrium, detected when
$\hat{T}_{a}$
. Only after the system reached equilibrium, detected when
 $\hat{T}_{a}$
became steady, was a single drop released onto the heated surface and the recording process started. This procedure was repeated for every drop in this investigation to ensure consistency.
$\hat{T}_{a}$
became steady, was a single drop released onto the heated surface and the recording process started. This procedure was repeated for every drop in this investigation to ensure consistency.
3.2. Results
The evaporation of water drops on a heated copper substrate is presented for
 $\hat{T}_{w}=40,55$
, and
$\hat{T}_{w}=40,55$
, and
 $70\,^{\circ }\text{C}$
. The average initial volume and contact angle were
$70\,^{\circ }\text{C}$
. The average initial volume and contact angle were
 $\hat{V}_{0}=10.4~{\rm\mu}\text{l}\pm 4.7\,\%$
and
$\hat{V}_{0}=10.4~{\rm\mu}\text{l}\pm 4.7\,\%$
and
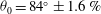 ${\it\theta}_{0}=84^{\circ }\pm 1.6\,\%$
, respectively. This led to drops whose initial height and base radius were
${\it\theta}_{0}=84^{\circ }\pm 1.6\,\%$
, respectively. This led to drops whose initial height and base radius were
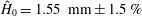 ${\hat{H}}_{0}=1.55~\text{mm}\pm 1.5\,\%$
and
${\hat{H}}_{0}=1.55~\text{mm}\pm 1.5\,\%$
and
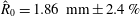 $\hat{R}_{0}=1.86~\text{mm}\pm 2.4\,\%$
, respectively. Drops outside this range of parameters were dismissed. For each value of
$\hat{R}_{0}=1.86~\text{mm}\pm 2.4\,\%$
, respectively. Drops outside this range of parameters were dismissed. For each value of
 $\hat{T}_{w}$
, the experiment was repeated at least five times to ensure reproducibility. Under terrestrial gravity, the capillary length
$\hat{T}_{w}$
, the experiment was repeated at least five times to ensure reproducibility. Under terrestrial gravity, the capillary length
 $\hat{{\it\lambda}}_{c}=\sqrt{\hat{{\it\sigma}}_{0}/{\hat{g}}\hat{{\it\rho}}_{l}}$
for water is 2.73 mm. Since
$\hat{{\it\lambda}}_{c}=\sqrt{\hat{{\it\sigma}}_{0}/{\hat{g}}\hat{{\it\rho}}_{l}}$
for water is 2.73 mm. Since
 ${\hat{H}}_{0}$
is well below
${\hat{H}}_{0}$
is well below
 $\hat{{\it\lambda}}_{c}$
, it may be concluded that capillary stresses are dominant over gravity forces and therefore the drops take the shape of spherical caps. The same conclusion is drawn by examining the static Bond number
$\hat{{\it\lambda}}_{c}$
, it may be concluded that capillary stresses are dominant over gravity forces and therefore the drops take the shape of spherical caps. The same conclusion is drawn by examining the static Bond number
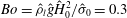 $Bo=\hat{{\it\rho}}_{l}{\hat{g}}{\hat{H}}_{0}^{2}/\hat{{\it\sigma}}_{0}=0.3$
, which, given its small value, denotes the dominance of surface tension. The analysis of the drop profiles recorded by the CCD camera allowed us to estimate quantitatively the effect of gravity in a maximum
$Bo=\hat{{\it\rho}}_{l}{\hat{g}}{\hat{H}}_{0}^{2}/\hat{{\it\sigma}}_{0}=0.3$
, which, given its small value, denotes the dominance of surface tension. The analysis of the drop profiles recorded by the CCD camera allowed us to estimate quantitatively the effect of gravity in a maximum
 ${\it\theta}$
deviation of
${\it\theta}$
deviation of
 $4^{\circ }~(\hat{t}=0)$
between the typical experimental drop
$4^{\circ }~(\hat{t}=0)$
between the typical experimental drop
 $({\it\theta}_{0}=84^{\circ })$
and a perfect spherical cap with the same
$({\it\theta}_{0}=84^{\circ })$
and a perfect spherical cap with the same
 $\hat{V}$
and
$\hat{V}$
and
 $\hat{R}~({\it\theta}_{0}=80^{\circ })$
. Note that this deviation is further minimized in time given that
$\hat{R}~({\it\theta}_{0}=80^{\circ })$
. Note that this deviation is further minimized in time given that
 ${\hat{H}}$
decreases due to evaporation.
${\hat{H}}$
decreases due to evaporation.
Independently of
 $\hat{T}_{w}$
, the typical evaporation process comprises two well-defined stages, as shown in figure 2. Initially, and for most of their lifetime, all drops evaporate according to the CR mode. Both CCD and IR recordings show that the contact line remains circular in its original position while
$\hat{T}_{w}$
, the typical evaporation process comprises two well-defined stages, as shown in figure 2. Initially, and for most of their lifetime, all drops evaporate according to the CR mode. Both CCD and IR recordings show that the contact line remains circular in its original position while
 ${\hat{H}}$
and
${\hat{H}}$
and
 ${\it\theta}$
progressively decrease (see figure 2
a–c). This first stage is followed by a second phase wherein the drop evaporates according to the SS mode. Once the contact angle reaches a certain critical value
${\it\theta}$
progressively decrease (see figure 2
a–c). This first stage is followed by a second phase wherein the drop evaporates according to the SS mode. Once the contact angle reaches a certain critical value
 ${\it\theta}={\it\theta}_{c}$
, the drop experiences a sudden readjustment process to regain equilibrium in which its contact surface undergoes a significant reduction (see figure 2
c,d). Normally, a segment of the triple line depins (bottom-right section in figure 2
d) while the rest remains anchored to its original location (top-left section in figure 2
d). The location of the pinned section appears to be random and is related to microscopic surface heterogeneities in the surface roughness. This stick–slip process usually repeats itself several times before the drop dries out. Once the depinning of the contact line takes place for the first time, interface sphericity is lost for all the cases studied. These observations are in line with the previous studies available in the literature, e.g. Crafton & Black (Reference Crafton and Black2004), Orejon et al. (Reference Orejon, Sefiane and Shanahan2011), Shanahan et al. (Reference Shanahan, Sefiane and Moffat2011) or Nguyen et al. (Reference Nguyen, Nguyen, Hampton, Xu, Huang and Rudolph2012).
${\it\theta}={\it\theta}_{c}$
, the drop experiences a sudden readjustment process to regain equilibrium in which its contact surface undergoes a significant reduction (see figure 2
c,d). Normally, a segment of the triple line depins (bottom-right section in figure 2
d) while the rest remains anchored to its original location (top-left section in figure 2
d). The location of the pinned section appears to be random and is related to microscopic surface heterogeneities in the surface roughness. This stick–slip process usually repeats itself several times before the drop dries out. Once the depinning of the contact line takes place for the first time, interface sphericity is lost for all the cases studied. These observations are in line with the previous studies available in the literature, e.g. Crafton & Black (Reference Crafton and Black2004), Orejon et al. (Reference Orejon, Sefiane and Shanahan2011), Shanahan et al. (Reference Shanahan, Sefiane and Moffat2011) or Nguyen et al. (Reference Nguyen, Nguyen, Hampton, Xu, Huang and Rudolph2012).

Figure 2. Evaporation of a water drop into
 $\text{N}_{2}$
simultaneously recorded with a CCD camera from the side (top row) and with an IR camera from the top (bottom row) with
$\text{N}_{2}$
simultaneously recorded with a CCD camera from the side (top row) and with an IR camera from the top (bottom row) with
 $\hat{T}_{w}=40\,^{\circ }\text{C}$
and
$\hat{T}_{w}=40\,^{\circ }\text{C}$
and
 ${\rm\Delta}\hat{T}=14.6\,^{\circ }\text{C}$
. The typical evaporation time is
${\rm\Delta}\hat{T}=14.6\,^{\circ }\text{C}$
. The typical evaporation time is
 $\hat{t}_{tot}=835~\text{s}$
(
$\hat{t}_{tot}=835~\text{s}$
(
 $t/t_{tot}=0$
(a), 0.40 (b), 0.80 (c), 0.85 (d)).
$t/t_{tot}=0$
(a), 0.40 (b), 0.80 (c), 0.85 (d)).
The IR recordings reveal that the interface temperature follows a concentric distribution, from a value close to
 $\hat{T}_{w}$
near the contact line to a colder
$\hat{T}_{w}$
near the contact line to a colder
 $\hat{T}$
at the apex (see figure 2 bottom). The dot observed at the centre of the interface is the reflection of the IR camera. No thermal motion in either the azimuthal or the radial direction is observed. This is in agreement with the work by Sefiane et al. (Reference Sefiane, Moffat, Matar and Craster2008), who discovered significant temperature instabilities in drops of ethanol, methanol, and FC-72, but not water. The difference between the interface and substrate temperature is maximum at the start of the experiment. As the drop evaporates and
$\hat{T}$
at the apex (see figure 2 bottom). The dot observed at the centre of the interface is the reflection of the IR camera. No thermal motion in either the azimuthal or the radial direction is observed. This is in agreement with the work by Sefiane et al. (Reference Sefiane, Moffat, Matar and Craster2008), who discovered significant temperature instabilities in drops of ethanol, methanol, and FC-72, but not water. The difference between the interface and substrate temperature is maximum at the start of the experiment. As the drop evaporates and
 ${\hat{H}}$
decreases, the radial temperature gradient becomes less pronounced until the interface temperature eventually increases to almost reach
${\hat{H}}$
decreases, the radial temperature gradient becomes less pronounced until the interface temperature eventually increases to almost reach
 $\hat{T}_{w}$
(figure 2
c). Hence, the Marangoni flow within the drop weakens as the drop becomes thinner, given that the radial temperature gradient is the driving force. The readings of the secondary thermocouple, located above the drop, indicate that ambient temperature
$\hat{T}_{w}$
(figure 2
c). Hence, the Marangoni flow within the drop weakens as the drop becomes thinner, given that the radial temperature gradient is the driving force. The readings of the secondary thermocouple, located above the drop, indicate that ambient temperature
 $\hat{T}_{a}$
is not constant as is often assumed. The temperature
$\hat{T}_{a}$
is not constant as is often assumed. The temperature
 $\hat{T}_{a}$
rises with
$\hat{T}_{a}$
rises with
 $\hat{T}_{w}$
, which means that the effective temperature difference in the vertical direction,
$\hat{T}_{w}$
, which means that the effective temperature difference in the vertical direction,
 ${\rm\Delta}\hat{T}=\hat{T}_{w}-\hat{T}_{a}$
, is, in general, smaller than when this is evaluated with a fixed room temperature. In our experiments,
${\rm\Delta}\hat{T}=\hat{T}_{w}-\hat{T}_{a}$
, is, in general, smaller than when this is evaluated with a fixed room temperature. In our experiments,
 $\hat{T}_{a}=25.4\,^{\circ }\text{C}\,({\rm\Delta}\hat{T}=14.6\,^{\circ }\text{C})$
,
$\hat{T}_{a}=25.4\,^{\circ }\text{C}\,({\rm\Delta}\hat{T}=14.6\,^{\circ }\text{C})$
,
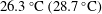 $26.3\,^{\circ }\text{C}\,(28.7\,^{\circ }\text{C})$
, and
$26.3\,^{\circ }\text{C}\,(28.7\,^{\circ }\text{C})$
, and
 $30.2\,^{\circ }\text{C}\,(39.8\,^{\circ }\text{C})$
for
$30.2\,^{\circ }\text{C}\,(39.8\,^{\circ }\text{C})$
for
 $\hat{T}_{w}=40,\,55$
, and
$\hat{T}_{w}=40,\,55$
, and
 $70\,^{\circ }\text{C}$
, respectively. These readings are used in the accompanying simulations to model the surrounding gas more realistically.
$70\,^{\circ }\text{C}$
, respectively. These readings are used in the accompanying simulations to model the surrounding gas more realistically.
The evolution in time of
 ${\it\theta}$
,
${\it\theta}$
,
 ${\hat{H}}$
,
${\hat{H}}$
,
 $\hat{R}$
, and
$\hat{R}$
, and
 $\hat{V}$
over the range of
$\hat{V}$
over the range of
 $\hat{T}_{w}$
is depicted in figure 3. The evaporation time required for complete dry-out decreases with increasing
$\hat{T}_{w}$
is depicted in figure 3. The evaporation time required for complete dry-out decreases with increasing
 $\hat{T}_{w}$
:
$\hat{T}_{w}$
:
 $\hat{t}_{tot}=835$
, 354, and 180 s for
$\hat{t}_{tot}=835$
, 354, and 180 s for
 $\hat{T}_{w}=40,\,55$
, and
$\hat{T}_{w}=40,\,55$
, and
 $70\,^{\circ }\text{C}$
, respectively, with a standard deviation
$70\,^{\circ }\text{C}$
, respectively, with a standard deviation
 ${<}7\,\%$
in all cases. The initial (equilibrium) contact angle
${<}7\,\%$
in all cases. The initial (equilibrium) contact angle
 ${\it\theta}_{0}=84\pm 1.6^{\circ }$
seems weakly affected by
${\it\theta}_{0}=84\pm 1.6^{\circ }$
seems weakly affected by
 $\hat{T}_{w}$
; slightly larger degrees of hydrophobicity are found with colder substrates, which is due to a decrease of surface tension with temperature. A similar but significantly more pronounced variation in
$\hat{T}_{w}$
; slightly larger degrees of hydrophobicity are found with colder substrates, which is due to a decrease of surface tension with temperature. A similar but significantly more pronounced variation in
 ${\it\theta}_{0}$
due to
${\it\theta}_{0}$
due to
 $\hat{T}_{w}$
was observed by Mollaret et al. (Reference Mollaret, Sefiane, Christy and Veyret2004) with water on aluminium. Figure 3(a) shows that
$\hat{T}_{w}$
was observed by Mollaret et al. (Reference Mollaret, Sefiane, Christy and Veyret2004) with water on aluminium. Figure 3(a) shows that
 ${\it\theta}$
decreases at a progressively increasing rate until the three-dimensional motion of the drop begins to recover equilibrium at a new position. Simultaneously,
${\it\theta}$
decreases at a progressively increasing rate until the three-dimensional motion of the drop begins to recover equilibrium at a new position. Simultaneously,
 ${\hat{H}}$
registers an equivalent type of non-linear evolution: see figure 3(b). At higher
${\hat{H}}$
registers an equivalent type of non-linear evolution: see figure 3(b). At higher
 $\hat{T}_{w}$
, the transition from the initial CR to the final SS mode is very well defined. This occurs at
$\hat{T}_{w}$
, the transition from the initial CR to the final SS mode is very well defined. This occurs at
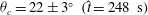 ${\it\theta}_{c}=22\pm 3^{\circ }~(\hat{t}=248~\text{s})$
and
${\it\theta}_{c}=22\pm 3^{\circ }~(\hat{t}=248~\text{s})$
and
 $26\pm 3^{\circ }$
(125 s) for
$26\pm 3^{\circ }$
(125 s) for
 $\hat{T}_{w}=55$
and
$\hat{T}_{w}=55$
and
 $70\,^{\circ }\text{C}$
, respectively, which compares well with the
$70\,^{\circ }\text{C}$
, respectively, which compares well with the
 $20{-}40^{\circ }$
range reported by Crafton & Black (Reference Crafton and Black2004) for
$20{-}40^{\circ }$
range reported by Crafton & Black (Reference Crafton and Black2004) for
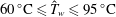 $60\,^{\circ }\text{C}\leqslant \hat{T}_{w}\leqslant 95\,^{\circ }\text{C}$
. However, when the substrate is colder,
$60\,^{\circ }\text{C}\leqslant \hat{T}_{w}\leqslant 95\,^{\circ }\text{C}$
. However, when the substrate is colder,
 $\hat{T}_{w}=40\,^{\circ }\text{C}$
, the drop goes through a transition stage wherein the evaporation mechanism is actually a combined mode. This occurs just before the first contact-line jump at
$\hat{T}_{w}=40\,^{\circ }\text{C}$
, the drop goes through a transition stage wherein the evaporation mechanism is actually a combined mode. This occurs just before the first contact-line jump at
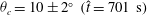 ${\it\theta}_{c}=10\pm 2^{\circ }~(\hat{t}=701~\text{s})$
. Figure 3(a,c) illustrates how both
${\it\theta}_{c}=10\pm 2^{\circ }~(\hat{t}=701~\text{s})$
. Figure 3(a,c) illustrates how both
 ${\it\theta}$
and
${\it\theta}$
and
 $\hat{R}$
decrease simultaneously between
$\hat{R}$
decrease simultaneously between
 $\hat{t}\sim 580{-}701~\text{s}$
, which suggests that this intermediate stage fits neither the CR nor the CA pure modes of evaporation. Thus, the transition from the CR to the SS mode is not instantaneous as for
$\hat{t}\sim 580{-}701~\text{s}$
, which suggests that this intermediate stage fits neither the CR nor the CA pure modes of evaporation. Thus, the transition from the CR to the SS mode is not instantaneous as for
 $\hat{T}_{w}=55$
or
$\hat{T}_{w}=55$
or
 $70\,^{\circ }\text{C}$
. This behaviour was observed in all five runs.
$70\,^{\circ }\text{C}$
. This behaviour was observed in all five runs.

Figure 3. Instantaneous evolution of (a) contact angle
 ${\it\theta}$
, (b) maximum height
${\it\theta}$
, (b) maximum height
 ${\hat{H}}$
, (c) contact radius
${\hat{H}}$
, (c) contact radius
 $\hat{R}$
and (d) volume
$\hat{R}$
and (d) volume
 $\hat{V}$
for a water drop evaporating into
$\hat{V}$
for a water drop evaporating into
 $\text{N}_{2}$
placed on a heated substrate at various temperatures
$\text{N}_{2}$
placed on a heated substrate at various temperatures
 $\hat{T}_{w}$
.
$\hat{T}_{w}$
.
While the drop is pinned, the instantaneous
 $\hat{V}$
is essentially linear for any
$\hat{V}$
is essentially linear for any
 $\hat{T}_{w}$
: see figure 3(d). Hence, the resulting evaporation rate,
$\hat{T}_{w}$
: see figure 3(d). Hence, the resulting evaporation rate,
 $\hat{m}(\hat{t})=-\text{d}\hat{V}/\text{d}\hat{t}$
, is almost constant in the CR mode, which is in agreement with previous works, e.g. Picknett & Bexon (Reference Picknett and Bexon1977), Bourgès-Monnier & Shanahan (Reference Bourgès-Monnier and Shanahan1995), Mollaret et al. (Reference Mollaret, Sefiane, Christy and Veyret2004), Cazabat & Guena (Reference Cazabat and Guena2010) and Shanahan et al. (Reference Shanahan, Sefiane and Moffat2011). During this phase, the experiments show that the average evaporation rate is
$\hat{m}(\hat{t})=-\text{d}\hat{V}/\text{d}\hat{t}$
, is almost constant in the CR mode, which is in agreement with previous works, e.g. Picknett & Bexon (Reference Picknett and Bexon1977), Bourgès-Monnier & Shanahan (Reference Bourgès-Monnier and Shanahan1995), Mollaret et al. (Reference Mollaret, Sefiane, Christy and Veyret2004), Cazabat & Guena (Reference Cazabat and Guena2010) and Shanahan et al. (Reference Shanahan, Sefiane and Moffat2011). During this phase, the experiments show that the average evaporation rate is
 $\hat{m}(\hat{t})=0.0135\pm 7.5\times 10^{-4}$
,
$\hat{m}(\hat{t})=0.0135\pm 7.5\times 10^{-4}$
,
 $0.0340\pm 1.4\times 10^{-3}$
, and
$0.0340\pm 1.4\times 10^{-3}$
, and
 $0.0698\pm 1.8\times 10^{-3}~{\rm\mu}\text{l}~\text{s}^{-1}$
for
$0.0698\pm 1.8\times 10^{-3}~{\rm\mu}\text{l}~\text{s}^{-1}$
for
 $\hat{T}_{w}=40,55$
, and
$\hat{T}_{w}=40,55$
, and
 $70\,^{\circ }\text{C}$
, respectively. Deviations from the linear behaviour of
$70\,^{\circ }\text{C}$
, respectively. Deviations from the linear behaviour of
 $\hat{m}(\hat{t})$
are noted with
$\hat{m}(\hat{t})$
are noted with
 $\hat{T}_{w}=40\,^{\circ }\text{C}$
when the drop is subjected to the combined evaporation mode,
$\hat{T}_{w}=40\,^{\circ }\text{C}$
when the drop is subjected to the combined evaporation mode,
 $\hat{t}\sim 580{-}701~\text{s}$
. In all cases, after the contact-line readjustment,
$\hat{t}\sim 580{-}701~\text{s}$
. In all cases, after the contact-line readjustment,
 $\hat{m}(\hat{t})$
is lower than that prior to the drop depinning because the contact line length and the liquid–gas interfacial area have decreased.
$\hat{m}(\hat{t})$
is lower than that prior to the drop depinning because the contact line length and the liquid–gas interfacial area have decreased.
4. Axisymmetric drops: model validation
We start the modelling work by considering axisymmetric pinned drops, i.e. CR mode. This is consistent with the evaporation process observed during most of the drop’s lifetime (70 %). In all cases investigated experimentally (figure 3), the maximum deviation
 $(\hat{R}_{0}-\hat{R})/\hat{R}_{0}$
after this time is
$(\hat{R}_{0}-\hat{R})/\hat{R}_{0}$
after this time is
 ${\leqslant}3\,\%$
, and is therefore assumed to be negligible in order to keep the mathematical problem as simple as possible. The initial height and base radius of the drop for the simulations are those from the experiments, i.e.
${\leqslant}3\,\%$
, and is therefore assumed to be negligible in order to keep the mathematical problem as simple as possible. The initial height and base radius of the drop for the simulations are those from the experiments, i.e.
 ${\hat{H}}_{0}=1.55~\text{mm}~(H_{0}=1)$
and
${\hat{H}}_{0}=1.55~\text{mm}~(H_{0}=1)$
and
 $\hat{R}_{0}=1.86~\text{mm}~(R_{0}=1.2)$
, respectively. In what follows, the discussion is restricted to drops at moderate heating, i.e.
$\hat{R}_{0}=1.86~\text{mm}~(R_{0}=1.2)$
, respectively. In what follows, the discussion is restricted to drops at moderate heating, i.e.
 $\hat{T}_{w}=40\,^{\circ }\text{C}$
and
$\hat{T}_{w}=40\,^{\circ }\text{C}$
and
 ${\rm\Delta}\hat{T}=14.6\,^{\circ }\text{C}$
, for the most part.
${\rm\Delta}\hat{T}=14.6\,^{\circ }\text{C}$
, for the most part.
The physical properties of distilled water and nitrogen are listed in table 1. In the range considered, the variations of these properties due to
 $\hat{T}$
are negligible for the liquid (
$\hat{T}$
are negligible for the liquid (
 ${<}3\,\%$
) and gases (
${<}3\,\%$
) and gases (
 ${<}5\,\%$
) with the exception of the coefficient of binary mass diffusion
${<}5\,\%$
) with the exception of the coefficient of binary mass diffusion
 $\hat{D}$
(13 % higher at
$\hat{D}$
(13 % higher at
 $40\,^{\circ }\text{C}$
) and liquid viscosity
$40\,^{\circ }\text{C}$
) and liquid viscosity
 $\hat{{\it\mu}}_{l}$
(27 % lower). For the former, we employ the corrected value given that the evaporation rate
$\hat{{\it\mu}}_{l}$
(27 % lower). For the former, we employ the corrected value given that the evaporation rate
 $\hat{m}(\hat{t})$
is very sensitive to it. For the latter, our tests show that reducing
$\hat{m}(\hat{t})$
is very sensitive to it. For the latter, our tests show that reducing
 $\hat{{\it\mu}}_{l}$
increases exponentially the computational difficulty of the problem without revealing any significant changes in the two-phase dynamics of the flow for the purpose of this investigation. Note that
$\hat{{\it\mu}}_{l}$
increases exponentially the computational difficulty of the problem without revealing any significant changes in the two-phase dynamics of the flow for the purpose of this investigation. Note that
 $\hat{{\it\mu}}_{l}^{2}$
appears in the denominator of
$\hat{{\it\mu}}_{l}^{2}$
appears in the denominator of
 $\mathit{Re}$
. This also provides a rationale for focusing on moderate heating. The governing dimensionless groups become
$\mathit{Re}$
. This also provides a rationale for focusing on moderate heating. The governing dimensionless groups become
 $\mathit{Re}=4830$
,
$\mathit{Re}=4830$
,
 $\mathit{We}=19.4$
,
$\mathit{We}=19.4$
,
 $\mathit{Pr}=6.1$
,
$\mathit{Pr}=6.1$
,
 $\mathit{Ja}=0.025$
,
$\mathit{Ja}=0.025$
,
 $\mathit{Sc}=0.032$
,
$\mathit{Sc}=0.032$
,
 ${\it\Gamma}_{{\it\rho}}=870$
,
${\it\Gamma}_{{\it\rho}}=870$
,
 ${\it\Gamma}_{{\it\mu}}=50$
,
${\it\Gamma}_{{\it\mu}}=50$
,
 ${\it\Gamma}_{k}=24$
,
${\it\Gamma}_{k}=24$
,
 ${\it\Gamma}_{cp}=4$
,
${\it\Gamma}_{cp}=4$
,
 ${\it\Omega}_{{\it\rho}}=1350$
,
${\it\Omega}_{{\it\rho}}=1350$
,
 ${\it\Omega}_{{\it\mu}}=90$
,
${\it\Omega}_{{\it\mu}}=90$
,
 ${\it\Omega}_{k}=33$
,
${\it\Omega}_{k}=33$
,
 ${\it\Omega}_{cp}=2.2$
,
${\it\Omega}_{cp}=2.2$
,
 $\mathscr{M}=6.433\times 10^{-1}$
, and
$\mathscr{M}=6.433\times 10^{-1}$
, and
 $\mathscr{P}=7.632\times 10^{-2}$
. These dimensionless numbers are maintained for the simulation of non-spherical drops presented in § 5 as well as for the drops evaporating with a moving contact line examined in § 6.
$\mathscr{P}=7.632\times 10^{-2}$
. These dimensionless numbers are maintained for the simulation of non-spherical drops presented in § 5 as well as for the drops evaporating with a moving contact line examined in § 6.
Table 1. Physical properties of distilled water (liquid and vapour) and nitrogen gas at
 $\hat{T}=25\,^{\circ }\text{C}$
. The empirical coefficients for the Antoine equation
$\hat{T}=25\,^{\circ }\text{C}$
. The empirical coefficients for the Antoine equation
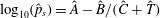 $\log _{10}(\hat{p}_{s})=\hat{A}-\hat{B}/({\hat{C}}+\hat{T})$
, with
$\log _{10}(\hat{p}_{s})=\hat{A}-\hat{B}/({\hat{C}}+\hat{T})$
, with
 $\hat{p}_{s}$
in (Pa) and
$\hat{p}_{s}$
in (Pa) and
 $\hat{T}$
in (
$\hat{T}$
in (
 $^{\circ }\text{C}$
), are
$^{\circ }\text{C}$
), are
 $\hat{A}=8.0557$
,
$\hat{A}=8.0557$
,
 $\hat{B}=1723.6$
, and
$\hat{B}=1723.6$
, and
 ${\hat{C}}=233.08$
.
${\hat{C}}=233.08$
.

 $\text{}^{a}$
Updated for
$\text{}^{a}$
Updated for
 $\hat{T}=40\,^{\circ }\text{C}$
.
$\hat{T}=40\,^{\circ }\text{C}$
.
When selecting the domain size, it must be noted that
 $m(t)$
decreases asymptotically for increasing size. We conducted tests with
$m(t)$
decreases asymptotically for increasing size. We conducted tests with
 $L_{r}=L_{z}=10R_{0}$
,
$L_{r}=L_{z}=10R_{0}$
,
 $20R_{0}$
,
$20R_{0}$
,
 $50R_{0}$
, and
$50R_{0}$
, and
 $100R_{0}$
, where
$100R_{0}$
, where
 $L_{r}$
and
$L_{r}$
and
 $L_{z}$
are the two-dimensional domain components in the radial and axial directions, respectively. Taking the previous smaller domain as reference,
$L_{z}$
are the two-dimensional domain components in the radial and axial directions, respectively. Taking the previous smaller domain as reference,
 $m(t)$
decreases
$m(t)$
decreases
 $3.7\,\%$
,
$3.7\,\%$
,
 $1.5\,\%$
, and
$1.5\,\%$
, and
 ${\sim}0\,\%$
for
${\sim}0\,\%$
for
 $20R_{0}$
,
$20R_{0}$
,
 $50R_{0}$
, and
$50R_{0}$
, and
 $100R_{0}$
, respectively. The
$100R_{0}$
, respectively. The
 $m(t)$
variation from
$m(t)$
variation from
 $20R_{0}$
to
$20R_{0}$
to
 $50R_{0}~(1.5\,\%)$
is acceptable, so we selected
$50R_{0}~(1.5\,\%)$
is acceptable, so we selected
 $L_{r}=L_{z}=20R_{0}$
for our simulations in order to minimize the computational cost. Thus the domain size is much larger than the drop and the evaporation process becomes independent of the vertical and upper boundary conditions. Note that Hu & Larson (Reference Hu and Larson2002) arrived at the same conclusion in terms of the domain size for the non-heated case. The domain is discretized by means of a structured mesh of
$L_{r}=L_{z}=20R_{0}$
for our simulations in order to minimize the computational cost. Thus the domain size is much larger than the drop and the evaporation process becomes independent of the vertical and upper boundary conditions. Note that Hu & Larson (Reference Hu and Larson2002) arrived at the same conclusion in terms of the domain size for the non-heated case. The domain is discretized by means of a structured mesh of
 $250\times 250$
elements with finer and uniform resolution around the drop, i.e.
$250\times 250$
elements with finer and uniform resolution around the drop, i.e.
 $125\times 125$
for
$125\times 125$
for
 $r,z<1.5R_{0}$
, and geometrically decreasing resolution for increasing
$r,z<1.5R_{0}$
, and geometrically decreasing resolution for increasing
 $r$
and
$r$
and
 $z$
, with common ratio 1.0321. This grid is chosen based on the results from mesh dependence tests. The selected time-step size is
$z$
, with common ratio 1.0321. This grid is chosen based on the results from mesh dependence tests. The selected time-step size is
 ${\rm\Delta}t=5\times 10^{-3}$
. The discussion continues in the dimensionless framework in the following sections.
${\rm\Delta}t=5\times 10^{-3}$
. The discussion continues in the dimensionless framework in the following sections.
4.1. Comparisons with experiments
The validation of the numerical solutions is more challenging than in the non-heated configuration. This is not only because of the notable numerical difficulty associated with solving seven fully coupled non-linear PDEs, but also due to the large thermal gradients arising at the interface. Given that
 $p_{s}$
grows exponentially with
$p_{s}$
grows exponentially with
 $T$
, deviations as small as
$T$
, deviations as small as
 $\pm 2\,^{\circ }\text{C}$
at high temperatures lead to substantial changes in
$\pm 2\,^{\circ }\text{C}$
at high temperatures lead to substantial changes in
 $m(t)$
.
$m(t)$
.
Initially, the flow undergoes a transient process wherein the drop heats up and the vapour disperses in the gas. Simultaneously, the Marangoni effect drives fluid from the contact-line region (hot) towards the apex (cold) and therefore induces convection currents in both phases. This transient phase is examined in more detail in § 4.2. After this stage, the flow reaches a quasi-steady state wherein the two-phase flow characteristics evolve more gradually with
 $t$
in accordance with the evaporation time scale. The instantaneous evolution of
$t$
in accordance with the evaporation time scale. The instantaneous evolution of
 ${\it\theta}$
,
${\it\theta}$
,
 $H$
,
$H$
,
 $R$
and
$R$
and
 $V$
obtained with the simulations is compared with the experimental data in figure 4. Excellent agreement between experiments and simulations is observed in the initial CR stage. The average numerical evaporation rate is
$V$
obtained with the simulations is compared with the experimental data in figure 4. Excellent agreement between experiments and simulations is observed in the initial CR stage. The average numerical evaporation rate is
 $m(t)=1.963\times 10^{-6}$
, 2.7 % lower than that experimentally observed, i.e.
$m(t)=1.963\times 10^{-6}$
, 2.7 % lower than that experimentally observed, i.e.
 $2.017\times 10^{-6}$
. The deviation increases slightly for
$2.017\times 10^{-6}$
. The deviation increases slightly for
 $t>10.5\times 10^{5}$
, when the experimental drop evaporates according to the combined
$t>10.5\times 10^{5}$
, when the experimental drop evaporates according to the combined
 $\text{CA}+\text{CR}$
and SS modes. This is to be expected, as in the simulations the drop remains perfectly pinned and therefore the evaporation modes are not comparable at this stage. A more detailed discussion examining the instantaneous
$\text{CA}+\text{CR}$
and SS modes. This is to be expected, as in the simulations the drop remains perfectly pinned and therefore the evaporation modes are not comparable at this stage. A more detailed discussion examining the instantaneous
 $m(t)$
is presented in § 6.
$m(t)$
is presented in § 6.

Figure 4. Comparison between experiments and numerical simulations for a water drop evaporating into
 $\text{N}_{2}$
placed on a heated substrate at
$\text{N}_{2}$
placed on a heated substrate at
 $\hat{T}_{w}=40\,^{\circ }\text{C}$
with
$\hat{T}_{w}=40\,^{\circ }\text{C}$
with
 ${\rm\Delta}\hat{T}=14.6\,^{\circ }\text{C}$
. (a) Contact angle
${\rm\Delta}\hat{T}=14.6\,^{\circ }\text{C}$
. (a) Contact angle
 ${\it\theta}$
, (b) drop height
${\it\theta}$
, (b) drop height
 $H$
, (c) contact radius
$H$
, (c) contact radius
 $R$
, and (d) volume
$R$
, and (d) volume
 $V$
. The vertical dashed lines separate the evaporation modes observed experimentally: see § 3.2.
$V$
. The vertical dashed lines separate the evaporation modes observed experimentally: see § 3.2.
The second key point in the validation is the comparison between the experimental and numerical interface temperature, shown in figure 5(a). Overall, there is again good qualitative and quantitative agreement. The only discrepancies are found at the contact line, but these result from the fact that the IR emissions are distorted due to the transition from water (high emissivity) to polished copper (very low). As the contact line is approached, the accuracy of the
 $T$
readings diminishes due to the transition to a different emissivity; otherwise
$T$
readings diminishes due to the transition to a different emissivity; otherwise
 $T\simeq 1$
should be observed at the contact line with the IR camera. Figure 5(b) shows the distribution of
$T\simeq 1$
should be observed at the contact line with the IR camera. Figure 5(b) shows the distribution of
 $T$
in the bulk of the liquid and gas. The flow and liquid temperature is qualitatively similar to that previously presented by other authors (Mollaret et al.
Reference Mollaret, Sefiane, Christy and Veyret2004; Hu & Larson Reference Hu and Larson2005a
; Girard et al.
Reference Girard, Antoni, Faure and Steinchen2006; Yang et al.
Reference Yang, Hong and Cheng2014). The gas temperature, not available in the literature, reveals a colder area above the drop due to the evaporative cooling. This thermal dip is progressively corrected as we move away from the drop until, at a certain distance
$T$
in the bulk of the liquid and gas. The flow and liquid temperature is qualitatively similar to that previously presented by other authors (Mollaret et al.
Reference Mollaret, Sefiane, Christy and Veyret2004; Hu & Larson Reference Hu and Larson2005a
; Girard et al.
Reference Girard, Antoni, Faure and Steinchen2006; Yang et al.
Reference Yang, Hong and Cheng2014). The gas temperature, not available in the literature, reveals a colder area above the drop due to the evaporative cooling. This thermal dip is progressively corrected as we move away from the drop until, at a certain distance
 $(r>6)$
,
$(r>6)$
,
 $T$
becomes
$T$
becomes
 $r$
-independent and decreases uniformly for increasing
$r$
-independent and decreases uniformly for increasing
 $z$
. The vapour distribution is presented in figure 5(c).
$z$
. The vapour distribution is presented in figure 5(c).

Figure 5. Water drop evaporating into
 $\text{N}_{2}$
with
$\text{N}_{2}$
with
 $\hat{T}_{w}=40\,^{\circ }\text{C}$
. (a) Comparison between the experimental and numerical interface temperature with
$\hat{T}_{w}=40\,^{\circ }\text{C}$
. (a) Comparison between the experimental and numerical interface temperature with
 $H=0.6$
, (b) liquid–gas temperature, and (c) vapour mass fraction in the initial stages of the evaporation process.
$H=0.6$
, (b) liquid–gas temperature, and (c) vapour mass fraction in the initial stages of the evaporation process.

Figure 6. Initial evolution of the two-phase velocity for a water drop placed on a heated substrate at
 $\hat{T}_{w}=40\,^{\circ }\text{C}$
with
$\hat{T}_{w}=40\,^{\circ }\text{C}$
with
 ${\rm\Delta}\hat{T}=14.6\,^{\circ }\text{C}$
. (a) Initial conditions,
${\rm\Delta}\hat{T}=14.6\,^{\circ }\text{C}$
. (a) Initial conditions,
 $t=0$
, (b)
$t=0$
, (b)
 $t=750$
(0.42 s), (c)
$t=750$
(0.42 s), (c)
 $t=1.5\times 10^{3}$
(0.83 s), (d)
$t=1.5\times 10^{3}$
(0.83 s), (d)
 $t=2.25\times 10^{3}$
(1.25 s), and (e) quasi-steady state,
$t=2.25\times 10^{3}$
(1.25 s), and (e) quasi-steady state,
 $t=3\times 10^{4}$
(16.7 s).
$t=3\times 10^{4}$
(16.7 s).

Figure 7. Transient heating of a water drop at
 $\hat{T}_{a}$
placed on a heated substrate at
$\hat{T}_{a}$
placed on a heated substrate at
 $\hat{T}_{w}$
. (a–e)
$\hat{T}_{w}$
. (a–e)
 $\hat{T}_{w}=40\,^{\circ }\text{C}$
with
$\hat{T}_{w}=40\,^{\circ }\text{C}$
with
 ${\rm\Delta}\hat{T}=14.6\,^{\circ }\text{C}$
: (a) initial conditions,
${\rm\Delta}\hat{T}=14.6\,^{\circ }\text{C}$
: (a) initial conditions,
 $t=0$
, (b)
$t=0$
, (b)
 $t=750$
(0.42 s), (c)
$t=750$
(0.42 s), (c)
 $t=1.5\times 10^{3}$
(0.83 s), (d)
$t=1.5\times 10^{3}$
(0.83 s), (d)
 $t=2.25\times 10^{3}$
(1.25 s), (e) quasi-steady state,
$t=2.25\times 10^{3}$
(1.25 s), (e) quasi-steady state,
 $t=3\times 10^{4}$
(16.7 s). (f–j)
$t=3\times 10^{4}$
(16.7 s). (f–j)
 $\hat{T}_{w}=70\,^{\circ }\text{C}$
with
$\hat{T}_{w}=70\,^{\circ }\text{C}$
with
 ${\rm\Delta}\hat{T}=39.8\,^{\circ }\text{C}$
: (f) initial conditions,
${\rm\Delta}\hat{T}=39.8\,^{\circ }\text{C}$
: (f) initial conditions,
 $t=0$
, (g)
$t=0$
, (g)
 $t=750$
(0.15 s), (h)
$t=750$
(0.15 s), (h)
 $t=1.5\times 10^{3}$
(0.30 s), (i)
$t=1.5\times 10^{3}$
(0.30 s), (i)
 $t=2.25\times 10^{3}$
(0.46 s), (j) quasi-steady state,
$t=2.25\times 10^{3}$
(0.46 s), (j) quasi-steady state,
 $t=3\times 10^{4}$
(6.08 s).
$t=3\times 10^{4}$
(6.08 s).
4.2. Initial drop heating
To conclude this section on axisymmetric drops, we provide insights into such fundamental questions as how a water drop heats up when placed on a hot substrate. This initial stage has received very little attention in the literature. Note that Hu & Larson (Reference Hu and Larson2002, Reference Hu and Larson2005a ,Reference Hu and Larson b , Reference Hu and Larson2006), Girard et al. (Reference Girard, Antoni, Faure and Steinchen2006, Reference Girard, Antoni, Faure and Steinchen2008a ,Reference Girard, Antoni and Sefiane b ) and Girard & Antoni (Reference Girard and Antoni2008) described the transient drop evolution as a sum of steady-state solutions and therefore could not capture the dynamics of the initial stage.
The evolution in time of the two-phase flow velocity is presented in figure 6. During the initial transient phase, the liquid and gas velocities are comparable and significantly larger than those of the quasi-steady equilibrium; this is due to the severe thermal gradients resulting from considering an initially cold drop. As the flow converges to the equilibrium state, the gas velocity decreases more rapidly than that of the liquid and ultimately becomes significantly lower (figure 6
e). The coupled evolution of the thermal field is depicted in figure 7 for
 $\hat{T}_{w}=40$
and
$\hat{T}_{w}=40$
and
 $70\,^{\circ }\text{C}$
to illustrate how the increasing role of the Marangoni effect influences the dynamics of the process. The strength of thermocapillarity is measured by the Marangoni number,
$70\,^{\circ }\text{C}$
to illustrate how the increasing role of the Marangoni effect influences the dynamics of the process. The strength of thermocapillarity is measured by the Marangoni number,
 $\mathit{Ma}=\hat{{\it\gamma}}\hat{R}_{0}{\rm\Delta}\hat{T}^{\ast }/(\hat{{\it\mu}}_{l}\hat{{\it\alpha}}_{l})$
, where
$\mathit{Ma}=\hat{{\it\gamma}}\hat{R}_{0}{\rm\Delta}\hat{T}^{\ast }/(\hat{{\it\mu}}_{l}\hat{{\it\alpha}}_{l})$
, where
 $\hat{{\it\alpha}}_{l}$
is the liquid thermal diffusivity and
$\hat{{\it\alpha}}_{l}$
is the liquid thermal diffusivity and
 ${\rm\Delta}\hat{T}^{\ast }$
is the temperature difference between the contact line and the apex. Calculation of this group shows that
${\rm\Delta}\hat{T}^{\ast }$
is the temperature difference between the contact line and the apex. Calculation of this group shows that
 $\mathit{Ma}$
is 2.5 times larger for
$\mathit{Ma}$
is 2.5 times larger for
 $\hat{T}_{w}=70\,^{\circ }\text{C}$
, i.e. the strength of thermocapillarity increases for increasing
$\hat{T}_{w}=70\,^{\circ }\text{C}$
, i.e. the strength of thermocapillarity increases for increasing
 $\hat{T}_{w}$
. Figure 7(a, f) shows the initial conditions (cold drop) while figure 7(e,j) illustrates the quasi-steady
$\hat{T}_{w}$
. Figure 7(a, f) shows the initial conditions (cold drop) while figure 7(e,j) illustrates the quasi-steady
 $T$
field found after the initial abrupt heating. Between these states, the drop warms up very quickly due to the heat transported from the substrate, across the solid–liquid interface, and surrounding gas, across the liquid–gas interface (see figure 7
b,g). Some of the latter is absorbed by evaporation, which is strongest at the beginning given that
$T$
field found after the initial abrupt heating. Between these states, the drop warms up very quickly due to the heat transported from the substrate, across the solid–liquid interface, and surrounding gas, across the liquid–gas interface (see figure 7
b,g). Some of the latter is absorbed by evaporation, which is strongest at the beginning given that
 ${\it\omega}_{t=0}=0$
, while the rest begins to increase the interface temperature. The temperature,
${\it\omega}_{t=0}=0$
, while the rest begins to increase the interface temperature. The temperature,
 $T$
, drops rapidly in the surrounding gas (its thermal diffusivity is two orders of magnitude larger than that of the liquid) and a thermal gradient arises along the interface triggering the Marangoni convection. Fluid from the contact-line region (at higher
$T$
, drops rapidly in the surrounding gas (its thermal diffusivity is two orders of magnitude larger than that of the liquid) and a thermal gradient arises along the interface triggering the Marangoni convection. Fluid from the contact-line region (at higher
 $T$
) is driven along the interface to the apex, which is cooler due to evaporation, and then recirculated vertically downward towards the centre of the drop. At high
$T$
) is driven along the interface to the apex, which is cooler due to evaporation, and then recirculated vertically downward towards the centre of the drop. At high
 $\hat{T}_{w}$
, the amount of heat associated with this Marangoni convection is significant and leads to the drop being heated through its core, as shown in figure 7(g–i). Figure 7(h,i) reveals that, rather than its centre, the coldest part of the drop is a toroidal-like region whose cross-section is approximately centred at
$\hat{T}_{w}$
, the amount of heat associated with this Marangoni convection is significant and leads to the drop being heated through its core, as shown in figure 7(g–i). Figure 7(h,i) reveals that, rather than its centre, the coldest part of the drop is a toroidal-like region whose cross-section is approximately centred at
 $(r,\,z)=(0.8,\,0.3)$
. At high
$(r,\,z)=(0.8,\,0.3)$
. At high
 $\hat{T}_{w}$
, therefore, the drop reaches thermal equilibrium by means of interior heating due to the prominent role of advection. At lower
$\hat{T}_{w}$
, therefore, the drop reaches thermal equilibrium by means of interior heating due to the prominent role of advection. At lower
 $\hat{T}_{w}$
, on the other hand (see figure 7
b–d), the role played by the Marangoni effect is less significant and consequently the drop increases its temperature through its periphery via conduction. In this case the coldest region coincides with the drop’s core. Independently of
$\hat{T}_{w}$
, on the other hand (see figure 7
b–d), the role played by the Marangoni effect is less significant and consequently the drop increases its temperature through its periphery via conduction. In this case the coldest region coincides with the drop’s core. Independently of
 $\hat{T}_{w}$
, the initial thermal adjustment takes place in
$\hat{T}_{w}$
, the initial thermal adjustment takes place in
 ${<}3\,\%$
of the drop’s lifetime, after which the drop enters a quasi-steady phase wherein the flow characteristics evolve very slowly.
${<}3\,\%$
of the drop’s lifetime, after which the drop enters a quasi-steady phase wherein the flow characteristics evolve very slowly.
5. Non-spherical drops
In this section we consider the dynamics of evaporating, non-axisymmetric drops. As discussed above, the time scale associated with the transport of vapour away from the interface is
 $O(10^{2})$
larger than those associated with the Marangoni-related phenomena that determine the flow dynamics in the drop and surrounding gas. Hence, the system quickly reaches a quasi-steady state wherein the characteristics of the two-phase flow evolve very slowly in time. We exploit this to reduce the computational cost of the three-dimensional simulations. Rather than resolving the complete domain
$O(10^{2})$
larger than those associated with the Marangoni-related phenomena that determine the flow dynamics in the drop and surrounding gas. Hence, the system quickly reaches a quasi-steady state wherein the characteristics of the two-phase flow evolve very slowly in time. We exploit this to reduce the computational cost of the three-dimensional simulations. Rather than resolving the complete domain
 $(20R_{0})$
, which in three dimensions is prohibitively costly, we consider smaller subdomains containing the drop and surrounding gas. To close the problem, we make use of our two-dimensional computations to prescribe the flow conditions in the vertical and upper boundaries. Using this strategy, we can efficiently simulate the quasi-steady drop flow at any point with no need to compute the previous stages that led to it in three dimensions.
$(20R_{0})$
, which in three dimensions is prohibitively costly, we consider smaller subdomains containing the drop and surrounding gas. To close the problem, we make use of our two-dimensional computations to prescribe the flow conditions in the vertical and upper boundaries. Using this strategy, we can efficiently simulate the quasi-steady drop flow at any point with no need to compute the previous stages that led to it in three dimensions.
Typically a drop in real-life situations is non-spherical from its inception until dry-out. However, there is a second common scenario that leads to deformed drops. As shown in the experiments (see figure 2
d), initially spherical drops are also most likely to become non-spherical after the first contact-line jump occurring towards the end of their lifetime. These two situations are examined in §§ 5.1 and 5.2, respectively. The discussion is supported by comparisons with the axisymmetric flow for
 $H=0.98$
and 0.3 presented in § 4. The former,
$H=0.98$
and 0.3 presented in § 4. The former,
 $H=0.98$
, represents the ideal case wherein the drop generated is perfectly spherical, and serves to compare with the more realistic situation wherein the drop is deformed from the beginning. For the sake of simplicity, we examine the flow once this has passed the initial transient phase, which provides a rationale for choosing the point with
$H=0.98$
, represents the ideal case wherein the drop generated is perfectly spherical, and serves to compare with the more realistic situation wherein the drop is deformed from the beginning. For the sake of simplicity, we examine the flow once this has passed the initial transient phase, which provides a rationale for choosing the point with
 $H=0.98$
instead of 1. This analysis is presented in § 5.1. The latter,
$H=0.98$
instead of 1. This analysis is presented in § 5.1. The latter,
 $H=0.3$
, illustrates the drop just before the first contact-line jump and serves to compare with the flow found immediately after the first depinning event. Section 5.2 is devoted to this study. It should be noted that these two spherical cases used as reference have also been simulated in three dimensions to make sure that the results are the same as with the axisymmetric version of the code. The domain size is
$H=0.3$
, illustrates the drop just before the first contact-line jump and serves to compare with the flow found immediately after the first depinning event. Section 5.2 is devoted to this study. It should be noted that these two spherical cases used as reference have also been simulated in three dimensions to make sure that the results are the same as with the axisymmetric version of the code. The domain size is
 $L_{x}=L_{y}=2L_{z}=3R_{0}$
for
$L_{x}=L_{y}=2L_{z}=3R_{0}$
for
 $H=0.98$
and
$H=0.98$
and
 $L_{x}=L_{y}=4L_{z}=3R_{0}$
for
$L_{x}=L_{y}=4L_{z}=3R_{0}$
for
 $H=0.3$
. The vertical length of the domain is associated with height of the drop investigated in each case. A uniformly distributed mesh of
$H=0.3$
. The vertical length of the domain is associated with height of the drop investigated in each case. A uniformly distributed mesh of
 $250\times 250\times 125$
elements is employed in both cases. The time-step size is
$250\times 250\times 125$
elements is employed in both cases. The time-step size is
 ${\rm\Delta}t=5\times 10^{-4}$
. The scalings and governing groups are the same as for the case with
${\rm\Delta}t=5\times 10^{-4}$
. The scalings and governing groups are the same as for the case with
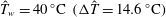 $\hat{T}_{w}=40\,^{\circ }\text{C}~({\rm\Delta}\hat{T}=14.6\,^{\circ }\text{C})$
presented in § 4.
$\hat{T}_{w}=40\,^{\circ }\text{C}~({\rm\Delta}\hat{T}=14.6\,^{\circ }\text{C})$
presented in § 4.
5.1. Elliptical contact area
Perfectly perpendicular dosing is key to generating spherical drops. However, in most real configurations the drop deposition is not exactly perpendicular to the substrate. A broad range of factors can be the cause of this, e.g. vertical dosing onto inclined substrates or drops released at a certain angle due to set-up configurations or even convection currents in the gas. In such cases, and assuming that the drop deposition is not violent, the resulting contact area is elliptical rather than circular. We therefore define the initial drop shape in Cartesian coordinates as follows:
 $$\begin{eqnarray}\frac{x^{2}}{a^{2}}+\frac{y^{2}}{b^{2}}+\frac{z^{2}}{c^{2}}=1,\end{eqnarray}$$
where
 $a$
,
$a$
,
 $b$
, and
$b$
, and
 $c$
are the semi-axis lengths along the
$c$
are the semi-axis lengths along the
 $x$
,
$x$
,
 $y$
, and
$y$
, and
 $z$
directions, respectively. The volume of a semi-ellipsoid
$z$
directions, respectively. The volume of a semi-ellipsoid
 $V_{e}$
is given by
$V_{e}$
is given by
 $$\begin{eqnarray}V_{e}={\textstyle \frac{2}{3}}{\rm\pi}abc,\end{eqnarray}$$
while the base circumference
 $C_{e}$
can be estimated according to Ramanujan’s second approximation, i.e.
$C_{e}$
can be estimated according to Ramanujan’s second approximation, i.e.
 $$\begin{eqnarray}C_{e}\approx {\rm\pi}(a+b)\left(1+\frac{3h}{10+\sqrt{4-3h}}\right),\end{eqnarray}$$
where
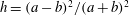 $h=(a-b)^{2}/(a+b)^{2}$
. It is known that the overall evaporation rate of a sessile drop is proportional to its volume (or contact angle) and to the length of its contact line, e.g. Birdi et al. (Reference Birdi, Vu and Winter1989), Rowan et al. (Reference Rowan, Newton and McHale1995) and Hu & Larson (Reference Hu and Larson2002). Thus,
$h=(a-b)^{2}/(a+b)^{2}$
. It is known that the overall evaporation rate of a sessile drop is proportional to its volume (or contact angle) and to the length of its contact line, e.g. Birdi et al. (Reference Birdi, Vu and Winter1989), Rowan et al. (Reference Rowan, Newton and McHale1995) and Hu & Larson (Reference Hu and Larson2002). Thus,
 $a$
,
$a$
,
 $b$
and
$b$
and
 $c$
are selected so that the resulting ellipsoidal geometry provides the same volume and base perimeter as those for the spherical drop used as reference, i.e.
$c$
are selected so that the resulting ellipsoidal geometry provides the same volume and base perimeter as those for the spherical drop used as reference, i.e.
 $V_{e}={\rm\pi}H(3R^{2}+H^{2})/6$
and
$V_{e}={\rm\pi}H(3R^{2}+H^{2})/6$
and
 $C_{e}=2{\rm\pi}R$
, where
$C_{e}=2{\rm\pi}R$
, where
 $H=0.98$
and
$H=0.98$
and
 $R=1.2$
. Equations (5.2) and (5.3) form a set of two relations with three unknowns. The missing expression necessary to complete an independent system is provided by the degree of deformation in the horizontal direction,
$R=1.2$
. Equations (5.2) and (5.3) form a set of two relations with three unknowns. The missing expression necessary to complete an independent system is provided by the degree of deformation in the horizontal direction,
 ${\it\Lambda}=a/b$
, which is chosen to be
${\it\Lambda}=a/b$
, which is chosen to be
 ${\it\Lambda}=3/2$
. It follows that the resulting ellipsoidal geometry is defined by
${\it\Lambda}=3/2$
. It follows that the resulting ellipsoidal geometry is defined by
 $a=1.4260$
,
$a=1.4260$
,
 $b=0.9505$
, and
$b=0.9505$
, and
 $c=0.9815$
.
$c=0.9815$
.
Our simulations show that an ellipsoid is not a possible shape for a sessile drop with an elliptical pinned contact line. The initial drop geometry (arbitrarily selected) undergoes a rapid change as surface tension enforces interface surface-area minimization for the given volume. Figure 8 illustrates the initial shape together with the final quasi-steady drop profile. The pinned contact line impedes the formation of a sphere but surface tension drives the interface shape to reach the closest possible configuration. In an attempt to even out the different axis lengths, there is interface pulling along the longest axis,
 $x$
(figure 8
a), while the interface expands in the other two directions,
$x$
(figure 8
a), while the interface expands in the other two directions,
 $y$
and
$y$
and
 $z$
(figure 8
b). The interface surface area of the resulting drop is smaller than the area of the ellipsoid but larger than the area of the spherical cap by 1.2 %, with the same volume and base perimeter. It should be noted that this initial shape adjustment is not caused by evaporation. The time interval in which this adjustment takes place is sufficiently short that the volume difference between the initial and the spherical drop shape is negligible
$z$
(figure 8
b). The interface surface area of the resulting drop is smaller than the area of the ellipsoid but larger than the area of the spherical cap by 1.2 %, with the same volume and base perimeter. It should be noted that this initial shape adjustment is not caused by evaporation. The time interval in which this adjustment takes place is sufficiently short that the volume difference between the initial and the spherical drop shape is negligible
 $({\rm\Delta}V\approx 0.1\,\%)$
.
$({\rm\Delta}V\approx 0.1\,\%)$
.

Figure 8. Initial semi-ellipsoidal interface (dashed line) and final drop shape (solid line) along the principal (a)
 $xz$
and (b)
$xz$
and (b)
 $yz$
planes for the drop with deformed contact area. This drop is defined by the semi-axis lengths of its elliptical contact area,
$yz$
planes for the drop with deformed contact area. This drop is defined by the semi-axis lengths of its elliptical contact area,
 $a=1.4260$
and
$a=1.4260$
and
 $b=0.9505$
, and its volume,
$b=0.9505$
, and its volume,
 $V={\rm\pi}H(3R^{2}+H^{2})/6$
with
$V={\rm\pi}H(3R^{2}+H^{2})/6$
with
 $H=0.98$
and
$H=0.98$
and
 $R=1.2$
.
$R=1.2$
.

Figure 9. (a) Elliptical contact area of the deformed drop (solid line) along with that of the spherical drop (dashed line) employed for comparison. (b) Contact-angle
 ${\it\theta}$
and horizontal-curvature
${\it\theta}$
and horizontal-curvature
 $1/R_{xy}$
distribution along the elliptical contact line. This is given in terms of the azimuthal angle
$1/R_{xy}$
distribution along the elliptical contact line. This is given in terms of the azimuthal angle
 ${\it\psi}$
defined as shown in (a). Here,
${\it\psi}$
defined as shown in (a). Here,
 ${\it\theta}_{max}=94^{\circ }$
and
${\it\theta}_{max}=94^{\circ }$
and
 ${\it\theta}_{min}=59^{\circ }$
.
${\it\theta}_{min}=59^{\circ }$
.
Figure 9(a) depicts how the resulting elliptical contact line of the deformed drop compares with the circular contact line of the reference drop, while figure 9(b) shows the contact-angle distribution along the triple line, which is not constant as in the spherical case. The position along the contact line is given in terms of the azimuthal angle,
 ${\it\psi}$
, defined as shown in figure 9(a). The contact angle varies between
${\it\psi}$
, defined as shown in figure 9(a). The contact angle varies between
 ${\it\theta}_{min}=59^{\circ }$
for the longest horizontal axis (
${\it\theta}_{min}=59^{\circ }$
for the longest horizontal axis (
 ${\it\psi}=0^{\circ }$
and
${\it\psi}=0^{\circ }$
and
 $180^{\circ }$
) and
$180^{\circ }$
) and
 ${\it\theta}_{max}=94^{\circ }$
for the other (
${\it\theta}_{max}=94^{\circ }$
for the other (
 ${\it\psi}=90^{\circ }$
and
${\it\psi}=90^{\circ }$
and
 $270^{\circ }$
). The average contact angle
$270^{\circ }$
). The average contact angle
 $\bar{{\it\theta}}=\int _{CL}{\it\theta}\,\text{d}l/\!\int _{CL}\,\text{d}l$
is
$\bar{{\it\theta}}=\int _{CL}{\it\theta}\,\text{d}l/\!\int _{CL}\,\text{d}l$
is
 $82^{\circ }$
. For a given
$82^{\circ }$
. For a given
 $V$
, the range of contact angle variation throughout the base line,
$V$
, the range of contact angle variation throughout the base line,
 ${\rm\Delta}{\it\theta}={\it\theta}_{max}-{\it\theta}_{min}$
, increases for increasing deformation
${\rm\Delta}{\it\theta}={\it\theta}_{max}-{\it\theta}_{min}$
, increases for increasing deformation
 ${\it\Lambda}$
. Note that
${\it\Lambda}$
. Note that
 ${\rm\Delta}{\it\theta}=35^{\circ }$
with
${\rm\Delta}{\it\theta}=35^{\circ }$
with
 ${\it\Lambda}=3/2$
while
${\it\Lambda}=3/2$
while
 ${\rm\Delta}{\it\theta}=0^{\circ }$
for
${\rm\Delta}{\it\theta}=0^{\circ }$
for
 ${\it\Lambda}=1$
(spherical cap). In addition, for a given
${\it\Lambda}=1$
(spherical cap). In addition, for a given
 ${\it\Lambda}$
,
${\it\Lambda}$
,
 ${\rm\Delta}{\it\theta}$
decreases in time due to evaporation. For instance, when the drop has half of the original volume, i.e.
${\rm\Delta}{\it\theta}$
decreases in time due to evaporation. For instance, when the drop has half of the original volume, i.e.
 $V=V_{e}/2$
, we find that
$V=V_{e}/2$
, we find that
 ${\rm\Delta}{\it\theta}=62^{\circ }-31^{\circ }=31^{\circ }$
and
${\rm\Delta}{\it\theta}=62^{\circ }-31^{\circ }=31^{\circ }$
and
 $\bar{{\it\theta}}=50^{\circ }$
. Note that in the limit
$\bar{{\it\theta}}=50^{\circ }$
. Note that in the limit
 $V\rightarrow 0$
then
$V\rightarrow 0$
then
 ${\rm\Delta}{\it\theta}\rightarrow 0$
. In other words, the conclusions are: (i) the more deformed the drop is the larger the range of
${\rm\Delta}{\it\theta}\rightarrow 0$
. In other words, the conclusions are: (i) the more deformed the drop is the larger the range of
 ${\it\theta}$
, and (ii) evaporation makes the contact-angle distribution more homogeneous with time.
${\it\theta}$
, and (ii) evaporation makes the contact-angle distribution more homogeneous with time.
It is important to note that the contact-angle distribution is inversely related to the horizontal contact-line curvature
 $1/R_{xy}=|(\boldsymbol{{\rm\nabla}}_{H}\boldsymbol{\cdot }\boldsymbol{n})|_{z=0}$
, where
$1/R_{xy}=|(\boldsymbol{{\rm\nabla}}_{H}\boldsymbol{\cdot }\boldsymbol{n})|_{z=0}$
, where
 $\boldsymbol{{\rm\nabla}}_{H}=\boldsymbol{{\rm\nabla}}-\boldsymbol{n}_{z}(\boldsymbol{n}_{z}\boldsymbol{\cdot }\boldsymbol{{\rm\nabla}})$
is the horizontal gradient operator, and
$\boldsymbol{{\rm\nabla}}_{H}=\boldsymbol{{\rm\nabla}}-\boldsymbol{n}_{z}(\boldsymbol{n}_{z}\boldsymbol{\cdot }\boldsymbol{{\rm\nabla}})$
is the horizontal gradient operator, and
 $\boldsymbol{n}$
and
$\boldsymbol{n}$
and
 $\boldsymbol{n}_{z}$
are the unit vectors normal to the interface and to the lower boundary, respectively. Figure 9(b) illustrates the evolution of
$\boldsymbol{n}_{z}$
are the unit vectors normal to the interface and to the lower boundary, respectively. Figure 9(b) illustrates the evolution of
 $1/R_{xy}$
between its maximum found at the ends of longest axis (
$1/R_{xy}$
between its maximum found at the ends of longest axis (
 ${\it\psi}=0^{\circ }$
and
${\it\psi}=0^{\circ }$
and
 $180^{\circ }$
), where
$180^{\circ }$
), where
 $1/R_{xy}=a/b^{2}=1.58$
, and minimum at the shortest (
$1/R_{xy}=a/b^{2}=1.58$
, and minimum at the shortest (
 ${\it\psi}=90^{\circ }$
and
${\it\psi}=90^{\circ }$
and
 $270^{\circ }$
), where
$270^{\circ }$
), where
 $1/R_{xy}=b/a^{2}=0.47$
. The higher
$1/R_{xy}=b/a^{2}=0.47$
. The higher
 $1/R_{xy}$
at a certain point, the more this point behaves like a ‘corner’ and, as a result, experiences a greater degree of pulling, resulting in lower
$1/R_{xy}$
at a certain point, the more this point behaves like a ‘corner’ and, as a result, experiences a greater degree of pulling, resulting in lower
 ${\it\theta}$
. To understand the physical mechanism behind this phenomenon, we need to examine the Young–Laplace equation,
${\it\theta}$
. To understand the physical mechanism behind this phenomenon, we need to examine the Young–Laplace equation,
 ${\rm\Delta}p={\it\sigma}(1/R_{1}+1/R_{2})$
. Since gravity has been neglected, the pressure in the liquid and gas are different but essentially constant and therefore
${\rm\Delta}p={\it\sigma}(1/R_{1}+1/R_{2})$
. Since gravity has been neglected, the pressure in the liquid and gas are different but essentially constant and therefore
 ${\rm\Delta}p$
should be equal across any point along the interface. This imposes the constraint that if the contact-line curvature is large at one point (
${\rm\Delta}p$
should be equal across any point along the interface. This imposes the constraint that if the contact-line curvature is large at one point (
 $1/R_{1}$
), the second principal curvature (
$1/R_{1}$
), the second principal curvature (
 $1/R_{2}$
), which dictates
$1/R_{2}$
), which dictates
 ${\it\theta}$
in this case, has to be smaller (larger
${\it\theta}$
in this case, has to be smaller (larger
 ${\it\theta}$
) in order to maintain a constant
${\it\theta}$
) in order to maintain a constant
 ${\rm\Delta}p$
. Note that, thanks to the drop symmetry, the principal radii of curvature of the interface at the extreme points A and B coincide with radii of curvature of the contact line and the interface contained in the principal vertical plane across the point (directly connected to
${\rm\Delta}p$
. Note that, thanks to the drop symmetry, the principal radii of curvature of the interface at the extreme points A and B coincide with radii of curvature of the contact line and the interface contained in the principal vertical plane across the point (directly connected to
 ${\it\theta}$
). This singularity may not occur for the intermediate points, a consideration which is revisited in the more complex case presented in § 5.2.
${\it\theta}$
). This singularity may not occur for the intermediate points, a consideration which is revisited in the more complex case presented in § 5.2.
As was mentioned above, the evaporation rate
 $m(t)$
in spherical drops is known to be dependent on the length of the base circumference
$m(t)$
in spherical drops is known to be dependent on the length of the base circumference
 $C_{e}$
and volume
$C_{e}$
and volume
 $V$
, which is similar to saying that
$V$
, which is similar to saying that
 $m(t)$
depends on
$m(t)$
depends on
 $C_{e}$
and
$C_{e}$
and
 ${\it\theta}$
. It is evident that the spherical condition together with
${\it\theta}$
. It is evident that the spherical condition together with
 $C_{e}$
and
$C_{e}$
and
 $V$
lead to a unique interface surface area and therefore to a characteristic
$V$
lead to a unique interface surface area and therefore to a characteristic
 $m(t)$
. Not surprisingly, this consideration does not hold for deformed drops given that the interface area is not uniquely defined with
$m(t)$
. Not surprisingly, this consideration does not hold for deformed drops given that the interface area is not uniquely defined with
 $C_{e}$
and
$C_{e}$
and
 $V$
only. It is found that
$V$
only. It is found that
 $m(t)$
is 2.3 % larger than that for the reference spherical drop even though
$m(t)$
is 2.3 % larger than that for the reference spherical drop even though
 $C_{e}$
and
$C_{e}$
and
 $V$
are the same in both cases, which is in accordance with the order of surface area increment reported above. This finding is also consistent with the experimental observations by Jansen et al. (Reference Jansen, Zandvliet and Kooij2014), who recently reported higher evaporation rates for more elongated droplets.
$V$
are the same in both cases, which is in accordance with the order of surface area increment reported above. This finding is also consistent with the experimental observations by Jansen et al. (Reference Jansen, Zandvliet and Kooij2014), who recently reported higher evaporation rates for more elongated droplets.
Figure 10 depicts
 $T$
along the interface. The temperature ranges from
$T$
along the interface. The temperature ranges from
 $T=1$
at the triple line to
$T=1$
at the triple line to
 $T=0.77$
at the apex. Given the elliptical contact area, one might have expected
$T=0.77$
at the apex. Given the elliptical contact area, one might have expected
 $T$
to follow rather closely a distribution of concentric ellipses of decreasing size for increasing
$T$
to follow rather closely a distribution of concentric ellipses of decreasing size for increasing
 $z$
. This is not what is observed in the simulations, however. The irregular drop shape leads to the thermal field being deformed in the
$z$
. This is not what is observed in the simulations, however. The irregular drop shape leads to the thermal field being deformed in the
 $z$
direction, as shown in figure 10(b). Following the interface shape, the isotherms are stretched downwards along the longest axis. Hence, their vertical location varies depending on the azimuthal position. The curvature and path length towards the apex are also different at each point. This combination of factors gives rise to azimuthal thermal gradients along the interface.
$z$
direction, as shown in figure 10(b). Following the interface shape, the isotherms are stretched downwards along the longest axis. Hence, their vertical location varies depending on the azimuthal position. The curvature and path length towards the apex are also different at each point. This combination of factors gives rise to azimuthal thermal gradients along the interface.

Figure 10. Interface temperature for the drop with elliptical contact area. The solid black lines are contours of constant
 $z$
coordinate. (a) Front and (b) side views.
$z$
coordinate. (a) Front and (b) side views.
Figure 11 shows the three-dimensional (3D) flow within the drop by means of streamlines coloured by the local
 $T$
. The flow repeats itself periodically at each quadrant even though the data are from a three-dimensional simulation of the complete drop. Flow is driven from the contact line to the apex along the interface and then recirculated through the drop core back towards the contact line. However, the streamlines along the interface are bent towards the ends of the longest axis, as shown in figure 11(b), due to the azimuthal dependence of
$T$
. The flow repeats itself periodically at each quadrant even though the data are from a three-dimensional simulation of the complete drop. Flow is driven from the contact line to the apex along the interface and then recirculated through the drop core back towards the contact line. However, the streamlines along the interface are bent towards the ends of the longest axis, as shown in figure 11(b), due to the azimuthal dependence of
 $\boldsymbol{{\rm\nabla}}_{~s}T$
; the dashed arrows show the direction of the emerging azimuthal velocity components. This effect also induces azimuthal currents in the interior of the drop, which have been isolated for the first quadrant in figure 11 for clarity of presentation. At each quarter, the current’s origin coincides with the centre of the vortex at the vertical plane across the shortest axis of the ellipse, i.e. the
$\boldsymbol{{\rm\nabla}}_{~s}T$
; the dashed arrows show the direction of the emerging azimuthal velocity components. This effect also induces azimuthal currents in the interior of the drop, which have been isolated for the first quadrant in figure 11 for clarity of presentation. At each quarter, the current’s origin coincides with the centre of the vortex at the vertical plane across the shortest axis of the ellipse, i.e. the
 $yz$
plane (figure 11
d), and flows into the centre of the second fundamental vortex generated along the longest axis, i.e. the
$yz$
plane (figure 11
d), and flows into the centre of the second fundamental vortex generated along the longest axis, i.e. the
 $xz$
plane (figure 11
c). Each stream, therefore, is a bent toroidal-like feature, transporting liquid from areas located in perpendicular planes and at different heights.
$xz$
plane (figure 11
c). Each stream, therefore, is a bent toroidal-like feature, transporting liquid from areas located in perpendicular planes and at different heights.

Figure 11. Three-dimensional flow within the drop with elliptical contact area defined in figure 9. The interface and streamlines are coloured by temperature. (a) 3D, (b) top, (c) front and (d) side views. The solid and dashed arrows indicate the direction of the primary interface flow and secondary azimuthal currents, respectively.
In order to characterize the torroidal currents more quantitatively, the local volumetric helicity
 $\mathscr{H}=\boldsymbol{u}\boldsymbol{\cdot }(\boldsymbol{{\rm\nabla}}\times \boldsymbol{u})$
is presented in figure 12. Note that
$\mathscr{H}=\boldsymbol{u}\boldsymbol{\cdot }(\boldsymbol{{\rm\nabla}}\times \boldsymbol{u})$
is presented in figure 12. Note that
 $\mathscr{H}$
is large when the flow velocity
$\mathscr{H}$
is large when the flow velocity
 $\boldsymbol{u}$
and the vorticity
$\boldsymbol{u}$
and the vorticity
 $(\boldsymbol{{\rm\nabla}}\times \boldsymbol{u})$
are not only large but also parallel, which makes
$(\boldsymbol{{\rm\nabla}}\times \boldsymbol{u})$
are not only large but also parallel, which makes
 $\mathscr{H}$
a very useful variable to provide a measure of the current’s azimuthal strength. At the vertical planes
$\mathscr{H}$
a very useful variable to provide a measure of the current’s azimuthal strength. At the vertical planes
 $\mathscr{H}=0$
because the
$\mathscr{H}=0$
because the
 $\boldsymbol{u}$
components perpendicular to the planes are 0. Note that for each plane the perpendicular velocity on one side is in the opposite direction to the perpendicular velocity from the other side. For instance, at the
$\boldsymbol{u}$
components perpendicular to the planes are 0. Note that for each plane the perpendicular velocity on one side is in the opposite direction to the perpendicular velocity from the other side. For instance, at the
 $yz$
plane,
$yz$
plane,
 $(\boldsymbol{u}\boldsymbol{\cdot }\boldsymbol{n}_{x})_{x\rightarrow 0}^{x<0}=-(\boldsymbol{u}\boldsymbol{\cdot }\boldsymbol{n}_{x})_{x\rightarrow 0}^{x>0}$
, and therefore
$(\boldsymbol{u}\boldsymbol{\cdot }\boldsymbol{n}_{x})_{x\rightarrow 0}^{x<0}=-(\boldsymbol{u}\boldsymbol{\cdot }\boldsymbol{n}_{x})_{x\rightarrow 0}^{x>0}$
, and therefore
 $(\boldsymbol{u}\boldsymbol{\cdot }\boldsymbol{n}_{x})_{x=0}=0$
. Similarly for the
$(\boldsymbol{u}\boldsymbol{\cdot }\boldsymbol{n}_{x})_{x=0}=0$
. Similarly for the
 $xz$
plane,
$xz$
plane,
 $(\boldsymbol{u}\boldsymbol{\cdot }\boldsymbol{n}_{y})_{y=0}=0$
given that
$(\boldsymbol{u}\boldsymbol{\cdot }\boldsymbol{n}_{y})_{y=0}=0$
given that
 $(\boldsymbol{u}\boldsymbol{\cdot }\boldsymbol{n}_{y})_{y\rightarrow 0}^{y<0}=-(\boldsymbol{u}\boldsymbol{\cdot }\boldsymbol{n}_{y})_{y\rightarrow 0}^{y>0}$
. As the fluid departs from the
$(\boldsymbol{u}\boldsymbol{\cdot }\boldsymbol{n}_{y})_{y\rightarrow 0}^{y<0}=-(\boldsymbol{u}\boldsymbol{\cdot }\boldsymbol{n}_{y})_{y\rightarrow 0}^{y>0}$
. As the fluid departs from the
 $yz$
plane, there is an increment in the flow’s
$yz$
plane, there is an increment in the flow’s
 $\mathscr{H}$
until it reaches a maximum and then decays to become 0 again at the
$\mathscr{H}$
until it reaches a maximum and then decays to become 0 again at the
 $xz$
plane. Thus, a particle following this path will probably accelerate during the first stage and slow down at the end. The speed of these currents is approximately one order of magnitude lower than the maximum flow speed, which is found at the interface, and therefore comparable to the speed of the flow in the drop’s core.
$xz$
plane. Thus, a particle following this path will probably accelerate during the first stage and slow down at the end. The speed of these currents is approximately one order of magnitude lower than the maximum flow speed, which is found at the interface, and therefore comparable to the speed of the flow in the drop’s core.

Figure 12. Local volumetric helicity
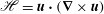 $\mathscr{H}=\boldsymbol{u}\boldsymbol{\cdot }(\boldsymbol{{\rm\nabla}}\times \boldsymbol{u})$
for the azimuthal current emerging in the deformed drop with elliptical contact area. The arrow shows the direction of motion.
$\mathscr{H}=\boldsymbol{u}\boldsymbol{\cdot }(\boldsymbol{{\rm\nabla}}\times \boldsymbol{u})$
for the azimuthal current emerging in the deformed drop with elliptical contact area. The arrow shows the direction of motion.
5.2. Irregular contact area
We now study the case wherein an evaporating spherical drop becomes deformed after the first contact-line jump, which is typically observed in the experiments at
 $t=0.7t_{tot}$
. In the range of temperatures investigated in the laboratory, the contact-line motion begins when a certain critical disequilibrium point is reached in the dynamics. The critical conditions change slightly with
$t=0.7t_{tot}$
. In the range of temperatures investigated in the laboratory, the contact-line motion begins when a certain critical disequilibrium point is reached in the dynamics. The critical conditions change slightly with
 $\hat{T}_{w}$
but, in the range of temperatures examined in the laboratory
$\hat{T}_{w}$
but, in the range of temperatures examined in the laboratory
 $(40^{\circ }\leqslant \hat{T}_{w}\leqslant 70^{\circ })$
, these fall into the range
$(40^{\circ }\leqslant \hat{T}_{w}\leqslant 70^{\circ })$
, these fall into the range
 $22^{\circ }\leqslant {\it\theta}_{c}\leqslant 26^{\circ }$
, which in terms of drop height becomes
$22^{\circ }\leqslant {\it\theta}_{c}\leqslant 26^{\circ }$
, which in terms of drop height becomes
 $0.37~\text{mm}\leqslant {\hat{H}}_{c}\leqslant 0.44~\text{mm}$
(figure 3), and
$0.37~\text{mm}\leqslant {\hat{H}}_{c}\leqslant 0.44~\text{mm}$
(figure 3), and
 $0.24\leqslant H_{c}\leqslant 0.28$
in dimensional and dimensionless forms, respectively. For the sake of simplicity, we round
$0.24\leqslant H_{c}\leqslant 0.28$
in dimensional and dimensionless forms, respectively. For the sake of simplicity, we round
 $H_{c}$
and consider that the drop depinning occurs when
$H_{c}$
and consider that the drop depinning occurs when
 $H=0.3$
.
$H=0.3$
.
The experiments show that during the three-dimensional contact-area motion, a section of the triple line remains anchored to its original position (top-left quadrant in figure 2
d) while the rest suddenly moves to regain equilibrium by reducing the contact area. In our simulations, we generate the deformed drop in a similar way (see figure 13
a). Starting from an axisymmetric flow with
 $H=0.3$
and
$H=0.3$
and
 $R=1.2$
in three dimensions (dashed line in figure 13
a), the contact line is allowed to move freely everywhere except in the second quadrant,
$R=1.2$
in three dimensions (dashed line in figure 13
a), the contact line is allowed to move freely everywhere except in the second quadrant,
 $90^{\circ }\leqslant {\it\psi}\leqslant 180^{\circ }$
, where it is pinned. Consequently, surface tension brings the MCL towards its new pinned position (solid line in figure 13
a) to satisfy interface area minimization. The new pinned position has been selected to approximate experimental observations, and the model implemented to allow contact-line motion is described in § 6. To maintain the focus of the investigation, this is not presented here. Note that the focus here is on elucidating the dynamics of evaporation from a deformed drop; thus modelling the complex motion of the contact line that brings about this deformation is beyond the scope of this work.
$90^{\circ }\leqslant {\it\psi}\leqslant 180^{\circ }$
, where it is pinned. Consequently, surface tension brings the MCL towards its new pinned position (solid line in figure 13
a) to satisfy interface area minimization. The new pinned position has been selected to approximate experimental observations, and the model implemented to allow contact-line motion is described in § 6. To maintain the focus of the investigation, this is not presented here. Note that the focus here is on elucidating the dynamics of evaporation from a deformed drop; thus modelling the complex motion of the contact line that brings about this deformation is beyond the scope of this work.

Figure 13. (a) Irregular contact area of the deformed drop found after the first contact jump (solid line) compared with that of its precursor spherical drop (dashed line) with
 $H=0.3$
and
$H=0.3$
and
 $R=1.2$
. (b) Contact-angle
$R=1.2$
. (b) Contact-angle
 ${\it\theta}$
and horizontal-curvature
${\it\theta}$
and horizontal-curvature
 $1/R_{xy}$
distribution along the contact line. This is given in terms of the azimuthal angle
$1/R_{xy}$
distribution along the contact line. This is given in terms of the azimuthal angle
 ${\it\psi}$
defined as shown in (a). Here,
${\it\psi}$
defined as shown in (a). Here,
 ${\it\theta}_{max}=64^{\circ }$
and
${\it\theta}_{max}=64^{\circ }$
and
 ${\it\theta}_{min}=51^{\circ }$
. The key points are A
${\it\theta}_{min}=51^{\circ }$
. The key points are A
 $({\it\psi}_{A}=82^{\circ })$
, B
$({\it\psi}_{A}=82^{\circ })$
, B
 $({\it\psi}_{B}=135^{\circ })$
, C
$({\it\psi}_{B}=135^{\circ })$
, C
 $({\it\psi}_{C}=188^{\circ })$
and D
$({\it\psi}_{C}=188^{\circ })$
and D
 $({\it\psi}_{D}=315^{\circ })$
.
$({\it\psi}_{D}=315^{\circ })$
.
Contrary to the previous drop geometry with elliptical contact area, this more irregular drop only presents one vertical plane of symmetry, namely that across points B and D in figure 13(a). The resulting
 ${\it\theta}$
distribution, shown in figure 13(b), is more intricate but follows similar principles. During the readjustment,
${\it\theta}$
distribution, shown in figure 13(b), is more intricate but follows similar principles. During the readjustment,
 ${\it\theta}$
increases from
${\it\theta}$
increases from
 $28^{\circ }$
(spherical drop) to
$28^{\circ }$
(spherical drop) to
 $51^{\circ }\leqslant {\it\theta}\leqslant 64^{\circ }$
, which is in excellent agreement with the range recorded experimentally, as shown in figure 3(a). Once again,
$51^{\circ }\leqslant {\it\theta}\leqslant 64^{\circ }$
, which is in excellent agreement with the range recorded experimentally, as shown in figure 3(a). Once again,
 ${\it\theta}$
is related to the contact-line curvature
${\it\theta}$
is related to the contact-line curvature
 $1/R_{xy}$
as the points of minimum
$1/R_{xy}$
as the points of minimum
 ${\it\theta}$
coincide fairly well with the locations where
${\it\theta}$
coincide fairly well with the locations where
 $1/R_{xy}$
is maximum, i.e. points A and C, and vice versa. Note that
$1/R_{xy}$
is maximum, i.e. points A and C, and vice versa. Note that
 ${\it\theta}$
and
${\it\theta}$
and
 $1/R_{xy}$
are perfectly in phase at B and D whereas there is a small mismatch for A and C. The reason lies in the drop symmetry. The angles
$1/R_{xy}$
are perfectly in phase at B and D whereas there is a small mismatch for A and C. The reason lies in the drop symmetry. The angles
 ${\it\theta}_{B}$
and
${\it\theta}_{B}$
and
 ${\it\theta}_{D}$
result from the equilibrium of interfacial forces acting on each side of the line BD, which are symmetric. In the case of A and C, however, the interface forces on each side of the line that connects these points are different due to the drop shape. Note that
${\it\theta}_{D}$
result from the equilibrium of interfacial forces acting on each side of the line BD, which are symmetric. In the case of A and C, however, the interface forces on each side of the line that connects these points are different due to the drop shape. Note that
 $R_{xy}$
corresponds to one of the principal interface radii of curvature for B and D but not necessarily for A and C.
$R_{xy}$
corresponds to one of the principal interface radii of curvature for B and D but not necessarily for A and C.
The depinning of the drop occurs when it is sufficiently out of equilibrium, that is, when its interface surface area is very large in comparison with its volume. We find that for the same
 $V$
, the geometric readjustment leads to an interface whose area is significantly smaller (30.4 %) than the interface area of the spherical drop found right before the depinning event. In a similar manner, the evaporation rate
$V$
, the geometric readjustment leads to an interface whose area is significantly smaller (30.4 %) than the interface area of the spherical drop found right before the depinning event. In a similar manner, the evaporation rate
 $m(t)$
decreases by the same order of magnitude:
$m(t)$
decreases by the same order of magnitude:
 $m(t)$
is 20.3 % lower after the contact-area jump. The reasons why there is a relative mismatch between the change of surface area and evaporation rate appear to be associated with the rapid transient nature of the flow. Careful analysis of the instantaneous
$m(t)$
is 20.3 % lower after the contact-area jump. The reasons why there is a relative mismatch between the change of surface area and evaporation rate appear to be associated with the rapid transient nature of the flow. Careful analysis of the instantaneous
 $m(t)$
reveals that, during the transient stage,
$m(t)$
reveals that, during the transient stage,
 $m(t)$
in the irregular drop decreases at a rate
$m(t)$
in the irregular drop decreases at a rate
 $O(1)$
faster than that in the spherical drop used as reference. This indicates that the deviation between the change in area and evaporation rate (10.1 %) is being corrected with time and therefore is probably a short-term consequence of the complex transient flow. It should be noted that a complete correction is unlikely given that the contact-line motion also entails a significant redistribution of drop’s thermal field, along with a change in the strength of the Marangoni effect. Hence, a residual mismatch is expected but, once again, the surface area appears to be the leading factor in dictating changes in
$O(1)$
faster than that in the spherical drop used as reference. This indicates that the deviation between the change in area and evaporation rate (10.1 %) is being corrected with time and therefore is probably a short-term consequence of the complex transient flow. It should be noted that a complete correction is unlikely given that the contact-line motion also entails a significant redistribution of drop’s thermal field, along with a change in the strength of the Marangoni effect. Hence, a residual mismatch is expected but, once again, the surface area appears to be the leading factor in dictating changes in
 $m(t)$
.
$m(t)$
.

Figure 14. Three-dimensional flow and temperature distribution in the irregular drop found after the first contact-line jump defined in figure 13. (a) 3D, (b) top, (c) side and (d) front views. The arrows illustrate the direction of motion.
During the contact-line jump, the interface motion severely deforms the preceding axisymmetric flow. This loses its quasi-steady condition, triggering a rapid transient stage until another equilibrium state is achieved for the new geometric configuration. The three-dimensional streamlines and
 $T$
distribution within the drop during this transitional phase are illustrated in figure 14. The Marangoni force develops a preferential direction, line BD in figure 13(a), along which warm liquid is transported from D towards B, and then recirculated downward and back along the periphery via the points A and C. Consequently, a pair of counter-rotating vortices emerge in the bulk flow: see figure 14. These are centred in the colder regions and are essentially parallel to the horizontal plane. The strength of these vortices diminishes with time as the interface temperature is homogenized by the central stream of warm fluid as well as by the heat being transported towards the cold vortices from the contact line due to both conduction and convection. Eventually the vortices disappear, along with the preferential direction of the Marangoni convection, and the drop reaches its new quasi-steady equilibrium wherein the apex is the coldest region and the interface flow is mainly radial towards the apex. Azimuthal components also emerge in this new quasi-steady equilibrium, but these are weaker than those reported for the drop with an elliptical contact area given that the interface geometry is less deformed. The interface temperature distribution during the intermediate transient stage is depicted in figure 15(a). Capturing these vortices in the laboratory is very difficult due to the relatively small range of the
$T$
distribution within the drop during this transitional phase are illustrated in figure 14. The Marangoni force develops a preferential direction, line BD in figure 13(a), along which warm liquid is transported from D towards B, and then recirculated downward and back along the periphery via the points A and C. Consequently, a pair of counter-rotating vortices emerge in the bulk flow: see figure 14. These are centred in the colder regions and are essentially parallel to the horizontal plane. The strength of these vortices diminishes with time as the interface temperature is homogenized by the central stream of warm fluid as well as by the heat being transported towards the cold vortices from the contact line due to both conduction and convection. Eventually the vortices disappear, along with the preferential direction of the Marangoni convection, and the drop reaches its new quasi-steady equilibrium wherein the apex is the coldest region and the interface flow is mainly radial towards the apex. Azimuthal components also emerge in this new quasi-steady equilibrium, but these are weaker than those reported for the drop with an elliptical contact area given that the interface geometry is less deformed. The interface temperature distribution during the intermediate transient stage is depicted in figure 15(a). Capturing these vortices in the laboratory is very difficult due to the relatively small range of the
 $T$
and because the transient stage after depinning for our chosen experiment lasts a very short period of time (
$T$
and because the transient stage after depinning for our chosen experiment lasts a very short period of time (
 ${\sim}0.8~\text{s}$
). Note that the drop volume at this point is quite small and thus any imbalance is quickly corrected by the substrate, whose dominance over the drop’s thermal field increases for decreasing
${\sim}0.8~\text{s}$
). Note that the drop volume at this point is quite small and thus any imbalance is quickly corrected by the substrate, whose dominance over the drop’s thermal field increases for decreasing
 $V$
. However, similar vortices are clearly observed during the initial transient stage of irregularly shaped colder drops placed on the heated substrate: see figure 15(b). By reducing the initial liquid temperature, the vortices emerge more vigorously and persist for longer times, which makes it easier to record them in the laboratory. The qualitative agreement between the numerical simulations (figure 15
a) and the experiments (figure 15
b) is excellent. Given the importance of these vortices in regulating the initial dynamics of evaporating drops, a follow-up investigation is being undertaken, the focus of which is on the detailed numerical and experimental study of these and similar three-dimensional features emerging in non-spherical drops with more diverse and complex contact areas.
$V$
. However, similar vortices are clearly observed during the initial transient stage of irregularly shaped colder drops placed on the heated substrate: see figure 15(b). By reducing the initial liquid temperature, the vortices emerge more vigorously and persist for longer times, which makes it easier to record them in the laboratory. The qualitative agreement between the numerical simulations (figure 15
a) and the experiments (figure 15
b) is excellent. Given the importance of these vortices in regulating the initial dynamics of evaporating drops, a follow-up investigation is being undertaken, the focus of which is on the detailed numerical and experimental study of these and similar three-dimensional features emerging in non-spherical drops with more diverse and complex contact areas.

Figure 15. Interface temperature showing the pair of counter-rotating vortices emerging during the rapid thermal adjustment in an irregular drop: (a) simulations, (b) IR image showing experimentally the emergence of counter-rotating vortices in evaporating drops with
 $\hat{T}_{0}=10\,^{\circ }\text{C}$
and
$\hat{T}_{0}=10\,^{\circ }\text{C}$
and
 $\hat{T}_{w}=70\,^{\circ }\text{C}$
.
$\hat{T}_{w}=70\,^{\circ }\text{C}$
.
6. Drop evaporation with a moving contact line
In general, the simulation of moving contact lines is rather complicated. The state of the art of the subject has been recently reviewed by Sui et al. (Reference Sui, Ding and Spelt2014). To date, only Murisic & Kondic (Reference Murisic and Kondic2011), via the lubrication approximation, and Karapetsas et al. (Reference Karapetsas, Matar, Valluri and Sefiane2012) have numerically considered the evaporating sessile drops with a moving contact line, but as pointed out by Sui et al. (Reference Sui, Ding and Spelt2014), they used a finite-element method for a single fluid with a free surface. Thus, DNS of a fully coupled two-phase flow with a moving contact line and phase change remains a challenge (Sui et al.
Reference Sui, Ding and Spelt2014). In addition, it should be noted that Karapetsas et al. (Reference Karapetsas, Matar, Valluri and Sefiane2012) examined an intermediate pinned-receding contact-line configuration rather than the pure CA mode, which makes their results inadequate for comparison with either of the limiting modes. The versatility of the DI method allows simulation of the pure CA mode with minor changes as the interface thickness circumvents the stress singularity at the MCL (Seppecher Reference Seppecher1996; Jacqmin Reference Jacqmin2000). Here, we present DNS of our fully coupled two-phase model for a drop evaporating in the pure CA mode, and compare the results with those of the same drop evaporating according to the CR mode. The latter correspond to those presented during the model validation against the experimental data in § 4. The governing groups, mesh, initial conditions, etc., are kept the same as those listed in § 4. The interface evolution in the CR and CA modes is presented in figures 16(a) and 16(b), respectively. In what follows, the initial transient stage (
 ${<}3\,\%$
of
${<}3\,\%$
of
 $t_{tot}$
) is left out for the sake of simplicity, restricting the discussion to the quasi-steady flow
$t_{tot}$
) is left out for the sake of simplicity, restricting the discussion to the quasi-steady flow

Figure 16. Interface evolution for a drop evaporating according to the (a) CR and (b) CA pure modes with
 $\hat{T}_{w}=40\,^{\circ }\text{C}$
and
$\hat{T}_{w}=40\,^{\circ }\text{C}$
and
 ${\rm\Delta}\hat{T}=14.6\,^{\circ }\text{C}$
. The time interval between interface snapshots is
${\rm\Delta}\hat{T}=14.6\,^{\circ }\text{C}$
. The time interval between interface snapshots is
 ${\rm\Delta}t=7.5\times 10^{4}$
. (c) Ratio of the evaporation rate to the contact-line speed
${\rm\Delta}t=7.5\times 10^{4}$
. (c) Ratio of the evaporation rate to the contact-line speed
 $(\text{d}V/\text{d}t)/(\text{d}R/\text{d}t)$
versus instantaneous base radius
$(\text{d}V/\text{d}t)/(\text{d}R/\text{d}t)$
versus instantaneous base radius
 $R$
for the drop evaporating in the CA mode (logarithmic scales).
$R$
for the drop evaporating in the CA mode (logarithmic scales).
In other typical MCL problems, such as drop coalescence or drop spreading, predicting the contact-line motion is a challenge intimately related to the flow regime given by the Ohnesorge number
 $\mathit{Oh}=\hat{{\it\mu}}_{l}/\sqrt{\hat{{\it\rho}}_{l}\hat{{\it\sigma}}_{0}\hat{R_{0}}}$
. Very low values of
$\mathit{Oh}=\hat{{\it\mu}}_{l}/\sqrt{\hat{{\it\rho}}_{l}\hat{{\it\sigma}}_{0}\hat{R_{0}}}$
. Very low values of
 $\mathit{Oh}$
denote flows wherein inertia and/or surface-tension forces are dominant over viscous stresses. Under such conditions, use of the currently available MCL models is justified provided the grid spacing in the contact line region is small enough for the viscosity and surface tension to be the dominant forces. In other words, the mesh must be able to resolve the flow not only on the macroscale but also simultaneously on the microscale, which is easily below
$\mathit{Oh}$
denote flows wherein inertia and/or surface-tension forces are dominant over viscous stresses. Under such conditions, use of the currently available MCL models is justified provided the grid spacing in the contact line region is small enough for the viscosity and surface tension to be the dominant forces. In other words, the mesh must be able to resolve the flow not only on the macroscale but also simultaneously on the microscale, which is easily below
 $O(10^{-4})$
of the macroscale (Sui et al.
Reference Sui, Ding and Spelt2014). The reader should note, however, that this is not necessary to solve the CA evaporation mode under consideration. The generally tremendous complexity of predicting the contact-line motion is greatly simplified here due to the fact that this is very slow and a direct consequence of evaporation only, even though the
$O(10^{-4})$
of the macroscale (Sui et al.
Reference Sui, Ding and Spelt2014). The reader should note, however, that this is not necessary to solve the CA evaporation mode under consideration. The generally tremendous complexity of predicting the contact-line motion is greatly simplified here due to the fact that this is very slow and a direct consequence of evaporation only, even though the
 $\mathit{Oh}=O(0.001)$
number suggests an inertial-capillary regime. This is demonstrated as follows. It is trivial to show that the volume of a spherical cap
$\mathit{Oh}=O(0.001)$
number suggests an inertial-capillary regime. This is demonstrated as follows. It is trivial to show that the volume of a spherical cap
 $(0^{\circ }<{\it\theta}\leqslant 90^{\circ })$
can be calculated in terms of
$(0^{\circ }<{\it\theta}\leqslant 90^{\circ })$
can be calculated in terms of
 $R$
and
$R$
and
 ${\it\theta}$
as
${\it\theta}$
as
 $V={\rm\pi}C_{1}(3+C_{1}^{2})R^{3}/6$
, where
$V={\rm\pi}C_{1}(3+C_{1}^{2})R^{3}/6$
, where
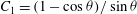 $C_{1}=(1-\cos {\it\theta})/\sin {\it\theta}$
. Since
$C_{1}=(1-\cos {\it\theta})/\sin {\it\theta}$
. Since
 $C_{1}$
is constant in the CA mode, it follows that
$C_{1}$
is constant in the CA mode, it follows that
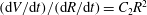 $(\text{d}V/\text{d}t)/(\text{d}R/\text{d}t)=C_{2}R^{2}$
, with
$(\text{d}V/\text{d}t)/(\text{d}R/\text{d}t)=C_{2}R^{2}$
, with
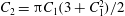 $C_{2}={\rm\pi}C_{1}(3+C_{1}^{2})/2$
. In other words, the representation of the ratio of evaporation rate to contact-line speed,
$C_{2}={\rm\pi}C_{1}(3+C_{1}^{2})/2$
. In other words, the representation of the ratio of evaporation rate to contact-line speed,
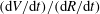 $(\text{d}V/\text{d}t)/(\text{d}R/\text{d}t)$
, versus the instantaneous base radius,
$(\text{d}V/\text{d}t)/(\text{d}R/\text{d}t)$
, versus the instantaneous base radius,
 $R$
, should be linear in logarithm scale. Figure 16(c) shows that this is effectively observed in the CA case under consideration. Also, if evaporation dictates the contact-line movement, when
$R$
, should be linear in logarithm scale. Figure 16(c) shows that this is effectively observed in the CA case under consideration. Also, if evaporation dictates the contact-line movement, when
 $(\text{d}V/\text{d}t)\rightarrow 0$
then
$(\text{d}V/\text{d}t)\rightarrow 0$
then
 $(\text{d}R/\text{d}t)\rightarrow 0$
. This criterion is employed to numerically test that a drop wherein the liquid loss is artificially switched off (
$(\text{d}R/\text{d}t)\rightarrow 0$
. This criterion is employed to numerically test that a drop wherein the liquid loss is artificially switched off (
 $S=0$
in (2.8)) results in a motionless contact line. Hence, it is concluded that the inertial-capillary regime suggested by the Ohnesorge number in the context of spreading/coalescence is not applicable for sessile drops evaporating slowly in the CA mode. It is therefore not necessary to go to the microscale in order to predict the contact-line motion.
$S=0$
in (2.8)) results in a motionless contact line. Hence, it is concluded that the inertial-capillary regime suggested by the Ohnesorge number in the context of spreading/coalescence is not applicable for sessile drops evaporating slowly in the CA mode. It is therefore not necessary to go to the microscale in order to predict the contact-line motion.
The instantaneous drop evolution for the CR and CA modes is compared in figure 17. Figure 17(a) demonstrates the capacity of the DI model to maintain
 ${\it\theta}$
constant (CA mode) while
${\it\theta}$
constant (CA mode) while
 $R$
recedes in a weakly non-linear fashion (figure 17
c). The height
$R$
recedes in a weakly non-linear fashion (figure 17
c). The height
 $H$
decays more progressively in the CA mode than in the CR mode (figure 17
b). As Picknett & Bexon (Reference Picknett and Bexon1977) predicted for the isothermal problem, the drops have almost an identical volume
$H$
decays more progressively in the CA mode than in the CR mode (figure 17
b). As Picknett & Bexon (Reference Picknett and Bexon1977) predicted for the isothermal problem, the drops have almost an identical volume
 $V$
during a relatively large period of time,
$V$
during a relatively large period of time,
 $t\sim 6\times 10^{5}$
, after which the deviation in
$t\sim 6\times 10^{5}$
, after which the deviation in
 $V$
becomes more evident. The CA mode leads to lower evaporation rates and therefore longer lifetimes, once again in agreement with Picknett & Bexon (Reference Picknett and Bexon1977) and subsequent works.
$V$
becomes more evident. The CA mode leads to lower evaporation rates and therefore longer lifetimes, once again in agreement with Picknett & Bexon (Reference Picknett and Bexon1977) and subsequent works.

Figure 17. Instantaneous drop parameters for a water drop evaporating according to the CR and CA pure modes with
 $\hat{T}_{w}=40\,^{\circ }\text{C}$
with
$\hat{T}_{w}=40\,^{\circ }\text{C}$
with
 ${\rm\Delta}\hat{T}=14.6\,^{\circ }\text{C}$
. (a) Contact angle
${\rm\Delta}\hat{T}=14.6\,^{\circ }\text{C}$
. (a) Contact angle
 ${\it\theta}$
, (b) drop height
${\it\theta}$
, (b) drop height
 $H$
, (c) contact radius
$H$
, (c) contact radius
 $R$
, and (d) volume
$R$
, and (d) volume
 $V$
.
$V$
.
At first sight, the volume
 $V$
seems to vary linearly in the CR mode. However, a detailed analysis of the curves shows that
$V$
seems to vary linearly in the CR mode. However, a detailed analysis of the curves shows that
 $V(t)$
is non-linear for both the CR and CA cases. The variation of the evaporation rate
$V(t)$
is non-linear for both the CR and CA cases. The variation of the evaporation rate
 $m(t)$
with time is depicted in figure 18(a). In agreement with Picknett & Bexon (Reference Picknett and Bexon1977), we find that, in the CA mode, the rate is less and declines much more evenly over the entire lifetime of the drop. In the CR mode, however, Picknett & Bexon (Reference Picknett and Bexon1977) predicted an essentially linear evolution of
$m(t)$
with time is depicted in figure 18(a). In agreement with Picknett & Bexon (Reference Picknett and Bexon1977), we find that, in the CA mode, the rate is less and declines much more evenly over the entire lifetime of the drop. In the CR mode, however, Picknett & Bexon (Reference Picknett and Bexon1977) predicted an essentially linear evolution of
 $m(t)$
in time (for the range of
$m(t)$
in time (for the range of
 ${\it\theta}$
considered here) based purely on geometric factors. Our computations, which also include non-isothermal dynamics, clearly reveal a non-linear tendency. Comparatively, we find that the initially linear
${\it\theta}$
considered here) based purely on geometric factors. Our computations, which also include non-isothermal dynamics, clearly reveal a non-linear tendency. Comparatively, we find that the initially linear
 $m(t)$
decay is mitigated towards the end of the drop’s lifetime, suggesting that there is some temperature-associated phenomenon becoming more relevant at later times which contributes positively to
$m(t)$
decay is mitigated towards the end of the drop’s lifetime, suggesting that there is some temperature-associated phenomenon becoming more relevant at later times which contributes positively to
 $m(t)$
.
$m(t)$
.

Figure 18. Instantaneous drop evaporation in the CR versus CA modes with
 $\hat{T}_{w}=40\,^{\circ }\text{C}$
and
$\hat{T}_{w}=40\,^{\circ }\text{C}$
and
 ${\rm\Delta}\hat{T}=14.6\,^{\circ }\text{C}$
. (a) Evaporation rate
${\rm\Delta}\hat{T}=14.6\,^{\circ }\text{C}$
. (a) Evaporation rate
 $m(t)$
. (b) Area-averaged interface temperature
$m(t)$
. (b) Area-averaged interface temperature
 $\bar{T}_{i}$
, and interface surface area
$\bar{T}_{i}$
, and interface surface area
 $A_{i}$
.
$A_{i}$
.
Figure 18(b) illustrates the instantaneous area-averaged interface temperature
 $\bar{T}_{i}=\int T_{i}r_{i}\,\text{d}l_{i}/\!\int r_{i}\,\text{d}l_{i}$
for the CR and CA modes, where
$\bar{T}_{i}=\int T_{i}r_{i}\,\text{d}l_{i}/\!\int r_{i}\,\text{d}l_{i}$
for the CR and CA modes, where
 $T_{i}$
is the interface temperature at the radial coordinate
$T_{i}$
is the interface temperature at the radial coordinate
 $r_{i}$
over a differential interface arc of length
$r_{i}$
over a differential interface arc of length
 $\text{d}l_{i}$
. As assumed, in the CR mode the average interface temperature
$\text{d}l_{i}$
. As assumed, in the CR mode the average interface temperature
 $\bar{T}_{i}$
increases as the drops become thinner, and consequently the local saturation pressure
$\bar{T}_{i}$
increases as the drops become thinner, and consequently the local saturation pressure
 $p_{s}$
is higher on average. Given that
$p_{s}$
is higher on average. Given that
 $p_{s}$
is an exponential function of
$p_{s}$
is an exponential function of
 $T$
, the rate of decay in
$T$
, the rate of decay in
 $m(t)$
due to the geometric readjustment is partially counteracted by the evaporation-rate enhancement associated with the transient thermal field. This appears to be a reasonable explanation for the final flattening of
$m(t)$
due to the geometric readjustment is partially counteracted by the evaporation-rate enhancement associated with the transient thermal field. This appears to be a reasonable explanation for the final flattening of
 $m(t)$
, but a more detailed parametric investigation is necessary to provide a conclusive answer to this conjecture.
$m(t)$
, but a more detailed parametric investigation is necessary to provide a conclusive answer to this conjecture.
However, it is very important to realize that, in the CA mode, the average interface temperature essentially remains constant
 $(\bar{T}_{i}=0.819)$
as the drop reduces in size (figure 18
b). Although this might not be intuitive at first, it is logical if we bear in mind that the MCL in the CA mode leads to intermediate drop profiles which maintain the same geometric ratio. It follows that, in essence, the rate of decay in
$(\bar{T}_{i}=0.819)$
as the drop reduces in size (figure 18
b). Although this might not be intuitive at first, it is logical if we bear in mind that the MCL in the CA mode leads to intermediate drop profiles which maintain the same geometric ratio. It follows that, in essence, the rate of decay in
 $m(t)$
in the CA mode is due to geometric factors alone, and is not affected by transient changes in the thermal field as in the CR mode. Hence, transient thermal changes during the drop evaporation contribute to increase
$m(t)$
in the CA mode is due to geometric factors alone, and is not affected by transient changes in the thermal field as in the CR mode. Hence, transient thermal changes during the drop evaporation contribute to increase
 $m(t)$
in the CR mode (the average drop temperature rises) but are irrelevant in the CA mode (the average drop temperature remains constant), which allows us to reach a conclusion that Picknett & Bexon (Reference Picknett and Bexon1977) could not provide: the higher the substrate temperature, the larger the difference between the lifetimes in the CA (longer) and CR (shorter) evaporation modes. In other words, for increasing temperature, the evaporation rate increases more rapidly in the CR mode than in the CA mode.
$m(t)$
in the CR mode (the average drop temperature rises) but are irrelevant in the CA mode (the average drop temperature remains constant), which allows us to reach a conclusion that Picknett & Bexon (Reference Picknett and Bexon1977) could not provide: the higher the substrate temperature, the larger the difference between the lifetimes in the CA (longer) and CR (shorter) evaporation modes. In other words, for increasing temperature, the evaporation rate increases more rapidly in the CR mode than in the CA mode.
To conclude, we also present in figure 18(b) the instantaneous interface surface area
 $A_{i}$
. In the CR mode,
$A_{i}$
. In the CR mode,
 $A_{i}$
decreases non-linearly, approaching asymptotically the theoretically final interface area, which is finite, i.e. as
$A_{i}$
decreases non-linearly, approaching asymptotically the theoretically final interface area, which is finite, i.e. as
 $V\rightarrow 0$
then
$V\rightarrow 0$
then
 $A_{i}\rightarrow {\rm\pi}R_{0}^{2}$
. In the CA mode, on the other hand, the
$A_{i}\rightarrow {\rm\pi}R_{0}^{2}$
. In the CA mode, on the other hand, the
 $A_{i}$
decay is more pronounced, effectively linear, and approaches zero, i.e. as
$A_{i}$
decay is more pronounced, effectively linear, and approaches zero, i.e. as
 $V\rightarrow 0$
then
$V\rightarrow 0$
then
 $A_{i}\rightarrow 0$
.
$A_{i}\rightarrow 0$
.
7. Conclusions
Despite the fact that most evaporating sessile drops in real-life applications are non-spherical or display a number of three-dimensional phenomena, e.g. the thermocapillary instabilities recently reported by Sefiane et al. (Reference Sefiane, Moffat, Matar and Craster2008), the theoretical and numerical work available in the literature has been restricted to the two-dimensional axisymmetric problem for the sake of simplicity. It should be noted that Karapetsas et al. (Reference Karapetsas, Matar, Valluri and Sefiane2012) examined the instabilities reported by Sefiane et al. (Reference Sefiane, Moffat, Matar and Craster2008), but their study was restricted to linear theory in three dimensions. In this investigation we present a novel fully coupled two-phase model based on the DI method to conduct three-dimensional direct numerical simulations of deformed drops evaporating on a heated substrate. In addition, both the pinned and MCL configurations are addressed. To the best of our knowledge, this is the first time such an investigation has been presented.
The discussion begins in § 4 with the model validation against the data from a set of experiments, presented in § 3, wherein the evaporation of water drops in controlled environments is investigated by means of optical and IR techniques. The substrate temperature is varied in the range
 $40{-}70\,^{\circ }\text{C}$
. Good quantitative agreement is achieved for the instantaneous drop parameters (figure 4) as well as the interface temperature (figure 5). The initial transient heating in the two-dimensional axisymmetric problem is compared for different levels of temperature. It is observed that, as the temperature increases, the increasing prominence of the Marangoni convection leads the heating of the drop to occur through its core, a mechanism referred to as interior heating in § 4.2. At moderate heating, on the other hand, the mechanism of heat transfer is not significantly affected by the Marangoni effect and the drop reaches thermal (quasi-) equilibrium via peripheral conduction.
$40{-}70\,^{\circ }\text{C}$
. Good quantitative agreement is achieved for the instantaneous drop parameters (figure 4) as well as the interface temperature (figure 5). The initial transient heating in the two-dimensional axisymmetric problem is compared for different levels of temperature. It is observed that, as the temperature increases, the increasing prominence of the Marangoni convection leads the heating of the drop to occur through its core, a mechanism referred to as interior heating in § 4.2. At moderate heating, on the other hand, the mechanism of heat transfer is not significantly affected by the Marangoni effect and the drop reaches thermal (quasi-) equilibrium via peripheral conduction.
The body of this study is concerned with the analysis of irregular drops in three dimensions, a discussion which is presented in § 5. Two scenarios are studied. First we consider the case of a drop that is deformed at its inception due to non-perpendicular dosing onto the substrate, i.e. the drop’s contact area is elliptical. The resulting drop geometry is very complex and its interface thermal distribution leads to the emergence of Marangoni stresses perpendicular to the radial direction across the apex. As a result, azimuthal currents develop in the drop’s bulk flow (figure 11). These drive liquid to the centres of recirculation vortices established on the vertical plane across the longest ellipse’s axis from the centres of the vortices appearing on the other principal vertical plane. In a second case, we examine the dynamics of the typical irregular drop resulting from the first contact-line depinning undergone by an initially spherical drop. This phenomenon is typically observed in the experiments towards the end of the drop’s lifetime. The abrupt contact-line readjustment experienced by the drop to regain equilibrium induces an intermediate transient stage in the flow. This rapidly evolves to reach a different quasi-steady-state equilibrium for the new geometric configuration at the next pinning location. During this stage, the Marangoni convection adopts a preferential direction, which induces a pair of self-excited counter-rotating vortices within the drop (figure 14). These vortices play a prominent role in the bulk velocity field and transient mechanism of heat transfer. The drop displays two lateral cold spots (centred at the vortices) until the new thermal equilibrium is attached and the apex once again becomes the coldest location. These previously unknown phenomena present excellent agreement with the experimental observations, where the emergence of the vortices is captured by the IR camera (figure 15). Given the importance of these transient features, a parallel investigation is being undertaken, the focus of which is on the vortices’ emergence and dynamics.
For a given level of heating, it is known that the evaporation rate of a spherical drop depends on its volume and base-perimeter length. Unsurprisingly, this conclusion does not hold for deformed drops, as the length of the base perimeter and volume are not enough to define a unique drop interface. The evaporation rate is found to change in the same order of magnitude as the interface-surface area even when the volume and/or circumference are maintained. In addition, deformed drops display intricate wettability distributions (see figures 9 and 13) wherein the local contact angle in one drop can vary in a broad range (up to
 ${\sim}40^{\circ }$
in the cases studied here). It is shown that these distributions are intimately related to the curvature of the contact line, which provides an easy criterion to quickly estimate the local wettability distribution of complex three-dimensional drops. In general, the curvature is inversely proportional to the contact angle, i.e. points where the contact angle is minimum for the points where the contact-line curvature is maximum and vice versa. Other conclusions are that (i) the more deformed the contact-area, the wider the range of its contact angle, and (ii) the contact-angle distribution becomes more homogeneous in time due to evaporation.
${\sim}40^{\circ }$
in the cases studied here). It is shown that these distributions are intimately related to the curvature of the contact line, which provides an easy criterion to quickly estimate the local wettability distribution of complex three-dimensional drops. In general, the curvature is inversely proportional to the contact angle, i.e. points where the contact angle is minimum for the points where the contact-line curvature is maximum and vice versa. Other conclusions are that (i) the more deformed the contact-area, the wider the range of its contact angle, and (ii) the contact-angle distribution becomes more homogeneous in time due to evaporation.
To conclude, § 6 is devoted to comparing the instantaneous evolution of a pinned drop with that of the same drop evaporating according to the pure CA mode and therefore with a moving contact line. This serves to demonstrate the versatility and capacity of our two-phase three-dimensional model to address contact-line dynamics with minor modifications. Examining the isothermal problem, Picknett & Bexon (Reference Picknett and Bexon1977) concluded that the CA mode leads to a lower evaporation rate and therefore a longer lifetime. The same is true in the heated problem. However, it is found that the average interfacial temperature remains constant for most of the drop lifetime in the CA mode, while this increases in the CR mode as the drop becomes thinner. Thus, it is concluded that, for increasing temperature, the evaporation rate increases more rapidly in the CR mode than in the CA mode, which means that the difference between the lifetime of the former (shorter) and latter (longer) modes increases with heat.
Acknowledgements
The authors gratefully acknowledge the financial support of the EC through the ThermaPOWER project (IRSES GA-2011-294905), and EPSRC through the DTG grant (EP/P50550X/1) and Boiling in Microchannels project (EP/K00963X/1). This work made use of the facilities of ARCHER, the latest UK National Supercomputing Service. ARCHER provides a capability resource to allow researchers to run simulations and calculations that require large numbers of processing cores working in a tightly coupled, parallel fashion. The ARCHER Service is based at Edinburgh and is provided by the EPSRC, NERC, EPCC, Cray Inc. and the University of Edinburgh. Further access to the facilities of ARCHER was provided through the ARCHER Resource Allocation Panel, project number e174. The optimization of the DIM Solver is also being currently funded under the ARCHER Embedded Computational Science and Engineering (eCSE) Service.


