


Introduction
Adolescence is a crucial phase in human development when rapid social, biological and psychological development takes place (WHO, 2014). During this phase, adolescents (aged 10 to 19, as defined by the WHO) adopt more-defined social roles and lay the foundation for their futures (Sawyer et al., Reference Sawyer, Afifi, Bearinger, Blakemore, Dick, Ezeh and Patton2012, Reference Sawyer, Azzopardi, Wickremarathne and Patton2018). Adequate nutrition during this stage is essential for optimal growth and development and may affect the health of future generations (Black et al., Reference Black, Victora, Walker, Bhutta, Christian and de Onis2013). Neglecting the health of adolescents might impair earlier investments in maternal and child health (Resnick et al., Reference Resnick, Catalano, Sawyer, Viner and Patton2012). Although adolescent nutrition has recently gained more attention (Akseer et al., Reference Akseer, Al-Gashm, Mehta, Mokdad and Bhutta2017), research has mostly focused on 15- to 19-year old girls (Salam et al., Reference Salam, Hooda, Das, Arshad, Lassi, Middleton and Bhutta2016). Studies including boys and 10- to 14-year old adolescents are limited (The Lancet, 2015). Moreover, although in higher-income countries the interest in the determinants of adolescent nutrition has increased over recent decades, relatively little is known about the determinants of adolescent nutrition in low- and middle-income countries (LMICs). Furthermore, studies on adolescent nutrition have mostly focused on the effects of single determinants of nutritional status, such as food supplementation, media exposure, nutrition education and parental education (Singh et al., Reference Singh, Garg, Davey, Raghav, Muzammil and Singh2014; Lassi et al., Reference Lassi, Moin, Das, Salam and Bhutta2017; Chau et al., Reference Chau, Burgermaster and Mamykina2018), while only a few studies have tried to obtain a comprehensive overview of the sociocultural and economic determinants. Such a comprehensive overview is fundamental because human health and development, including nutritional status, are not only influenced by biological traits and the immediate setting, but also by underlying factors, broader environments and the interconnections between environments (Dahlgren & Whitehead, Reference Dahlgren and Whitehead1991). Suboptimal growth due to, among other things but not limited to, infant and child malnutrition and poor health might lead to linear growth retardation during childhood and adolescence and consequently short stature or stunting. Stunting is therefore a marker, rather than an outcome, of undernutrition and has been associated with impaired development, disease and loss of economic productivity (Leroy & Frongillo, Reference Leroy and Frongillo2019). Underweight, or thinness, more directly indicates nutrition deprivation (Best et al., Reference Best, Neufingerl, Van Geel, van den Briel and Osendarp2010; Black et al., Reference Black, Victora, Walker, Bhutta, Christian and de Onis2013) and is associated with reduced bone density and muscle strength and delayed pubertal maturation (Sellen, Reference Sellen1998). Identifying the relative contributions of individual-, household- and community-level determinants of adolescent stunting and thinness would allow policymakers to design integrated public health interventions targeting several levels. This is all the more necessary since the positive effect of one level can be cancelled out by determinants at another level (Dahlgren & Whitehead, Reference Dahlgren and Whitehead1991).
This study was inspired by a framework resulting from a systematic review in which the evidence on the multilevel determinants of adolescent undernutrition and micronutrient deficiencies in LMICs were charted (Madjdian et al., Reference Madjdian, Azupogo, Osendarp, Bras and Brouwer2018). This framework includes a broad range of sociocultural and economic determinants at the individual, household and community level. The present study aimed to test this model empirically and address the above-identified knowledge gaps using data from the 2014 Nepal Adolescent Nutrition Survey (NANS). The main research question was: which individual-, household- and community-level sociocultural and economic factors influence stunting and thinness of adolescent boys and girls aged 10–19 years in Nepal? To answer this research question, NANS data were used, including a wide range of individual, household, and community characteristics of adolescent boys and girls aged 10–19 years (Aryal et al., Reference Aryal, Mehta, Chalise, Mehata, Dhimal, Jha and Karki2016).
Nepal has a geographically diverse landscape with three agro-ecological zones: Mountains (Himal), Hills (Pahad) and Plains (Terai). Only 7% of the population resides in the Mountains area, where access to transport and communication facilities is limited (NPCS, 2012). In comparison, about 43% of the population lives in the Hills (NPCS, 2012). The southern part of Nepal, the Terai, is relatively flat and while it only comprises 23% of the total land area of Nepal, 50% of the population lives here (NPCS, 2012). At the time of the survey, Nepal was administratively divided into five development regions, fourteen zones and 75 districts restructured into seven provinces and 753 urban and rural municipalities after the promulgation of the new constitution in 2015.
Nepal is a multi-ethnic and multi-lingual country. In total, there are 126 different castes and ethnic groups and 123 spoken languages, with Nepali being the official language and mother tongue of 44.6% of the population. Most of the population (81.3%) is Hindu, followed by Buddhist (9%) and Muslim (4.4%) (NPCS, 2012). Like other South Asian countries, Nepal’s society largely remains patriarchal with prevailing inequalities in household decision-making processes according to gender, generation and age. Son preference and arranged and early marriages (below 18) remain commonplace (MoH et al., 2017; Yeung et al., Reference Yeung, Sonalde and Jones2018).
Nepal is considered to be at stage four of the nutrition transition (Subedi et al., Reference Subedi, Marais and Newlands2017). This transition is related to an increase in the national income level, population growth, migration, urbanization, reduced fertility and mortality rates and increasing life expectancy. Furthermore, the prevalence of underweight among children has decreased over the last 40 years, while rates of overweight, obesity and non-communicable diseases among women are increasing (Subedi et al., Reference Subedi, Marais and Newlands2017). Stunting (32.0% and 32.1%) and thinness (23.3% and 14.0%) among boys and girls aged 10–19 are, however, still a larger concern than overweight and obesity (4.8% and 4.3%) (MoHP et al., 2018). Large differences exist in life expectancy, nutritional status, access to health care and education between ethnicities and ecological zones (MoHP et al., 2018), making Nepal an interesting country to consider.
Methods
Data
Data from the 2014 Nepal Adolescent Nutrition Survey (Aryal et al., Reference Aryal, Mehta, Chalise, Mehata, Dhimal, Jha and Karki2016) were used. This survey aimed to explore the nutritional status of a nationally representative sample of 3773 adolescents (1888 boys and 1885 girls) aged 10–19 years in Nepal. The cross-sectional survey included demographic, socioeconomic and health characteristics, as well as anthropometric measurements. It was administered to the adolescents by trained enumerators. The sample was obtained by multi-stage cluster sampling in which agro-ecological (Mountains, Hills and Terai) and administrative (Eastern, Central, Western, Mid-Western and Far-Western) stratification were taken into account. In the first sampling stage, the thirteen study districts (Fig. 1) of the 2011 Nepal Demographic and Health Survey (NDHS) were used to obtain a representative sample of the agro-ecological and administrative strata. In the second stage, the Village Development Committees (VDCs) in rural areas or municipalities in urban areas, home to each selected district, were pooled and thirty VDCs were sampled by probability proportionate to size (PPS) from each ecological stratum. In the third stage, 21 male and 21 female adolescents were randomly selected from each sampled VDC or municipality. The sample size was weighted by the appropriate sample weights to obtain nationally representative results comparable to the 2011 NDHS to correct the data for the cluster survey design.
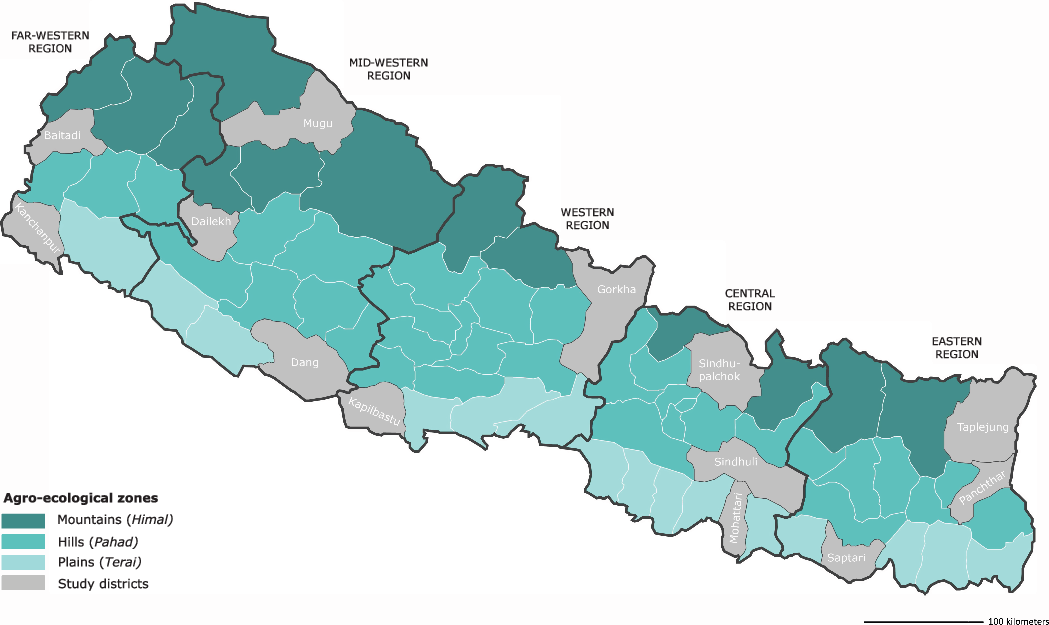
Figure 1. Study districts selected for the 2014 Nepal Adolescent Nutrition Survey depicted in grey.
Measures
Dependent variables
The dependent adolescent nutrition variables were the dichotomous variables short stature or stunting, indicated by height-for-age z-scores (HAZ), and underweight or thinness, indicated by BMI-for-age z-scores (BAZ). The HAZ indicates linear growth and is a broader marker of ‘the inadequacy of the environment to which children have been exposed’ (Leroy & Frongillo, Reference Leroy and Frongillo2019). Stunting (the failure to reach linear growth) is indicated by HAZ less than −2 SD from the population median. Hence, stunting is used as an indicator of a deficient growth environment, which includes, but is not limited to, nutrition (Leroy & Frongillo, Reference Leroy and Frongillo2019). Thinness, as indicated by BAZ less than −2 SD from the population median, reflects nutritional status and is therefore a more direct indicator of (acute) undernutrition (Onis et al., Reference Onis and Blossner1997). HAZ and BAZ were calculated based on the 2007 WHO growth references using WHO Anthro Plus software (Onis et al., Reference Onis, Onyango, Borghi, Siyam, Nishida and Siekmann2007). BAZ less than −5 or BAZ higher than 5 and HAZ less than −6 or HAZ higher than 6 were considered as inconsistent and unlikely and therefore coded as missing values (Onis et al., Reference Onis, Onyango, Borghi, Siyam, Nishida and Siekmann2007). Due to missing data or inconsistencies in height or weight, 52 adolescents (1.4% of the total sample) were excluded from the analysis on stunting and 61 adolescents (1.6% of total sample) from the analysis on thinness.
Independent variables
The independent variables were selected based on previous research on the determinants of nutritional status in LMICs and in Nepal specifically. They were derived from the child nutritional status literature and the review by Madjdian et al. (Reference Madjdian, Azupogo, Osendarp, Bras and Brouwer2018). The variables were divided into three groups: individual, household and community determinants (Table 1). A small majority (53.1%) of the sample was female. The age of the adolescents ranged from 10 to 19 years and the mean age of the sample was 13.92 years. Adolescents were split into young (10–14 years, 60.0%) and older (15–19 years, 40.0%) age groups. Only 1.8% of the sampled adolescent boys and 3.6% of the adolescent girls were married. Of these married adolescents, 21.0% resided in the Central Mountains area, 19.1% in the Mid-Western Hills and 12.1% in the Western Plains (Terai). Religion was categorized as Hindu or non-Hindu. The majority (83.2%) of adolescents were Hindu. The caste/ethnicity categorization (six groups) was based on the STEPS Survey Nepal 2013 categorization (Aryal et al., Reference Aryal, Neupane, Mehata, Vaidya, Singh and Paulin2014): 39.8% of adolescents were Brahmin/Chhetri (Upper Caste), followed by disadvantaged Janajati (31.7%), Dalit (12.5%), disadvantaged non-Dalit Terai castes (9.7%), relatively advantaged Janajati (5.7%) and religious minorities (1.6%). The last group mainly included Muslim adolescents (95%). Footwear was coded ‘1’ if adolescents reported wearing shoes when going outside and ‘0’ otherwise. Wearing shoes was common among the majority of adolescents (96.9%). Almost half of the adolescents had nutrition knowledge, which was determined by asking them whether they knew about nutrition (1) or not (0).
Table 1. Distribution of Nepalese adolescents by background characteristics, 2014 Nepal Adolescent Nutrition Survey
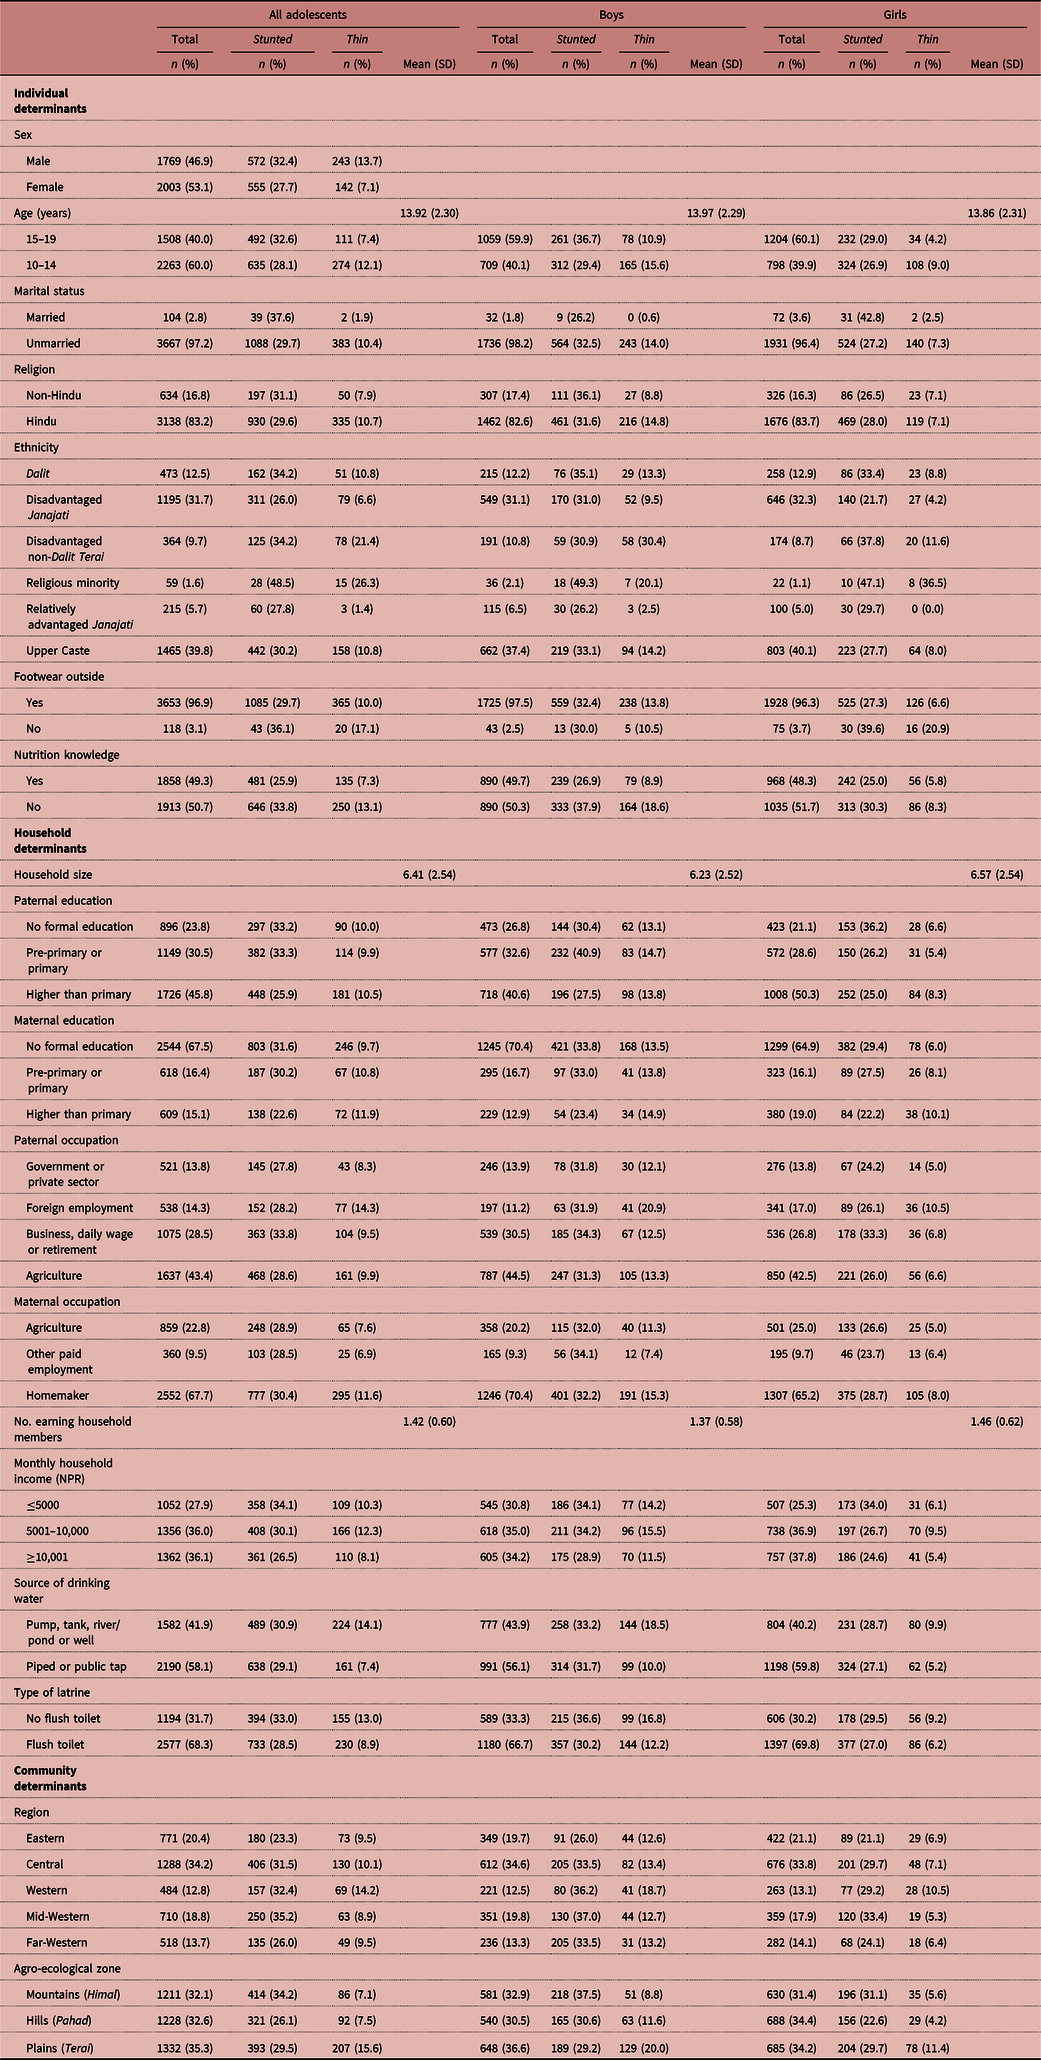
Household determinants included household size (numbers of members, including the respondent), ranging from two to 32 with an average of 6.41. Paternal and maternal education indicated the highest level of education completed by the father or mother. A distinction was made between no formal education, pre-primary or primary (grades 1–5) education and higher than primary education, including secondary education (grade 6–12) and beyond (university). Overall, 23.8% of the fathers and 67.5% of mothers had no formal education. Paternal occupation was divided into four sectors: government or private sector (including non-governmental organizations), agriculture, foreign employment (meaning that the father worked outside Nepal) and other paid employment, including business, daily wage (indicating that income was dependent on day-to-day and often seasonal work), retirement and ‘other’, comprising all occupations that did not fit into the aforementioned classification. More than two-fifths of the fathers were engaged in agriculture, followed by other paid employment (including business, daily wage, retirement and other) and foreign employment (28.5% and 14.3% respectively). Of the mothers, 67.7% were engaged in household labour (homemakers), followed by agriculture (22.8%) and other paid employment (9.5%). Monthly household income was used as a proxy for resources available to the household. The following categorization, as defined in the survey, was used: ≤5000 NPR, 5001–10,000 NPR and ≥10,001 NPR. The adolescents were almost evenly distributed among these groups. The average number of earning members in the household, indicating the number of members who contributed to the monthly household income, was 1.42. The main source of drinking water was piped water (either from a public tap or at home), which was available in almost three-fifths of the households. The remaining two-fifth sourced their water from a river/pond, well or pump. About 68.3% had fixed flush toilets at home.
Community determinants included development (administrative) region, with Central taken as the reference category, accounting for the highest percentage of respondents in the sample. Due to the regionally stratified sampling design, adolescents were quite evenly distributed among the agro-ecological zones (Mountains, Hills and Terai). The Terai was taken as reference category, being home to a small majority of the adolescents.
Statistical analyses
Data were analysed using IBM SPSS Statistics 23. Dummy variables were created for all categorical variables. Multivariate logistic regressions were performed to determine the strength of the association between the potential predictors and stunting and thinness outcomes (Model 1). Due to substantial differences in the prevalence rates of stunting and thinness between boys and girls and young and older adolescents and expected differences between determinants, separate regression models were estimated for boys (Model 2), girls (Model 3), younger (10–14 years, Model 4) and older (15–19 years, Model 5) adolescents. Predictors were checked for multicollinearity using Variance Inflation Factors. The results of the multivariate logistic regression are presented using odds ratios (ORs) and 95% confidence intervals (CIs). Different levels of statistical significance p < 0.05, p < 0.01 and p < 0.001 are discerned and goodness-of-fit tests are presented.
Results
Prevalence of stunting and thinness
Figure 2 presents distributions of HAZ and BAZ by sex and age group. Stunting (HAZ<−2SD) was prevalent in almost a third of the study population (Table 2). The prevalence among adolescent boys was 32.7% (mean HAZ −1.46 ± 1.16) compared with 28.1% (mean HAZ −1.44 ± 1.05) in girls. Stunting was more prevalent in older (33.1%, mean HAZ −1.62 ± 0.97) than younger (28.3%, mean HAZ −1.33 ± 1.15) adolescents (Fig. 2a). Thinness (BAZ< ± 2SD) was less pronounced and affected only a tenth of the total study population. Thinness was prevalent in 14.0% of boys compared with 7.2% of girls (Table 2). Figure 2b shows that the mean BAZ of girls was closer to 0 than the mean BAZ of boys. In contrast to stunting, thinness was more frequent in the younger age group (12.3%, BAZ −0.74 ± 1.12) than in the older age group (7.5%, BAZ −0.64 ± 0.97) (Table 2).

Figure 2. Sex- and age-specific distribution of a) stunting and b) thinness.
Table 2. Weighted prevalence of stunting and thinness among adolescents

*p < 0.01; **p < 0.001.
Determinants of stunting
Binary multivariate logistic regression models were estimated to assess the effects of the selected determinants on stunting over normal stature. The presented ORs show the odds of being stunted compared with not being stunted for each specific determinant while keeping the other determinants constant. The results presented in Table 3 show that in the total population, boys and older adolescents had higher odds of stunting (OR = 1.17; p < 0.05 and OR = 1.58; p < 0.001, respectively). The increased odds of stunting in the male population were only found in the older age group (OR = 1.35; p < 0.05) and the increased odds in the older age group were found among both boys (OR = 2.05; p < 0.001) and girls (OR = 1.30; p < 0.05). In the total population, adolescents from the disadvantaged Janajati group had lower odds of stunting (OR = 0.70; p < 0.01). This association was also found for girls and younger adolescents (OR = 0.62; p < 0.01 and OR = 0.66; p < 0.01 respectively). The disadvantaged non-Dalit Terai group showed increased odds of stunting in the total, female and older adolescent populations (OR = 1.50; p < 0.05, OR = 2.00; p < 0.01 and OR = 1.76; p < 0.05, respectively). Among religious minorities, increased odds of stunting were found in the total and younger age groups (OR = 2.42; p < 0.01 and OR = 3.80; p < 0.01 respectively). Nutrition knowledge decreased the odds of stunting in all groups. The largest decrease, of 48% (p < 0.001), was found among boys.
Table 3. Adjusted odds ratios (aOR) and 95% confidence intervals (CIs) of stunting by individual, household and community determinants

*p < 0.05; **p < 0.01; ***p < 0.001.
Model 1: Hosmer and Lemeshow χ 2 16.55 (p = 0.08); Nagelkerke R 2 0.08.
Model 2: Hosmer and Lemeshow χ 2 3.44 (p = 0.90); Nagelkerke R 2 0.12.
Model 3: Hosmer and Lemeshow χ 2 18.52 (p = 0.02); Nagelkerke R 2 0.09.
Model 4: Hosmer and Lemeshow χ 2 5.86 (p = 0.66); Nagelkerke R 2 0.10.
Model 5: Hosmer and Lemeshow χ 2 10.37 (p = 0.24); Nagelkerke R 2 0.10.
At the household level, every additional household member increased the odds of stunting among boys by 7% (p < 0.01). Paternal pre-primary or primary education, compared with no formal education, increased the odds of stunting among boys (OR = 1.56; p < 0.01), while it decreased the odds of stunting among girls (OR = 0.72; p < 0.05). Paternal education beyond primary decreased the risk of stunting among all adolescents, girls and the younger adolescent subgroups (OR = 0.81; p < 0.05, OR = 0.66; p < 0.01 and OR = 0.73; p < 0.05). As for paternal education, paternal occupation in business, daily wage or retirement increased the odds in the total, female and older populations (OR = 1.35; p < 0.01, OR = 1.46; p < 0.01 and OR = 1.72; p < 0.001, respectively). An increasing number of earning members in the household was associated with a decreased likelihood of stunting in the total, male and younger age groups. The largest decrease was found in adolescent boys (OR = 0.62; p < 0.001). Furthermore, a monthly household income below 5000 NPR compared with a monthly income above 10,001 NPR increased the odds of stunting in the older adolescent population (OR = 1.52; p < 0.01).
At the community level, residing in the Mid-Western development region was associated with higher stunting odds (OR = 1.62; p < 0.001), while residing in the Eastern region was associated with decreased stunting odds (OR = 0.67; p < 0.001). In the separate models, residing in the Mid-Western region increased the odds of stunting in adolescent boys (OR = 1.55; p < 0.05) and girls (OR = 1.61; p < 0.01), while residence in the Eastern region decreased the odds among younger adolescents (OR = 0.64; p < 0.01). Residence in both the Western and Mid-Western regions increased the odds in older adolescents (OR = 2.04; p < 0.001 and OR = 2.16; p < 0.001). Additionally, adolescent boys living in the Mountain and Hill areas were 2.28 (p < 0.001) and 1.58 (p < 0.05) times more likely to be stunted compared with adolescent boys living in the Terai, while adolescent girls living in the Hills, were less likely to be stunted (OR = 0.63; p < 0.05). Similarly, young adolescents residing in the Mountains showed increased odds of stunting (OR = 2.39; p < 0.001).
Determinants of thinness
Table 4 shows the relationship between sociocultural and economic determinants and thinness of adolescents. The binary logistic regression model shows that adolescent boys were 2.32 (p < 0.001) times more likely to be thin than girls. This association was confirmed in the separate age group models where younger and older boys were 2.07 (p < 0.001) and 3.12 (p < 0.001) times more likely to be thin than girls their age. In Model 1, the older age group had a lower likelihood of thinness (OR = 0.72; p < 0.05) compared with the younger age group. This association was only found for girls (OR = 0.54; p < 0.01). Being married decreased the mean chance of thinness (OR = 0.22; p < 0.05) in the total population. This association was not found in the separate models. Disadvantaged Janajatis showed lower thinness odds in all models. The largest decrease was found amongst older adolescents (OR = 0.30; p < 0.01). Adolescents belonging to a religious minority showed increased odds of thinness (OR = 1.28; p < 0.001). Model 2 showed lower odds for relatively advantaged Janajati boys (OR = 0.15; p < 0.01), while Model 3 showed decreased odds of thinness (OR = 0.38; p < 0.001) among disadvantaged Janajati girls. Among younger adolescents, lower odds were found for relatively advantaged Janajati (OR = 0.15; p < 0.01), while the older age group showed decreased odds for Dalit (OR = 0.42; p < 0.05). Wearing footwear outdoors was associated with lower thinness odds for girls only (OR = 0.37; p < 0.01). The likelihood of thinness was lower among adolescents with nutrition knowledge in all models, except for girls. The largest decrease was found in adolescent boys (OR = 0.45; p < 0.001).
Table 4. Adjusted odds ratios (aOR) and 95% confidence intervals (CIs) of individual, household, and community determinants of thinness

*p < 0.05; **p < 0.01; *** p < 0.001.
Model 1: Hosmer and Lemeshow χ 2 10.32 (p = 0.24); Nagelkerke R 2 0.15.
Model 2: Hosmer and Lemeshow χ 2 18.44 (p = 0.02); Nagelkerke R 2 0.15.
Model 3: Hosmer and Lemeshow χ 2 18.52 (p = 0.02); Nagelkerke R 2 0.16.
Model 4: Hosmer and Lemeshow χ 2 16.47 (p = 0.04); Nagelkerke R 2 0.13.
Model 5: Hosmer and Lemeshow χ 2 10.99 (p = 0.20); Nagelkerke R 2 0.25.
At the household level, adolescents whose mothers attained beyond primary education were 1.52 times (p < 0.05) more likely to be thin that adolescents whose mothers had no formal education. This effect was also found in the younger adolescent subgroup (OR = 1.60; p < 0.05). Paternal foreign employment increased the odds of thinness by 47% (p < 0.05) in the total and 74% (p < 0.05) in the male population. Among young adolescents, paternal occupation in business, daily wage or retirement decreased the odds by 38% (p < 0.01) compared with agricultural occupation. A decrease of 37% in thinness was found in older adolescents with every additional earning household member. A monthly household income of 10,000 NPR or below increased the odds of thinness compared with a monthly income of 10,001 NPR or above. While a monthly family income below 5000 NPR increased the likelihood of thinness in the older population (OR = 1.96; p < 0.05), a monthly family income between 5001 and 10,000 NPR increased the risk of thinness in all models.
At the community level, residing in the Mid-Western and Far-Western development regions was associated with decreased odds of thinness (OR = 0.68; p < 0.05 and OR = 0.59; p < 0.05 respectively). This effect was only found for boys and for older adolescents residing in the Far-Western region (OR = 0.53; p < 0.05 and OR = 0.33; p < 0.01, respectively). Additionally, decreased odds of thinness (OR = 0.44; p < 0.05) were found for older adolescents residing in the Western development region compared with their counterparts in the Central region. Similarly, adolescents residing in the Mountains or Hills had a lower risk (OR = 0.43; p < 0.001 and OR = 0.48; p < 0.01, respectively) of thinness compared with their counterparts living in the Terai. This association was also found for boys living in the Mountains (OR = 0.40; p < 0.01), girls residing in the Hills (OR = 0.28; p < 0.01), young adolescents residing in the Mountains and Hills (OR = 0.47; p < 0.01 and OR = 0.31; p < 0.001 respectively) and older adolescents residing in the Mountains (OR = 0.22; p < 0.01).
Discussion
This study provides a multi-level overview of the wide range of sex- and age-specific individual-, household- and community-level sociocultural and economic determinants that influence the odds of stunting and thinness among adolescent boys and girls aged 10–19 years in Nepal. The findings show a widespread prevalence of both stunting and thinness among Nepali adolescents leading to the conclusion that many of them grow up in a deficient growth environment or might suffer from inadequate diets. Generally, boys were found to be more at risk of stunting and thinness than girls. Stunting increased with age, while thinness odds decreased with age. Male sex, older age, belonging to a religious minority, paternal occupation in business, daily wage, retirement or other and living in the Mid-Western and Mountain areas were among the main risk factors for stunting. Belonging to a disadvantaged Janajati caste/ethnicity, paternal education beyond primary education, higher number of household earning members, nutritional knowledge and living in the Eastern development region were protective against stunting. Male sex, belonging to a religious minority, a low household income, maternal education beyond primary education and paternal foreign employment were the main factors associated with increased odds of thinness. Older age, being married, identifying as disadvantaged Janajati, living in Mid-Western or Far-Western regions, and Hills and Mountains regions and having nutritional knowledge, decreased the risk of thinness in most populations.
In line with previous studies based on DHS data from South Asia, the male sex has been associated with higher odds of both stunting and thinness (Benedict et al., Reference Benedict, Schmale and Namaste2018). Higher thinness odds might be explained by boys’ increased energy expenditure due to more participation in labour activities, possibly in combination with school enrolment. Girls might be at lower risk due to increased involvement in cooking, during which they might be able to consume more food (Yamanaka & Ashworth, Reference Yamanaka and Ashworth2002; Madjdian et al., Reference Madjdian, Azupogo, Osendarp, Bras and Brouwer2018). However, stunting indicates more than nutrition deficiencies, but also links to a multitude of factors, including a low-quality diet, poor health status and environmental and societal challenges. Because these factors have not all been captured in this survey, it goes beyond the scope of this study to explain why adolescent boys, and in particular older boys, have higher odds of stunting than girls. Explanations provided in the literature range from biological to sociocultural, including different puberty growth spurt onsets, childhood feeding practices, boys’ greater risk of morbidity and mortality in early life and societal influences due to gender inequality (Svefors et al., Reference Svefors, Pervin, Islam Khan, Rahman, Ekström and El Arifeen2020). Further research could thus benefit from including indicators such as energy expenditure and adolescent time use.
Age was found to be associated with stunting among both boys and girls in Nepal. This finding does not corroborate previous literature showing that a generally declining stunting trend during adolescence results from catch-up growth at later age, which compensates for earlier-age growth deficits (Gausman et al., Reference Gausman, Kim and Subramanian2019; Astatkie, Reference Astatkie2020). The present study also did not find a significantly higher prevalence of stunting among boys compared with girls, which has been previously explained by boys not having reached their full height due to a later onset of puberty than girls, who generally have reached their full height (Sawyer et al., Reference Sawyer, Azzopardi, Wickremarathne and Patton2018). However, stunting is influenced by prenatal, infant and childhood experience and fluctuates during childhood and adolescence. Hence, both recovery and growth faltering or stunting persistence may take place (Dewey & Begum, Reference Dewey and Begum2011; Sawyer et al., Reference Sawyer, Azzopardi, Wickremarathne and Patton2018). It is likely that adolescents who were already stunted during childhood have a higher probability of growing into stunted adults, while non-stunted adolescents have lower stunting odds in adolescence or adulthood (Gausman et al., Reference Gausman, Kim and Subramanian2019; Astatkie, Reference Astatkie2020). Another explanation could be that adolescents in the younger age group had lower stunting prevalence rates in early life and childhood than the older group. However, due to the cross-sectional design of this survey, it was not possible to determine causality or discern whether growth is inhibited during late adolescence. Additionally, it is important to note that the growth references commonly used to determine undernutrition face challenges related to ethnic and racial differences, as well as variations in growth spurts and potential and body composition and might thus overestimate stunting prevalence (Tumilowicz et al., Reference Tumilowicz, Beal, Neufeld and Frongillo2019). On the contrary to increased stunting with age, older age was associated with decreased odds of thinness in girls only. Although household ‘serving orders’, where for instance Hindu adolescent girls are served last during meals, still exist (Madjdian & Bras, Reference Madjdian and Bras2016; Morrison et al., Reference Morrison, Dulal, Harris-Fry, Basnet, Sharma and Shrestha2018), it is also possible that older girls receive more food when being prepared for marriage or pregnancy (Harris-Fry et al., Reference Harris-Fry, Shrestha, Costello and Saville2017).
The positive association between nutrition knowledge and nutritional status found in all groups, except for girls for thinness (OR = 0.96; p = 0.84), could be explained by nutrition knowledge being a driver for healthier food choices. Moreover, it might create a spill-over effect by, for instance, educating parents about nutrition. The study findings are in line with a previous study among Bangladeshi adolescent girls aged 13–18 years, which found no association between the awareness of increased nutrient requirements during adolescence and stunting or thinness in girls (Alam et al., Reference Alam, Roy, Ahmed and Ahmed2010). The absence of an effect of nutrition knowledge on thinness among girls in this study could be explained by the fact that girls are more involved in food preparation and cooking from an early age, and underestimate their knowledge, or that girls have less agency than their male counterparts, who might be better able to act on their knowledge when it comes to food- and health-related decision-making. Assuming nutritional knowledge is partly gained at school it might also be related, particularly in the older age group, to lower (secondary) school completion rates. Out-of-school girls are ‘less reached’ by educational programmes (Alam et al., Reference Alam, Roy, Ahmed and Ahmed2010). Although the gender gap in primary and secondary education in Nepal is narrowing, many girls are at risk of dropping out of, or skipping, school due to financial or social reasons. Unfortunately, data on adolescents’ educational attainment are missing. Nutrition knowledge could also be seen as a proxy for socioeconomic or educational status, which might explain its association with stunting (Akhter et al., Reference Akhter, Saville, Shrestha, Manandhar, Osrin, Costello and Seal2018). These results should be interpreted with caution as nutrition knowledge was self-reported and it does not explain what kind of knowledge this involves exactly.
Studies from Nepal have repeatedly reported health and nutrition disparities between caste/ethnic groups. Inequalities are probably caused by disadvantaged groups’ lower socioeconomic position, resulting in decreased access to resources and higher vulnerability to poor health outcomes, but could also be attributed to different food consumption patterns (Adhikari, Reference Adhikari2010). The present study showed mixed results and should be interpreted with caution. First, it could be questioned whether caste/ethnicity is a stand-alone predictor of undernutrition as Nepal’s multitude of religious, ethnic and caste-bound practices overlap, making it difficult to identify with one specific caste/ethnic group. Second, it is likely that a combination of wealth, education and caste/ethnicity determine an individual’s position and vulnerability to poor health outcomes (Adhikari, Reference Adhikari2010). Third, as discussed earlier, the growth reference used might not be fully able to discern ethnic and racial differences in body composition (Tumilowicz et al., Reference Tumilowicz, Beal, Neufeld and Frongillo2019). The study found some association between caste/ethnicity and stunting and thinness, for both adolescent boys and girls. Adolescents from the disadvantaged non-Dalit Terai caste/ethnic group had increased stunting odds, despite the finding that living in the Hills or Mountains increased stunting odds compared with living in the Terai. However, this corresponds with national data on lower use of health services and poorer health outcomes among Terai caste/ethnic groups (Ghimire et al., Reference Ghimire, Manandhar, Gautam, Tuladhar, Prasai and Gebreselassie2019). Disadvantaged Janajati adolescents were less likely to be thin and stunted compared with Upper Caste adolescents. This is in line with previous research that reported lower odds of thinness among Janajati women aged 15–49 (Pandey et al., Reference Pandey, Dhakal, Karki, Poudel and Pradhan2013). The Janajati classification of Pandey et al. (Reference Pandey, Dhakal, Karki, Poudel and Pradhan2013) included the same ethnicities and castes as this study’s disadvantaged Janajati classification, as well as Thakali and Gurung castes/ethnicities, which were included under relatively advantaged Janajati. Relatively advantaged Janajati adolescent boys and younger adolescents were less likely to be thin, which might be mediated by wealth. In the present sample, 42.5% of relatively advantaged Janajati boys had a monthly household income of 10,001 NPR or more, compared with 34.2% in the total male population. This group included the Newar caste/ethnicity, which represents a socioeconomically advantaged caste/ethnic group with a generally better health status (Bennett et al., Reference Bennett, Dahal and Govindasamy2008; Adhikari, Reference Adhikari2010). Religious minority adolescents showed higher risks of thinness, while younger adolescents belonging to a religious minority had higher stunting odds compared with the Upper Caste. In the study sample, 54 out of 59 adolescents identifying as a religious minority were Muslim. Although these results should be interpreted with caution given the small representation of religious minorities in the sample (1.6 %), in Nepal, Muslims are known to make less use of health services and have poorer health outcomes (MoH et al., 2017). Additionally, the religious practice of fasting (Roza) from dawn to dusk during Ramadan, which leads to changes in meal schedules and meal types, might result (particularly for girls and combined with already existing unequal food allocation) in reduced food intake and weight loss leading to higher odds of thinness (Poh et al., Reference Poh, Zawiah, Ismail and Henry1996). Another strand of literature suggests that pre-birth exposure to Ramadan (maternal fasting) negatively influences the stature and body mass of religious Muslims during childhood (Karimi, Reference Karimi2018) and adolescence (Kunto & Mandemakers, Reference Kunto and Mandemakers2019).
The absence of an effect of latrine type or source of drinking water and stunting and thinness might be explained by the large effect of household income. Wearing shoes outside was associated with lower odds of thinness in girls, which is in line with evidence on the association between footwear and soil-transmitted helminth infections leading to undernutrition, or vice versa (Amare et al., Reference Amare, Ali, Moges, Yismaw, Belyhun and Gebretsadik2013). Similar results have been found in the context of anaemia prevalence amongst adolescents in Nepal (Chalise et al., Reference Chalise, Aryal, Mehta, Dhimal, Sapkota and Mehata2018). This finding could also be confounded by poverty. Hence, not (being able to) wear shoes could be a proxy indicator of economic status.
Household income was one of the main contributors to stunting and thinness in all groups. This is in line with previous research linking higher household income or wealth with access to high-quality food and health care services and less exposure to health risks (Victora et al., Reference Victora, Wagstaff, Schellenberg, Gwatkin, Claeson and Habicht2003; Bashir & Schilizzi, Reference Bashir and Schilizzi2013; Sreeramareddy et al., Reference Sreeramareddy, Ramakrishnareddy and Subramaniam2015; Vollmer et al., Reference Vollmer, Harttgen, Kupka and Subramanian2017b; Nepali et al., Reference Nepali, Simkhada and Davies2019). A greater number of earning household members was associated with decreased odds of stunting in all but the female and older population. The study outcomes suggest a pro-male bias that could be explained by the ‘buffer hypothesis’, assuming that in the context of poverty and food insecurity, women and older household members buffer men and younger household members from the adverse effects of, for instance, food insecurity by eating less (Hadley et al., Reference Hadley, Lindstrom, Tessema and Belachew2008; Harris-Fry et al., Reference Harris-Fry, Shrestha, Costello and Saville2017; Moffitt & Ribar, Reference Moffitt and Ribar2018). An increasing number of earning members might lead to a higher household income and thus more resources to invest in food, health and care (Bashir & Schilizzi, Reference Bashir and Schilizzi2013), thereby lowering the risk of stunting. However, no data were available on the work status of adolescents or adolescents’ relation to the additional earning members. Such information would be helpful to understand whether there is a food allocation bias favouring those who contribute more to household income, which in this context is probably boys, who are more often engaged in paid work and school than girls (Dercon & Singh, Reference Dercon and Singh2013; Harris-Fry et al., Reference Harris-Fry, Shrestha, Costello and Saville2017; Morrison et al., Reference Morrison, Dulal, Harris-Fry, Basnet, Sharma and Shrestha2018). Nevertheless, the clear association between economic indicators and stunting and thinness points to the need to improve household access to, and availability of, food and other more underlying but related factors and assets, such as health care.
While for both boys and girls poverty was an important determinant of stunting, the relative importance of parental education differed for boys and girls and by age group. Generally, higher paternal education was protective against stunting in girls and younger adolescents. Maternal education was to a lesser extent associated with stunting or thinness. For instance, maternal education beyond primary increased the odds of thinness in younger adolescents. Hence, while most studies have found a positive association between maternal education and especially girls’ nutritional status through increased knowledge and use of health services, higher household income and increased decision-making power (Dancer & Rammohan, Reference Dancer and Rammohan2009; Aslam & Kingdon, Reference Aslam and Kingdon2012; Rahman et al., Reference Rahman, Saima and Goni2015; Hasan et al., Reference Hasan, Soares Magalhaes, Williams and Mamun2016; Kunto & Bras, Reference Kunto and Bras2018), this study’s findings suggest that paternal education is equally, or even more, important than maternal education. The absence of a protective effect of maternal education could be caused by women’s work outside the household, thereby transferring feeding and caring tasks to others (Reed et al., Reference Reed, Habicht and Niameogo1996). Some studies have pointed out that maternal occupation might result in less contact time including adverse child feeding and care practices (Kunto & Bras, Reference Kunto and Bras2018), leading to a negative effect on growth of children. Nevertheless, the present findings are in line with a recent study from Nepal that found that, while maternal secondary education or higher was a significant contributor to stunting in under-five children in 1996, it lost significance in 2016. This was explained by the fact that the gender gap in education decreases with many women being educated, thereby reducing the effect of maternal education (Angdembe et al., Reference Angdembe, Dulal, Bhattarai and Karn2019). The present findings are also in line with previous research among Indian adults that showed that male, but not female, education reduced the risk of being underweight (Siddiqui & Donato, Reference Siddiqui and Donato2017). In Nepal’s predominantly patriarchal society, men are often decision-makers and are able to influence decisions related to food, health and care (Morrison et al., Reference Morrison, Dulal, Harris-Fry, Basnet, Sharma and Shrestha2018). A systematic review investigating differences in parental educational levels on child nutritional status concluded that paternal education is equally important for nutritional status of children as maternal education, although the mechanisms might differ (Vollmer et al., Reference Vollmer, Bommer, Krishna, Harttgen and Subramanian2017a). The association of boys’ higher odds of stunting with paternal pre-primary or primary education might be due to mediation by household income. For instance, 40.5% of the boys’ fathers who had completed pre-primary or primary education worked in daily wage and business or were retired, possibly resulting in an unstable income, compared with 30.5% in the overall male population. Further research is needed to understand through which pathways parental education affects the nutritional status of adolescents in order to tailor interventions aimed at improving nutritional status of adolescents involving both mothers and fathers.
Parental occupation was found to be associated with stunting and thinness, most likely because of associated incomes. Paternal occupation in business and daily wage or retirement, related to lower and more unstable incomes, increased girls’ and older adolescents’ odds of stunting. At the same time, it decreased the odds of thinness in younger adolescents. Again, these outcomes could be explained by the buffer hypothesis (Hadley et al., Reference Hadley, Lindstrom, Tessema and Belachew2008; Harris-Fry et al., Reference Harris-Fry, Shrestha, Costello and Saville2017; Moffitt & Ribar, Reference Moffitt and Ribar2018). Furthermore, paternal foreign employment was found to be associated with increased odds of thinness in boys and in the total population. This is surprising, because male out-migration is a strategy to improve household economic status (Ratha et al., Reference Ratha, Mohapatra and Scheja2011). However, adolescents’ work burden outside the house (i.e. in agriculture or other activities) might increase because of their father’s absence. For instance, evidence from Mexico suggests that adolescent boys intensify their work outside the house when their fathers migrate, which may lead to increased energy expenditure, absence during meal times and eventually to thinness (Antman, Reference Antman2011; McKenzie & Rapoport, Reference McKenzie and Rapoport2011). Moreover, older adolescents seem to be affected more by paternal occupation, possibly because they take up more responsibilities either in addition to, or instead of, going to school.
At the community level, residence in the Terai appears to increase thinness odds in adolescents. This might be explained by dependency on imported and purchased food, which is highly susceptible to seasonal availability of food and price fluctuations (Krishnamurthy et al., Reference Krishnamurthy, Hobbs, Matthiasen, Hollema, Choularton, Pahari and Kawabata2013). When comparing stunting prevalence over the years, the Terai made the least progress in reducing stunting, potentially due to higher population density and lack of basic health and education services (Nepali et al., Reference Nepali, Simkhada and Davies2019). Mountain residence as a risk factor for stunting in all but girls and older adolescents, might be explained by a lack of conditions required for healthy growth, including household food security, care and health from an early age (Krishnamurthy et al., Reference Krishnamurthy, Hobbs, Matthiasen, Hollema, Choularton, Pahari and Kawabata2013). Similar to a recent study on stunting in Nepal, residence in the Mid-Western region, the least developed and geographically most isolated region, showed higher stunting odds among all but the younger adolescents, possibly associated with the lack of infrastructure, health services and sanitation, social exclusion and high rates of male out-migration (Nepali et al., Reference Nepali, Simkhada and Davies2019).
The findings of this study could support integrated and context-specific public health interventions to improve adolescent health and present an opportunity for solid policymaking to facilitate a healthy transition into adulthood. Stunting and thinness may lead to the failure of realizing adolescents’ social, economic and developmental potential, which is why it is essential to consider both immediate and underlying determinants across the lifespan and focus on environmental, societal and equity issues. Stunting in particular needs careful interpretation as it is not merely an indicator of undernutrition, and nutrition interventions alone will not improve the nutrition and health status, including stature, of present and future adolescents and generations (Leroy & Frongillo, Reference Leroy and Frongillo2019). Multi-component interventions should also address empowerment and gender equality and involve girls, boys, their parents, schools and communities, while considering household determinants and cultural variation. Moreover, this study’s findings show clear differences in determinants of stunting and thinness between younger and older adolescents. Thus, it is vital that we acknowledge that adolescence is indeed a period of rapid development and that interventions should be tailored to specific age groups.
Methodological limitations of this study relate first of all to its cross-sectional design, which did not allow conclusions about causality to be drawn. Secondly, the extended number of independent variables and the relatively small population of around 3700 adolescents increased the likelihood of type I errors, incorrectly showing the differences between groups. Third, self-report might have led to response bias, particularly in the case of parental education and occupation questions. Fourth, despite the multi-cluster sampling design, the study population might not fully represent all Nepalese adolescents. For instance, the low percentage of married adolescents (1.8% boys and 3.6% girls) differs from national DHS 2016 data (6.4% boys and 27.1% girls aged 15–19) (MoH et al., 2017). The difference might be explained by the fact that NANS intended to solely sample unmarried adolescents. However, some married adolescents were interviewed by mistake. Finally, although anthropometric data and the 2007 growth reference are commonly accepted and frequently used as indicators of undernutrition in the adolescent population, they have their limitations, particularly in the context of cross-sectional data, as recently highlighted by Tumilowicz et al. (Reference Tumilowicz, Beal, Neufeld and Frongillo2019).
There were also limitations related to challenges in determining the actual prevalence estimates in the study population due to ethnic and racial variations and differences in growth spurts and potential and body composition. To fully understand age- and sex-specific differences, data on biological maturation and the adolescent growth spurt, such as age of menarche and peak height velocity, are essential, as there might be variability between the study population and the reference population in terms of growth trajectories (Tumilowicz et al., Reference Tumilowicz, Beal, Neufeld and Frongillo2019). The WHO cut-offs might be problematic, especially for older adolescents as growth in both height and weight can continue into late adolescence, which may result in an overestimation of stunting among boys compared with girls. Moreover, the study’s thinness prevalence of girls might be underestimated due to sex differences in BAZ SD scores. Hence, in order to assess and combat adolescent undernutrition and to determine intervention points, additional nutritional indicators, such as dietary intake and quality, are important, but data are limited (Tumilowicz et al., Reference Tumilowicz, Beal, Neufeld and Frongillo2019). Moreover, proxies of nutritional status, including distal and proximate determinants such as environmental and macro-level factors related to agriculture, infrastructure, health services and food systems, as well as social and cultural norms and practices that favour girls or boys, younger or older adolescents, are vital in order to better understand and address regional and age- and sex-specific differences between stunting and thinness (WHO, 2018; Tumilowicz et al., Reference Tumilowicz, Beal, Neufeld and Frongillo2019). Such research would be ideally based on longitudinal data and adopt a life course perspective to explore the mechanisms and causal pathways through which sociocultural and economic determinants influence adolescent nutrition within their everyday-life setting.
Acknowledgments
The authors would like to acknowledge and thank the Nepal Health Research Council/Government of Nepal for making available the Nepal Adolescent Nutrition Survey dataset.
Funding
The Edema-Steernberg Foundation, The Netherlands, partly funded this study.
Conflicts of Interest
The authors declare that they have no conflicts of interest.
Ethical Approval
Ethical approval was not required for this study as secondary data were used. The Nepal Adolescent Nutrition Survey 2014 obtained ethical approval from the independent ethical review board of the Nepal Health Research Council, Nepal.


