


1. Introduction
Particle deposits that form from dried colloidal droplets come in various shapes, such as rings or disks, and they appear in a variety of phenomena, such as printing, limescale or salt deposition (Shahidzadeh et al. Reference Shahidzadeh, Schut, Desarnaud, Prat and Bonn2015), self-assembly (Vogel et al. Reference Vogel, Utech, England, Shirman, Phillips, Koay, Burgess, Kolle, Weitz and Aizenberg2015; Rainó et al. Reference Rainó, Becker, Bodnarchuk, Mahrt, Kovalenko and Stöferle2018), microfabrication (Bayer et al. Reference Bayer, Caramia, Fragouli, Spano, Cingolani and Athanassiou2012), dried fertilizer rings on leaves or coffee rings in a coffee cup (Deegan et al. Reference Deegan, Bakajin, Dupont, Huber, Nagel and Witten1997). The ring formation phenomenon is shown to be the result of contact line pinning and high local evaporation rates, which drive replenishing liquid to the contact line, dragging the particles to this region (Deegan et al. Reference Deegan, Bakajin, Dupont, Huber, Nagel and Witten1997). It occurs on various hydrophilic substrates and colloid–solvent pairs. Research using rigid substrates has focused on understanding the formation of the deposit (Parisse & Allain Reference Parisse and Allain1997; Marín et al. Reference Marín, Gelderblom, Lohse and Snoeijer2011) and how one can influence its final shape by promoting or suppressing the coffee ring effect (Deegan et al. Reference Deegan, Bakajin, Dupont, Huber, Nagel and Witten2000; Nguyen & Stebe Reference Nguyen and Stebe2002; de Gans & Schubert Reference de Gans and Schubert2004; Ko et al. Reference Ko, Park, Shin and Moon2004; Dietzel & Poulikakos Reference Dietzel and Poulikakos2005; Hu & Larson Reference Hu and Larson2005, Reference Hu and Larson2006; Park & Moon Reference Park and Moon2006; Harris et al. Reference Harris, Hu, Conrad and Lewis2007; Chen et al. Reference Chen, Wang, Wen and Li2010; Lafuma & Quéré Reference Lafuma and Quéré2011; Marín et al. Reference Marín, Gelderblom, Lohse and Snoeijer2011; Still, Yunker & Yodh Reference Still, Yunker and Yodh2012; Ta et al. Reference Ta, Dunn, Wasley, Li, Kay, Stringer, Smith, Esenturk, Connaughton and Shephard2016; Liu et al. Reference Liu, Midya, Kappl, Butt and Nikoubashman2019). The coffee ring effect can be promoted by facilitating the outward liquid flow through contact line pinning. It can be suppressed by promoting Marangoni flows to counter the outward flow. These Marangoni flows can be induced by thermal gradients (Deegan et al. Reference Deegan, Bakajin, Dupont, Huber, Nagel and Witten2000; Nguyen & Stebe Reference Nguyen and Stebe2002; Hu & Larson Reference Hu and Larson2005, Reference Hu and Larson2006), a variation in surfactant concentration (Hu & Larson Reference Hu and Larson2006; Still et al. Reference Still, Yunker and Yodh2012), by mixing solvents (de Gans & Schubert Reference de Gans and Schubert2004; Park & Moon Reference Park and Moon2006) or by localized laser heating (Dietzel & Poulikakos Reference Dietzel and Poulikakos2005). One can also suppress the coffee ring effect by inhibiting contact line pinning due to substrate hydrophobicity or superhydrophobicity (Ko et al. Reference Ko, Park, Shin and Moon2004; Chen et al. Reference Chen, Wang, Wen and Li2010; Lafuma & Quéré Reference Lafuma and Quéré2011; Marín, et al. Reference Marín, Gelderblom, Susarrey-Arce, van Houselt, Lefferts, Gardeniers, Lohse and Snoeijer2012; Ta et al. Reference Ta, Dunn, Wasley, Li, Kay, Stringer, Smith, Esenturk, Connaughton and Shephard2016). However, on compliant materials – where drying droplets can exhibit a range of wetting behaviours that depend on contact line speed (Gerber et al. Reference Gerber, Lendenmann, Eghlidi, Schutzius and Poulikakos2019) – little is known about the particle transport mechanisms during droplet evaporation and their ability to alter the deposit shape. Lopes & Bonaccurso (Reference Lopes and Bonaccurso2013) investigated the influence of elasticity on dried deposits formed from water–silica colloidal droplets and argued that the coffee ring effect can be suppressed by the utilization of compliant materials. However, there is a marked deficit in fundamental knowledge about how dried colloidal patterns on compliant materials are generated and how their formation can be influenced by regulating the evaporation rate.
Here, we study the combined effects of substrate compliance and relative humidity on the topography and overall shape of deposits formed from drying colloidal droplets on hydrophobic substrates. We observe that such deposits can exhibit a wide range of shapes, from disks to rings, and their shape depends only on substrate compliance and relative humidity. We also note that such behaviour cannot be achieved with rigid materials with an equivalent surface chemistry. The mechanism responsible for this variation in deposit shape has to do with the fact that, when a droplet is placed in contact with a compliant material, it can deform it – creating a so-called wetting ridge at the contact line – and the viscoelastic nature of the compliant material (Lester Reference Lester1961; Style & Dufresne Reference Style and Dufresne2012; Style et al. Reference Style, Boltyanskiy, Che, Wettlaufer, Wilen and Dufresne2013; Park et al. Reference Park, Weon, Lee, Lee, Kim and Je2014). The dynamics of a droplet's contact line motion on compliant materials is controlled by the viscoelastic response of the evolving wetting ridge (Shanahan & Carré Reference Shanahan and Carré1995; Carré, Gastel & Shanahan Reference Carré, Gastel and Shanahan1996; Gerber et al. Reference Gerber, Lendenmann, Eghlidi, Schutzius and Poulikakos2019). We explain this drastic change in colloidal deposit formation by the appearance of the previously reported dynamic wetting transition that exists on compliant materials (Gerber et al. Reference Gerber, Lendenmann, Eghlidi, Schutzius and Poulikakos2019). Specifically, in the case of expedited evaporation, the receding contact line velocity overcomes the rate at which the wetting ridge can adapt, leading to viscoelastic braking (Shanahan & Carré Reference Shanahan and Carré1995), contact line arrest and giving rise to an outward replenishing flow, which we quantified experimentally with particle tracking. Concurrently, we observed an aggregation of particles at the liquid–vapour interface, which leads to ordered domains in the dried colloidal ring deposits. We calculated the particle collision frequency of particles restricted to the droplet free surface and showed that Brownian motion is an important factor for this aggregation. We tested our findings in a printing configuration, confirming a transition in line footprints generated on this type of compliant material. Our findings are envisioned to be of interest to a range of fields, including colloidal self-assembly and printing, introducing the capability of obtaining single lined footprints or bifurcations simply by tuning the temperature when using compliant coatings.
2. Methods
2.1. Sample fabrication and colloidal suspension preparation
In our study we used two types of samples, both consisting of a layer of a silicone elastomer (Silicone CY 52-276 from Dow Corning) on a glass substrate. For the first type of sample, the two components of the silicone were added in the ratio of  $\textrm {A}\,{:}\,\textrm {B} = 9\,{:}\,10$ (total weight 5 g, Young's modulus
  $E =12.6\ \textrm {kPa}$ Bergert et al. Reference Bergert, Lendenmann, Zündel, Ehret, Panozzo, Richner, Kim, Kress, Norris and Sorkine-Hornung2016), then we added 0.05 v/v% poly(dimethylsiloxane-b-ethylene oxide) (Poly-sciences) to it and mixed thoroughly for 5 min, degassed for 2 min and spin coated onto a glass slide for 1 min at 1500 r.p.m. to achieve a thickness of
  $h =35\ \mathrm {\mu }\textrm {m}$ (Gerber et al. Reference Gerber, Lendenmann, Eghlidi, Schutzius and Poulikakos2019). The silicone was then cured at
  $70\,^{\circ }\textrm {C}$ for 30 min. The second type of sample was obtained by dissolving both Silicone CY 52-276 components, in the ratio of
  $\textrm {A}\,{:}\,\textrm {B} = 9\,{:}\,10$ (total weight 1.25 g), and the poly(dimethylsiloxane-b-ethylene oxide) in 25 ml toluene, resulting in a 5 w/v% solution (recipe is adapted from Bračič et al. Reference Bračič, Mohan, Kargl, Griesser, Hribernik, Köstler, Stana-Kleinschek and Fras-Zemljič2014). We cleaned the glass slides with acetone, isopropanol and distilled water in an ultrasonication bath for 5 min each and treated them with oxygen plasma (Plasma Diener, 0.4 mbar, 8 min). We then spin coated the silicone solution onto the cleaned glass slides with a speed of 5000 r.p.m. for 1 min and cured the samples in the oven at
  $90\,^{\circ }\textrm {C}$ for 1 h, to make sure that the solvent was fully evaporated. We measured the thickness of these samples by cleaving the sample after cooling down in liquid nitrogen and using a scanning electron microscope to image the cross-section; we found
  $h = 72 \pm 22\ \textrm {nm}$ (see appendix A). We performed indentation tests, see appendix A, to show that the thin silicone elastomer layer did not add significant compliance to the glass. Thus, this type of sample effectively behaves as a rigid material, because of the thin silicone layer thickness and the underlying glass support. We characterized the rigid substrate by performing contact angle measurements (goniometer by DataPhysics OCA 35) with ultrapure deionized water (Mili-Q). We obtained an advancing contact angle of
  $\theta _a=112.3^{\circ }\pm 3.2^{\circ }$ and a receding contact angle of
  $\theta _r=101.3^{\circ }\pm 1.0^{\circ }$. Note that we have used the same material composition as in previous works (Bergert et al. Reference Bergert, Lendenmann, Zündel, Ehret, Panozzo, Richner, Kim, Kress, Norris and Sorkine-Hornung2016; Gerber et al. Reference Gerber, Lendenmann, Eghlidi, Schutzius and Poulikakos2019), where we have characterized the mechanical properties as well as the wetting and drying behaviour of pure water on it. The addition of poly(dimethylsiloxane-b-ethylene oxide) allows for further surface functionalization and modification. We used fluorescent polystyrene particles (Spherotech, SPHERO
 $^{\textrm{TM}}$Fluorescent Purple Particles, Medium Intensity,
  $a = 1.185\ \mathrm {\mu }\textrm {m}$, 1 w/v% and Spherotech, SPHERO
 $^{\textrm{TM}}$Fluorescent Particles, Yellow, High Intensity,
  $a = 0.92\ \mathrm {\mu }\textrm {m}$, 1 w/v%) and diluted these master solutions to the required concentration with ultrapure deionized water (Mili-Q®). We mixed the dispersions with a vortex mixer for approximately 2 min, subsequently, we used ultrasonication for approximately 2 min to break aggregates of particles (if present). We characterized the dispersions by a Zetasizer (Malvern Panalytical) and obtained values for the zeta potentials of
  $-53.3\pm 19.6~\textrm {mV}$ and
  $-40.2\pm {21.3}\ \textrm {mV}$ for the purple and yellow particles, respectively, which means that the dispersions are considered to have a good stability. Note that the deformation length scale, defined as
  $\gamma _{{LV}}/E$, for the compliant sample (layer thickness of
  $h = 35\ \mathrm {\mu }\textrm {m}$) is
  ${\approx }5.71\ {\mathrm {\mu } \textrm {m}}$, which was also confirmed experimentally in previous work (Gerber et al. Reference Gerber, Lendenmann, Eghlidi, Schutzius and Poulikakos2019). This is approximately 3 times larger than the particle diameter. In the case of the thin sample, we expect the deformation length scale to be of the order of the layer thickness, which is an order of magnitude smaller than the particle diameter.
2.2. Colloidal suspension evaporation experiments
We conducted the evaporation experiments in an experimental chamber that allowed us to control humidity to desired values. We used a precision pipette (Eppendorf®,  ${0.5}\ \mathrm {\mu }\textrm {l}$ to
  $2.5\ \mathrm {\mu }\textrm {l}$) to dispense
  $1\ \mathrm {\mu }\textrm {l}$ droplets onto the samples. The humidity was controlled by means of two valves, which led nitrogen gas either through a bubbler to the chamber or directly to the chamber. By adjusting the flow rate of these two valves, the relative humidity in the chamber could be kept roughly constant at a desired value. The humidity and temperature were measured with a SHT31 SMART GADGET sensor (Sensirion AG). The image sequences from the side view were recorded with a Thorlabs CMOS camera or by the camera of a DataPhysics OCA35 goniometer and the dried deposits were imaged on a confocal fluorescence microscope (Nikon, Eclipse Ti, objective Nikon Plan Fluor
  $20\times$).
2.3. Flow field measurements during colloidal suspension droplet evaporation
The flow field measurements within the droplets during evaporation were performed on a confocal fluorescence microscope (Nikon, Eclipse Ti, objective Nikon Plan Fluor  $40\times$). Again, we deposited droplets of
  $1\ \mathrm {\mu } \textrm {l}$ initial volume with a precision pipette (Eppendorf®,
  $0.5\ \mathrm {\mu }\textrm {l}$ to
  ${2.5}\ \mathrm {\mu }\textrm {l}$) on compliant substrates (see § 2.1,
  $h = {35}\ \mathrm {\mu }\textrm {m}$). While evaporation was taking place, we recorded videos close to the liquid–solid interface. Specifically, we focused on the wetting ridge tip, which signifies that images were taken in the plane parallel to the substrate surface that intersects the droplet contact line. As the contact line was receding, we moved the microscopy stage to a new location from time to time. We then used a commercial software (IMARIS, Bitplane) to track the particles during droplet evaporation. We disregarded the time intervals during which we moved the stage. We exported two sets of data, the first containing all tracked particles and the second only containing the particles at the contact line. We then further analysed the data with a MATLAB script. We transformed the coordinates and velocities of the tracked particles into a cylindrical coordinate system. For that, we fitted a circle to the particles at the contact line for every time step to obtain the location of the droplet centre. This then allowed us to transform the positions from a Cartesian coordinate system
  $(x,y,z)$ to a cylindrical coordinate system
  $(r,\varphi ,z)$ (with the origin at the droplet centre and
  $z=0\ \mathrm {\mu }\textrm {m}$ at the height of the wetting ridge); we were only interested into the radial component of the velocity vectors,
  $v_r=(r_{t+{\rm \Delta} t}-r_t)/{\rm \Delta} t$. Then, we also calculated the closest distance to the contact line,
  $d_{{CL}}$, for each tracked particle.
2.4. Contact printing with colloidal ink experiments
We used the dispersion of particles in water (Spherotech, SPHERO $^{\textrm{TM}}$, Fluorescent Particles, Yellow, High Intensity,
  $a = 0.92\ \mathrm {\mu } \textrm {m}$,
  $c(t_0) = 0.1\ \text {w/v}\%$) to contact print lines onto a compliant substrate (see § 2.1,
  $h = 35\ \mathrm {\mu } \textrm {m}$). We used a syringe pump (Harvard apparatus, PHD ULTRA, with a nozzle of Nordson EFD precision tips with inner diameter of 0.25 mm) to control the flow rate. The sample was mounted on a Peltier element, to adjust the sample temperature,
  $T_s$. The sample was located in an experimental chamber, with an opening of width
  ${\sim }2\ \textrm {cm}$ and length
  ${\sim }{8}\ \textrm {cm}$ on the top to have access for printing. The relative humidity,
  $rh$, was adjusted by a bubbler, as in previous experiments. Maintaining the flow rate was necessary to achieve a stable value of
  $rh$. We controlled the printing location by motion of the sample via a linear motorized stage (Thorlabs NRT150), while keeping the nozzle at the same location. The flow rate,
  $Q$, had to be adjusted over the course of the experiment, such that the evaporative flux, which is controlled by
  $T_s$, matched with the supplied liquid.
3. Results
3.1. Effect of environmental conditions on colloidal patterns on compliant versus rigid materials
We investigated the particle deposition patterns formed from drying colloidal droplets on silicone elastomer coated glass substrates in both humid and dry environments and for film thicknesses of  $h = 72\ \textrm {nm}$ (rigid substrate; see § 2.1 and appendix A) and
  $h = {35}\ \mathrm {\mu }\textrm {m}$ (compliant substrate; see § 2.1). This allowed us to examine the influence of substrate compliance on the deposits of drying colloidal droplets. In each experiment, we first deposited colloidal droplets with an initial volume,
  $V(t_0) = 1\ \mathrm {\mu } \textrm {l}$, and an initial concentration,
  $c(t_0) = 0.01\ \text {w/v}\%$, of polystyrene particles with a radius of
  $a = 0.92\ \mathrm {\mu } \textrm {m}$. The relative humidity was set to either
  $rh = 15.0 \pm 12.1\,\%$ (dry case) or
  $rh = 87.6 \pm 2.8\,\%$ (humid case) and the environmental temperature was set to
  $T = 23.0\pm 0.9\,^{\circ }\textrm {C}$. In the following, we will often refer to low
  $rh$ conditions, by which we mean
  $rh<35\,\%$ and high
  $rh$ conditions which means
  $rh>80\,\%$.
In figure 1(a) we show a side view image sequence of a drying colloidal droplet on a compliant substrate in a low- $rh$ environment. Under these conditions, the final deposit shape is a particle ring, figure 1(b). In figure 1(c), we show a representative final deposit formed on the compliant substrate at high
  $rh$ conditions. Interestingly, simply increasing the humidity causes the shape of the deposit to transition from a ring to a full disk, with a clear reduction in the deposit size. In figures 1(d) and 1(e) we present the final deposits again for low-
 $rh$ and high-
 $rh$ cases, respectively, but this time the substrate is rigid; however, we see no significant differences in shape between the deposits. For characterization of the final deposit shape, we fitted a circle to obtain the outer diameter of the final deposit,
  $d_o$. We also extracted the area enclosed within the deposit that did not contain any particles. We used this particle-free area to calculate the inner effective diameter,
  $d_{{i,eff}}$ (see appendix B). Figure 1(f) shows
  $d_o$ for the above four cases (low or high
  $rh$; compliant or a rigid substrate). The deposits that were formed on the compliant substrate at low
  $rh$ have an average value of
  $d_o = 396\ \mathrm {\mu } \textrm {m}\pm 47\ \mathrm {\mu } \textrm {m}$. This is clearly much larger than for the other three cases:
  $d_o = 190\ \mathrm {\mu } \textrm {m} \pm 36\ \mathrm {\mu } \textrm {m}$ on the compliant substrate in high
  $rh$ conditions;
  $d_o = 166\ \mathrm {\mu } \textrm {m} \pm 17\ \mathrm {\mu } \textrm {m}$ on the rigid substrate in low
  $rh$ conditions; and
  $d_o = 151\ \mathrm {\mu } \textrm {m} \pm 23\ \mathrm {\mu } \textrm {m}$ on the rigid substrate in high
  $rh$ conditions. In order to have a measure for the shape of the obtained deposits (either disk or ring), we defined the ratio between the inner effective diameter,
  $d_{{i,eff}}$, and
  $d_o$, as a shape parameter;
  $d_{{i,eff}}/d_o = 0$ represents a complete disk while values approaching unity signify a ring-like pattern.

Figure 1. Wetting and drying of colloidal droplets on thick (compliant) and very thin (rigid) silicone coatings on glass substrates under varying humidity conditions. We deposited  $1\ \mathrm {\mu } \textrm {l}$ droplets from a 0.01 w/v% particle dispersion in water (particle radius:
  $a = 0.92\ \mathrm {\mu }\textrm {m}$). (a) Side view image sequence showing a colloidal droplet drying on a soft silicone coating (relative humidity:
  $rh = 0.5\,\%$), also defining the droplet contact radius,
  $R$, and contact angle
  $\theta ^*$. Micrographs showing the final dry particle deposits from colloidal droplets drying on (b), compliant (
 $rh = 0\,\%$), (c), compliant (
 $rh = 90\,\%$), (d), rigid (
 $rh = 0\,\%$) and (e), rigid (
 $rh = 84\,\%$) silicone coatings. Also shown in (b) is the outer diameter of the final deposit,
  $d_o$, and the inner effective diameter of the final deposit,
  $d_{{i,eff}}$. Plots of (f)
  $d_o$ and (g) the ratio of
  $d_{{i,eff}}$ to
  $d_o$ for compliant and rigid substrates in high (
 $rh = 87.6 \pm 2.8\,\%$) and low
  $rh$ conditions (
 $rh = 15.0 \pm 12.1\,\%$). The experiments in (f,g) were conducted at least
  $N = 6$ times for each of the cases. Scale bars: (a),
  $0.5$ and (b–e),
  $50\ \mathrm {\mu }\textrm {m}$.
Figure 1(g) shows a plot of  $d_{{i,eff}}/d_o$ for the four cases. Again, we see a distinct difference between the deposits formed on the compliant substrate at low
  $rh$ and the other three cases, with the compliant low-
 $rh$ case appearing ‘ring like’ and the other three cases being ‘disk like’. Thus, by using a compliant substrate and adjusting the humidity, one can control the shape of the dried colloidal patterns – going from
  $d_{{i,eff}}/d_o = 0$ to 0.64 – which is not achievable with rigid substrates.
Next, we examined the evolution of  $\theta ^*$ and
  $R$ by performing suspension droplet drying experiments on a goniometer. Figures 2(a) and 2(b) show
  $\theta ^*$ versus
  $t$ and figures 2(c) and 2(d) show
  $R$ versus
  $t$ for suspension droplets drying on a rigid and a compliant silicone substrate and for a high and low relative humidity environment, respectively. From this we can see that
  $\theta ^*$ remains at a value of approximately
  $100^{\circ }$ on the rigid substrate over a large portion of the evaporation process, similarly for both conditions. However, for the compliant substrate,
  $\theta ^*$ stabilizes at a value of approximately
  $85^{\circ }$ at high relative humidity, whereas at low relative humidity, there is a further pronounced decrease of
  $\theta ^*$ during drying. This transition towards lower apparent contact angles at higher evaporative flux has been investigated in a previous work (Gerber et al. Reference Gerber, Lendenmann, Eghlidi, Schutzius and Poulikakos2019), and was found to occur for contact line velocities approaching and exceeding the rate at which substrate relaxation occurs. This relaxation velocity can be estimated by taking the ratio of the substrate deformation length scale,
  $\gamma _{{LV}}/E$, to the characteristic relaxation time scale of the viscoelastic material,
  $\tau$, where
  $\gamma _{{LV}}$ is the liquid surface tension. From previous work we know that
  $E = {12.6}\ \textrm {kPa}$ (Bergert et al. Reference Bergert, Lendenmann, Zündel, Ehret, Panozzo, Richner, Kim, Kress, Norris and Sorkine-Hornung2016) and
  $\tau = 5.8\ \textrm {s}$ (Gerber et al. Reference Gerber, Lendenmann, Eghlidi, Schutzius and Poulikakos2019), where
  $\tau$ was measured by means of step strain tests and by fitting a Maxwell solid to the stress versus time curves. For the material used
  $\gamma _{{LV}}/(E\tau )= 0.98\ \mathrm {\mu } \textrm {m}$. When
  $\textrm {d}R/\textrm {d}t \ll \gamma _{{LV}}/(E\tau )$, the wetting ridge can re-adapt to the imposed strain rate. However, when
  $\textrm {d}R/\textrm {d}t >\gamma _{{LV}}/(E\tau )$, the substrate is not able to re-adapt on this short time scale, leading to a surge in stress in the substrate and the wetting ridge starts to bend inwards asymmetrically, in the direction of the contact line motion, and thus allows for lower contact angles (Gerber et al. Reference Gerber, Lendenmann, Eghlidi, Schutzius and Poulikakos2019). We propose here that the transition between the shapes of the colloidal patterns is caused through the same mechanism, namely a combination of evaporative flux, viscoelastic braking and inwards tilt of the wetting ridge.

Figure 2. Contact angle and contact line dynamics of suspension droplets drying on rigid (black) and compliant (blue) silicone substrates. We used droplets consisting of a 0.01 % w/v suspension ( $a = 0.92\ \mathrm {\mu } \textrm {m}$) in water on a layer of Silicone CY 52–276,
  $\textrm {A}\,{:}\,\textrm {B} = 9\,{:}\,10$. Measured apparent contact angle versus time,
  $t$, at (a), high humidity (
 $rh = 87.6 \pm 1.4\,\%$) and, (b), low humidity environment (
 $rh = 13.0 \pm 2.9\,\%$). Contact radius,
  $R$, versus time,
  $t$, at (c) high humidity (
 $rh = 87.6 \pm 1.4\,\%$) and (d) low humidity (
 $rh = 13.0 \pm 2.9\,\%$). The plots in (a–d) represent at least 3 individual experiments and the lines represent a fit of a Fourier series with four terms to the data. Receding contact line velocities,
  $-\textrm {d}R/\textrm {d}t$, in (e), high humidity (
 $rh = 87.6 \pm 1.4\,\%$) and (f) low humidity (
 $rh = 13.0 \pm 2.9\,\%$), which are the derivatives of the fitted Fourier series in (c,d), respectively. The dashed line represents the threshold of the substrate relaxation velocity,
  $\gamma _{{LV}}/(E\tau ) = 0.98\ \mathrm {\mu } \textrm {m}$.
Based on the above, we examined the contact line velocity in all cases by time differentiation of the contact radius line of best fit in figures 2(c) and 2(d). The receding contact line velocities,  $-\textrm {d}R/\textrm {d}t$, of suspension droplets drying on a rigid and a compliant silicone substrate for high and low relative humidity environment, respectively, are presented in figures 2(e) and 2(f). The comparison of
  $-\textrm {d}R/\textrm {d}t$ to
  $\gamma _{{LV}}/(E\tau )$ shows that only in the case of low relative humidity the contact line velocity exceeds the relaxation velocity (at
  $t \approx 200\ \textrm {s}$), signifying that we can expect significant viscoelastic braking, inwards tilt of the wetting ridge and significant decrease in contact angles (see figure 2b) in comparison to the slow evaporation (Gerber et al. Reference Gerber, Lendenmann, Eghlidi, Schutzius and Poulikakos2019). For an exceedingly fast contact line, the wetting ridge does not instantaneously adapt, due to its viscoelastic nature. In this case, the wetting ridge acts as a non-responsive (quasi-static) defect, and in the extreme case the contact line can actually pin on the wetting ridge (Kajiya et al. Reference Kajiya, Daerr, Narita, Royon, Lequeux and Limat2013, Reference Kajiya, Brunet, Royon, Daerr, Receveur and Limat2014). We observe pinning in our experiments in the last 2 s of evaporation at low
  $rh$ conditions on the compliant substrate (see supplementary movie 1 available at https://doi.org/10.1017/jfm.2020.855), which explains the larger deposit diameters,
  $d_o$, compared to the high
  $rh$ conditions, and also compared to the rigid, hydrophobic substrate. Note, that the resolution of the camera on the goniometer is insufficient to capture the events a few seconds before complete evaporation (such as the deceleration of
  $-\textrm {d}R/\textrm {d}t$ to zero for the droplets on the compliant substrate in figure 2f).
3.2. Internal flows during droplet evaporation on a compliant material
In order to understand the formation of these distinct colloidal deposits on a compliant material resulting from a change in relative humidity, we measured the transport of particles within the droplet during evaporation. We recorded videos of the fluorescent particles using an inverted confocal fluorescence microscope, and we always made sure that we focused on the contact line region (at the height of the wetting ridge, defined as  $z = 0\ \mathrm {\mu }\textrm {m}$). Using a commercial software (IMARIS, Bitplane), we were then able to track the motion of a considerable share of the visible particles over time (see supplementary movies 2 and 3; note that, for clarity, the playback speed of both videos is slower compared to real time, and also that we move the stage several times to capture the moving contact line motion, which we note each time as ‘stage readjustment’), and transform their velocity to a cylindrical coordinate system. Furthermore, we calculated the distance of the particles to the contact line,
  $d_{{CL}}$, for every time step (see § 2.3).
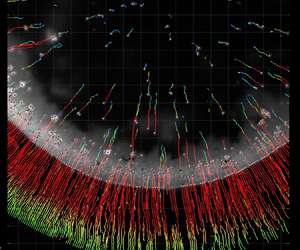
Figure 3(a) shows the trajectory of the particles in a drying colloidal droplet on a compliant substrate at low  $rh$ for three time intervals:
  $t = {-301}\ \textrm {s}$ to
  $t = -271\ \textrm {s}$,
  $t = {-95}\ \textrm {s}$ to
  $t = {-65}\ \textrm {s}$ and
  $t = {-50}\ \textrm {s}$ to
  $t = {-20}\ \textrm {s}$ (we define
  $t = {0}\ \textrm {s}$ as the moment when evaporation is complete). Also shown are the definitions of the radial velocity,
  $v_r$, and
  $d_{{CL}}$. We see that particles that are located near the contact line are dragged inwards during all three time intervals. However, the trajectories of the particles which are not trapped by the contact line change over time. Initially, their motion is random, indicating a dominance of Brownian motion. However, as drying progresses, these particles start to be pulled towards the contact line. Figure 3(b) shows a consolidated plot of
  $t$ vs.
  $d_{{CL}}$ vs. the Péclet number,
  $Pe = v_rR/D$, from three individual droplet evaporation experiments at low
  $rh$ on the compliant substrate;
  $D$ is the diffusion coefficient of the particles in the bulk, calculated by the Stokes–Einstein relation,
  $D={k_BT}/{6{\rm \pi} \eta a}$. The Péclet number describes the importance of advective transport to diffusive transport, and was defined as positive for transport towards the contact line and as negative for transport towards the droplet centre.

Figure 3. Flow within evaporating colloidal droplets on a thick (compliant) silicone coating on a glass substrate under varying humidity conditions. (a) Tracked particles during evaporation of a colloidal droplet near the solid–liquid interface ( $\sim z = {0}\ \mathrm {\mu }\textrm {m}$) in a dry environment (
 $rh = 33.2\,\%$) on a compliant material at the intervals of
  $t = -301\ \textrm {s}$ to
  $t = -271\ \textrm {s}$,
  $t = -95\ \textrm {s}$ to
  $t = -65\ \textrm {s}$ and
  $t = -50\ \textrm {s}$ to
  $t = -20\ \textrm {s}$. (b) Diagram of time,
  $t$, versus distance from contact line,
  $d_{{CL}}$, versus Péclet number,
  $Pe$, for colloidal droplets evaporating on a compliant material in low
  $rh$ conditions (
 $rh = 33.2 \pm 0.9\,\%$) (see § 2.3). (c) Tracked particles during evaporation of a colloidal droplet near the solid–liquid interface (
 $\sim z = 0\ \mathrm {\mu } \textrm {m}$) in a humid environment (
 $rh = 83.0\,\%$) on a compliant material at the same time intervals as in (a). (d) Diagram of
  $t$ versus
  $d_{{CL}}$ versus
  $Pe$ for colloidal droplets evaporating on a compliant material in high
  $rh$ conditions (
 $rh = 85.2 \pm 2.2\,\%$) (see § 2.3). In (b,d) the values of
  $Pe$ have been interpolated from
  $N = 3$ individual experiments each. Positive values of
  $Pe$ signify motion towards the contact line. Negative values of
  $Pe$ signify motion towards the droplet centre. Scale bars: (a), (c)
  $30\ \mathrm {\mu } \textrm {m}$.
Figure 3(b) confirms that particles which were not trapped by the contact line are dragged towards the contact line. Despite the fact that the contact line is not pinned until very late in the drying process (see supplementary movie 1), we still observe the outward replenishing flow that is typical for the coffee ring effect. This signifies that the speed with which the contact line is receding cannot fully compensate for the loss of liquid, so this liquid is replenished from the bulk.
The reason for this is that the velocity of the contact line is decreased through viscous dissipation in the compliant solid (Carré et al. Reference Carré, Gastel and Shanahan1996; Karpitschka et al. Reference Karpitschka, Das, van Gorcum, Perrin, Andreotti and Snoeijer2015; Zhao et al. Reference Zhao, Dervaux, Narita, Lequeux, Limat and Roché2018; Gerber et al. Reference Gerber, Lendenmann, Eghlidi, Schutzius and Poulikakos2019). Zhao et al. (Reference Zhao, Dervaux, Narita, Lequeux, Limat and Roché2018) found that on thin layers the dissipated power scales with  $P_{diss}\propto l^{(1-m)}$, with
  $l=(\gamma _{{s}} h^3/G)^{(1/4)}$, with the solid surface energy,
  $\gamma _{{s}}$, the shear modulus,
  $G$, and
  $m$ an exponent that is in the range 0.5–0.7 (Shanahan & Carré Reference Shanahan and Carré1995; Zhao et al. Reference Zhao, Dervaux, Narita, Lequeux, Limat and Roché2018). One thus expects significantly lower dissipation in the case of the thinner layers (
 $P_{{diss,72\ \textrm {nm}}}/P_{{diss,35 \ \mathrm {\mu }\textrm {m}}}\approx (72/35\,000)^{3(1-m)/4}\approx 0.16$), explaining why ring formation is not observed on the samples with a thin silicone layer. The work here thus nicely illustrates the relation between the deposit geometry and the amplitude of dissipation in the substrate.
From figure 3(b), at late times ( $-20\ \textrm {s} < t < 0\ \textrm {s}$), we can also see that many particles are suddenly moving inwards. This is due to the fact that, actually, many particles have already aggregated at the droplet edge (but above or below the focal plane), and that this broad total peripheral aggregate then captures particles which are now relatively far from the contact line; however, during this time interval we still observe individual particles in the bulk liquid moving outwards, indicated by positive values of
  $Pe$ (see supplementary movie 2). In figure 3(c) we show tracked particles within an evaporating droplet for the high
  $rh$ case on the compliant substrate, again for three time instances (each representing a time duration of 30 s).
Figure 3(d) presents the diagram of the flow within a droplet evaporating from a compliant material in high  $rh$ conditions (showing
  $t$ vs.
  $d_{{CL}}$ vs
  $Pe$) consisting of three individual experiments. The flow pattern in this case is markedly different from the low
  $rh$ conditions, such that we practically only observe the particles at the contact line being dragged along with the contact line. Also, the particles, which are not trapped by the contact line, have negative values of
  $Pe$, signifying a slow transport towards the droplet centre, with a significantly lower magnitude of
  $Pe$ than at the low
  $rh$ conditions. We do not observe any strong outward replenishing flow. As shown, the outward flow only establishes itself for the case of high evaporative flux, while it is absent at low evaporative flux, which indicates that the flow is actually triggered through the evaporation at the droplet edge, replenishing the liquid that is lost near the contact line, such as in the case of the classical coffee ring effect.
3.3. Colloidal transport and assembly at the liquid–vapour interface for low  $rh$ conditions on a compliant material

In our particle tracking experiments at low  $rh$ conditions, in which we focused near the solid–liquid interface, we observed that many particles were only brought into focus during the last stages of drying (see supplementary movie 2). Thus, we were interested in how these particles were transported within the droplet, which interface they assembled at and how this impacted the final deposit. To determine the assembly of particles at the interfaces, we recorded three-dimensional fluorescence images during colloidal droplet evaporation on a compliant material, detected the positions of the particles and calculated two-dimensional projections on the
  $r$–
$r$– $z$ plane (see appendix C for a description of the detection method).
In figure 4(a), we overlaid these two-dimensional projections with the macroscopically measured contact angles and contact line position. From figure 4(a) we see that many particles assemble at the liquid–vapour interface and that the concentration of particles at this interface, especially at the droplet edge, increases over time, which is a result of the replenishing outward flow (see figure 3b). However, there was almost no particle assembly at the solid–liquid interface. A particle scaffold self-assembled at the droplet free surface, from the contact line region inward, as shown in figure 4(b). Furthermore, we observed that aggregates of particles (mostly self-assembled in hexagonal ordering) were forming at the liquid–vapour interface during evaporation (see figures 4c and 4d). Figure 4(e) presents an image focusing on the free surface of the colloidal droplet in a high humidity environment, showing that there are only very few particles and no particle aggregation at the liquid–vapour interface under these conditions (figures 4c and 4e are both taken at times that are when 90 % of the drying time has elapsed so they can be compared). The lower concentration of particles at the vapour interface at high humidity conditions indicates that there is a threshold differential velocity above which the particles are captured at the interface, in accordance with Bigioni et al. (Reference Bigioni, Lin, Nguyen, Corwin, Witten and Jaeger2006). We excluded floatation forces as the sole driver for colloidal aggregation at the interface, because the time scale for aggregation due to floatation forces alone is  ${\sim } 3\times 10^{7}$ higher than the time scale of evaporation (see appendix D). In order to understand whether Brownian motion is the main driver for the aggregation of particles – and which are then held through capillarity at the liquid–vapour interface – we calculated the binary collision frequency at the interface. For this we made certain simplifying assumptions, e.g. that all the particles contained in a certain volume evaporated from the droplet would reach the liquid–vapour interface (due to outwards flow detected in the experiments at low
  $rh$), and that the particles are held at the interface through capillarity without re-migrating into the bulk liquid. Also, we assumed a homogeneous distribution of particles at the liquid–vapour interface.

Figure 4. Colloidal transport and assembly at the liquid–vapour interface during droplet evaporation in an undersaturated environment on a compliant substrate. (a) Locations of particles at the edge of the droplet ( $-10\ \mathrm {\mu }\textrm {m} < d_{{CL}} < {80}\ \mathrm {\mu }\textrm {m}$ and
  $-5\ \mathrm {\mu }\textrm {m} < z < 20\ \mathrm {\mu } \textrm {m}$) at various time steps during colloidal droplet evaporation on a compliant substrate at low
  $rh$ conditions (
 $rh = 13.8\,\%$), also showing the macroscopically measured contact angle;
  $z = 0\ \mathrm {\mu }\textrm {m}$ is at the height of the contact line (tip of the wetting ridge). Each black dot represents the location of a detected particle. See appendix C for details on the detecting method. (b) Image showing the particles assembling at the droplet edge in a low humidity environment (
 $t = -60\ \textrm {s}$,
  $rh = 19.0\,\%$, at
  $z = 0\ \mathrm {\mu }\textrm {m}$). (c) Image showing the particles assembling at the liquid–vapour interface in a low humidity environment (
 $t = -60\ \textrm {s}$,
  $rh = 24.5\,\%$, at
  $z = 100\ \mathrm {\mu }\textrm {m}$). (d) Image showing the hexagonally ordered aggregates on the liquid–vapour interface in a low humidity environment (
 $t = -5.8\ \textrm {s}$,
  $rh = 13.8\,\%$). (e) Image showing the particles at the liquid–vapour interface in a high humidity environment (
 $t = -425\ \textrm {s}$,
  $rh = 89\,\%$, at
  $z = 100\ \mathrm {\mu }\textrm {m}$). For (a–e) we used a
  $1\ \mathrm {\mu }\textrm {l}$ drop of 0.01 w/v% of a dispersion of particles with
  $a = 0.92\ \mathrm {\mu }\textrm {m}$ on a soft silicone substrate (
 $h = 35\ \mathrm {\mu }\textrm {m}$). (f) Normalized number of particles at the liquid–vapour interface,
  $N_A/N_p$, vs. time,
  $t$, and normalized total binary collision events,
  $N_{Z,b}/N_p$, vs. time,
  $t$, during colloidal droplet evaporation on a compliant substrate at low
  $rh$ conditions. We have to note that the droplet was placed at
  $t_0$, which was before
  $t = -500\ \textrm {s}$, but we disregarded earlier times in this plot. Scale bars: (b, c)
  $200$, (d)
  $50$ and (e)
  $200\ \mathrm {\mu } \textrm {m}$.
The first step in the calculation requires one to determine the number of particles at the liquid–vapour interface,  $N_A(t)$. Assuming that all the particles dispersed in a certain volume of liquid which is then evaporating will end up at the liquid–vapour interface, one can write
 \begin{equation} N_A(t)=\frac{c(t_0)}{\tfrac{4}{3}{\rm \pi} a^3\rho_p}V\left(t_0\right)-V(t) , \end{equation}
with the initial concentration of particles in the bulk,  $c(t_0)$ in
  $\textrm {kg}\,\textrm {m}^{-3}$, the radius of the particle,
  $a$, the density of the particle,
  $\rho _p$, the initial droplet volume,
  $V(t_0)$, and the droplet volume at time
  $t$,
$t$,  $V(t)$, which is
 \begin{equation} V\left(t\right)=V\left(t_0\right)-\frac{1}{\rho}\int_{t_0}^{t}\frac{\textrm{d}m}{\textrm{d}\tilde{t}}\,\textrm{d}\tilde{t}. \end{equation}
 We find the mass loss due to evaporation,  $-{\textrm {d}m}/{\textrm {d}t}$, through Fick's law and in accordance to Popov (Reference Popov2005) and Brutin (Reference Brutin2015) as
 \begin{equation} -\frac{\textrm{d}m}{\textrm{d}t}={\rm \pi} R\left(t\right)D_v\left(c_s-c_\infty\right)f\left(\theta\left(t\right)\right), \end{equation}
with the diffusivity of water vapour in air,  $D_v = 0.282\times 10^{-4}\ \textrm {m}^{2}\,\textrm {s}^{-1}$; the saturated water vapour concentration,
  $c_s = 2.14\times 10^{-2}\ \textrm {kg}\,\textrm {m}^{-3}$; the water vapour concentration far away from the droplet,
  $c_{\infty }=({rh}/{100})c_s$; and a function which takes the droplet geometry into account,
  $f(\theta )$ (dimensionless). We determined
  $R(t)$ and
  $\theta (t)$ empirically, by conducting droplet evaporation experiments on a goniometer (Dataphysics OCA 35,
  $rh = 13.4 \pm 3.0\,\%$,
  $T = 24.3\,^{\circ }\textrm {C}\pm 1.3\,^{\circ }\textrm {C}$, 3 times repetition), and then fitting a Fourier series with four terms (with a coefficient of determination of 0.981 for
  $\theta$ and 0.989 for
  $R$). We approximate the dependence of the droplet geometry according to Hu & Larson (Reference Hu and Larson2002) with
  $f(\theta )\approx 1.3+0.27\theta ^2$. According to Brutin (Reference Brutin2015), the difference between the analytical solution and the approximation for
  $f(\theta )$ lies within roughly 10 % accuracy for contact angles of
  ${0}^{\circ } < \theta < 110^{\circ }$. Figure 4(f) shows
  $N_A$ divided by the total number of particles in the droplet,
  $N_p={c(t_0)V(t_0)}/{({4}/{3}){\rm \pi} a^3\rho _p}$, vs.
  $t$, which correctly describes an increase of particles at the liquid–vapour interface over time.
The concentration of particles per unit droplet surface area,  $n_A$, which will be needed for the calculation of the binary collision frequency, is then simply defined as
  $n_A(t)={N_A(t)}/{A(t)}$, with the liquid–vapour surface area,
  $A(t)$, which is calculated with the assumption that the droplet takes the form of a hemi-spherical cap.
In order to calculate the binary collision frequency of particles bound to an interface, we transformed the arguments made in Philipse (Reference Philipse2018), from three to two dimensions, which is necessary to calculate collisions along a surface. In this manner, we defined the mean free area,  $\langle A_f \rangle$, as opposed to the mean free volume, as
 \begin{equation} \langle A_f \rangle= \frac{A}{N_A}=\frac{1}{n_A}. \end{equation}
 The collision cross-section for a particle being constrained to a surface is  $4a$, which signifies that the mean free area is equal to
 \begin{equation} \langle A_f \rangle = 4a\lambda, \end{equation}
with  $\lambda$ being the mean free path of a particle. Considering that the particles move with respect to each other, it is the relative rather than the absolute velocity that matters, and a factor of
  $\sqrt {2}$ is introduced (see Moore Reference Moore1972). From (3.4) and (3.5) and considering the velocity factor, we thus get
 \begin{equation} \lambda=\frac{1}{4\sqrt2 a n_A}. \end{equation}
 The mean free path on the other hand is the product of the mean velocity,  $\langle v_p \rangle$, and the time between two collisions,
  $t_B$, which in turn is the inverse of the collision frequency,
  $Z$,
$Z$,
 \begin{equation} \lambda=\langle v_p \rangle t_B=\langle v_p \rangle /Z. \end{equation}
Thus,
 \begin{equation} Z=4\sqrt{2} a n_A \langle v_p \rangle, \end{equation}
which is the collision frequency of one specific particle at an interface. From the Einstein–Smucholski equation for Brownian motion (Einstein Reference Einstein1905; von Smoluchowski Reference von Smoluchowski1906), we know that,
 \begin{equation} \langle v_p \rangle=\sqrt{2D_A/t_B} , \end{equation}
where  $D_A$ is the diffusivity of the particles on the liquid–vapour interface. According to Danov, Dimova & Pouligny (Reference Danov, Dimova and Pouligny2000), this surface diffusivity is equal to
  $D_A=\bar {f}\, D$, with
  $D$, being the diffusivity of the particles in the bulk obtained through Stokes–Einstein equation (
 $D={k_B T}/{6{\rm \pi} \eta a}$, with Boltzmann constant,
  $k_B$, and liquid dynamic viscosity,
  $\eta$) and
  $\bar {f}\cong 1$ (Danov et al. Reference Danov, Dimova and Pouligny2000), (for a particle that is immersed to
  ${\sim }1/2$ in the liquid phase, with the assumption of a non-viscous interface and an interface curvature to particle radius ratio of
  ${\approx }400$). Thus, the difference between bulk and surface diffusivities is negligible and the factor
  $\bar {f}$ was not considered in the following equations.
The time interval over which this average Brownian velocity is computed is the time between two collisions, which is  $1/Z$, thus
 \begin{equation} \langle v_p \rangle_{1/Z}= \sqrt{2D_A Z}. \end{equation}
 By inserting (3.10) into (3.7) and solving for  $Z$, we obtain the binary collision frequency (of one specific particle with the others),
 \begin{equation} Z\approx 64 a^2n_a^2D_A=\frac{32k_B T}{3{\rm \pi}\eta}n_a^2 a. \end{equation}
 Since there are  $N_A$ particles on an area of
  $A$, the total number of binary collisions at the interface per time per unit area,
  $Z_b$, is (in accordance with Philipse Reference Philipse2018),
 \begin{equation} Z_b=\frac{1}{2}Z\frac{N_A}{A}\approx\frac{16k_BT}{3{\rm \pi}\eta}n_a^3a. \end{equation}
 The total number of binary collision events,  $N_{Z,b}$, is the integration of the binary collision frequency over time multiplied by the droplet free surface area,
 \begin{equation} N_{Z,b}(t)\approx A(t)\int_{t_0}^{t}{Z_b(\tilde{t}})\,\textrm{d}\tilde{t}. \end{equation}
We have to mention that we did not take into account higher-order collisions, we only considered the collision between single particles, hence the number of collision events in total is expected to be higher than estimated here. Also, the integrals were computed numerically.
We show in figure 4(f) the total number of binary collision events,  $N_{Z,b}$, normalized by
  $N_p$. We see from figure 4(f) that
  $N_{Z,b}/N_p$ is increasing exponentially over time and that at the end of the evaporation roughly 30 % of the particles contained in the droplet are likely to have experienced at least one collision event with another particle at the interface. This makes it more likely that particles come into so close proximity, in order for attractive forces, such as van der Waals interactions and floatation forces, to then cause aggregation. We did not observe that particle assemblies break off once aggregates are formed; therefore, the total number of collision events is a good measure for the probability of aggregation. Over the course of evaporation, as the droplets become thinner, these aggregates were affected by the coffee ring effect, being transported towards the droplet edge (see figure 4a at
  $t = -23\ \textrm {s}$), and ultimately contributing to the ring shape.
3.4. Discussion on ring formation during colloidal droplet evaporation on a compliant material
Based on our present findings, we now piece together a description of the process of formation of self-assembled particle deposits on a compliant material at low  $rh$ conditions. We show a schematic of the evaporation process in figures 5(a) to 5(e). Figures 5(f) to 5(i) show images from experiments (bottom view, fluorescence microscopy) that represent the real stages depicted in figures 5(a) to 5(e). Initially, the particles are homogeneously distributed in the bulk liquid, figure 5(a). Then, due to the liquid–vapour interface descending and the contact line receding, particles are captured by the liquid–vapour interface, where they are held due to capillarity (figures 5b and 5f). Also, we observe a weak outward flow, which is generated due to a hindered receding contact line motion through viscoelastic dissipation. This signifies that the liquid lost through evaporation at the contact line must be replenished from the bulk liquid. This then leads to the transport of particles to the droplet edge. In a subsequent step, particle self-assembly into a scaffold at the droplet surface near the contact line starts. In parallel, particle aggregates form at the liquid–vapour interface in the presence of Brownian motion (figures 5c and 5g). Then the outward replenishing flow intensifies; this is due to the fact that the receding contact line velocity exceeds the substrate rate of relaxation, leading to an inward rotation of the wetting ridge and allowing for smaller contact angles (Gerber et al. Reference Gerber, Lendenmann, Eghlidi, Schutzius and Poulikakos2019). Thus the droplet is relatively thin at this stage of the process, such that the outward flow also affects the particles and aggregates at the liquid–vapour interface (figures 5d and 5h). In the last step, the contact line pins and thus the replenishing flow further intensifies, the remaining particles in the bulk of the droplet are quickly transported towards the contact line. Also, the particle scaffold at the liquid–vapour interface is more closely packed at the contact line due to a surface area contraction accompanied by a strong outward drag (figures 5e and 5i). After the complete evaporation, a mostly two-layer structured ring is obtained after landing of the above-mentioned surface scaffold on the substrate, composed of an unordered lower layer and a hexagonally ordered upper layer. Regardless of the number of particles that are captured at the free surface, only a ring deposit can form if at some point the particle aggregates are advected by the outward flow. We believe that particle capture at the free surface plays a role in determining the final local packing of the particles, but not the overall topography.

Figure 5. Process of ring formation during colloidal droplet evaporation from a compliant material under low  $rh$ conditions. (a–e) Schematics of the evaporation process. (f–i) Snapshots of the process steps presented in (b–e) showing the motion of the particles and aggregates at the liquid–vapour interface. Initial and final locations of particles are marked with orange and red spots, respectively. The location of the liquid–vapour interface at height
  $z$ is shown as a blue dashed line. The time intervals are (f)
  $t = -366\ \textrm {s}$ to
  $t = -349\ \textrm {s}$, during this stage particles in the bulk are subjected to a weak outward flow thus being captured by the descending liquid–vapour interface, (g)
  $t = -105\ \textrm {s}$ to
  $t = -87\ \textrm {s}$, during this stage the particles at the liquid–vapour interface have partially aggregated, (h),
  $t = - 29\ \textrm {s}$ to
  $t = -24\ \textrm {s}$, during this stage the particles and aggregates at the liquid–vapour interface are experiencing the outward replenishing flow and are dragged towards the contact line and (i)
  $t = - 3.6\ \textrm {s}$ to
  $t = - 3.0\ \textrm {s}$, during this stage we observe contact line pinning, also particles at the liquid–vapour interface form a particle scaffold ring and are subjected to contraction, also strong outward flows lead to unordered deposition of particles in the underlying layer. Images in (f–h) were taken at a focus of a height of approximately
  $z \sim 20\ \mathrm {\mu }\textrm {m}$, the image in (i) was focused at
  $z \sim 0\ \mathrm {\mu }\textrm {m}$. Scale bars: (f–i)
  $25\ \mathrm {\mu }\textrm {m}$.
3.5. Bifurcation of printed lines on a compliant material
Having elucidated the mechanism of formation of the particle deposits on compliant substrates and having guided their shape through controlling the evaporation rate at different environmental humidities, we take a further step toward applications and exploit this knowledge in the area of functional contact printing. We designed an experiment in which we contact printed a colloidal ink ( $a = 0.92\ \mathrm {\mu }\textrm {m}$,
  $c(t_0) = 0.1\ \text {w/v}\%$ in water) onto a compliant material (see § 2.1,
  $h=35\ \mathrm {\mu }\textrm {m}$), controlling the printing location,
  $x(t)$, by a motorized stage while adjusting the sample temperature,
  $T_s$, and matching the flow rate,
  $Q$, to the evaporative flux (see § 2.4). Figure 6(a) shows a schematic of the set-up used in this experiment. The evaporation rate is controlled through the substrate temperature in this application. In figure 6(b) we show a printed deposit resulting from straight constant stage motion (
 $\textrm {d}x/\textrm {d}t = 0.04\ \textrm {mm}\ \textrm {s}^{-1}$) while decreasing both
  $T_s$ and
  $Q$, and keeping the air temperature, and
  $rh$ roughly constant (parameters are shown in figures 6c and 6d). Calculations showed that, in this regime, Marangoni flows are not expected to be significant (see appendix E). From figure 6(b) we see that, at high
  $T_s$, the particles are dragged outwards, creating two separate lines, whereas when the substrate temperature is decreased towards room temperature the deposited particle lines converge until the particles are deposited in the centre creating a single line. Hence, we have shown that the shape changes in colloidal deposits on compliant materials as a result of environmental conditions can be exploited to obtain two very distinct printing modes, transitioning from two to a single deposited particle line, with simple variation of the substrate temperature.

Figure 6. Compliant materials enable shape changes of footprints in a printing configuration, from a bifurcated to a single line. (a) Experimental set-up used for contact printing experiments. (b) Footprint resulting from straight stage motion under decreasing sample temperature,  $T_s$, and flow rate,
  $Q$, profiles, dispersion of 0.1 w/v% of particles (
 $a = 0.92\ \mathrm {\mu }\textrm {m}$). (c) Plot of
  $rh$ vs.
  $t$ and
  $T$ vs.
  $t$ during the printing experiment shown in (b). (d) Plot of
  $Q$ vs.
  $t$ during the printing experiment in (b). Scale bar: (b) 2 mm.
4. Conclusion
We found that coffee ring deposits on soft materials can form also in the presence of a partially receding contact line. We show that this coffee ring effect can either be promoted or suppressed on soft substrates – something that cannot be achieved using rigid ones – by simply adjusting the environmental humidity. High humidity led to a circular spot (disk full with particles), while low humidity led to a particle ring. The formation of a coffee ring on soft materials for a receding contact line, owes its existence to the viscous dissipation in the soft solid, hindering the motion of the contact line to compensate for the liquid lost at that location, combined with the transition to lower contact angles at expedited contact line velocities. The advected particles assemble at the liquid–vapour interface, forming a peripheral particle scaffold. At low environment humidity, retardation and eventual halting of the receding contact line at the wetting ridge leads to the collapse of the particle scaffold upon further drying and the formation of a ring deposit. We applied our findings to a contact printing configuration, showing the possibility of a transition from a single to a bifurcated line on a soft substrate by regulating the evaporative flux.
Acknowledgements
Partial support of the Swiss National Science Foundation under grant number 162565 and the European Research Council under Advanced Grant 669908 (INTICE) is acknowledged. We thank M. Heer for his preliminary work on the topic. We thank P. Feusi and J. Vidic for technical support and Professor Dr E. Mazza and Dr R. Hopf for letting us use their equipment for the stiffness measurement. We also thank the anonymous reviewer of an earlier paper of ours for suggesting to us an interesting idea.
Declaration of interests
The authors report no conflict of interest.
Supplementary movies
Supplementary movies are available at https://doi.org/10.1017/jfm.2020.855.
Appendix A. Characterization of sample with thin silicone elastomer layer
We measured the thickness of the thinner silicone elastomer layer by cooling the samples down in liquid nitrogen and using a scanning electron microscope to image the cross-section. However, as glass as well as silicone elastomer are non-conductive, imaging in a scanning electron microscope was difficult. To have further assurance of the layer thickness we also fabricated the same silicone layer but on a silicon substrate. We sputter coated all the samples with a 5 nm thick layer of platinum to improve the conductivity of the samples and prevent charging. Figure 7(a) shows the cross-section of a silicone elastomer layer on a silicon substrate. We measured the thickness of the silicone elastomer layer to be  $h = 100 \pm 42\ \textrm {nm}$ on silicon and
  $h = 72 \pm 22\ \textrm {nm}$ on glass. We performed indentation tests with a FT-MTA02 micromechanical testing and assembly station (FemtoTools AG). A sphere of radius
  $200\ \mathrm {\mu }\textrm {m}$, which was attached to the sensor, was used to indent the sample. The force vs. displacement curves are shown in figure 7(b), showing that the curves of bare glass and glass coated with a 72 nm thin film of silicone elastomer overlap within the error bars. This signifies, that the thin elastomer layer did not add significant compliance and the sample thus behaved effectively rigid.

Figure 7. Characterization of sample with thin silicone elastomer layer. (a) Scanning electron micrographs of cleaved samples, silicone elastomer layer on silicon wafer. Scale bar  $1\ \mathrm {\mu }\textrm {m}$. (b) Indentation tests of glass (in grey), a thin silicone layer with a thickness
  ${\approx }72\ \textrm {nm}$ on glass (in orange) and a thick silicone layer with a thickness
  ${\approx }35\ \mathrm {\mu }\textrm {m}$ on glass (in red). The two force vs. displacement curves of the glass and thin silicone layer on glass overlap (within the standard deviations), showing that the silicone layer does not add significant compliance to the glass substrate.
Appendix B. Analysis of deposits
We measured the outer diameter,  $d_o$, of the dry colloidal patterns by fitting a circle. The inner effective diameter,
  $d_{{i,eff}}$, was determined by applying a threshold to the images, converting them into black and white images; then extracting the number of black pixels in the middle, which corresponds to the effective inner area,
  $A_{{i,eff}}$ (see figure 8). Using the magnification factor to convert
  $A_{{i,eff}}$ to units of
  $\mathrm {\mu }\textrm {m}$, we then calculated
  $d_{{i,eff}}$ as
  $d_{{i,eff}}=2\sqrt {A_{{i,eff}}/{\rm \pi} }$.

Figure 8. Explanation for determination of  $A_{{i,eff}}$. The image on the left is a picture of the deposit, including a scale bar. The image on the right has been ‘thresholded’, and the area within the deposit that does not contain any particles is then black and can be measured. Scale bar:
  $50\ \mathrm {\mu }\textrm {m}$.
Appendix C. Detection of particles in three dimensions
For detection of particles in three dimensions we used substrates of a silicone layer (see § 2.1,  $h = 35\ \mathrm {\mu }\textrm {m}$) on glass slides. We used a home-built fluorescence microscope to acquire images at various heights below and above the contact line. This was done by scanning the focal plane through the
  $z$-direction, meaning that we moved the objective by means of a piezoelectric motor. These stacks of images were acquired at various time points during the evaporation process and were then analysed using a MATLAB script to find circular objects. In this manner, we were able to detect most of the particles that were in focus at a specific height (see figure 9). Coordinate
  $z$ was set to zero as the height of the wetting ridge, which was determined manually, by selecting the image in which the particles at the contact line were in focus. Then the locations were transformed to a cylindrical coordinate system which has its origin at the centre of the droplet and
  $z = 0\ \mathrm {\mu }\textrm {m}$ is at the height of the wetting ridge.

Figure 9. Working principle of detection of the three-dimensional locations of particles. The focal plane was scanned through  $z$, obtaining a stack of images with
  ${\rm \Delta} z=2\ \mathrm {\mu }\textrm {m}$. Each image of the stack was analysed by an algorithm searching for circular objects. Not all images of the stack are shown here. The white dashed line represents the location of the contact line. The red circles mark the detected particles at each height
  $z$. Scale bar:
  $10\ \mathrm {\mu }\textrm {m}$.
Appendix D. Time scale for aggregation due to floatation forces
A floating particle distorts the liquid–vapour interface around it due to a balance of surface tension, its weight and the buoyancy force. Now, if there is a second particle nearby (with the same properties), it will be attracted as a result of the distorted interface and its weight/buoyancy forces. According to Vella & Mahadevan (Reference Vella and Mahadevan2005), one can calculate the time for the attraction of such two particles by equating the floatation force with a Stokes drag term. One then obtains
 \begin{equation} t_{{contact}} \approx \frac{3\eta \beta (l(0)^2-a^2)}{2\gamma_{{LV}}l_c Bo^{2.5}\varSigma^2}, \end{equation}
where  $\beta$ is a scaling factor (accounts for the fact that the drag experienced by a particle at an interface is less than in the bulk, here we assume
  $\beta \approx 1/2$);
  $l(0)$ is the initial distance between two particles (see below for calculation);
  $a$ is the particle radius (
 $a = 0.92\ \mathrm {\mu }\textrm {m}$);
  $l_c=\sqrt {\gamma _{{LV}}/\rho g}$ is the capillary length (
 $l_c = 2.7\times 10^{-3}\ \textrm {m}$);
  $Bo=\rho ga^2/\gamma _{{LV}}$ is the Bond number (
 $Bo = 1.14\times 10^{-7}$); and
  $\varSigma$ is the non-dimensional resultant weight of the particle once the upward Archimedes force has been subtracted out;
  $\varSigma$ is defined as (see Vella & Mahadevan Reference Vella and Mahadevan2005),
 \begin{equation} \varSigma=\frac{2\rho_p/\rho-1}{3}-\frac{1}{2}\cos{\theta}+\frac{1}{6}\cos^3{\theta}, \end{equation}
where  $\rho _p$ is the density of the particle (
 $\rho _p=1050\ \textrm {kg}\ \textrm {m}^{-3}$),
  $\rho$ is the density of the liquid (
 $\rho =998\ \textrm {kg}\ \textrm {m}^{-3}$) and
  $\theta$ is the contact angle of the liquid on the particle surface in air (
 $\theta =87.4^{\circ }$). In our calculations we assumed that
  $l(0)$ was of the order of the initial distance between the particles in the bulk, which depends on the initial concentration of the particles,
  $c(t_0)= 0.1\ \textrm {kg}\,\textrm {m}^{-3}$, particle density,
  $\rho _p= 1050\ \textrm {kg}\,\textrm {m}^{-3}$ and particle radius,
  $a = 0.92\ \mathrm {\mu }\textrm {m}$, and can be shown to be,
 \begin{equation} l(0)\approx \left(\frac{4{\rm \pi} a^3\rho_p}{3c(t_0)}\right)^{{1}/{3}} =32.5\ \mathrm{\mu}\textrm{m}. \end{equation}
In this manner we obtained  $t_{{contact}} \approx 1.8\times 10^{10}\ \textrm {s}$. This very long characteristic time scale is expected due to the fact that the small density difference between particles and water and the small radius of the particles result in negligible curvature at the liquid surface. The characteristic time for contact based on floatation forces is thus several orders of magnitude higher than the time scale for evaporation of droplets with an initial volume of
  $1\ \mathrm {\mu }\textrm {l}$, namely,
  $t_{{evap}}\approx 6\times 10^{2}\ \textrm {s}$ (experimentally determined). Therefore, floatation forces cannot be the main factor responsible for the particle aggregation that we observed in our experiments.
Appendix E. The importance of Marangoni flows
To assess the importance of Marangoni flows within the evaporating liquid and their potential impact on the final shape of the deposits, we calculated the Marangoni number for the contact line printing experiments. The Marangoni number is defined as,
 \begin{equation} Ma={-}\left(\frac{\textrm{d}\gamma}{\textrm{d}T}\right)\frac{L {\rm \Delta} T}{\eta \alpha_{th}}, \end{equation}
with the surface tension gradient with temperature,  ${\textrm {d}\gamma }/{\textrm {d}T}$ (
 $-1.78\times 10^{-4}\ \textrm {N}\ \textrm {m}^{-1}\ \textrm {K}^{-1}$), the height of the liquid layer,
  $L$, the liquid viscosity,
  $\eta$ (0.001 Pa s), and the thermal diffusivity,
  $\alpha _{th}$ (
 $1.60\times 10^{-7}\ \textrm {m}^2\ \textrm {s}^{-1}$). We estimated the height of the liquid layer by
  $L \approx ({Q}/w) \textrm {d}x/\textrm {d}t =210\ \mathrm {\mu }\textrm {m}$, with the flow rate,
  $Q$ (
$Q$ ( $0.5\ \mathrm {\mu } \textrm {l}\ \textrm {s}^{-1}$), the stage velocity,
  $\textrm {d}x/\textrm {d}t$ (
 $0.04\ \textrm {mm}\ \textrm {s}^{-1}$), and the width of the footprint,
  $w\approx 1\ \textrm {mm}$. We obtained an estimate for the temperature difference from Girard, Antoni & Sefiane (Reference Girard, Antoni and Sefiane2008) (where they calculate the surface temperature profile of droplets evaporating from heated surfaces numerically, by using heat and the Navier–Stokes equations) to be
  ${\rm \Delta} T \approx 0.084\ \textrm {K}$. We thus obtained
  $Ma \approx 20$, which is four times smaller than the critical Marangoni number,
  ${Ma}_{{crit}}=80$.


