


1. Introduction
One of the relatively few exact solutions of the incompressible Navier–Stokes equations is that corresponding to the fluid motion induced in a semi-infinite layer of fluid that lies above a flat plate oscillating in its own plane. For this reason the determination of the stability characteristics of this Stokes layer has attracted much interest as it is regarded as a paradigm for a whole family of oscillatory flows. Over the years the linear stability properties of the Stokes layer have been increasingly well understood although there still remains some unresolved discrepancies between theoretical and experimental findings. The primary purpose of this paper is to contribute further to an examination of this issue. Our major result provides reasons why good agreement between theory and practice might prove to be an ultimately unachievable goal.
We begin by tracing some of the major developments to date in the analysis of the stability of the Stokes layer. In the interests of brevity our account is not intended to be comprehensive and readers interested in further details are directed to the cited articles for amplification as required. The first completely rational examination of the stability of the semi-infinite Stokes layer was provided by Hall (Reference Hall1978), who used Floquet theory to reduce the linear disturbance equations to an infinite system of coupled ordinary differential equations in space. The structure of this system enabled Hall to formulate a semi-analytical solution which could be obtained once the zeros of a (formally infinite) determinant were located numerically. Of course in practice the determinant has to be truncated and it is not surprising that as the Reynolds number
 $R$
increases so the number of terms retained has to increase in order to be assured of a sufficiently well-converged solution. The parameter
$R$
increases so the number of terms retained has to increase in order to be assured of a sufficiently well-converged solution. The parameter
 $R$
will be defined formally in (2.7) below, but for the moment it is sufficient to note that computational limitations restricted (Hall Reference Hall1978) to a range
$R$
will be defined formally in (2.7) below, but for the moment it is sufficient to note that computational limitations restricted (Hall Reference Hall1978) to a range
 $R<160$
and for these values no evidence of instability could be detected.
$R<160$
and for these values no evidence of instability could be detected.
It is well known that experimental work with oscillatory layers is far from straightforward, not least of the difficulties being associated with the generation of an accurate base flow in the first place. Of course, in practice it is impossible to generate a semi-infinite flat layer of oscillating fluid in a laboratory so that experiments are either conducted within a wide channel or, more often, in a tube of large radius in an attempt to minimise any influence of curvature. Moreover, there have been a number of strategies adopted in order to generate an oscillatory fluid layer; the two most common methods are to either vibrate the boundary and so induce oscillation in the fluid (Clamen & Minton Reference Clamen and Minton1977) or to drive the motion by some kind of piston arrangement (Merkli & Thomann Reference Merkli and Thomann1975; Hino, Sawamoto & Takasu Reference Hino, Sawamoto and Takasu1976; Eckmann & Grotberg Reference Eckmann and Grotberg1991). Without undue distraction by these details, what is important for present purposes is to note that the combined results of a large number of experiments is somewhat inconclusive. In particular, reports of the critical value of
 $R$
at which instability sets in range from about 140 to nearly 300. It might have been hoped that the suite of experiments would predict transition values of
$R$
at which instability sets in range from about 140 to nearly 300. It might have been hoped that the suite of experiments would predict transition values of
 $R$
in somewhat better agreement. In particular, it is remarked that some of these practical realisations of the Stokes layer observed instability at values of
$R$
in somewhat better agreement. In particular, it is remarked that some of these practical realisations of the Stokes layer observed instability at values of
 $R$
for which Hall (Reference Hall1978) predicted stability.
$R$
for which Hall (Reference Hall1978) predicted stability.
The theoretical strategy adopted by Hall was re-visited by Blennerhassett & Bassom (Reference Blennerhassett and Bassom2002) (hereafter referred to as BB02). The advances in computer technology since Hall’s (Reference Hall1978) original calculation enabled BB02 to examine values of
 $R$
far in excess of those accessible earlier. In particular, BB02 identified part of the neutral stability curve with a critical
$R$
far in excess of those accessible earlier. In particular, BB02 identified part of the neutral stability curve with a critical
 $R$
for instability in the region of 708. This was the first theoretical determination of the transition value of
$R$
for instability in the region of 708. This was the first theoretical determination of the transition value of
 $R$
but it is still very different from the values observed in reality. In subsequent work Blennerhassett & Bassom (Reference Blennerhassett and Bassom2006) (subsequently abbreviated as BB06) endeavoured to explain this rather large discrepancy by extending the study of BB02 to finite-width channels or circular pipes in order to replicate experimental conditions more faithfully. We remark that the incorporation of these effects did reduce the critical
$R$
but it is still very different from the values observed in reality. In subsequent work Blennerhassett & Bassom (Reference Blennerhassett and Bassom2006) (subsequently abbreviated as BB06) endeavoured to explain this rather large discrepancy by extending the study of BB02 to finite-width channels or circular pipes in order to replicate experimental conditions more faithfully. We remark that the incorporation of these effects did reduce the critical
 $R$
somewhat, to approximately 540 with the optimal arrangement, but there remained a rather large and unsatisfactory difference between the theoretical predictions and practical observations.
$R$
somewhat, to approximately 540 with the optimal arrangement, but there remained a rather large and unsatisfactory difference between the theoretical predictions and practical observations.
There have been several propositions as to the underlying mechanism that explains why the idealised analytical flow appears to have quite different stability properties to that seen in practice. While one might expect that perfect agreement between the two approaches is unduly optimistic, the size of the discrepancy is still rather unsettling. One popular explanation relies on the role that might be played by nonlinear effects. In BB02 it was shown that on the neutral stability curve the corresponding disturbance eigenfunction, although experiencing zero net growth over the course of a period of the oscillation, does nevertheless undergo intervals of quite dramatic growth during the cycle with the upshot that the maximum disturbance amplitude over a period is roughly a hundred times that of the minimum. The implication is that in practice it would be difficult to stimulate disturbances to a Stokes layer which are so small that at some stage nonlinear effects are not important. Other workers have suggested that as the walls of a channel or pipe are not perfectly smooth some small roughness may be sufficient to prematurely trip disturbance modes at values of
 $R$
far below the values suggested by the calculations. Blondeaux & Vittori (Reference Blondeaux and Vittori1994), Verzicco & Vittori (Reference Verzicco and Vittori1996) and Vittori & Verzicco (Reference Vittori and Verzicco1998) have shown that roughness on the walls of experimental apparatus can expediate the development of turbulence in this unsteady flow.
$R$
far below the values suggested by the calculations. Blondeaux & Vittori (Reference Blondeaux and Vittori1994), Verzicco & Vittori (Reference Verzicco and Vittori1996) and Vittori & Verzicco (Reference Vittori and Verzicco1998) have shown that roughness on the walls of experimental apparatus can expediate the development of turbulence in this unsteady flow.
In this paper an alternative approach is pursued. It is well known that even the most careful of experiments must contain an element of noise that is impossible to eliminate completely. As an example, the results presented by Akhavan, Kamm & Shapiro (Reference Akhavan, Kamm and Shapiro1991) indicate that their simulations of Stokes layer flow may contain as much as 1 % noise. Further, Eckmann & Grotberg (Reference Eckmann and Grotberg1991) explicitly report a noise level of approximately 4 % of the root-mean-square (r.m.s.) velocity in their basic flow. While neither of these studies provide numerical data on the structure of this noise, from the graphs of the basic flow velocity traces at low Reynolds numbers it can be seen that there are high frequencies in the extraneous components of the flow.
With this in mind the linear stability calculations of BB02 and BB06 were repeated but, rather than supposing the wall vibrates with a purely sinusoidal velocity, a small component of a higher-frequency oscillation was included in an effort to model noise within an experiment. The main result of these calculations was that for a range of frequencies, the critical Reynolds number was substantially reduced by the inclusion of a little as 1 % of noise (as seen by Akhavan et al.
Reference Akhavan, Kamm and Shapiro1991). In fact, at the 1 % noise level, the critical Reynolds number was less than half its value in the idealised noise-free flow. Such a moderation brings the theoretical work much more in line with the practical determinations of the critical
 $R$
.
$R$
.
An alternative, more mathematical interpretation of the approach outlined above is provided by perturbed operator theory. The small amplitude high-frequency components added to the basic velocity field result in small changes to the coefficients in the governing linear stability equations, so that the attempt to model noise results in a problem slightly perturbed from a noise-free situation. This latter formalism brings into play the results and techniques associated with pseudo-spectra of the Orr–Sommerfeld operator (Trefethen et al. Reference Trefethen, Trefethen, Reddy and Driscoll1993; Trefethen Reference Trefethen1997) and the related effects connected with non-normal operators (Chomaz Reference Chomaz2005; Schmid Reference Schmid2007). From this point of view the large decrease in critical Reynolds number that we have found via purely linear theory could be explained as a natural consequence of the underlying non-normal Orr–Sommerfeld operator. Further, these ideas lead to the possibility of a ‘bypass’ mechanism (Butler & Farrell Reference Butler and Farrell1992) explaining the difference between the experimental transition conditions and the theoretical predictions of BB02 and BB06. The experimental noise levels that are modelled here are comparable in size to the free-stream turbulence levels seen in bypass experiments on turbulent spot generation in flat plate boundary layers (Brandt, Schlatter & Henningson Reference Brandt, Schlatter and Henningson2004). While a large amount of computational investigation needs to be conducted, at this stage, the calculations of Thomas et al. (Reference Thomas, Davies, Bassom and Blennerhassett2014) on the fully nonlinear propagation of two-dimensional wavepackets in a Stokes layer have not shown any tendency towards such a bypass scenario. However, there will need to be more analysis of the nonlinear stability properties of Stokes layers before a full understanding is reached, but having a linear mechanism bring theoretical predictions closer to experiment is an important result.
The remainder of the paper is structured as follows. First, the linear stability problem examined is formulated in § 2 and then the numerical methods used in its solution are presented in §§ 2.1 and 2.2. The effect of adding an infinitesimal higher-frequency component to a single frequency basic state is the first flow considered in § 3. This calculation takes the results of BB06 as the first term in a perturbation expansion, and via the determination of the needed adjoint function, a set of eigenvalue sensitivity coefficients, one for each higher frequency, is determined. This process identified those higher frequencies whose presence has the most effect on the eigenvalues of the noise-free case and, hence, potentially on the location of the associated linear neutral stability curve. These analytical results are presented in § 3.1, and then extended in § 4 where numerical solutions of the linear stability eigenvalue problem for a wall velocity containing a small, but finite, higher-frequency component is considered. It is the results for these flows that demonstrate the remarkably strong dependence of the linear stability critical conditions on the frequency and amplitude of the perturbation. These Floquet theory results are confirmed by a direct numerical solution of the governing linear equations, using the direct numerical simulation (DNS) approach developed by Davies & Carpenter (Reference Davies and Carpenter2001) and described in § 2.2.
All of the analysis and calculations are executed in suitably non-dimensionalised variables which are defined immediately below. The paper concludes with a discussion of the results obtained and their implications for further theoretical and experimental work aimed at the determination of the critical Reynolds number for oscillatory flows akin to the Stokes layer.
2. Linear stability formulation and numerical methods
Consider two parallel infinite flat plates, a distance
 $2d$
apart, that oscillate within their own planes, along the dimensional
$2d$
apart, that oscillate within their own planes, along the dimensional
 $x^{\ast }$
-direction with a velocity given by
$x^{\ast }$
-direction with a velocity given by
 $$\begin{eqnarray}U_{w}=U_{s}\cos {\it\omega}t+U_{s}{\it\delta}({\it\alpha}_{p}\cos (\,p{\it\omega}t)+{\it\beta}_{p}\sin (\,p{\it\omega}t))\quad \text{where }{\it\alpha}_{p}^{2}+{\it\beta}_{p}^{2}=1\end{eqnarray}$$
and where
 $p$
is a positive integer. While there are no theoretical restrictions on the value of
$p$
is a positive integer. While there are no theoretical restrictions on the value of
 ${\it\delta}$
, in an attempt to model experimental noise, values in the range
${\it\delta}$
, in an attempt to model experimental noise, values in the range
 $0\leqslant {\it\delta}\lessapprox 0.03$
are considered in the remainder of the paper. Here
$0\leqslant {\it\delta}\lessapprox 0.03$
are considered in the remainder of the paper. Here
 $U_{s}$
is the velocity scale, being the magnitude of the velocity of the fundamental oscillation and
$U_{s}$
is the velocity scale, being the magnitude of the velocity of the fundamental oscillation and
 ${\it\omega}$
is the angular frequency of the oscillating plates. The constants
${\it\omega}$
is the angular frequency of the oscillating plates. The constants
 ${\it\alpha}_{p}$
and
${\it\alpha}_{p}$
and
 ${\it\beta}_{p}$
specify the magnitudes of the sinusoidal perturbations and
${\it\beta}_{p}$
specify the magnitudes of the sinusoidal perturbations and
 $p$
denotes the frequency of these perturbations to the assumed monotonic basic flow. Note that here the term ‘monotonic’ is used to denote a base flow which contains only one frequency of oscillation. This terminology also provides a simple descriptor for previous work (see Hall Reference Hall1978, BB02 and BB06, for example).
$p$
denotes the frequency of these perturbations to the assumed monotonic basic flow. Note that here the term ‘monotonic’ is used to denote a base flow which contains only one frequency of oscillation. This terminology also provides a simple descriptor for previous work (see Hall Reference Hall1978, BB02 and BB06, for example).
The motion of the planar surfaces forces the adjacent incompressible, viscous fluid to oscillate back and forth, generating a flow containing the frequencies
 ${\it\omega}$
and
${\it\omega}$
and
 $p{\it\omega}$
. We introduce the non-dimensional time
$p{\it\omega}$
. We introduce the non-dimensional time
 ${\it\tau}={\it\omega}t$
and scale all velocity components on
${\it\tau}={\it\omega}t$
and scale all velocity components on
 $U_{s}$
with lengths non-dimensionalised by
$U_{s}$
with lengths non-dimensionalised by
 $\sqrt{2{\it\nu}/{\it\omega}}$
, where
$\sqrt{2{\it\nu}/{\it\omega}}$
, where
 ${\it\nu}$
is the kinematic viscosity of the fluid. Using these scalings the basic velocity profile is given by
${\it\nu}$
is the kinematic viscosity of the fluid. Using these scalings the basic velocity profile is given by
 $$\begin{eqnarray}u=U_{B}(y,{\it\tau};p)=\mathit{Re}\left\{\frac{\cosh ((1+\text{i})y)}{\cosh ((1+\text{i})h)}\text{e}^{\text{i}{\it\tau}}+{\it\delta}\frac{\cosh ((1+\text{i})y\sqrt{p})}{\cosh ((1+\text{i})h\sqrt{p})}({\it\alpha}_{p}-\text{i}{\it\beta}_{p})\text{e}^{\text{i}p{\it\tau}}\right\},\end{eqnarray}$$
or, on introducing the functions
 $u_{1}(y)$
,
$u_{1}(y)$
,
 $u_{p}(y)$
and their complex conjugates
$u_{p}(y)$
and their complex conjugates
 $\tilde{u} _{1}(y)$
and
$\tilde{u} _{1}(y)$
and
 $\tilde{u} _{p}(y)$
,
$\tilde{u} _{p}(y)$
,
 $$\begin{eqnarray}\displaystyle & \displaystyle U_{B}=[u_{1}\text{e}^{\text{i}{\it\tau}}+\tilde{u} _{1}\text{e}^{-\text{i}{\it\tau}}]+{\it\delta}[u_{p}({\it\alpha}_{p}-\text{i}{\it\beta}_{p})\text{e}^{\text{i}p{\it\tau}}+\tilde{u} _{p}({\it\alpha}_{p}+\text{i}{\it\beta}_{p})\text{e}^{-\text{i}p{\it\tau}}], & \displaystyle\end{eqnarray}$$
 $$\begin{eqnarray}\displaystyle & \displaystyle v=0. & \displaystyle\end{eqnarray}$$
 $p$
components of the basic flow, and so we define
$p$
components of the basic flow, and so we define $$\begin{eqnarray}U_{B}(y,{\it\tau};p)=U_{B,1}+{\it\delta}U_{p},\end{eqnarray}$$
where comparing with (2.2b
) we get the obvious definitions for
 $U_{B,1}$
and
$U_{B,1}$
and
 $U_{p}$
.
$U_{p}$
.
Here
 $h=d\sqrt{{\it\omega}/2{\it\nu}}$
is the non-dimensional half width of the channel and
$h=d\sqrt{{\it\omega}/2{\it\nu}}$
is the non-dimensional half width of the channel and
 $y$
is the non-dimensional coordinate normal to the bounding planes. We note that when
$y$
is the non-dimensional coordinate normal to the bounding planes. We note that when
 $h$
is greater than roughly 14 the basic flow adjacent to each channel wall is an excellent approximation to the classical Stokes layer in a semi-infinite fluid. Indeed, calculations described in BB06 illustrate that the stability properties of the channel flow with
$h$
is greater than roughly 14 the basic flow adjacent to each channel wall is an excellent approximation to the classical Stokes layer in a semi-infinite fluid. Indeed, calculations described in BB06 illustrate that the stability properties of the channel flow with
 $h\geqslant 14$
are virtually indistinguishable from those of the semi-infinite layer.
$h\geqslant 14$
are virtually indistinguishable from those of the semi-infinite layer.
The linear stability of the flow (2.2) is found by imposing a disturbance of the form
 $$\begin{eqnarray}(u,v)=(U_{B},0)+{\it\varepsilon}\left(\frac{\partial {\it\Psi}}{\partial y},-\frac{\partial {\it\Psi}}{\partial x}\right),\end{eqnarray}$$
where
 ${\it\varepsilon}\ll 1$
and
${\it\varepsilon}\ll 1$
and
 ${\it\Psi}$
denotes the stream function of a two-dimensional disturbance. Here
${\it\Psi}$
denotes the stream function of a two-dimensional disturbance. Here
 $x$
is the non-dimensional coordinate in the streamwise direction. Since Squire’s theorem has been extended to unsteady flows (Conrad & Criminale Reference Conrad and Criminale1965; von Kerczek & Davis Reference von Kerczek and Davis1974), the disturbance form in (2.3) is sufficient for locating the critical conditions for the linear stability of the basic flow (2.2a
). The disturbance stream function
$x$
is the non-dimensional coordinate in the streamwise direction. Since Squire’s theorem has been extended to unsteady flows (Conrad & Criminale Reference Conrad and Criminale1965; von Kerczek & Davis Reference von Kerczek and Davis1974), the disturbance form in (2.3) is sufficient for locating the critical conditions for the linear stability of the basic flow (2.2a
). The disturbance stream function
 ${\it\Psi}$
may be written as
${\it\Psi}$
may be written as
 $$\begin{eqnarray}{\it\Psi}=\exp \{{\it\mu}{\it\tau}+\text{i}ax\}{\it\psi}(y,{\it\tau})+\text{complex conjugate}\end{eqnarray}$$
where
 $a\in \mathbb{R}$
is the wavenumber and
$a\in \mathbb{R}$
is the wavenumber and
 ${\it\psi}(y,{\it\tau})$
is a
${\it\psi}(y,{\it\tau})$
is a
 $2{\rm\pi}$
-periodic function of time with any exponential growth or decay of
$2{\rm\pi}$
-periodic function of time with any exponential growth or decay of
 ${\it\Psi}$
incorporated in the Floquet exponent
${\it\Psi}$
incorporated in the Floquet exponent
 ${\it\mu}\in \mathbb{C}$
. Here
${\it\mu}\in \mathbb{C}$
. Here
 ${\it\mu}_{i}$
, the imaginary part of
${\it\mu}_{i}$
, the imaginary part of
 ${\it\mu}$
, can only be determined modulo 1 in general.
${\it\mu}$
, can only be determined modulo 1 in general.
By linearising in
 ${\it\varepsilon}$
the governing equation for the stream function
${\it\varepsilon}$
the governing equation for the stream function
 ${\it\psi}$
reduces to
${\it\psi}$
reduces to
 $$\begin{eqnarray}\frac{\partial }{\partial {\it\tau}}\mathscr{L}{\it\psi}=\left\{\frac{1}{2}\mathscr{L}-{\it\mu}-\text{i}aRU_{B}\right\}\mathscr{L}{\it\psi}+\text{i}aRU_{B}^{\prime \prime }{\it\psi},\end{eqnarray}$$
subject to the boundary conditions
 $$\begin{eqnarray}{\it\psi}={\it\psi}^{\prime }=0\quad \text{on }y=\pm h,\end{eqnarray}$$
where a prime denotes differentiation with respect to
 $y$
and
$y$
and
 $$\begin{eqnarray}\mathscr{L}\equiv \frac{\partial ^{2}}{\partial y^{2}}-a^{2}.\end{eqnarray}$$
Furthermore, the Reynolds number
 $R$
in (2.5a
) is defined as
$R$
in (2.5a
) is defined as
 $$\begin{eqnarray}R=\frac{U_{s}}{\sqrt{2{\it\nu}{\it\omega}}}.\end{eqnarray}$$
For later use it is convenient to rewrite (2.5a ) and the associated boundary conditions (2.5b ) in the operator form
 $$\begin{eqnarray}\mathscr{K}(U_{B},{\it\mu}){\it\psi}=0,\quad {\it\psi}={\it\psi}^{\prime }=0\quad \text{on }y=\pm h.\end{eqnarray}$$
2.1. Linear stability via Floquet theory
Using Floquet theory to determine the linear stability of the family of flows (2.1) leads to the problem (2.5) and, as
 ${\it\psi}(y,{\it\tau})$
is
${\it\psi}(y,{\it\tau})$
is
 $2{\rm\pi}$
-periodic in
$2{\rm\pi}$
-periodic in
 ${\it\tau}$
, a solution for
${\it\tau}$
, a solution for
 ${\it\psi}(y,{\it\tau})$
is sought in the form
${\it\psi}(y,{\it\tau})$
is sought in the form
 $$\begin{eqnarray}{\it\psi}(y,{\it\tau})=\mathop{\sum }_{n=-\infty }^{n=\infty }{\it\psi}_{n}(y)\exp (\text{i}n{\it\tau}).\end{eqnarray}$$
The techniques used here are an extension of the methods first used by BB06 and then developed for different geometries and flows in a series of papers (Blennerhassett & Bassom Reference Blennerhassett and Bassom2007; Thomas et al. Reference Thomas, Bassom, Blennerhassett and Davies2011; Thomas, Bassom & Blennerhassett Reference Thomas, Bassom and Blennerhassett2012). The description of the methods adopted here will be very brief and further details can be found in the previously mentioned work.
The substitution of (2.9) into (2.5) and the collection of coefficients of
 $\exp (\text{i}n{\it\tau})$
yields an infinite system of ordinary differential equations
$\exp (\text{i}n{\it\tau})$
yields an infinite system of ordinary differential equations
 $$\begin{eqnarray}\displaystyle (\mathscr{L}-a^{2}-2{\it\mu}-2\text{i}n)\mathscr{L}{\it\psi}_{n} & = & \displaystyle \text{i}aR\mathop{\sum }_{k\in \{1,p\}}({\it\alpha}_{k}-\text{i}{\it\beta}_{k})u_{k}(\mathscr{L}{\it\psi}_{n-k}-2\text{i}k{\it\psi}_{n-k})\nonumber\\ \displaystyle & & \displaystyle +\,({\it\alpha}_{k}+\text{i}{\it\beta}_{k})\tilde{u} _{k}(\mathscr{L}{\it\psi}_{n-k}+2\text{i}k{\it\psi}_{n+k}),\end{eqnarray}$$
where the
 $u_{1}$
and
$u_{1}$
and
 $u_{p}$
are as defined in (2.2b
). (We point out that implicit in (2.2a
) are the definitions
$u_{p}$
are as defined in (2.2b
). (We point out that implicit in (2.2a
) are the definitions
 ${\it\alpha}_{1}=1$
and
${\it\alpha}_{1}=1$
and
 ${\it\beta}_{1}=0$
.)
${\it\beta}_{1}=0$
.)
The system of equations (2.10) was solved numerically using the pseudo-spectral techniques described by Fornberg (Reference Fornberg1996) and Trefethen (Reference Trefethen2000). Differential operators in (2.10) were replaced by their pseudo-spectral matrix approximations and each
 ${\it\psi}_{n}(y)$
was represented as a vector
${\it\psi}_{n}(y)$
was represented as a vector
 ${\bf\psi}_{n}$
of its function values on a Chebyshev mesh over the interval
${\bf\psi}_{n}$
of its function values on a Chebyshev mesh over the interval
 $-h\leqslant y\leqslant h$
. The introduction of matrix operators
$-h\leqslant y\leqslant h$
. The introduction of matrix operators
 $$\begin{eqnarray}\displaystyle & \displaystyle \mathscr{L}\rightarrow \boldsymbol{L},\quad \left.\left(\frac{\partial ^{4}}{\partial y^{4}}-2a^{2}\frac{\partial ^{2}}{\partial y^{2}}+a^{4}\right)\right/2\rightarrow \boldsymbol{V}, & \displaystyle\end{eqnarray}$$
 $$\begin{eqnarray}\displaystyle & \displaystyle \unicode[STIX]{x1D648}_{k}=\boldsymbol{L}^{-1}({\it\alpha}_{k}-\text{i}{\it\beta}_{k})u_{k}(\boldsymbol{L}-2\text{i}k\unicode[STIX]{x1D644})\quad \text{for }k=1,p, & \displaystyle\end{eqnarray}$$
 $$\begin{eqnarray}-\text{i}aR\mathop{\sum }_{k\in \{1,p\}}\widetilde{\unicode[STIX]{x1D648}}_{k}{\bf\psi}_{n+k}+(\boldsymbol{L}^{-1}\boldsymbol{V}-\text{i}n\unicode[STIX]{x1D644}){\bf\psi}_{n}-\text{i}aR\mathop{\sum }_{k\in \{1,p\}}\unicode[STIX]{x1D648}_{k}{\bf\psi}_{n-k}={\it\mu}{\bf\psi}_{n},\end{eqnarray}$$
for
 $\unicode[STIX]{x1D644}$
the identity matrix and
$\unicode[STIX]{x1D644}$
the identity matrix and
 $\widetilde{\unicode[STIX]{x1D648}}_{k}$
the complex conjugate of
$\widetilde{\unicode[STIX]{x1D648}}_{k}$
the complex conjugate of
 $\unicode[STIX]{x1D648}_{k}$
.
$\unicode[STIX]{x1D648}_{k}$
.
A finite system of equations was then obtained by truncating the Fourier series (2.9) for
 ${\it\psi}$
and setting
${\it\psi}$
and setting
 ${\it\psi}_{n}=0$
for all
${\it\psi}_{n}=0$
for all
 $n>N_{x}>0$
and all
$n>N_{x}>0$
and all
 $n<N_{n}<0$
, where
$n<N_{n}<0$
, where
 $N_{n}$
and
$N_{n}$
and
 $N_{x}$
were chosen to ensure that
$N_{x}$
were chosen to ensure that
 $$\begin{eqnarray}\frac{\displaystyle \max \Big\{\max _{y}|{\it\psi}_{N_{n}}(y)|,\max _{y}|{\it\psi}_{N_{x}}(y)|\Big\}}{\displaystyle \max _{n,y}|{\it\psi}_{n}(y)|}<10^{-16}.\end{eqnarray}$$
For flows where the eigenvalues
 ${\it\mu}$
occurred in complex conjugate pairs it was possible to use a symmetric truncation and set
${\it\mu}$
occurred in complex conjugate pairs it was possible to use a symmetric truncation and set
 $-N_{n}=N_{x}=N$
and take
$-N_{n}=N_{x}=N$
and take
 $N$
to be around
$N$
to be around
 $0.8aR$
. The system of equation (2.12) was then written as the algebraic eigenvalue problem
$0.8aR$
. The system of equation (2.12) was then written as the algebraic eigenvalue problem
 $$\begin{eqnarray}\unicode[STIX]{x1D63C}{\bf\phi}={\it\mu}{\bf\phi},\end{eqnarray}$$
for a sparse matrix
 $\unicode[STIX]{x1D63C}$
and vector
$\unicode[STIX]{x1D63C}$
and vector
 ${\bf\phi}$
given as
${\bf\phi}$
given as
 $$\begin{eqnarray}{\bf\phi}^{\text{T}}=({\bf\psi}_{N_{x}}^{\text{T}}{\bf\psi}_{N_{x}-1}^{\text{T}}\dots {\bf\psi}_{0}^{\text{T}}\dots {\bf\psi}_{N_{n}}^{\text{T}}).\end{eqnarray}$$
Eigenvalues
 ${\it\mu}$
and eigenvectors
${\it\mu}$
and eigenvectors
 ${\bf\phi}$
were carefully calculated using the eigensolver routine eigs in Matlab, where it was deemed necessary to use upwards of 60 points across the half-channel in the
${\bf\phi}$
were carefully calculated using the eigensolver routine eigs in Matlab, where it was deemed necessary to use upwards of 60 points across the half-channel in the
 $y$
-direction to ensure that neutral conditions were accurately determined.
$y$
-direction to ensure that neutral conditions were accurately determined.
Here we point out that setting
 ${\it\alpha}_{p}={\it\beta}_{p}=0$
gives the method originally used in BB06. When needed, a rescaling of the
${\it\alpha}_{p}={\it\beta}_{p}=0$
gives the method originally used in BB06. When needed, a rescaling of the
 ${\bf\psi}_{n}$
, as described in BB06 equation (2.11), was carried out to enable the calculation of eigenfunction components as small as
${\bf\psi}_{n}$
, as described in BB06 equation (2.11), was carried out to enable the calculation of eigenfunction components as small as
 $O(10^{-30})$
. This transformation was only needed when dealing with essentially monotonic basic flows; once high-frequency noise components were large enough the decay of the Fourier coefficients
$O(10^{-30})$
. This transformation was only needed when dealing with essentially monotonic basic flows; once high-frequency noise components were large enough the decay of the Fourier coefficients
 ${\it\psi}_{n}$
was slower and numerical noise was not present in the results from the Matlab routines. We also mention here that the code developed was checked by verifying that the eigenvalues obtained when the wall velocity was given by
${\it\psi}_{n}$
was slower and numerical noise was not present in the results from the Matlab routines. We also mention here that the code developed was checked by verifying that the eigenvalues obtained when the wall velocity was given by
 $\cos (k{\it\tau})$
or
$\cos (k{\it\tau})$
or
 $\sin (k{\it\tau})$
satisfied
$\sin (k{\it\tau})$
satisfied
 $$\begin{eqnarray}{\it\mu}_{k}={\it\mu}_{1}/k\quad \text{for }R_{k}=708\sqrt{k}\text{ and }a=0.375\sqrt{k}\end{eqnarray}$$
in the cases of
 $k=1,2$
and 3. The channel half width,
$k=1,2$
and 3. The channel half width,
 $h$
, was decreased by a factor of
$h$
, was decreased by a factor of
 $\sqrt{k}$
and the number of harmonics retained in the solution was increased linearly with
$\sqrt{k}$
and the number of harmonics retained in the solution was increased linearly with
 $k$
, while
$k$
, while
 ${\it\mu}_{1}$
denotes the eigenvalue obtained with wall velocity of
${\it\mu}_{1}$
denotes the eigenvalue obtained with wall velocity of
 $\cos {\it\tau}$
at the indicated Reynolds and wave number. In all cases, the eigenvalue for the Stokes mode and the most unstable centre mode agreed to at least nine significant figures. The
$\cos {\it\tau}$
at the indicated Reynolds and wave number. In all cases, the eigenvalue for the Stokes mode and the most unstable centre mode agreed to at least nine significant figures. The
 $k$
-dependence of the above transformations follow directly from a rescaling of the basic flow when the wall frequency is changed from
$k$
-dependence of the above transformations follow directly from a rescaling of the basic flow when the wall frequency is changed from
 ${\it\omega}$
to
${\it\omega}$
to
 $k{\it\omega}$
.
$k{\it\omega}$
.
2.2. Linear stability via DNS
Two-dimensional DNS was employed to verify the results of the Floquet analysis in the case where the channel half width was
 $h=16$
. Here the velocity profile appropriate to a semi-infinite fluid bounded by an oscillating plane was used and so the velocity profile (2.2a
) is replaced by
$h=16$
. Here the velocity profile appropriate to a semi-infinite fluid bounded by an oscillating plane was used and so the velocity profile (2.2a
) is replaced by
 $$\begin{eqnarray}\displaystyle & \displaystyle u=U_{B}(y,{\it\tau};p)=\mathit{Re}\{\text{e}^{-(1+\text{i})y}\text{e}^{\text{i}{\it\tau}}+{\it\delta}({\it\alpha}_{p}-\text{i}{\it\beta}_{p})\text{e}^{-(1+\text{i})y\sqrt{p}}\text{e}^{\text{i}p{\it\tau}}\}, & \displaystyle\end{eqnarray}$$
 $$\begin{eqnarray}\displaystyle & v=0, & \displaystyle\end{eqnarray}$$
 $0\leqslant y<\infty$
. The velocity–vorticity formulation described by Davies & Carpenter (Reference Davies and Carpenter2001) was employed where the velocity and vorticity fields are given as
$0\leqslant y<\infty$
. The velocity–vorticity formulation described by Davies & Carpenter (Reference Davies and Carpenter2001) was employed where the velocity and vorticity fields are given as  $$\begin{eqnarray}(u,v)=(U_{B},0)+([u_{x}\text{e}^{\text{i}ax}+\text{c.c.}],[u_{y}\text{e}^{\text{i}ax}+\text{c.c.}]),\quad {\it\Omega}=U_{B}^{\prime }+[{\it\zeta}\text{e}^{\text{i}ax}+\text{c.c.}],\end{eqnarray}$$
where
 $U_{B}$
is the base flow (2.17),
$U_{B}$
is the base flow (2.17),
 $u_{x}$
,
$u_{x}$
,
 $u_{y}$
the
$u_{y}$
the
 $y$
-structure of the streamwise and wall-normal velocity perturbations,
$y$
-structure of the streamwise and wall-normal velocity perturbations,
 ${\it\zeta}$
the
${\it\zeta}$
the
 $y$
-structure of the associated vorticity perturbation and c.c. denotes complex conjugate. The governing equations are represented by the vorticity transport and Poisson equations
$y$
-structure of the associated vorticity perturbation and c.c. denotes complex conjugate. The governing equations are represented by the vorticity transport and Poisson equations
 $$\begin{eqnarray}\displaystyle & \displaystyle \frac{1}{R}\frac{\partial {\it\zeta}}{\partial {\it\tau}}+\text{i}aU_{B}{\it\zeta}+U_{B}^{\prime \prime }u_{y}=\frac{1}{2R}\mathscr{L}{\it\zeta}, & \displaystyle\end{eqnarray}$$
 $$\begin{eqnarray}\displaystyle & \mathscr{L}u_{y}=-\text{i}a{\it\zeta}, & \displaystyle\end{eqnarray}$$
 $$\begin{eqnarray}u_{x}=-\int _{y}^{\infty }({\it\zeta}+\text{i}au_{y})\text{d}y.\end{eqnarray}$$
Here the vorticity is defined by
 $$\begin{eqnarray}{\it\Omega}=\frac{\partial u}{\partial y}-\frac{\partial v}{\partial x},\end{eqnarray}$$
whilst the operator
 $\mathscr{L}$
is as originally defined in (2.6).
$\mathscr{L}$
is as originally defined in (2.6).
No-slip conditions are given as
 $$\begin{eqnarray}\displaystyle & u_{x}=-U_{B}^{\prime }(0,{\it\tau}){\it\eta}, & \displaystyle\end{eqnarray}$$
 $$\begin{eqnarray}\displaystyle & \displaystyle u_{y}=\frac{\partial {\it\eta}}{\partial {\it\tau}}, & \displaystyle\end{eqnarray}$$
 $$\begin{eqnarray}{\it\eta}({\it\tau})=(1-\exp \{-{\it\sigma}{\it\tau}^{2}\})\exp \{-{\it\sigma}{\it\tau}^{2}\}.\end{eqnarray}$$
Here
 ${\it\eta}({\it\tau})$
is a non-dimensional impulse used to initiate a disturbance in the basic state (2.17). The parameter
${\it\eta}({\it\tau})$
is a non-dimensional impulse used to initiate a disturbance in the basic state (2.17). The parameter
 ${\it\sigma}$
fixes the duration of the impulse, so that initially many modes of disturbance are excited. Eventually
${\it\sigma}$
fixes the duration of the impulse, so that initially many modes of disturbance are excited. Eventually
 ${\it\eta}\rightarrow 0$
and only the least-damped perturbation modes are left to evolve unhindered. The substitution of (2.22a
) into the definition (2.20) gives an integral constraint for the vorticity perturbation of the form
${\it\eta}\rightarrow 0$
and only the least-damped perturbation modes are left to evolve unhindered. The substitution of (2.22a
) into the definition (2.20) gives an integral constraint for the vorticity perturbation of the form
 $$\begin{eqnarray}\int _{0}^{\infty }{\it\zeta}\text{d}y=U_{B}^{\prime }(0,{\it\tau}){\it\eta}-\int _{0}^{\infty }\text{i}au_{y}\text{d}y,\end{eqnarray}$$
which replaces the usual no-slip condition (2.22a
). Equation (2.22b
) acts as a second constraint on the perturbation variables, whilst suitable conditions far from the plate were imposed by ensuring perturbations tended towards zero as
 $y\rightarrow \infty$
.
$y\rightarrow \infty$
.
Chebyshev spectral methods were employed to discretise the perturbation variables in the wall-normal direction, where a mapping was used to pass values from the semi-infinite physical domain onto a finite computational interval. The velocity–vorticity equations (2.19) were then integrated twice with respect to the mapped computational variable and a semi-implicit scheme was used for the time-marching procedure. The methods adopted for discretisation of the governing equations are discussed in greater detail in Davies & Carpenter (Reference Davies and Carpenter2001), while a more recent review is presented by Thomas et al. (Reference Thomas, Bassom, Blennerhassett and Davies2010).
3. Infinitesimal modulation of the basic Stokes layer flow
The computations presented here concern the family of basic flows of the form (2.2d
), namely
 $U_{B}=U_{B,1}+{\it\delta}U_{p}$
, in the limit
$U_{B}=U_{B,1}+{\it\delta}U_{p}$
, in the limit
 ${\it\delta}\rightarrow 0^{+}$
. In other words the classic basic Stokes layer flow is supplemented by the inclusion of a single higher harmonic which for the moment is supposed to be of an infinitesimal amplitude. This
${\it\delta}\rightarrow 0^{+}$
. In other words the classic basic Stokes layer flow is supplemented by the inclusion of a single higher harmonic which for the moment is supposed to be of an infinitesimal amplitude. This
 $O({\it\delta})$
change to the basic flow suggests that the eigenfunction
$O({\it\delta})$
change to the basic flow suggests that the eigenfunction
 ${\it\psi}$
and Floquet exponent
${\it\psi}$
and Floquet exponent
 ${\it\mu}$
undergo comparable changes from their classical forms. Therefore,
${\it\mu}$
undergo comparable changes from their classical forms. Therefore,
 ${\it\psi}$
and
${\it\psi}$
and
 ${\it\mu}$
are expanded in powers of
${\it\mu}$
are expanded in powers of
 ${\it\delta}$
according to
${\it\delta}$
according to
 $$\begin{eqnarray}\displaystyle & \displaystyle {\it\psi}(y,{\it\tau})={\it\psi}^{(0)}+{\it\delta}{\it\psi}^{(1,p)}+\cdots & \displaystyle\end{eqnarray}$$
 $$\begin{eqnarray}\displaystyle & \displaystyle {\it\mu}={\it\mu}^{(0)}+{\it\delta}{\it\mu}^{(1,p)}+\cdots \,. & \displaystyle\end{eqnarray}$$
 ${\it\psi}^{(0)}$
in (3.1a
) and the Floquet exponent
${\it\psi}^{(0)}$
in (3.1a
) and the Floquet exponent
 ${\it\mu}^{(0)}$
in (3.1b
) corresponding to the basic monotonic flow
${\it\mu}^{(0)}$
in (3.1b
) corresponding to the basic monotonic flow
 $U_{B,1}$
have been previously determined by BB06.
$U_{B,1}$
have been previously determined by BB06.
The quantities
 ${\it\mu}^{(1,p)}$
appearing in the expansion (3.1b
) will be referred to as the eigenvalue ‘sensitivity coefficients’ as they represent the extent to which the primary eigenvalue
${\it\mu}^{(1,p)}$
appearing in the expansion (3.1b
) will be referred to as the eigenvalue ‘sensitivity coefficients’ as they represent the extent to which the primary eigenvalue
 ${\it\mu}^{(0)}$
is altered by the presence of the
${\it\mu}^{(0)}$
is altered by the presence of the
 $O({\it\delta})$
change away from a single-frequency basic flow. Subsequently these
$O({\it\delta})$
change away from a single-frequency basic flow. Subsequently these
 ${\it\mu}^{(1,p)}$
can be further partitioned into coefficients derived from either
${\it\mu}^{(1,p)}$
can be further partitioned into coefficients derived from either
 $\cos (\,p{\it\tau})$
or
$\cos (\,p{\it\tau})$
or
 $\sin (\,p{\it\tau})$
perturbations to the monotonic flow.
$\sin (\,p{\it\tau})$
perturbations to the monotonic flow.
The substitution of expansions (3.1) into the linear stability problem (2.8a,b ) results in the system
 $$\begin{eqnarray}\displaystyle & \displaystyle \mathscr{K}(U_{B,1},{\it\mu}^{(0)}){\it\psi}^{(0)}=0, & \displaystyle\end{eqnarray}$$
 $$\begin{eqnarray}\displaystyle & \displaystyle \mathscr{K}(U_{B,1},{\it\mu}^{(0)}){\it\psi}^{(1,p)}=-\{{\it\mu}^{(1,p)}+\text{i}aRU_{p}\}\mathscr{L}{\it\psi}^{(0)}+\text{i}aRU_{p}^{\prime \prime }{\it\psi}^{(0)}, & \displaystyle\end{eqnarray}$$
 $$\begin{eqnarray}{\it\psi}^{(0)}={\it\psi}_{y}^{(0)}=0\quad \text{on }y=\pm h\end{eqnarray}$$
and
 $$\begin{eqnarray}{\it\psi}^{(1,p)}={\it\psi}_{y}^{(1,p)}=0\quad \text{on }y=\pm h.\end{eqnarray}$$
The problem defined by (3.2a ) and boundary conditions (3.3a ) is precisely the eigenvalue problem solved in BB06. The fact that this homogeneous system has a non-trivial solution means that the non-homogeneous problem comprising equation (3.2b ) and boundary conditions (3.3b ) can only have a solution provided the forcing terms in (3.2b ) are orthogonal to the null space of the problem adjoint to (3.2a ) with (3.3a ).
If the operator adjoint to
 $\mathscr{K}(U_{B,1},{\it\mu}^{(0)})$
is denoted by
$\mathscr{K}(U_{B,1},{\it\mu}^{(0)})$
is denoted by
 $\mathscr{K}^{\dagger }(U_{B,1},{\it\mu}^{(0)})$
and
$\mathscr{K}^{\dagger }(U_{B,1},{\it\mu}^{(0)})$
and
 $f$
and
$f$
and
 $g$
are
$g$
are
 $2{\rm\pi}$
-periodic functions of
$2{\rm\pi}$
-periodic functions of
 ${\it\tau}$
with
${\it\tau}$
with
 $g$
satisfying boundary conditions (3.3a
), then the adjoint boundary conditions and adjoint operator are defined by imposing the condition
$g$
satisfying boundary conditions (3.3a
), then the adjoint boundary conditions and adjoint operator are defined by imposing the condition
 $$\begin{eqnarray}\int _{0}^{2{\rm\pi}}\int _{-h}^{h}f\mathscr{K}(U_{B,1},{\it\mu}^{(0)})g\text{d}y\text{d}{\it\tau}=\int _{0}^{2{\rm\pi}}\int _{-h}^{h}g\mathscr{K}^{\dagger }(U_{B,1},{\it\mu}^{(0)})f\text{d}y\text{d}{\it\tau}.\end{eqnarray}$$
The consequent eigenproblem defines the function
 ${\it\psi}^{\dagger }$
which is the adjoint to
${\it\psi}^{\dagger }$
which is the adjoint to
 ${\it\psi}^{(0)}$
and is given by the solution of
${\it\psi}^{(0)}$
and is given by the solution of
 $$\begin{eqnarray}\mathscr{K}^{\dagger }(U_{B,1},{\it\mu}^{(0)}){\it\psi}^{\dagger }=-\frac{\partial }{\partial {\it\tau}}\mathscr{L}{\it\psi}^{\dagger }-\left\{\frac{1}{2}\mathscr{L}-{\it\mu}^{(0)}-\text{i}aRU_{B,1}\right\}\mathscr{L}{\it\psi}^{\dagger }+2\text{i}aRU_{B,1}^{\prime }{\it\psi}_{y}^{\dagger }=0\end{eqnarray}$$
with boundary conditions
 $$\begin{eqnarray}{\it\psi}^{\dagger }={\it\psi}_{y}^{\dagger }=0\quad \text{on }y=\pm h.\end{eqnarray}$$
With these definitions, equation (3.2b
) subject to the boundary conditions (3.3b
) has a solution if and only if
 ${\it\mu}^{(1,p)}$
is given by
${\it\mu}^{(1,p)}$
is given by
 $$\begin{eqnarray}{\it\mu}^{(1,p)}=\text{i}aR\frac{\displaystyle \int _{0}^{2{\rm\pi}}\int _{-h}^{h}{\it\psi}^{\dagger }(U_{p}^{\prime \prime }{\it\psi}^{(0)}-U_{p}\mathscr{L}{\it\psi}^{(0)})\text{d}y\text{d}{\it\tau}}{\displaystyle \int _{0}^{2{\rm\pi}}\int _{-h}^{h}{\it\psi}^{\dagger }\mathscr{L}{\it\psi}^{(0)}\text{d}y\text{d}{\it\tau}}.\end{eqnarray}$$
By explicitly writing
 $U_{p}$
in terms of
$U_{p}$
in terms of
 ${\it\alpha}_{p}$
and
${\it\alpha}_{p}$
and
 ${\it\beta}_{p}$
the expressions for the sensitivity of
${\it\beta}_{p}$
the expressions for the sensitivity of
 ${\it\mu}^{(0)}$
to either
${\it\mu}^{(0)}$
to either
 $\cos (\,p{\it\omega}t)$
or
$\cos (\,p{\it\omega}t)$
or
 $\sin (\,p{\it\omega}t)$
changes to the basic wall velocity can be obtained, leading to the further decomposition
$\sin (\,p{\it\omega}t)$
changes to the basic wall velocity can be obtained, leading to the further decomposition
 $$\begin{eqnarray}{\it\mu}^{(1,p)}={\it\alpha}_{p}{\it\mu}_{c}^{(1,p)}+{\it\beta}_{p}{\it\mu}_{s}^{(1,p)}.\end{eqnarray}$$
The precise expressions for
 ${\it\mu}_{c}^{(1,p)}$
and
${\it\mu}_{c}^{(1,p)}$
and
 ${\it\mu}_{s}^{(1,p)}$
are rather cumbersome and are thus omitted, but we shall have need to refer to these coefficients later.
${\it\mu}_{s}^{(1,p)}$
are rather cumbersome and are thus omitted, but we shall have need to refer to these coefficients later.
The value of
 ${\it\mu}^{(1,p)}$
clearly requires the determination of the eigenfunction
${\it\mu}^{(1,p)}$
clearly requires the determination of the eigenfunction
 ${\it\psi}^{(0)}$
and the adjoint function
${\it\psi}^{(0)}$
and the adjoint function
 ${\it\psi}^{\dagger }$
as well as the evaluation of the double integrals in (3.6). The eigenfunction
${\it\psi}^{\dagger }$
as well as the evaluation of the double integrals in (3.6). The eigenfunction
 ${\it\psi}^{(0)}$
and its adjoint
${\it\psi}^{(0)}$
and its adjoint
 ${\it\psi}^{\dagger }$
were found by expanding these
${\it\psi}^{\dagger }$
were found by expanding these
 $2{\rm\pi}$
-periodic functions as Fourier series
$2{\rm\pi}$
-periodic functions as Fourier series
 $$\begin{eqnarray}{\it\psi}^{(0)}(y,{\it\tau})=\mathop{\sum }_{n=-\infty }^{n=\infty }{\it\psi}_{n}^{(0)}(y)\exp (\text{i}n{\it\tau})\quad \text{and}\quad {\it\psi}^{\dagger }(y,{\it\tau})=\mathop{\sum }_{n=-\infty }^{n=\infty }{\it\psi}_{n}^{\dagger }(y)\exp (\text{i}n{\it\tau}),\end{eqnarray}$$
and then applying the algorithm specified by (2.11)–(2.15). To obtain
 ${\it\psi}^{(0)}$
the
${\it\psi}^{(0)}$
the
 ${\it\psi}_{n}$
in (2.11)–(2.15) were replaced by the Fourier coefficients
${\it\psi}_{n}$
in (2.11)–(2.15) were replaced by the Fourier coefficients
 ${\it\psi}_{n}^{(0)}$
. Similarly, with the Fourier coefficients
${\it\psi}_{n}^{(0)}$
. Similarly, with the Fourier coefficients
 ${\it\psi}_{n}^{\dagger }$
of the adjoint function
${\it\psi}_{n}^{\dagger }$
of the adjoint function
 ${\it\psi}^{\dagger }$
, replacing
${\it\psi}^{\dagger }$
, replacing
 ${\it\psi}_{n}$
in the algorithm (2.11)–(2.15) and with the matrix
${\it\psi}_{n}$
in the algorithm (2.11)–(2.15) and with the matrix
 $\unicode[STIX]{x1D648}_{k}$
in (2.11b
) replaced by
$\unicode[STIX]{x1D648}_{k}$
in (2.11b
) replaced by
 $$\begin{eqnarray}\unicode[STIX]{x1D648}_{k}=\boldsymbol{L}^{-1}({\it\alpha}_{k}-\text{i}{\it\beta}_{k})(u_{k}\boldsymbol{L}+2u_{k}^{\prime }\unicode[STIX]{x1D63F}),\end{eqnarray}$$
a solution for
 ${\it\psi}^{\dagger }$
was obtained. In (3.9),
${\it\psi}^{\dagger }$
was obtained. In (3.9),
 $\unicode[STIX]{x1D63F}$
denotes the pseudo-spectral matrix representing the operator
$\unicode[STIX]{x1D63F}$
denotes the pseudo-spectral matrix representing the operator
 $\partial /\partial y$
.
$\partial /\partial y$
.
The time integrals in (3.6) could be performed exactly by exploiting the fact that a Fourier series in time was available for each term appearing in the definition of
 ${\it\mu}^{(1,p)}$
. All that was needed was the time integration of the constant terms resulting from the product of two or three Fourier series. For a few cases these time integrations were checked by using a fast Fourier transform to explicitly determine the numerator and denominator evaluated on a uniform grid in time and then using the trapezoidal rule to perform the integrations. Very good agreement between the two methods was obtained in all cases.
${\it\mu}^{(1,p)}$
. All that was needed was the time integration of the constant terms resulting from the product of two or three Fourier series. For a few cases these time integrations were checked by using a fast Fourier transform to explicitly determine the numerator and denominator evaluated on a uniform grid in time and then using the trapezoidal rule to perform the integrations. Very good agreement between the two methods was obtained in all cases.
The spatial integrations needed in (3.6) were also tackled by two different techniques. A Clenshaw–Curtis method (http://people.maths.ox.ac.uk/trefethen/clencurt.m ) was used in all of the results presented. As a check, the output of this integration routine was monitored by comparing with results produced by a trapezoidal rule applied after the Chebyshev spatial grid was converted into a uniformly spaced mesh. The agreement between the two approaches was consistent in all cases. Further independent checks on selected values of
 ${\it\mu}^{(1,p)}$
are mentioned in § 4 below.
${\it\mu}^{(1,p)}$
are mentioned in § 4 below.
3.1. Results of the sensitivity calculations
Theoretical results for the linear stability of the classical Stokes layer and for Stokes layers in channels have been described by BB02 and BB06. For the semi-infinite Stokes layer a critical Reynolds number of approximately 700 was found while, for the channel, the critical Reynolds number can be reduced to approximately 650 on taking
 $h=5$
. Various experimental results suggest a critical Reynolds number of around 275 for the Reynolds number definition used here (Jensen, Sumer & Fredsøe Reference Jensen, Sumer and Fredsøe1989; Akhavan et al.
Reference Akhavan, Kamm and Shapiro1991; Eckmann & Grotberg Reference Eckmann and Grotberg1991; Grotberg Reference Grotberg1994; Lodahl, Sumer & Fredsøe Reference Lodahl, Sumer and Fredsøe1998). With this data as a guide some of the sensitivity coefficients calculated near these salient conditions were computed together with information on the Fourier structure of
$h=5$
. Various experimental results suggest a critical Reynolds number of around 275 for the Reynolds number definition used here (Jensen, Sumer & Fredsøe Reference Jensen, Sumer and Fredsøe1989; Akhavan et al.
Reference Akhavan, Kamm and Shapiro1991; Eckmann & Grotberg Reference Eckmann and Grotberg1991; Grotberg Reference Grotberg1994; Lodahl, Sumer & Fredsøe Reference Lodahl, Sumer and Fredsøe1998). With this data as a guide some of the sensitivity coefficients calculated near these salient conditions were computed together with information on the Fourier structure of
 ${\it\psi}^{(0)}$
and its adjoint
${\it\psi}^{(0)}$
and its adjoint
 ${\it\psi}^{\dagger }$
.
${\it\psi}^{\dagger }$
.

Figure 1. Structure of the disturbance eigenfunctions for a wide channel
 $h=16$
with
$h=16$
with
 $R=300$
and
$R=300$
and
 $a=0.38$
. Shown are the maximum values of
$a=0.38$
. Shown are the maximum values of
 $|{\it\psi}_{n}^{(0)}(y)|$
and the corresponding adjoint
$|{\it\psi}_{n}^{(0)}(y)|$
and the corresponding adjoint
 $|{\it\psi}_{n}^{\dagger }(y)|$
as functions of
$|{\it\psi}_{n}^{\dagger }(y)|$
as functions of
 $n$
via the line types: ——, Stokes mode eigenfunction; - - - -, centre mode eigenfunction; — ⋅ —, Stokes mode adjoint function; and - - - - - -, centre mode adjoint function. Here the Stokes mode has
$n$
via the line types: ——, Stokes mode eigenfunction; - - - -, centre mode eigenfunction; — ⋅ —, Stokes mode adjoint function; and - - - - - -, centre mode adjoint function. Here the Stokes mode has
 ${\it\mu}^{(0)}=-1.7930+0.3997\text{i}$
; for the centre mode
${\it\mu}^{(0)}=-1.7930+0.3997\text{i}$
; for the centre mode
 ${\it\mu}^{(0)}=-0.0885$
. The two lines plotted only for
${\it\mu}^{(0)}=-0.0885$
. The two lines plotted only for
 $p\geqslant 0$
denote the cosine sensitivity coefficients
$p\geqslant 0$
denote the cosine sensitivity coefficients
 ${\it\mu}_{c}^{(1,p)}$
for the Stokes mode (upper – – – line) and the centre mode (lower
${\it\mu}_{c}^{(1,p)}$
for the Stokes mode (upper – – – line) and the centre mode (lower
 $\cdots \cdots$
).
$\cdots \cdots$
).
Two sets of results are described here: the Reynolds number is fixed at
 $R=300$
but we examine results for both a relatively narrow channel with
$R=300$
but we examine results for both a relatively narrow channel with
 $h=5$
and for a much wider configuration with
$h=5$
and for a much wider configuration with
 $h=16$
. In the first case the wavenumber was taken to be
$h=16$
. In the first case the wavenumber was taken to be
 $a=0.41$
whilst in the latter
$a=0.41$
whilst in the latter
 $a=0.38$
. These choices were motivated by the fact that the selected values are very close to the critical wave numbers for the respective channel widths.
$a=0.38$
. These choices were motivated by the fact that the selected values are very close to the critical wave numbers for the respective channel widths.
Before describing our solutions it should be emphasised that the calculations summarised in BB06 identified essentially two types of disturbance mode within the oscillatory flow in a channel. One, which we shall loosely refer to as a Stokes mode, is concentrated in the oscillatory layers located on the walls. By way of contrast there is also the possibility of disturbances that appear largest in the middle of the channel: these are the centre modes. Of course centre modes cannot exist in a semi-infinite Stokes layer and their absence leads to the Reynolds number dependence of the Floquet exponents first found by Hall (Reference Hall1978) and confirmed in BB02. The findings of BB06 suggest that centre modes are always stable whatever the value of
 $R$
and become progressively more so as
$R$
and become progressively more so as
 $R$
grows. On the other hand, at comparatively small
$R$
grows. On the other hand, at comparatively small
 $R$
the Stokes mode is much more strongly damped but is the structure that eventually becomes unstable when
$R$
the Stokes mode is much more strongly damped but is the structure that eventually becomes unstable when
 $R$
is sufficiently large.
$R$
is sufficiently large.
Figures 1 and 2 illustrate the behaviours of
 $\max _{y}\!|{\it\psi}_{n}^{(0)}(y)|$
and
$\max _{y}\!|{\it\psi}_{n}^{(0)}(y)|$
and
 $\max _{y}\!|{\it\psi}_{n}^{\dagger }(y)|$
for the calculations with
$\max _{y}\!|{\it\psi}_{n}^{\dagger }(y)|$
for the calculations with
 $h=16$
and
$h=16$
and
 $h=5$
, respectively. In both cases the forms of
$h=5$
, respectively. In both cases the forms of
 $\max _{y}\!|{\it\psi}_{n}^{(0)}(y)|$
take on a fairly characteristic ‘
$\max _{y}\!|{\it\psi}_{n}^{(0)}(y)|$
take on a fairly characteristic ‘
 $\wedge$
’ shaped curve supported on the frequency range
$\wedge$
’ shaped curve supported on the frequency range
 $-100\leqslant n\leqslant 100$
; these shapes were first described in BB02. It should be noted that whenever the Floquet exponent is purely real, then the above Fourier representation of the eigenfunction is symmetric about the zero frequency axis. We remark also that in figure 1 it is the centre mode that is the more weakly damped whilst the opposite is the case for the narrower channel in figure 2. More details on the spatial structure of the largest Fourier components for both the Stokes and centre modes in a wide channel are given in BB06, while the spatiotemporal evolution of neutrally stable disturbances in the semi-infinite Stokes layer are presented in BB02.
$-100\leqslant n\leqslant 100$
; these shapes were first described in BB02. It should be noted that whenever the Floquet exponent is purely real, then the above Fourier representation of the eigenfunction is symmetric about the zero frequency axis. We remark also that in figure 1 it is the centre mode that is the more weakly damped whilst the opposite is the case for the narrower channel in figure 2. More details on the spatial structure of the largest Fourier components for both the Stokes and centre modes in a wide channel are given in BB06, while the spatiotemporal evolution of neutrally stable disturbances in the semi-infinite Stokes layer are presented in BB02.

Figure 2. Structure of the disturbance eigenfunctions for a narrow channel
 $h=5$
with
$h=5$
with
 $R=300$
and
$R=300$
and
 $a=0.41$
. For this case the Stokes mode has
$a=0.41$
. For this case the Stokes mode has
 ${\it\mu}^{(0)}=-1.5770+0.4260\text{i}$
and the centre mode
${\it\mu}^{(0)}=-1.5770+0.4260\text{i}$
and the centre mode
 ${\it\mu}^{(0)}=-2.8423$
. Line types as in figure 1 but here the sensitivity coefficients for the two modes are fairly similar and therefore almost indistinguishable.
${\it\mu}^{(0)}=-2.8423$
. Line types as in figure 1 but here the sensitivity coefficients for the two modes are fairly similar and therefore almost indistinguishable.
The Fourier structure of the adjoint functions
 ${\it\psi}^{\dagger }$
is strikingly different to that of the eigenmodes, taking on an approximate ‘M’ shape. We note that a wider frequency range is needed to capture the adjoint function accurately but, more importantly, the adjoint function has its largest Fourier coefficients around the frequency where the eigenfunction coefficients begin their rapid exponential decay. The combination of these structures via the integrals defining the sensitivity coefficients in (3.6) leads to the frequency dependence of
${\it\psi}^{\dagger }$
is strikingly different to that of the eigenmodes, taking on an approximate ‘M’ shape. We note that a wider frequency range is needed to capture the adjoint function accurately but, more importantly, the adjoint function has its largest Fourier coefficients around the frequency where the eigenfunction coefficients begin their rapid exponential decay. The combination of these structures via the integrals defining the sensitivity coefficients in (3.6) leads to the frequency dependence of
 $|{\it\mu}_{c}^{(1,p)}|$
as a function of
$|{\it\mu}_{c}^{(1,p)}|$
as a function of
 $p$
shown in these two figures.
$p$
shown in these two figures.
The main feature of the sensitivity coefficients seen in these graphs is that they have a marked peak value close to the frequency of the maximum-amplitude harmonic in the Fourier series for the adjoint function. We also note that when the Stokes mode is more stable than the centre mode, the sensitivity coefficients for the Stokes mode are two to three orders of magnitude greater than those of the centre mode. Although not shown, the size of the sine sensitivity coefficients,
 $|{\it\mu}_{s}^{(1,p)}|$
, follow a similar pattern to those shown and would be essentially indistinguishable from the cosine sensitivity coefficients
$|{\it\mu}_{s}^{(1,p)}|$
, follow a similar pattern to those shown and would be essentially indistinguishable from the cosine sensitivity coefficients
 $|{\it\mu}_{c}^{(1,p)}|$
in these figures. It should be noted that all of the sensitivity coefficients are complex in general, with a seemingly random sign pattern. However, what is of most significance is the large magnitude of these coefficients and the frequency where the maximums occur. We also mention in passing that the maximum magnitude of the
$|{\it\mu}_{c}^{(1,p)}|$
in these figures. It should be noted that all of the sensitivity coefficients are complex in general, with a seemingly random sign pattern. However, what is of most significance is the large magnitude of these coefficients and the frequency where the maximums occur. We also mention in passing that the maximum magnitude of the
 ${\it\mu}^{(1,p)}$
increases with Reynolds number, with
${\it\mu}^{(1,p)}$
increases with Reynolds number, with
 $|{\it\mu}_{c}^{(1,p)}|\sim O(10^{8})$
when
$|{\it\mu}_{c}^{(1,p)}|\sim O(10^{8})$
when
 $R\sim 700$
, again with the largest sensitivity coefficients around the maximum Fourier coefficients in the adjoint function. Subsequently we demonstrate that finite, but small, perturbations with frequencies close to these maximums have a dramatic effect on the stability of the monotonic flow driven by
$R\sim 700$
, again with the largest sensitivity coefficients around the maximum Fourier coefficients in the adjoint function. Subsequently we demonstrate that finite, but small, perturbations with frequencies close to these maximums have a dramatic effect on the stability of the monotonic flow driven by
 $\cos {\it\omega}t$
.
$\cos {\it\omega}t$
.
It is well known that the Orr–Sommerfeld operator for steady flows is non-normal (Trefethen et al.
Reference Trefethen, Trefethen, Reddy and Driscoll1993), so it is natural to assume that the time-dependent Orr–Sommerfeld operator
 ${\mathcal{K}}(U_{B,1},{\it\mu}^{(0)})$
studied here would also be non-normal. Indeed, the review by Schmid (Reference Schmid2007) presents an analysis of the behaviour of ultimately decaying transients in oscillatory channel flow exploiting ideas from the theory of non-normal operators (Trefethen Reference Trefethen1997). Thus, it would be tempting to rationalise the large eigenvalue sensitivity coefficients seen in figures 1 and 2 in terms of the non-normality of
${\mathcal{K}}(U_{B,1},{\it\mu}^{(0)})$
studied here would also be non-normal. Indeed, the review by Schmid (Reference Schmid2007) presents an analysis of the behaviour of ultimately decaying transients in oscillatory channel flow exploiting ideas from the theory of non-normal operators (Trefethen Reference Trefethen1997). Thus, it would be tempting to rationalise the large eigenvalue sensitivity coefficients seen in figures 1 and 2 in terms of the non-normality of
 ${\mathcal{K}}(U_{B,1},{\it\mu}^{(0)})$
. A standard explanation for a large change in the eigenvalue of a perturbed operator is provided in terms of a small value for the projection of the unperturbed eigenfunction onto its adjoint, as described by equation (6) in the review by Chomaz (Reference Chomaz2005). For the problem considered here this general principle translates to the statement that the denominator in the expression for
${\mathcal{K}}(U_{B,1},{\it\mu}^{(0)})$
. A standard explanation for a large change in the eigenvalue of a perturbed operator is provided in terms of a small value for the projection of the unperturbed eigenfunction onto its adjoint, as described by equation (6) in the review by Chomaz (Reference Chomaz2005). For the problem considered here this general principle translates to the statement that the denominator in the expression for
 ${\it\mu}^{(1,p)}$
in (3.6) is small in some sense. However, as the denominator in (3.6) is independent of the perturbation frequency
${\it\mu}^{(1,p)}$
in (3.6) is small in some sense. However, as the denominator in (3.6) is independent of the perturbation frequency
 $p$
it cannot explain the large range of values exhibited by
$p$
it cannot explain the large range of values exhibited by
 ${\it\mu}^{(1,p)}$
as
${\it\mu}^{(1,p)}$
as
 $p$
varies. Rather, the features displayed by
$p$
varies. Rather, the features displayed by
 ${\it\mu}^{(1,p)}$
must be due to the structure of the adjoint function
${\it\mu}^{(1,p)}$
must be due to the structure of the adjoint function
 ${\it\psi}^{\dagger }$
and the interactions occurring in the numerator of (3.6). Of course, it is the non-normality of
${\it\psi}^{\dagger }$
and the interactions occurring in the numerator of (3.6). Of course, it is the non-normality of
 ${\mathcal{K}}(U_{B,1},{\it\mu}^{(0)})$
which allows the properties of the adjoint to be very different from the form of the physical eigenfunction, as demonstrated in figures 1 and 2, and discussed below.
${\mathcal{K}}(U_{B,1},{\it\mu}^{(0)})$
which allows the properties of the adjoint to be very different from the form of the physical eigenfunction, as demonstrated in figures 1 and 2, and discussed below.
The larger range of significant energy frequencies in the adjoint function, compared with the physical eigenfunction, causes the adjoint to be much more localised in time than the eigenfunction. For the cases examined here, the adjoint was essentially zero outside of time intervals of width approximately
 ${\rm\pi}/2$
, close to either
${\rm\pi}/2$
, close to either
 ${\it\tau}=0$
or
${\it\tau}=0$
or
 ${\it\tau}={\rm\pi}$
. For values of
${\it\tau}={\rm\pi}$
. For values of
 ${\it\mu}_{i}$
close to zero or very close to 0.5, the adjoint was significantly different from zero on both of these time intervals, but for other
${\it\mu}_{i}$
close to zero or very close to 0.5, the adjoint was significantly different from zero on both of these time intervals, but for other
 ${\it\mu}_{i}$
, only one of these time intervals contained large values of the adjoint function. Further, as well as being localised in time, the adjoint function was highly localised in the direction normal to the wall, taking significant non-zero values strictly within the Stokes layer on the wall, say the region
${\it\mu}_{i}$
, only one of these time intervals contained large values of the adjoint function. Further, as well as being localised in time, the adjoint function was highly localised in the direction normal to the wall, taking significant non-zero values strictly within the Stokes layer on the wall, say the region
 $-h<y<-h+2$
near the lower boundary, with a corresponding region near the upper plate. As shown by figures 1 and 2, the adjoint function is also highly oscillatory. These three features are all in contrast to the eigenfunction where significant non-zero values of the streamfunction extended over almost all one period of the basic oscillation, and over a wall normal extent of four units or more, centred around the free stream edge of the Stokes layer, as shown in BB02. Again, figures 1 and 2 show that the eigenfunction is not highly oscillatory. The combination of these features indicates that the integrand of the numerator in (3.6) can differ significantly from zero in at most two small regions close to the oscillating walls, as demonstrated in figure 3 for an infinitesimal cosine perturbation with frequency
$-h<y<-h+2$
near the lower boundary, with a corresponding region near the upper plate. As shown by figures 1 and 2, the adjoint function is also highly oscillatory. These three features are all in contrast to the eigenfunction where significant non-zero values of the streamfunction extended over almost all one period of the basic oscillation, and over a wall normal extent of four units or more, centred around the free stream edge of the Stokes layer, as shown in BB02. Again, figures 1 and 2 show that the eigenfunction is not highly oscillatory. The combination of these features indicates that the integrand of the numerator in (3.6) can differ significantly from zero in at most two small regions close to the oscillating walls, as demonstrated in figure 3 for an infinitesimal cosine perturbation with frequency
 $p=62$
. Note that as well as the decay of the adjoint function away from the walls, the perturbation velocity field
$p=62$
. Note that as well as the decay of the adjoint function away from the walls, the perturbation velocity field
 $U_{p}(y,{\it\tau})$
also tends to zero outside the basic flow Stokes layer, and does so extremely rapidly for the values of
$U_{p}(y,{\it\tau})$
also tends to zero outside the basic flow Stokes layer, and does so extremely rapidly for the values of
 $p$
around the maximum in
$p$
around the maximum in
 $|{\it\mu}_{c}^{(1,p)}|$
. The highly oscillatory nature of the integrand is only hinted at in this figure and attempts to show the (more than 120) zero contour lines obliterate the size information present in the plots.
$|{\it\mu}_{c}^{(1,p)}|$
. The highly oscillatory nature of the integrand is only hinted at in this figure and attempts to show the (more than 120) zero contour lines obliterate the size information present in the plots.

Figure 3. Pseudo-colour plots of the size of the integrand of the numerator in (3.6) in the
 ${\it\tau}$
–
${\it\tau}$
–
 $y$
plane for a cosine perturbation of frequency
$y$
plane for a cosine perturbation of frequency
 $p=62$
. In (a) we give the real part of the numerator while in (b) we show the imaginary part. The flow parameters are
$p=62$
. In (a) we give the real part of the numerator while in (b) we show the imaginary part. The flow parameters are
 $R=300$
,
$R=300$
,
 $a=0.38$
and
$a=0.38$
and
 $h=16$
, as used in figure 1. The chosen value of the frequency
$h=16$
, as used in figure 1. The chosen value of the frequency
 $p$
generates the
$p$
generates the
 ${\it\mu}_{c}^{1,p}$
with maximum real part.
${\it\mu}_{c}^{1,p}$
with maximum real part.
Investigations into the size distribution of the integrand in the numerator of (3.6) were carried out for all perturbation frequencies used in figures 1 and 2 and over a range of wavenumbers around those used in these two figures, with the Reynolds number fixed at
 $R=300$
. Both the wide (
$R=300$
. Both the wide (
 $h=16$
) and narrow (
$h=16$
) and narrow (
 $h=5$
) channel geometries were considered as well as both sine and cosine perturbations. The numerical values of the integrand in the numerator of (3.6) shown in figure 3 are typical of all of the results obtained. The regions where the integrand differs substantially from zero were determined by the structure of the adjoint function, as discussed above. With the narrow channel the range of values of the real and imaginary parts of the integrand was
$h=5$
) channel geometries were considered as well as both sine and cosine perturbations. The numerical values of the integrand in the numerator of (3.6) shown in figure 3 are typical of all of the results obtained. The regions where the integrand differs substantially from zero were determined by the structure of the adjoint function, as discussed above. With the narrow channel the range of values of the real and imaginary parts of the integrand was
 $[-250,250]$
for all frequencies
$[-250,250]$
for all frequencies
 $p$
; the range
$p$
; the range
 $[-400,400]$
also encompassed all frequencies for the wide channel. This last observation seems to contradict the very wide range of sensitivity coefficients calculated from this data. However, what could be observed as the perturbation frequency varied was a change in the orientation of the zero contour lines. Away from the values of
$[-400,400]$
also encompassed all frequencies for the wide channel. This last observation seems to contradict the very wide range of sensitivity coefficients calculated from this data. However, what could be observed as the perturbation frequency varied was a change in the orientation of the zero contour lines. Away from the values of
 $p$
around the maximum values of
$p$
around the maximum values of
 $|{\it\mu}^{(1,p)}|$
the zero contour lines in figure 3 were almost normal to the wall leading to much cancellation in the prescribed time integrations. For those
$|{\it\mu}^{(1,p)}|$
the zero contour lines in figure 3 were almost normal to the wall leading to much cancellation in the prescribed time integrations. For those
 $p$
generating the maximum values of
$p$
generating the maximum values of
 $|{\it\mu}^{(1,p)}|$
, the zero contour lines became almost parallel to the wall, thereby creating a stationary phase effect in the time integrations; this effect was more marked in the two time intervals containing the essentially non-zero values of the integrand. These mathematical observations still leave open the question of a physical mechanism for the calculated large sensitivity coefficients.
$|{\it\mu}^{(1,p)}|$
, the zero contour lines became almost parallel to the wall, thereby creating a stationary phase effect in the time integrations; this effect was more marked in the two time intervals containing the essentially non-zero values of the integrand. These mathematical observations still leave open the question of a physical mechanism for the calculated large sensitivity coefficients.
The examination of the interaction of a global eigenfunction and its adjoint in the context of the structural sensitivity to base-flow modifications appears to have developed from a series of studies of flow past circular cylinders (Giannetti & Luchini Reference Giannetti and Luchini2007; Luchini, Giannetti & Pralits Reference Luchini, Giannetti and Pralits2008; Pralits, Brandt & Giannetti Reference Pralits, Brandt and Giannetti2010). By analysing the spatial structure of the interaction of the linear stability eigenfunction and its adjoint for steady flow past a cylinder and interpreting the results with the guidance of the WKB theory of Huerre & Monkewitz (Reference Huerre and Monkewitz1990) a so-called ‘wavemaker’ region in the steady flow could be identified (Giannetti & Luchini Reference Giannetti and Luchini2007). For the unsteady flow considered here the analogous problem is the determination of any spatial region and time interval that could be similarly interpreted as being a ‘wavemaker’ for instabilities in the underlying Stokes layer flow. The spatiotemporal regions identified as contributing most to the sensitivity coefficients
 ${\it\mu}^{(1,p)}$
in figure 3 above would be the natural candidates for these ‘wavemaker’ regions, however here there is no firm WKB, or quasi-steady, theory to rely upon. As an initial experiment, only the time intervals
${\it\mu}^{(1,p)}$
in figure 3 above would be the natural candidates for these ‘wavemaker’ regions, however here there is no firm WKB, or quasi-steady, theory to rely upon. As an initial experiment, only the time intervals
 $0<{\it\tau}<{\rm\pi}/2$
and
$0<{\it\tau}<{\rm\pi}/2$
and
 ${\rm\pi}<{\it\tau}<3{\rm\pi}/2$
were included when evaluating the numerator in (3.6). These time intervals correspond to the speed of the wall decreasing, the time intervals which the folklore of unsteady stability deems the source of the global instability. When these truncated integrals were calculated over the range of perturbation frequencies of figures 1 and 2 the sensitivity coefficients obtained differed from the correct
${\rm\pi}<{\it\tau}<3{\rm\pi}/2$
were included when evaluating the numerator in (3.6). These time intervals correspond to the speed of the wall decreasing, the time intervals which the folklore of unsteady stability deems the source of the global instability. When these truncated integrals were calculated over the range of perturbation frequencies of figures 1 and 2 the sensitivity coefficients obtained differed from the correct
 ${\it\mu}^{(1,p)}$
by at best 20 % and more generally by more than 30 %. This might seem like reasonable agreement given that half the period of the oscillation has been completely ignored. However, shifting the time intervals to
${\it\mu}^{(1,p)}$
by at best 20 % and more generally by more than 30 %. This might seem like reasonable agreement given that half the period of the oscillation has been completely ignored. However, shifting the time intervals to
 $-{\rm\pi}/4<{\it\tau}<{\rm\pi}/4$
and
$-{\rm\pi}/4<{\it\tau}<{\rm\pi}/4$
and
 $3{\rm\pi}/4<{\it\tau}<5{\rm\pi}/4$
and repeating the integrals produced values for the sensitivity coefficients that were within 0.5 % of the true value for the
$3{\rm\pi}/4<{\it\tau}<5{\rm\pi}/4$
and repeating the integrals produced values for the sensitivity coefficients that were within 0.5 % of the true value for the
 $p$
generating the larger
$p$
generating the larger
 $|{\it\mu}^{(1,p)}|$
, with the approximation having a better than 5 % accuracy for
$|{\it\mu}^{(1,p)}|$
, with the approximation having a better than 5 % accuracy for
 $60\leqslant p\leqslant 80$
. These results suggest that the basic Stokes layer flow is highly susceptible to disturbances localised in time around the instants of maximum speed, confined to a spatial region very close to the oscillating walls and having a frequency 60 to 80 times the fundamental frequency.
$60\leqslant p\leqslant 80$
. These results suggest that the basic Stokes layer flow is highly susceptible to disturbances localised in time around the instants of maximum speed, confined to a spatial region very close to the oscillating walls and having a frequency 60 to 80 times the fundamental frequency.
Finally two small checks on the sensitivity coefficients are briefly mentioned. First, the sensitivity coefficient for
 $\sin {\it\tau}$
perturbations must be zero, as to leading order in
$\sin {\it\tau}$
perturbations must be zero, as to leading order in
 ${\it\delta}$
the only effect of the extra
${\it\delta}$
the only effect of the extra
 ${\it\delta}\sin {\it\tau}$
term is to produce a wall velocity of
${\it\delta}\sin {\it\tau}$
term is to produce a wall velocity of
 $\cos ({\it\tau}-{\it\delta})$
. This change in the origin of time can have no effect on the value of
$\cos ({\it\tau}-{\it\delta})$
. This change in the origin of time can have no effect on the value of
 ${\it\mu}^{(0)}$
(see BB02, BB06) leading to a zero sensitivity coefficient in this case. In all our numerical calculations of
${\it\mu}^{(0)}$
(see BB02, BB06) leading to a zero sensitivity coefficient in this case. In all our numerical calculations of
 ${\it\mu}^{(1,1)}$
via (3.6) the value of
${\it\mu}^{(1,1)}$
via (3.6) the value of
 ${\it\mu}_{s}^{(1,1)}$
was always less than
${\it\mu}_{s}^{(1,1)}$
was always less than
 $10^{-5}$
. Given that the integrands for
$10^{-5}$
. Given that the integrands for
 ${\it\mu}^{(1,1)}$
contain
${\it\mu}^{(1,1)}$
contain
 $O(1)$
terms this result was taken to be sufficiently close to zero. Further evidence of the internal consistency of the results of this section is obtained by exploiting the fact that
$O(1)$
terms this result was taken to be sufficiently close to zero. Further evidence of the internal consistency of the results of this section is obtained by exploiting the fact that
 ${\it\mu}_{c}^{(1,1)}$
can be estimated by independent calculations. The effect of a
${\it\mu}_{c}^{(1,1)}$
can be estimated by independent calculations. The effect of a
 ${\it\delta}\cos {\it\tau}$
change in the basic wall velocity can be re-interpreted as a change in the Reynolds number in the eigenvalue problem (3.2a
) and (3.3a
) and thus we have the result that
${\it\delta}\cos {\it\tau}$
change in the basic wall velocity can be re-interpreted as a change in the Reynolds number in the eigenvalue problem (3.2a
) and (3.3a
) and thus we have the result that
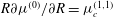 $R\partial {\it\mu}^{(0)}/\partial R={\it\mu}_{c}^{(1,1)}$
. By solving (3.2a
) and (3.3a
) at nearby values of
$R\partial {\it\mu}^{(0)}/\partial R={\it\mu}_{c}^{(1,1)}$
. By solving (3.2a
) and (3.3a
) at nearby values of
 $R$
and using a finite difference to approximate the partial derivative of
$R$
and using a finite difference to approximate the partial derivative of
 ${\it\mu}^{(0)}$
we were able to get very good agreement with the cosine sensitivity coefficient evaluated via (3.6) and (3.7).
${\it\mu}^{(0)}$
we were able to get very good agreement with the cosine sensitivity coefficient evaluated via (3.6) and (3.7).
4. Finite-sized modulations of the basic Stokes layer flow
Attention is now focused on the linear stability of the family of basic flows given by (2.2a
) where
 ${\it\delta}$
is allowed to take finite values generally up to 0.01 and occasionally as large as 0.03. (This latter value is obtained by converting the 4.2 % noise level based on the r.m.s. fluid velocity, reported in Eckmann & Grotberg (Reference Eckmann and Grotberg1991), to a perturbation amplitude scaled on the maximum amplitude of the fundamental frequency.) The linear stability problem to be solved is (2.5) where the basic flow contains just two frequencies. The velocity profile (2.2a
) and the value of
${\it\delta}$
is allowed to take finite values generally up to 0.01 and occasionally as large as 0.03. (This latter value is obtained by converting the 4.2 % noise level based on the r.m.s. fluid velocity, reported in Eckmann & Grotberg (Reference Eckmann and Grotberg1991), to a perturbation amplitude scaled on the maximum amplitude of the fundamental frequency.) The linear stability problem to be solved is (2.5) where the basic flow contains just two frequencies. The velocity profile (2.2a
) and the value of
 ${\it\delta}$
were selected as a simple model of experimentally reported basic flows in studies on the stability of Stokes layers or of oscillatory flow in pipes. The reports of Akhavan et al. (Reference Akhavan, Kamm and Shapiro1991) and Eckmann & Grotberg (Reference Eckmann and Grotberg1991) show velocity traces when the basic flow is laminar and apparently stable and they comment on the agreement of the experimental results with the theoretical, single-frequency velocity profile. The presence of some noise in their data is also acknowledged and it is this noise that the additional frequency in the basic flow (2.2a
) attempts to mimic.
${\it\delta}$
were selected as a simple model of experimentally reported basic flows in studies on the stability of Stokes layers or of oscillatory flow in pipes. The reports of Akhavan et al. (Reference Akhavan, Kamm and Shapiro1991) and Eckmann & Grotberg (Reference Eckmann and Grotberg1991) show velocity traces when the basic flow is laminar and apparently stable and they comment on the agreement of the experimental results with the theoretical, single-frequency velocity profile. The presence of some noise in their data is also acknowledged and it is this noise that the additional frequency in the basic flow (2.2a
) attempts to mimic.
The combined Fourier series and pseudo-spectral methods outlined in § 2.1 were used, but before presenting the main results from the solution of (2.5) with (2.2a
) as the basic flow, we describe some internal consistency checks that were carried out. At a selection of values of
 $R$
,
$R$
,
 $a$
,
$a$
,
 $h$
and
$h$
and
 $p$
the problem (2.5) was solved with
$p$
the problem (2.5) was solved with
 ${\it\delta}$
set to zero, and then resolved with
${\it\delta}$
set to zero, and then resolved with
 ${\it\delta}\sim O(10^{-5})$
to
${\it\delta}\sim O(10^{-5})$
to
 $O(10^{-4})$
, as needed, and
$O(10^{-4})$
, as needed, and
 $({\it\alpha}_{p},{\it\beta}_{p})=(1,0)$
or
$({\it\alpha}_{p},{\it\beta}_{p})=(1,0)$
or
 $(0,1)$
. The resulting change in
$(0,1)$
. The resulting change in
 ${\it\mu}$
divided by the value of
${\it\mu}$
divided by the value of
 ${\it\delta}$
provides a finite difference approximation to the cosine and sine sensitivity coefficients
${\it\delta}$
provides a finite difference approximation to the cosine and sine sensitivity coefficients
 ${\it\mu}_{c}^{(1,p)}$
and
${\it\mu}_{c}^{(1,p)}$
and
 ${\it\mu}_{s}^{(1,p)}$
of the previous section. In all test cases, provided
${\it\mu}_{s}^{(1,p)}$
of the previous section. In all test cases, provided
 ${\it\delta}$
was sufficiently small, better than three significant figure agreement between the previously calculated
${\it\delta}$
was sufficiently small, better than three significant figure agreement between the previously calculated
 ${\it\mu}^{(1,p)}$
and these new approximations was obtained. This consistency check provided a level of confidence in the solution algorithm developed to determine the stability of this more complicated basic flow.
${\it\mu}^{(1,p)}$
and these new approximations was obtained. This consistency check provided a level of confidence in the solution algorithm developed to determine the stability of this more complicated basic flow.
Owing to the large parameter space available in this problem we can only display a relatively small set of results that together convey the main features discovered. Thus, most of our initial results will be for a Reynolds number
 $R=300$
and a ‘noise level’ of 1 % of the amplitude of the fundamental frequency, i.e.
$R=300$
and a ‘noise level’ of 1 % of the amplitude of the fundamental frequency, i.e.
 ${\it\delta}=0.01$
, both choices being motivated by the aforementioned experimental considerations. (Note that this Reynolds number is less than half the previously predicted critical Reynolds number for linear instability and is within the range of experimentally reported transition Reynolds numbers.) Again only two values for the channel half width will be considered:
${\it\delta}=0.01$
, both choices being motivated by the aforementioned experimental considerations. (Note that this Reynolds number is less than half the previously predicted critical Reynolds number for linear instability and is within the range of experimentally reported transition Reynolds numbers.) Again only two values for the channel half width will be considered:
 $h=16$
will be used as a model of the classical Stokes layer in a semi-infinite fluid while
$h=16$
will be used as a model of the classical Stokes layer in a semi-infinite fluid while
 $h=5$
is chosen as it provides the minimum critical Reynolds number for all oscillatory channel flows. One further restriction is that mostly even disturbance modes are considered, as these constitute the more unstable of the two possible disturbances in a channel. Most of the wave numbers used will be near the relevant critical wave number for the associated monotonic basic flow and the majority of the results presented below will be for a cosine form of the ‘noise’; where the results for the sine form are available they will be mentioned and effects of the phase of the perturbation on the eigenvalues will only be briefly considered. And lastly, where neutral stability curves for the noisy basic flow are given, attention will be focused on a small set of results that indicate the effect of the perturbation frequency on the value of the critical Reynolds number.
$h=5$
is chosen as it provides the minimum critical Reynolds number for all oscillatory channel flows. One further restriction is that mostly even disturbance modes are considered, as these constitute the more unstable of the two possible disturbances in a channel. Most of the wave numbers used will be near the relevant critical wave number for the associated monotonic basic flow and the majority of the results presented below will be for a cosine form of the ‘noise’; where the results for the sine form are available they will be mentioned and effects of the phase of the perturbation on the eigenvalues will only be briefly considered. And lastly, where neutral stability curves for the noisy basic flow are given, attention will be focused on a small set of results that indicate the effect of the perturbation frequency on the value of the critical Reynolds number.
Figure 4 shows the effect of increasing the size of
 ${\it\delta}$
on the value of
${\it\delta}$
on the value of
 ${\it\mu}_{r}$
for both Stokes and centre modes in channels of width 5 and 16 at
${\it\mu}_{r}$
for both Stokes and centre modes in channels of width 5 and 16 at
 $R=300$
; wave numbers and noise frequency are given in the caption. In the narrower channel the Stokes mode is always more unstable than the centre mode and it is seen that with a noise level of just 1 % the previously stable flow is now unstable. This at a Reynolds number less than half the theoretical critical for the monotonic basic flow. We also see that a 1 % noise level has not been sufficient to drive the wide channel flow to instability, but nevertheless the decay rate of the Stokes mode has more than halved, while the centre mode decay rate has barely changed. This last result is consistent with the previous calculations which predicted that in this case the Stokes mode is two to three orders of magnitude more sensitive to noise than the centre mode.
$R=300$
; wave numbers and noise frequency are given in the caption. In the narrower channel the Stokes mode is always more unstable than the centre mode and it is seen that with a noise level of just 1 % the previously stable flow is now unstable. This at a Reynolds number less than half the theoretical critical for the monotonic basic flow. We also see that a 1 % noise level has not been sufficient to drive the wide channel flow to instability, but nevertheless the decay rate of the Stokes mode has more than halved, while the centre mode decay rate has barely changed. This last result is consistent with the previous calculations which predicted that in this case the Stokes mode is two to three orders of magnitude more sensitive to noise than the centre mode.

Figure 4. Real part of the Floquet exponent
 ${\it\mu}$
for Stokes mode and centre mode at
${\it\mu}$
for Stokes mode and centre mode at
 $R=300$
as functions of increasing noise level
$R=300$
as functions of increasing noise level
 ${\it\delta}$
. The solid and dashed lines, marked with ● and ○, show the results for the Stokes mode and centre mode respectively for the narrow channel
${\it\delta}$
. The solid and dashed lines, marked with ● and ○, show the results for the Stokes mode and centre mode respectively for the narrow channel
 $h=5$
with wave number
$h=5$
with wave number
 $a=0.41$
and noise frequency
$a=0.41$
and noise frequency
 $p=75$
. The short dashed and chain lines, marked with ▪ and ▫, are the wide channel counterparts for
$p=75$
. The short dashed and chain lines, marked with ▪ and ▫, are the wide channel counterparts for
 $h=16$
with
$h=16$
with
 $a=0.38$
and
$a=0.38$
and
 $p=65$
.
$p=65$
.

Figure 5. Maximum amplitudes of the Fourier components
 ${\it\psi}_{n}(y)$
(see (2.9)) of the Stokes mode as functions of the harmonic number at varying noise levels for the narrow channel
${\it\psi}_{n}(y)$
(see (2.9)) of the Stokes mode as functions of the harmonic number at varying noise levels for the narrow channel
 $h=5$
, wave number
$h=5$
, wave number
 $a=0.41$
,
$a=0.41$
,
 $R=300$
and a noise frequency
$R=300$
and a noise frequency
 $p=75$
. The curves correspond to different levels of superimposed noise
$p=75$
. The curves correspond to different levels of superimposed noise
 ${\it\delta}$
indicated via markers on each curve: ▫,
${\it\delta}$
indicated via markers on each curve: ▫,
 $\rightarrow {\it\delta}=0$
; ▪,
$\rightarrow {\it\delta}=0$
; ▪,
 $\rightarrow {\it\delta}=10^{-10}$
; ●,
$\rightarrow {\it\delta}=10^{-10}$
; ●,
 $\rightarrow {\it\delta}=10^{-5}$
; ▴,
$\rightarrow {\it\delta}=10^{-5}$
; ▴,
 $\rightarrow {\it\delta}=10^{-4}$
; ▾,
$\rightarrow {\it\delta}=10^{-4}$
; ▾,
 $\rightarrow {\it\delta}=10^{-3}$
; and ♦,
$\rightarrow {\it\delta}=10^{-3}$
; and ♦,
 $\rightarrow {\it\delta}=10^{-2}$
.
$\rightarrow {\it\delta}=10^{-2}$
.
The change in structure of the Fourier series representing the eigenfunction
 ${\it\psi}(y,{\it\tau})$
as the noise level increases is shown in figure 5, where
${\it\psi}(y,{\it\tau})$
as the noise level increases is shown in figure 5, where
 $\max _{y}\!|{\it\psi}_{n}(y)|$
is given as a function of the harmonic
$\max _{y}\!|{\it\psi}_{n}(y)|$
is given as a function of the harmonic
 $n$
. The overall structure is typical of all results obtained and it is noted that the lower three curves, as judged by the left or right extremes of each curve, are slightly asymmetrical about
$n$
. The overall structure is typical of all results obtained and it is noted that the lower three curves, as judged by the left or right extremes of each curve, are slightly asymmetrical about
 $n=0$
, as for these noise levels
$n=0$
, as for these noise levels
 ${\it\mu}$
is complex. Conversely the upper three curves correspond to purely real values of
${\it\mu}$
is complex. Conversely the upper three curves correspond to purely real values of
 ${\it\mu}$
and hence are symmetrical about
${\it\mu}$
and hence are symmetrical about
 $n=0$
. It is slightly surprising that a value of
$n=0$
. It is slightly surprising that a value of
 ${\it\delta}$
as small as
${\it\delta}$
as small as
 $10^{-10}$
is enough to induce a change in the decay rate of the harmonics seen at
$10^{-10}$
is enough to induce a change in the decay rate of the harmonics seen at
 $n\approx \pm 100$
. This modification then propagates upwards with increasing
$n\approx \pm 100$
. This modification then propagates upwards with increasing
 ${\it\delta}$
until it reaches the ‘knee’, whose position is a function of
${\it\delta}$
until it reaches the ‘knee’, whose position is a function of
 $aR$
in the noise-free case. From there, increasing
$aR$
in the noise-free case. From there, increasing
 ${\it\delta}$
further introduces larger-amplitude variations in the size of the
${\it\delta}$
further introduces larger-amplitude variations in the size of the
 ${\it\psi}_{n}$
around the imposed noise frequency (here at
${\it\psi}_{n}$
around the imposed noise frequency (here at
 $p=75$
) while simultaneously slowing the overall decay of the Fourier coefficients. Despite this decreased rate of decay of the Fourier coefficients when
$p=75$
) while simultaneously slowing the overall decay of the Fourier coefficients. Despite this decreased rate of decay of the Fourier coefficients when
 ${\it\delta}=0.01$
, we can be confident of the overall convergence of the Fourier series. Our calculations have been repeated with up to as many as
${\it\delta}=0.01$
, we can be confident of the overall convergence of the Fourier series. Our calculations have been repeated with up to as many as
 $\pm 500$
harmonics in the Fourier series and the inclusion of many more harmonics has a negligible effect on the predicted value of
$\pm 500$
harmonics in the Fourier series and the inclusion of many more harmonics has a negligible effect on the predicted value of
 ${\it\mu}$
. The decay of the harmonics
${\it\mu}$
. The decay of the harmonics
 ${\it\psi}_{n}(y)$
at
${\it\psi}_{n}(y)$
at
 ${\it\delta}=0.01$
shown in figure 5 is continued in all calculations where the truncation of the Fourier series (2.9) contained more terms.
${\it\delta}=0.01$
shown in figure 5 is continued in all calculations where the truncation of the Fourier series (2.9) contained more terms.
At a fixed level of
 ${\it\delta}=0.01$
, the effect of the frequency
${\it\delta}=0.01$
, the effect of the frequency
 $p$
of the noise on the real part of
$p$
of the noise on the real part of
 ${\it\mu}$
for the three most unstable modes at
${\it\mu}$
for the three most unstable modes at
 $R=300$
,
$R=300$
,
 $h=16$
and
$h=16$
and
 $a=0.41$
is shown in figure 6. For frequencies below 50 and above 85 the eigenvalues obtained are essentially those that would be found in the noise free, purely oscillatory flow, with the Stokes mode not visible within the range of
$a=0.41$
is shown in figure 6. For frequencies below 50 and above 85 the eigenvalues obtained are essentially those that would be found in the noise free, purely oscillatory flow, with the Stokes mode not visible within the range of
 ${\it\mu}_{r}$
shown in the figure. Once
${\it\mu}_{r}$
shown in the figure. Once
 $p$
is above approximately 60 the Stokes mode begins to be substantially affected by the noise in the basic flow and
$p$
is above approximately 60 the Stokes mode begins to be substantially affected by the noise in the basic flow and
 ${\it\mu}_{r}$
starts to increase. In so doing, the Stokes mode becomes more unstable than both centre modes for
${\it\mu}_{r}$
starts to increase. In so doing, the Stokes mode becomes more unstable than both centre modes for
 $71\leqslant p\leqslant 76$
, while as seen previously, the centre mode eigenvalues remain almost completely unaltered. Again, the Stokes mode does not quite reach the right-hand half of the complex plane.
$71\leqslant p\leqslant 76$
, while as seen previously, the centre mode eigenvalues remain almost completely unaltered. Again, the Stokes mode does not quite reach the right-hand half of the complex plane.

Figure 6. Real part of
 ${\it\mu}$
for the three most unstable modes as function of noise frequency
${\it\mu}$
for the three most unstable modes as function of noise frequency
 $p$
for
$p$
for
 $h=16$
,
$h=16$
,
 $a=0.41$
,
$a=0.41$
,
 ${\it\delta}=0.01$
and
${\it\delta}=0.01$
and
 $R=300$
. The dotted and dashed lines correspond to the first two centre mode disturbances while the solid lines indicate the growth rate of the Stokes mode. Results for both cosine and sine noise forms are shown, with differences only discernible for
$R=300$
. The dotted and dashed lines correspond to the first two centre mode disturbances while the solid lines indicate the growth rate of the Stokes mode. Results for both cosine and sine noise forms are shown, with differences only discernible for
 $65\leqslant p\leqslant 70$
in the Stokes mode results. The solid line marked with ● symbols denotes a cosine perturbation while the solid line marked with
$65\leqslant p\leqslant 70$
in the Stokes mode results. The solid line marked with ● symbols denotes a cosine perturbation while the solid line marked with
 $\times$
indicates a sine perturbation.
$\times$
indicates a sine perturbation.
The results in this figure are consistent with those of figure 1 where the sensitivity coefficients for the centre modes were all much less than one while the Stokes mode sensitivity coefficients were
 $O(10^{4})$
in a narrow band. Thus, we see in figure 6 that the centre mode growth rates are almost completely independent of the frequency of the perturbation while the Stokes mode growth rates vary significantly with the value of
$O(10^{4})$
in a narrow band. Thus, we see in figure 6 that the centre mode growth rates are almost completely independent of the frequency of the perturbation while the Stokes mode growth rates vary significantly with the value of
 $p$
. (The frequency for the maximum responses do not quite align as the wave numbers differ between the two graphs.) Further, figure 6 contains the behaviour of the growth rates for both a sine and cosine perturbation: for the least-damped centre mode there is no difference visible on the graph with only small differences seen in the second centre mode. For the Stokes mode the effect of a phase shift of
$p$
. (The frequency for the maximum responses do not quite align as the wave numbers differ between the two graphs.) Further, figure 6 contains the behaviour of the growth rates for both a sine and cosine perturbation: for the least-damped centre mode there is no difference visible on the graph with only small differences seen in the second centre mode. For the Stokes mode the effect of a phase shift of
 ${\rm\pi}/2$
in the perturbation is clearly seen when the mode is quite stable, but around the maximum growth rate, the phase of the perturbation (with respect to the
${\rm\pi}/2$
in the perturbation is clearly seen when the mode is quite stable, but around the maximum growth rate, the phase of the perturbation (with respect to the
 $\cos {\it\tau}$
component of the basic flow) is essentially immaterial.
$\cos {\it\tau}$
component of the basic flow) is essentially immaterial.

Figure 7. Neutral curves for a wide channel
 $h=16$
and noise frequencies of
$h=16$
and noise frequencies of
 $p=69$
(——) and
$p=69$
(——) and
 $p=76$
(— ⋅ —) with
$p=76$
(— ⋅ —) with
 ${\it\delta}=0.01$
. The points marked with a
${\it\delta}=0.01$
. The points marked with a
 $+$
indicate critical conditions when the perturbation has frequency
$+$
indicate critical conditions when the perturbation has frequency
 $p$
as given on the graph. The dotted line connects critical conditions, again marked by a
$p$
as given on the graph. The dotted line connects critical conditions, again marked by a
 $+$
sign, for frequencies
$+$
sign, for frequencies
 $p=61,63,67,79,85,91,95,105$
when reading from left to right. The perturbation was
$p=61,63,67,79,85,91,95,105$
when reading from left to right. The perturbation was
 $0.01\cos (\,p{\it\tau})$
and only results for even modes are plotted explicitly. As the channel is wide, even and odd mode results are graphically indistinguishable.
$0.01\cos (\,p{\it\tau})$
and only results for even modes are plotted explicitly. As the channel is wide, even and odd mode results are graphically indistinguishable.
A more global view of the effect of noise on the stability of the underlying oscillatory flow is provided by examining suitable neutral stability curves in the
 $(a,R)$
plane. Four examples of neutral stability curves for the noisy flow are shown in figures 7 and 8. Three curves are for the most unstable even mode disturbances and, for completeness, one neutral curve for an odd mode disturbance is explicitly given in figure 8. As usual, the region of the
$(a,R)$
plane. Four examples of neutral stability curves for the noisy flow are shown in figures 7 and 8. Three curves are for the most unstable even mode disturbances and, for completeness, one neutral curve for an odd mode disturbance is explicitly given in figure 8. As usual, the region of the
 $(a,R)$
plane below the neutral curve is the parameter domain in which the flow is stable. Despite the slightly unusual shape of these neutral curves, the remarkable feature common to all of them is the surprisingly small value of the critical Reynolds number, denoted by
$(a,R)$
plane below the neutral curve is the parameter domain in which the flow is stable. Despite the slightly unusual shape of these neutral curves, the remarkable feature common to all of them is the surprisingly small value of the critical Reynolds number, denoted by
 $R_{c}$
, required for instability. For the wide channel
$R_{c}$
, required for instability. For the wide channel
 $h=16$
, the model of the semi-infinite Stokes layer, we see a critical Reynolds number of approximately 305 for noise frequencies of both 69 and 76. This is a reduction of critical Reynolds number of approximately 400 when compared with the theoretical value of
$h=16$
, the model of the semi-infinite Stokes layer, we see a critical Reynolds number of approximately 305 for noise frequencies of both 69 and 76. This is a reduction of critical Reynolds number of approximately 400 when compared with the theoretical value of
 $R_{c}$
for the single-frequency flow (BB02, BB06). Further, we point out that while the neutral curves drawn in figure 7 are explicitly for even mode disturbances, the neutral curves for the odd modes are graphically the same as those shown. As was demonstrated in BB06, when
$R_{c}$
for the single-frequency flow (BB02, BB06). Further, we point out that while the neutral curves drawn in figure 7 are explicitly for even mode disturbances, the neutral curves for the odd modes are graphically the same as those shown. As was demonstrated in BB06, when
 $h>14$
neutral curves for the even and odd disturbance modes both tend to the neutral curve for the classical Stokes layer in a semi-infinite domain. That result must clearly continue to hold for the perturbed classical Stokes layer, as the concept of even and odd disturbance modes is not available.
$h>14$
neutral curves for the even and odd disturbance modes both tend to the neutral curve for the classical Stokes layer in a semi-infinite domain. That result must clearly continue to hold for the perturbed classical Stokes layer, as the concept of even and odd disturbance modes is not available.

Figure 8. Neutral curves for
 $h=5$
, a noise frequency
$h=5$
, a noise frequency
 $p=75$
with
$p=75$
with
 ${\it\delta}=0.01$
for the even disturbance mode (——) and odd disturbance mode (- - - -). The noise-free neutral curve for even disturbance modes is denoted by (— ⋅ —). The
${\it\delta}=0.01$
for the even disturbance mode (——) and odd disturbance mode (- - - -). The noise-free neutral curve for even disturbance modes is denoted by (— ⋅ —). The
 $+$
signs denote critical conditions for the even disturbance mode when the noise is
$+$
signs denote critical conditions for the even disturbance mode when the noise is
 ${\it\delta}\cos (75{\it\tau})$
with the values of
${\it\delta}\cos (75{\it\tau})$
with the values of
 ${\it\delta}$
given on the graph.
${\it\delta}$
given on the graph.
Table 1. Critical conditions
 $(a_{c},R_{c})$
as a function of
$(a_{c},R_{c})$
as a function of
 ${\it\delta}$
at fixed frequency
${\it\delta}$
at fixed frequency
 $p=69$
for a wide channel
$p=69$
for a wide channel
 $h=16$
.
$h=16$
.

Also shown in figure 7 are the critical conditions (marked by
 $+$
signs) obtained for a range of other frequencies at a fixed noise level of 1 %. At this noise level, with
$+$
signs) obtained for a range of other frequencies at a fixed noise level of 1 %. At this noise level, with
 $p\lessapprox 35$
the value of
$p\lessapprox 35$
the value of
 $R_{c}$
remained at its noise-free value of approximately 708, while for
$R_{c}$
remained at its noise-free value of approximately 708, while for
 $67\lessapprox p\lessapprox 91$
the value of
$67\lessapprox p\lessapprox 91$
the value of
 $R_{c}$
remains fairly constant at approximately 305. It is also seen that there is a large jump in the critical wavenumber between the frequencies 59 and 61. A similar jump in the value of the critical wavenumber is seen between the values
$R_{c}$
remains fairly constant at approximately 305. It is also seen that there is a large jump in the critical wavenumber between the frequencies 59 and 61. A similar jump in the value of the critical wavenumber is seen between the values
 ${\it\delta}=0.001$
and
${\it\delta}=0.001$
and
 ${\it\delta}=0.002$
in table 1 where the effect of the noise level at a fixed frequency of 69 is shown. However, the main feature of the results in this table is the continuous decrease of the critical Reynolds number with increasing amplitude of the noise level. The value of
${\it\delta}=0.002$
in table 1 where the effect of the noise level at a fixed frequency of 69 is shown. However, the main feature of the results in this table is the continuous decrease of the critical Reynolds number with increasing amplitude of the noise level. The value of
 ${\it\delta}=0.03$
corresponds to the noise level reported in Eckmann & Grotberg (Reference Eckmann and Grotberg1991). At this noise level the effect of varying the frequency follows the pattern seen previously: with
${\it\delta}=0.03$
corresponds to the noise level reported in Eckmann & Grotberg (Reference Eckmann and Grotberg1991). At this noise level the effect of varying the frequency follows the pattern seen previously: with
 $p=49$
we find critical conditions
$p=49$
we find critical conditions
 $(0.42,370)$
while with
$(0.42,370)$
while with
 $p=75$
we get
$p=75$
we get
 $(0.46,275)$
.
$(0.46,275)$
.
A similar dramatic reduction in the value of
 $R_{c}$
is obtained for the stability of the narrow channel oscillatory flow, as seen in figure 8. For the even disturbance mode there is a decrease of approximately 375 in the critical Reynolds number. For the odd disturbance mode the minimum Reynolds numbers for the noisy and noise-free cases are approximately 486 and 1186, respectively, so again perturbing the basic Stokes layer flow has a large effect on the properties of these odd disturbance modes. However, in all of the cases examined here it was always the even disturbance mode that determined the critical conditions for stability of the perturbed flow. Note that the two branches of the odd mode neutral curve marked with a ● were still distinct at
$R_{c}$
is obtained for the stability of the narrow channel oscillatory flow, as seen in figure 8. For the even disturbance mode there is a decrease of approximately 375 in the critical Reynolds number. For the odd disturbance mode the minimum Reynolds numbers for the noisy and noise-free cases are approximately 486 and 1186, respectively, so again perturbing the basic Stokes layer flow has a large effect on the properties of these odd disturbance modes. However, in all of the cases examined here it was always the even disturbance mode that determined the critical conditions for stability of the perturbed flow. Note that the two branches of the odd mode neutral curve marked with a ● were still distinct at
 $R=1600$
.
$R=1600$
.
Also shown in figure 8 is the variation of critical conditions with increasing amplitude of a perturbation with
 $p=75$
. The progress from the noise-free neutral curve to the noise level of 0.01 neutral curve is indicated by the + signs, with increasing values of
$p=75$
. The progress from the noise-free neutral curve to the noise level of 0.01 neutral curve is indicated by the + signs, with increasing values of
 ${\it\delta}$
leading to lower critical Reynolds numbers. Again, a jump in the critical wavenumber is seen, here between
${\it\delta}$
leading to lower critical Reynolds numbers. Again, a jump in the critical wavenumber is seen, here between
 ${\it\delta}=0.0017$
and
${\it\delta}=0.0017$
and
 ${\it\delta}=0.0018$
. The jumps in the value of
${\it\delta}=0.0018$
. The jumps in the value of
 $a_{c}$
seen here and for
$a_{c}$
seen here and for
 $h=16$
are explained in terms of the structure of
$h=16$
are explained in terms of the structure of
 ${\it\mu}_{r}(a,R)$
. At fixed
${\it\mu}_{r}(a,R)$
. At fixed
 $R$
, there is no a priori reason for there to be only one local maximum in
$R$
, there is no a priori reason for there to be only one local maximum in
 ${\it\mu}_{r}$
as a function of
${\it\mu}_{r}$
as a function of
 $a$
. Indeed, for the odd mode at
$a$
. Indeed, for the odd mode at
 $R=600$
in figure 8 there are at least three local maxima in
$R=600$
in figure 8 there are at least three local maxima in
 ${\it\mu}_{r}$
as a function of
${\it\mu}_{r}$
as a function of
 $a$
. The origin of the jumps in the value of
$a$
. The origin of the jumps in the value of
 $a_{c}$
as various parameters are changed is then the swapping of critical conditions from a local maximum in
$a_{c}$
as various parameters are changed is then the swapping of critical conditions from a local maximum in
 ${\it\mu}_{r}$
at a larger
${\it\mu}_{r}$
at a larger
 $a$
to a local maximum in
$a$
to a local maximum in
 ${\it\mu}_{r}$
at smaller
${\it\mu}_{r}$
at smaller
 $a$
, as seen in both figures 7 and 8.
$a$
, as seen in both figures 7 and 8.
The neutral curves shown in figures 7 and 8 have several interesting features. Similar shaped neutral curves have previously been reported by Blennerhassett & Bassom (Reference Blennerhassett and Bassom2007) in the context of centripetal instabilities in Stokes layers. While these structures may appear interesting, from a practical point of view it is just the critical conditions that have any importance. A further reason for focusing less on the precise nature of the neutral curves is provided by examining the effect of the phase of the perturbation on the eigenvalues of the problem. Clearly the wall velocity (2.1) could be rewritten as
 $U_{w}=U_{s}(\cos {\it\omega}t+{\it\delta}\cos (\,p{\it\omega}t+{\it\chi}_{p}))$
where
$U_{w}=U_{s}(\cos {\it\omega}t+{\it\delta}\cos (\,p{\it\omega}t+{\it\chi}_{p}))$
where
 $\tan {\it\chi}_{p}={\it\beta}_{p}/{\it\alpha}_{p}$
and
$\tan {\it\chi}_{p}={\it\beta}_{p}/{\it\alpha}_{p}$
and
 ${\it\chi}_{p}$
is the phase of the perturbation with respect to the fundamental frequency. For the case of a channel with
${\it\chi}_{p}$
is the phase of the perturbation with respect to the fundamental frequency. For the case of a channel with
 $h=16$
and for a range of wavenumbers close to critical conditions for
$h=16$
and for a range of wavenumbers close to critical conditions for
 $p=69$
it was found that the value of
$p=69$
it was found that the value of
 ${\it\mu}_{r}$
oscillated with amplitude at most 0.008 as
${\it\mu}_{r}$
oscillated with amplitude at most 0.008 as
 ${\it\chi}_{p}$
varied over
${\it\chi}_{p}$
varied over
 $[0,2{\rm\pi}]$
. Along this part of the neutral curve
$[0,2{\rm\pi}]$
. Along this part of the neutral curve
 $d{\it\mu}_{r}/dR$
was always larger than 0.004, indicating that the neutral curve determined with just a
$d{\it\mu}_{r}/dR$
was always larger than 0.004, indicating that the neutral curve determined with just a
 ${\it\delta}\cos (69{\it\tau})$
noise component is at most two above the neutral curve that would be obtained if minimisation of
${\it\delta}\cos (69{\it\tau})$
noise component is at most two above the neutral curve that would be obtained if minimisation of
 $R$
with respect to phase
$R$
with respect to phase
 ${\it\chi}_{p}$
were also undertaken at each wavenumber. Similar effects of the phase
${\it\chi}_{p}$
were also undertaken at each wavenumber. Similar effects of the phase
 ${\it\chi}_{p}$
were seen around critical conditions for the other neutral curves presented in figures 7 and 8, so the simplest approach is to associate an error bar of
${\it\chi}_{p}$
were seen around critical conditions for the other neutral curves presented in figures 7 and 8, so the simplest approach is to associate an error bar of
 $-2$
to each of the neutral curves shown for the perturbed flows. This small effect of the phase of the perturbation is consistent with the results shown in figure 6, where results for only one phase were shown.
$-2$
to each of the neutral curves shown for the perturbed flows. This small effect of the phase of the perturbation is consistent with the results shown in figure 6, where results for only one phase were shown.
Further results for the narrow channel, complementing those shown in figure 8, are given in table 2. Here the dependence of the critical conditions on the frequency of the noise component is seen to follow the same pattern displayed graphically in the case of a wide channel. For lower-frequency perturbations there is little effect on the critical Reynolds number, but as the frequency increases the value of
 $R_{c}$
decreases to a minimum at
$R_{c}$
decreases to a minimum at
 $p$
around 75. Further increases in frequency lead to a slowly increasing value for
$p$
around 75. Further increases in frequency lead to a slowly increasing value for
 $R_{c}$
. Again, there is a distinct jump in the value of
$R_{c}$
. Again, there is a distinct jump in the value of
 $a_{c}$
as a different part of the
$a_{c}$
as a different part of the
 $(a,R)$
provides the critical instability as the frequency varies between
$(a,R)$
provides the critical instability as the frequency varies between
 $p=55$
and
$p=55$
and
 $p=65$
.
$p=65$
.
Table 2. Critical conditions
 $(a_{c},R_{c})$
as a function of frequency
$(a_{c},R_{c})$
as a function of frequency
 $p$
at fixed noise level
$p$
at fixed noise level
 ${\it\delta}=0.01$
for a narrow channel
${\it\delta}=0.01$
for a narrow channel
 $h=5$
.
$h=5$
.

Finally, we claim that the results presented here are robust in the sense that with changes in the structure of the noise, the prediction of a significant decrease in the critical Reynolds number remains intact. An illustration in support of this claim is described below. The numerical algorithm developed to investigate the stability of a perturbed Stokes layer flow was capable of handling a wall motion given by
 $$\begin{eqnarray}U_{w}=U_{s}\left(\cos {\it\omega}t+{\it\delta}\mathop{\sum }_{k=-2}^{2}{\it\alpha}_{k}\cos ((\,p+k){\it\omega}t)\right).\end{eqnarray}$$
For simplicity, calculations were carried with
 ${\it\alpha}_{k}\geqslant 0$
so the noise amplitude could be easily set at 0.01, as previously, by taking
${\it\alpha}_{k}\geqslant 0$
so the noise amplitude could be easily set at 0.01, as previously, by taking
 $\sum _{k=-2}^{2}{\it\alpha}_{k}=0.01$
. When performing these checks the summation terms in (2.12) were obviously taken over the set
$\sum _{k=-2}^{2}{\it\alpha}_{k}=0.01$
. When performing these checks the summation terms in (2.12) were obviously taken over the set
 $k\in \{p-2,p-1,p,p+1,p+2\}$
. With
$k\in \{p-2,p-1,p,p+1,p+2\}$
. With
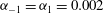 ${\it\alpha}_{-1}={\it\alpha}_{1}=0.002$
,
${\it\alpha}_{-1}={\it\alpha}_{1}=0.002$
,
 ${\it\alpha}_{0}=0.006$
and all other
${\it\alpha}_{0}=0.006$
and all other
 ${\it\alpha}_{k}$
set to zero a value of
${\it\alpha}_{k}$
set to zero a value of
 ${\it\mu}_{r}=0.086$
was found with
${\it\mu}_{r}=0.086$
was found with
 $p=75$
,
$p=75$
,
 $h=5$
,
$h=5$
,
 $a=0.41$
and
$a=0.41$
and
 $R=300$
. For
$R=300$
. For
 ${\it\alpha}_{-2}={\it\alpha}_{2}=0.002$
,
${\it\alpha}_{-2}={\it\alpha}_{2}=0.002$
,
 ${\it\alpha}_{0}=0.006$
and all other
${\it\alpha}_{0}=0.006$
and all other
 ${\it\alpha}_{k}$
set to zero, the same parameter values lead to
${\it\alpha}_{k}$
set to zero, the same parameter values lead to
 ${\it\mu}_{r}=0.303$
. When there is only one frequency of
${\it\mu}_{r}=0.303$
. When there is only one frequency of
 $p=75$
in the noise we have
$p=75$
in the noise we have
 ${\it\mu}_{r}=0.330$
, again at the same parameter values and all calculations being for the even disturbance mode. Similar results were found in the small number of other cases examined.
${\it\mu}_{r}=0.330$
, again at the same parameter values and all calculations being for the even disturbance mode. Similar results were found in the small number of other cases examined.

Figure 9. Time histories of the magnitude of the wall vorticity,
 $|{\it\zeta}(0,{\it\tau})|$
, for the flat plate base flow (2.17) at
$|{\it\zeta}(0,{\it\tau})|$
, for the flat plate base flow (2.17) at
 $R=310$
and with
$R=310$
and with
 $a=0.4$
. The solid line (——) is the evolution for the noisy Stokes layer with
$a=0.4$
. The solid line (——) is the evolution for the noisy Stokes layer with
 ${\it\beta}_{76}=0$
and
${\it\beta}_{76}=0$
and
 ${\it\alpha}_{76}=1$
. The dashed line (– – –) denotes the evolution for the noise-free basic flow with
${\it\alpha}_{76}=1$
. The dashed line (– – –) denotes the evolution for the noise-free basic flow with
 ${\it\alpha}_{p}$
and
${\it\alpha}_{p}$
and
 ${\it\beta}_{p}$
set to zero. The chain line (— ⋅ —) corresponds to the growth rate predicted via Floquet theory for a channel with
${\it\beta}_{p}$
set to zero. The chain line (— ⋅ —) corresponds to the growth rate predicted via Floquet theory for a channel with
 $h=16$
.
$h=16$
.
The dramatic decrease in critical Reynolds number achieved with just a 1 % noise level, presented above, was also found in our calculations for the classical semi-infinite Stokes layer, when using our DNS methods described in § 2.2. Figure 9 shows the time evolution of the magnitude of the wall vorticity,
 $|{\it\zeta}(0,{\it\tau})|$
, for an impulsively generated disturbance at
$|{\it\zeta}(0,{\it\tau})|$
, for an impulsively generated disturbance at
 $R=310$
and wave number
$R=310$
and wave number
 $a=0.4$
with noise frequency
$a=0.4$
with noise frequency
 $p=76$
. (These conditions have been selected to be in a region where results of the Floquet calculations suggest that the perturbed Stokes layer is unstable while the unperturbed flow is stable.) The noise amplitude was set with
$p=76$
. (These conditions have been selected to be in a region where results of the Floquet calculations suggest that the perturbed Stokes layer is unstable while the unperturbed flow is stable.) The noise amplitude was set with
 ${\it\delta}=0.01$
, as in the results shown previously, for the solid line curve whilst the dashed line denotes the decaying disturbance in the noise-free case. For the noisy base flow a Floquet exponent
${\it\delta}=0.01$
, as in the results shown previously, for the solid line curve whilst the dashed line denotes the decaying disturbance in the noise-free case. For the noisy base flow a Floquet exponent
 ${\it\mu}\approx 0.07813-0.4997\text{i}$
was obtained via Fourier series methods for a channel flow with
${\it\mu}\approx 0.07813-0.4997\text{i}$
was obtained via Fourier series methods for a channel flow with
 $h=16$
. A direct comparison of the results from the different solution techniques is provided by the straight line with slope 0.0782 in figure 9. Clearly the growth rate predicted via the Floquet solution matches the exponential growth of the perturbation seen the in DNS for the noisy Stokes layer. Further, although this figure shows only the first three cycles of the basic flow, our results extend over at least 12 cycles with the same excellent agreement between the two solution methods.
$h=16$
. A direct comparison of the results from the different solution techniques is provided by the straight line with slope 0.0782 in figure 9. Clearly the growth rate predicted via the Floquet solution matches the exponential growth of the perturbation seen the in DNS for the noisy Stokes layer. Further, although this figure shows only the first three cycles of the basic flow, our results extend over at least 12 cycles with the same excellent agreement between the two solution methods.
A side effect of the above agreement is the further confirmation that sufficient harmonics were retained in the Floquet technique. The time step used in the DNS results was
 ${\rm\Delta}{\it\tau}\approx 3.2\times 10^{-4}$
so that frequencies up to approximately 9000 were detectable in the simulation. Given the close agreement of this DNS result and the Floquet result, based on frequencies up to 240, it is clear that any solution components at frequencies higher than 240 have essentially no effect on the growth of the disturbance.
${\rm\Delta}{\it\tau}\approx 3.2\times 10^{-4}$
so that frequencies up to approximately 9000 were detectable in the simulation. Given the close agreement of this DNS result and the Floquet result, based on frequencies up to 240, it is clear that any solution components at frequencies higher than 240 have essentially no effect on the growth of the disturbance.
We have described the changes in the critical Reynolds numbers found here as ‘dramatic’. It may be argued that as the underlying linear operator is non-normal that such magnitude changes are to be expected. However, only rather small changes in the eigenspectrum were observed when the linear stability operator
 ${\mathcal{K}}(U_{B,1},{\it\mu}^{(0)})$
studied here has been perturbed by three-dimensional effects (Thomas et al.
Reference Thomas, Bassom and Blennerhassett2012) or by a mean flow (Thomas et al.
Reference Thomas, Bassom, Blennerhassett and Davies2011). Note that this latter result is now consistent with the findings here that perturbation frequencies below a certain threshold have essentially no effect on the stability properties of the basic monotonic flow. The results of the sensitivity calculations, § 3.1, suggest a partial explanation for the frequency dependence seen in the results of § 4, where finite-amplitude noise was allowed. A mechanism similar to the pseudo-resonance described in Alizard, Cherubini & Robinet (Reference Alizard, Cherubini and Robinet2009) could also be invoked. The process of frequency selection described by Alizard et al. (Reference Alizard, Cherubini and Robinet2009) appears to rely on the availability of a large number of weakly damped eigenmodes and a rather badly behaved pseudo-spectrum for the underlying stability problem. Neither of these two ingredients is present in the matrix
${\mathcal{K}}(U_{B,1},{\it\mu}^{(0)})$
studied here has been perturbed by three-dimensional effects (Thomas et al.
Reference Thomas, Bassom and Blennerhassett2012) or by a mean flow (Thomas et al.
Reference Thomas, Bassom, Blennerhassett and Davies2011). Note that this latter result is now consistent with the findings here that perturbation frequencies below a certain threshold have essentially no effect on the stability properties of the basic monotonic flow. The results of the sensitivity calculations, § 3.1, suggest a partial explanation for the frequency dependence seen in the results of § 4, where finite-amplitude noise was allowed. A mechanism similar to the pseudo-resonance described in Alizard, Cherubini & Robinet (Reference Alizard, Cherubini and Robinet2009) could also be invoked. The process of frequency selection described by Alizard et al. (Reference Alizard, Cherubini and Robinet2009) appears to rely on the availability of a large number of weakly damped eigenmodes and a rather badly behaved pseudo-spectrum for the underlying stability problem. Neither of these two ingredients is present in the matrix
 $\unicode[STIX]{x1D63C}$
approximating the operator
$\unicode[STIX]{x1D63C}$
approximating the operator
 ${\mathcal{K}}(U_{B,1},{\it\mu}^{(0)})$
controlling the flow stability in the present work. Defining the pseudo-spectrum in the standard manner as
${\mathcal{K}}(U_{B,1},{\it\mu}^{(0)})$
controlling the flow stability in the present work. Defining the pseudo-spectrum in the standard manner as
 ${\it\lambda}_{{\it\varepsilon}}=\{{\it\sigma}\in \mathbb{C}:\Vert ({\it\sigma}\unicode[STIX]{x1D644}-\unicode[STIX]{x1D63C})^{-1}\Vert \geqslant {\it\varepsilon}^{-1}\}$
it was found via EigTool, (Wright Reference Wright2002) that the imaginary axis of the complex
${\it\lambda}_{{\it\varepsilon}}=\{{\it\sigma}\in \mathbb{C}:\Vert ({\it\sigma}\unicode[STIX]{x1D644}-\unicode[STIX]{x1D63C})^{-1}\Vert \geqslant {\it\varepsilon}^{-1}\}$
it was found via EigTool, (Wright Reference Wright2002) that the imaginary axis of the complex
 ${\it\sigma}$
plane corresponds to the pseudo-spectral contour
${\it\sigma}$
plane corresponds to the pseudo-spectral contour
 ${\it\varepsilon}\approx 0.0025$
for the parameters used in figure 2 and to the contour
${\it\varepsilon}\approx 0.0025$
for the parameters used in figure 2 and to the contour
 ${\it\varepsilon}\approx 0.007$
for the parameters used in figure 1. This is in sharp contrast to the values of
${\it\varepsilon}\approx 0.007$
for the parameters used in figure 1. This is in sharp contrast to the values of
 ${\it\varepsilon}\sim O(10^{-6})$
seen in Alizard et al. (Reference Alizard, Cherubini and Robinet2009) that would allow perturbations to the operator to move eigenvalues into the unstable region of the complex plane. Rather the pseudo-spectrum associated with the monotonic Stokes layer at the low Reynolds numbers used in this study is consistent with the DNS results shown in figure 9. Here non-normality of
${\it\varepsilon}\sim O(10^{-6})$
seen in Alizard et al. (Reference Alizard, Cherubini and Robinet2009) that would allow perturbations to the operator to move eigenvalues into the unstable region of the complex plane. Rather the pseudo-spectrum associated with the monotonic Stokes layer at the low Reynolds numbers used in this study is consistent with the DNS results shown in figure 9. Here non-normality of
 ${\mathcal{K}}(U_{B,1},{\it\mu}^{(0)})$
allows a transient growth of an initial disturbance, but without the presence of the perturbation to the monotonic Stokes layer, the induced disturbance eventually decays.
${\mathcal{K}}(U_{B,1},{\it\mu}^{(0)})$
allows a transient growth of an initial disturbance, but without the presence of the perturbation to the monotonic Stokes layer, the induced disturbance eventually decays.
While only a limited set of neutral curves has been shown here, the general principle is now clear: noise of a suitable frequency and amplitude can have a dramatic effect on the linear stability of supposedly single-frequency oscillatory flows. We can report that increasing the noise amplitude, say up to 6 %, continues to reduce the critical Reynolds number. Further, within the range we have considered, increasing the noise level tends to widen the range of frequencies that strongly affect the Stokes mode instability. Combining all of these theoretical results suggests that different experimental apparatus, with various noise level properties, will produce a spectrum of values for experimentally determined transition Reynolds numbers.
5. Closing remarks
Here we have made a study of the stability properties of a family of oscillatory planar flows using both Floquet-theory-based methods and DNS. Our results predict a dramatic reduction in the critical conditions for linear instability for the case of an essentially monotonic oscillatory flow subject to a small amount of high-frequency ‘noise’. This brings theoretical predictions of the Reynolds number for transition to turbulent flow much more in line with the range observed in various physical experiments. Further, the dependence of our predicted critical conditions on the properties of the noise component suggest a pathway for explaining the wide variation in transition Reynolds numbers seen in the experimental literature. It should be remarked that our results here are not just random observations, but rather have a firm theoretical basis in the detailed underlying structure of the adjoint and eigenfunctions of the Floquet disturbances in the noise-free case. Nevertheless while this structure can be used to explain mathematically the importance of a small element of high-frequency noise we can offer no obvious physical reasoning as to how this could have been anticipated.
Various attempts have been made to rationalise the wide discrepancy between the theoretical and experimentally determined values of the transition Reynolds number either by appealing to nonlinearity or a premature tripping of the flow by wall roughness. Scenarios similar to the bypass mechanism seen in steady boundary layer flow transition have also been suggested. Without wishing to downplay those possibilities, what is added here is convincing proof that even a small element of noise is more than enough to markedly alter the transition characteristics of the flow. Indeed, our results show that it might only be when the noise is reduced to
 $O(0.01\,\%)$
that its effect can be ignored, at least for the Stokes layer. Even the most carefully conducted experiments claim that the inherent noise component can only be reduced to a value more than an order of magnitude greater.
$O(0.01\,\%)$
that its effect can be ignored, at least for the Stokes layer. Even the most carefully conducted experiments claim that the inherent noise component can only be reduced to a value more than an order of magnitude greater.
Of course the study here is restricted to the rather idealised flat Stokes layer but it is highly likely that similar results would transfer across to other time-periodic boundary layer flows. If this is indeed the case, the implication is that practical studies of the stability properties of such flows would be extremely difficult to model in the laboratory.
Acknowledgements
The referees are thanked for their comments which led to numerous improvements in the presentation of the paper. Particular gratitude is expressed to the referee who suggested we investigate the structure of the eigensolutions as discussed towards the end of § 3. This work was supported by the Australian Research Council grant DP0880463.


