Calves are born agammaglobulinemic, with no circulating G (IgG), M (IgM), A (IgA) or E (IgE) immunoglobulins. In the first period of life, the calf's immune defenses derive exclusively from the intestinal absorption of colostral immunoglobulins and the administration of an adequate colostral IgG mass is, therefore, crucial to minimize the risk of failure of passive transfer of immunity (FPTI) (Godden, Reference Godden2008). The main factors influencing an adequate absorption of passive immunity are the volume of the maternal colostrum fed, the immunoglobulin content of the colostrum and the time elapsed between the birth and the first feeding (Nocek et al., Reference Nocek, Braund and Warner1984; Jaster, Reference Jaster2005). Although it is well known that colostrum contains a wide variety of immune and nutritional components, the content of colostral IgG is considered the hallmark for the evaluation of colostrum quality. For this reason, dairy cow colostrum is commonly defined as high immunological quality if it contains an IgG concentration higher than 50 g/l (McGuirk and Collins, Reference McGuirk and Collins2004; Godden, Reference Godden2008). However, different factors contribute to colostrum quality, such as breed or parity of the cows and genetic characteristics which can be managed by the producer (Godden, Reference Godden2008, Moretti et al., Reference Moretti, Santos, Alencar and Machado-Neto2020). It is clear from the few comparison studies of dairy and beef cattle that beef cows produce first-milking colostrum with a higher IgG1 concentration (Guy et al., Reference Guy, McFadden, Cockrell and Besser1994). In a recent review, the IgG/IgG1 concentration reported for beef and dairy cows were 99 mg/ml (from 31 to 200) and 66 mg/ml (27 to 117) respectively (McGee and Earley, Reference McGee and Earley2018).
Radial immunodiffusion (RID) is recognized as the most accurate direct method for evaluating colostral IgG content (Fleenor and Stott, Reference Fleenor and Stott1980). Direct tests quantify the absolute concentration of immunoglobulin, whereas indirect tests, like optical or digital Brix refractometer provide an indirect measure of the IgG content (McGee and Earley, Reference McGee and Earley2018). The Brix refractometer is usually used to measure a liquid's sucrose concentration. When used in liquids without sucrose, the Brix percentage is equal to the total solids percentage, which in colostrum samples is closely related to the IgG content (Quigley et al., Reference Quigley, Lago, Chapman, Erickson and Polo2013). Nevertheless, translating Brix refractometer reference values of dairy cow colostrum to beef cattle breeding could lead to an incorrect or incomplete assessment of colostrum quality. For this reason, it is necessary to deepen the understanding about the quality of dairy and beef cow's colostrum, and the relative value of on-farm diagnostic techniques which can determine the quantity of IgG in beef cattle colostrum and help to ensure that beef calves receive an adequate amount of IgG after birth. The aims of the present study were to establish if there are any differences in colostrum IgG content between beef and dairy cattle and the diagnostic properties of the Brix refractometer using RID as the gold standard and to determine the relative breed related cut-point of an on-farm tool like Brix refractometer compared with the gold standard RID.
Materials and methods
Colostrum samples were collected from 90 beef and dairy cows, 30 Chianina (CHIA, Italian beef cattle breed), 30 Podolica (POD, Italian beef cattle breed) and 30 Holstein Friesian (HF, dairy cattle breed). The cows calved between November 2018 and July 2019 in 14 farms in central and southern Italy. The criteria for selecting the farms were farm location (compliance with the traditional area of diffusion for beef breeds was required), being a specialized beef or dairy farm, a willingness to collect colostrum samples from cows, and that the farm placed the cows in a free-stall barn one week before parturition.
All cows included in this study were non-vaccinated during the period preceding calving. Breed and parity data were collected from each cow and were classified in four groups per breed (first, second, third, and fourth or more parity). All calvings were eutocic and observed by farm personnel. A 50 ml aliquot of first milking maternal colostrum was collected before allowing the calf to nurse (within 2 h after calving). All colostrum samples from an individual cow were pooled, with a sample representative of each quarter of each udder being included in the pool. Each sample was frozen at the farm and transported to the laboratory to be stored at −30°C until testing was performed.
The colostrum was thawed at 4°C and then warmed to room temperature (20–23°C) before testing. Any visibly blood-contaminated samples were excluded from testing. A total of 8 colostrum aliquots were not analyzed because of the presence of blood (CHIA n = 2, POD n = 4, HF n = 2). The remaining samples were mixed and divided into 10 ml aliquots and analyzed to assess the immunological quality. Total solids were measured with a digital Brix refractometer (MISCO Palm Abbe no. PA201, Misco, Solon, OH). IgG concentration was directly analyzed by a commercial RID kit (Bovine Ig Test Kit, Triple J Farms, Bellingham, WA). All colostrum samples were tested using the manufacturer's directions and reference sera provided in the commercial RID kit was used as a positive control. Further details are provided in the online Supplementary File.
Statistical analysis
Descriptive statistics were calculated for results obtained by RID. The Shapiro test was used to test for the normality of data. One-way ANOVA was used to compare mean colostral IgG concentration related to the breed and the parity within breed. The Tukey test was used for comparison of the means among breed and parity, and significance was accepted at a probability of 0.05 (P < 0.05). All analyses were performed using dedicated statistical software package R statistical software V 3.6.1 (The R Foundation for Statistical Computing, Vienna, AT).
Diagnostic test characteristics: sensitivity, specificity (and their 95% interval confidence), positive predictive values (PPV) and negative predictive values (NPV) were estimated for the data obtained by digital Brix refractometer and compared to RID gold standard. Sensitivity was defined as the probability of a test result indicative of an inadequate colostral IgG concentration less than 50 g/l as determined by RID. Specificity was defined as the probability of a test result indicative of an adequate concentration ≥50 g/l as determined by RID. Epidemiological diagnostic characteristics of digital Brix refractometer were calculated on the whole colostrum sample and between cow breeds (Chianina, Podolica and Holstein Friesian). The computed sensitivity and specificity for each of the possible cut-off values were tabulated and the optimal cut-off value was defined as the value with the highest Youden's index. Linear regression modeling was used to determine the relationship between colostral IgG concentration as determined by RID and results of digital Brix refractometer.
Results
A total of 82 colostrum samples were analyzed (Chianina n = 28, Podolica n = 26, Holstein Friesian n = 28). Mean colostral IgG concentrations in all samples measured by RID was 87.5 g/l.
A total of 15.9% of samples (13/82) had IgG concentrations <50 g/l. Of these 13 low IgG samples, 2 were from CHIA (7.1% of the breed total), 5 were from POD (19.2% of the breed total) and 6 were from HF cows (21.4% of the breed total).
Mean IgG concentration for colostrum samples from beef cows (CHIA: 101.1 g/l and POD: 90.6 g/l) were higher (P < 0.01) than that of samples from HF dairy cows (71.1 g/l). First parity CHIA cows had the highest IgG mean content (116.1 g/l), but there were no significant differences detected between different parity within the breed (P > 0.05). Within the HF breed, multiparous colostrum samples had the highest immunoglobulin G concentration (88.5 g/l in fourth or more parity HF), but no statistical difference was detected compared to the first and third parity cows (Table 1). The lowest concentration was found in second parity HF (55.8 g/l).
Table 1. Effect of breed and parity on colostral IgG concentration (g/l)

sem, standard error of the mean. A,B within row, means without a common letter differ (P < 0.05). a,b,c within column, means without a common letter differ (P < 0.05).
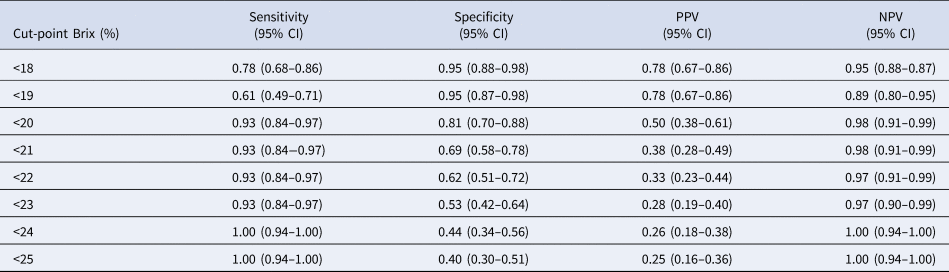
A 20% Brix concentration had the highest combined sensitivity and specificity. This concentration provided the highest Youden's Index for the detection of a minimum IgG concentration of 50 g/l as compared to RID results. At this cut-point, sensitivity was 0.93 (0.84–0.97) and specificity was 0.81 (0.70–0.88) (Table 2). In CHIA cows (Supplementary Table S1) the optimal Brix cut-point was determined to be 16% (sensitivity, 1.0 (0.85–1.00); specificity 1.0 (0.85–1.00)). Brix cut-point for POD was 17% (Supplementary Table S2) (sensitivity, 1.0 (0.84–1.00); specificity; 1.0 (0.84–1.00)) and the Brix cut-point for HF was 20% (Supplementary Table S3) (sensitivity, 0.83 (0.63–0.93); specificity; 0.77 (0.57–0.90)). The correlation between RID IgG concentration and digital Brix refractometer values was 0.78 (P < 0.0001; Supplementary Figure S1). The correlation between RID analysis and Brix value (Supplementary Figure S2) for the three breeds were 0.63 in CHIA (P = 0.0002), 0.92 in POD (P < 0.0001) and 0.84 in HF (P < 0.0001).
Table 2. Sensitivity, specificity, positive predictive value (PPV) and negative predictive value (NPV) of different digital Brix refractometer cut-points used to screen 82 bovine colostrum samples for low IgG concentration <50 g/l

CI, confidence interval.
Discussion
In the current study the mean IgG colostral concentration as measured by RID was 87.5 g/l and ranged from 8.9 g/l to 160.9 g/l. These IgG concentrations for the specific breeds tested have not been previously reported. It is well known that breed is one of the main factors influencing immunoglobulin concentration in first milking colostrum and that in beef cows colostral IgG concentration is higher than in dairy cows (McGee and Earley, Reference McGee and Earley2018). To date there is no information regarding the Italian beef cattle breeds. The present study found that the two Italian beef cows breed produce a colostrum with a higher IgG concentration than HF reared in Italy. IgG content of CHIA colostrum was higher than what has been reported in a French beef cattle breed (Vandeputte et al., Reference Vandeputte, Detilleux and Rollin2014) but lower than what was found in Irish (McGee et al., Reference McGee, Drennan and Caffrey2005; Earley et al., Reference Earley, Tiernan, Duffy and McGee2018) and Canadian beef herds (Homerosky et al., Reference Homerosky, Timsit, Pajor, Kastelic and Windeyer2017; Elsohaby et al., Reference Elsohaby, Windeyer, Haines and Keefe2018).
Immunoglobulin concentrations in POD were lower than in Chianina beef cows. Differences in genotype and first-milking colostrum yield are likely contributory factors to the differences detected within the two Italian beef cow breeds (Vann et al., Reference Vann, Holloway, Carstens, Boyd and Randel1995; McGee et al., Reference McGee, Drennan and Caffrey2005). Podolica cows which are genetically selected for both meat and milk production, usually produce a colostrum volume higher than Chianina cows. This volume difference leads to a dilution effect which may contribute to a reduction in colostrum IgG concentration. Usually there is a negative, relatively weak, association between colostrum volume/weight and IgG concentration (Morin et al., Reference Morin, Nelson, Reid, Nagy, Dahl and Constable2010; Kehoe et al., Reference Kehoe, Heinrichs, Moody, Jones and Long2011; Conneely et al., Reference Conneely, Berry, Sayers, Murphy, Lorenz, Doherty and Kennedy2013; Silva-del-Río et al., Reference Silva-del-Río, Rolle, García-Muñoz and Pandey2017). our measure of Holstein Friesian colostral immunoglobulin G concentration is comparable to what was reported by Quigley and colleagues (Quigley et al., Reference Quigley, Lago, Chapman, Erickson and Polo2013) and slightly higher than data reported by Elsohaby et al. (Reference Elsohaby, Windeyer, Haines and Keefe2018).
The range of values in the three different breeds demonstrate the wide variability of IgG concentration in first-milking colostrum. There are several possible explanations for these differences. Previous studies have reported that genetic variation contributes significantly to the differences in colostral IgG concentration. Particularly, the continuing increase in genetic selection of other characteristics also may influence indirectly the colostral IgG concentration (Baumrucker et al., Reference Baumrucker, Burkett, Magliaro-Macrina and Dechow2010).
Parity is an important factor influencing colostral IgG concentration. In dairy breeds, colostrum obtained from older cows usually contains higher IgG concentrations than colostrum from a younger cow (Silva-del-Río et al., Reference Silva-del-Río, Rolle, García-Muñoz and Pandey2017), as also was confirmed by our study. The lowest concentration found in this study was from second parity HF as has been previously reported (Gulliksen et al., Reference Gulliksen, Lie, Sølverød and Østerås2008). McGee and Earley (Reference McGee and Earley2018) reported that differences in IgG concentration, or their subclass (IgG1), between primiparous and multiparous beef cattle is small (McGee and Earley, Reference McGee and Earley2018). Our data also demonstrates no statistically significant differences between parity group in the CHIA breed.
The differences, or lack thereof, detected in IgG colostral content between primiparous and multiparous beef cows could be because of the age at the first parity. A significant age difference among the breed in the first and second parity groups was found in the beef cattle included in this study. Primiparous beef cattle are usually older than primiparous dairy cows and have had a greater period of exposure to microorganisms, both pathogens and non-pathogens. Additionally, in beef cattle there is a wide difference in the volume of first-milking colostrum. Primiparous volume is about half of the multiparous, 2.54 and 4.52 L respectively (McGee et al., Reference McGee, Drennan and Caffrey2006). The larger volume of milk produced by multiparous cows could lead to a greater dilution of the immunoglobulin G in the first milked colostrum. This dilution effect could have diminished the ability to detect significantly different concentrations of IgG between colostrum from primiparous and multiparous cows. Similarly, given that multiparous cows are older, the dilution affect would also confound testing of age-related differences in colostrum IgG. In this study, no statistically significant differences were detected between beef and dairy cows with three or more parity.
Previous studies in dairy cows recommended a Brix percentage value between 20 to 23% to identify high quality colostrum (Bielmann et al., Reference Bielmann, Gillan, Perkins, Skidmore, Godden and Leslie2010; Quigley et al., Reference Quigley, Lago, Chapman, Erickson and Polo2013). Vandeputte and colleagues (2014) suggested a 22.5% Brix cut-point to classify colostrum with an IgG concentration higher than 50 g/l in beef cattle (Vandeputte et al., Reference Vandeputte, Detilleux and Rollin2014). The definition of a reasonable cut-point must ensure an adequate IgG mass to the calf in the first 12 h. Even though our data corresponds to values recommended by previous research in Holstein Friesian (20% Brix), there are differences for colostrum from beef cattle. Our cut-point values (with high sensitivity and specificity) in Chianina (16%) and Podolica (17%) cows are lower than the suggested cut points of 20–23% in dairy cows and 22.5% in beef cows (Charolais and Limousine beef cows) (Vandeputte et al., Reference Vandeputte, Detilleux and Rollin2014). These differences require further investigation using an optical Brix refractometer.
The use of a cut-point below optimal would increase the percentage of first-milking colostrum with lower IgG concentration being classified as adequate. If Chianina and Podolica colostrum was evaluated using the recommended higher value for dairy breeds (23%) some (32 and 21.5% respectively) would be misclassified as inadequate. This false negative result would require more time, effort, and cost to a producer since they must ensure a proper passive transfer to have healthy calves. Using valid cut-off data, performing an on-farm screening of colostrum quality by Brix refractometer could ensure the correct mass of IgG is given to the calf in the first hours after calving. This could be especially advantageous in beef cattle breeds due to the reduced volumes of colostrum produced.
The correlation coefficient between RID and Brix values differed among the three breeds with the highest value in Podolica (0.92), the lowest in Chianina (0.63) and 0.84 in Holstein Friesian. Some factors that might influence the correlation include volume and the content of non-immunoglobulin protein in the colostrum which most likely interferes with the accuracy of the Brix refractometer. Fat proportion and other milk proteins have been reported to alter the results obtained by refractometer (Fox et al., Reference Fox, Uniacke-Lowe, McSweeney and O'Mahony2015). Therefore, it is plausible that the different non-IgG compositions of the colostrum between the breeds in this study probably interfered with the refractive index of the Brix refractometer as has been suggested by other authors (Bielmann et al., Reference Bielmann, Gillan, Perkins, Skidmore, Godden and Leslie2010).
In conclusion, this study confirms that breed and parity can influence the colostral IgG concentration and consequently the amount of immunoglobulin G mass that the calf consumes in the first hours after calving. Given this, it may be necessary to pay more attention to the calves born from cows in specific parity groups among the different breeds. Because of the differences that have been detected, it is essential to use an on-farm tool to ensure that newborn calves receive adequate passive transfer of immunoglobulins in the colostrum. Digital Brix refractometer can provide an acceptable test sensitivity and specificity and requires minimal cost and time for the farm. The optimal cut-point value to detect a low-quality colostrum is generally considered to be <20% but this study has found that breed-related cut-points should be determined as we found the optimum to be lower in beef cattle breeds (16% Chianina, 17% Podolica). Digital Brix refractometer should be utilized in a daily colostrum monitoring program for beef cattle breeding, not only in the dairy farm environment. Colostrum monitoring is necessary to guarantee the appropriate amount of IgG to the calf and improve neonatal calf health.
Supplementary material
The supplementary material for this article can be found at https://doi.org/10.1017/S0022029921000315