


1 Introduction
Social scientists have long been interested in understanding the networks that organize the relationships among actors engaged in a collective activity. Mapping networks in this way helps scholars answer many questions about how actors form communities, what they gain from doing so, and how those communities intersect, evolve, and govern various social interactions. More recently, network analysis has benefited from advances in computing, which offer unprecedented capacity to record and analyze large quantities of political interactions (Hoff, Raftery, and Handcock Reference Hoff, Raftery and Handcock2002; Lazer et al. Reference Lazer, Brewer, Christakis, Fowler and King2009; Ward, Stovel, and Sacks Reference Ward, Stovel and Sacks2011; Box-Steffensmeier and Christenson Reference Box-Steffensmeier and Christenson2014; Hadden Reference Hadden2015). Consequently, researchers have successfully partitioned massive networks of social and political actors into similarly-behaving communities that are simpler to understand (Barberá Reference Barberá2014; Bond and Messing Reference Bond and Messing2015; Desmarais, La, and Kowal Reference Desmarais, La Raja and Kowal2015).
Despite advances in community detection methods (Newman Reference Newman2006), however, existing approaches seldom account for various important properties of political networks. We focus on three of these properties. First, political actors often come in distinct types that determine the nature of their interactions. In particular, bipartite networks, formed by interactions between two types of actors, are prevalent in politics. Examples include the interactions between voters and politicians, politicians and pieces of legislation, private firms and government entities, and democratic and autocratic countries. Ignoring this extra network structure may severely compromise the validity of network analyses (Larremore, Clauset, and Jacobs Reference Larremore, Clauset and Jacobs2014). Second, these interactions are often driven by mixed memberships in political communities, wherein actors may have multiple interests, motivations, or roles that drive their behaviors (Gray and Lowery Reference Gray and Lowery2000; Heaney Reference Heaney2004). For instance, a politician may interact with voters sometimes as a party leader but other times as a local representative. Finally, a pair of actors may have mixed interactions that combine different alignments of their motivations. For instance, how much a citizen contributes to a politician’s campaign may depend on how much they agree with the politician’s views on many issues.
To date, no network model captures all three properties at once. We therefore develop a new methodology for inferring political actors’ latent memberships in communities that drive their observable interactions. The proposed Bipartite Link Community Model (biLCM) departs from existing community detection models in the literature by accounting for the above properties. We derive and implement an Expectation-Maximization (EM) algorithm (Dempster, Laird, and Rubin Reference Dempster, Laird and Rubin1977) to efficiently estimate the biLCM, allowing researchers to apply this method to bipartite networks with mixed memberships and interactions and thereby measure how actors’ activity is distributed across communities.
To illustrate the advantages of the biLCM methodology over existing community detection models, we apply the biLCM to identify legislative communities of special interest groups and politicians in the U.S. Congress. Scholars have long been interested in studying the relationships between interest groups and elected officials in order to better understand who influences legislation and how they exert that influence (Austen-Smith and Wright Reference Austen-Smith and Wright1992; Potters and Van Winden Reference Potters and Van Winden1992; Wright Reference Wright1996; Grossman and Helpman Reference Grossman and Helpman2001). Early empirical works, such as Wright (Reference Wright1990) and Heinz et al. (Reference Heinz, Laumann, Nelson and Salisbury1993), investigated these interactions based on interviews with lobbyists, interest groups, and politicians. Though these inquiries have yielded many insights, they are limited in scope and treat only a few policy domains in isolation. Providing a rich and large-scale political map of this network, on the other hand, has been limited both by the available data and by the absence of an appropriate methodology.
We therefore begin by building a dataset that identifies a type of political connection between interest groups and members of Congress by combining two types of political behavior related to a bill: (1) which politician sponsored the bill and (2) which interest groups lobbied the bill. Our dataset is distilled from a larger database of lobbying data, which we build by applying natural language processing techniques on mandatory reports filed by lobbyists to identify the interest groups that lobbied on 108,086 congressional bills introduced between the 106th and 114th Congress.Footnote 1 Although lobbying on a bill does not necessarily imply political ties to its sponsor, recurring instances of lobbying that involve the same interest group and sponsor on numerous bills do reliably indicate a shared involvement on specific political issues. Therefore, analyzing how often various politicians and interest groups interact in this way lets us infer the structure of political issue networks in the legislative process.
We then apply the biLCM to measure participation in legislative issue domains for each interest group and politician. The results are instructive for understanding the different ways in which interest groups pursue lobbying in the U.S. Congress. First, we find that “specialist” and “generalist” interest groups coexist in U.S. legislative politics. Namely, some interest groups engage in targeted lobbying of members of committees that have jurisdiction over their narrow interests. Meanwhile, other interest groups, particularly those that represent the varied interests of many members (such as the Chamber of Commerce), target politicians who are members of broad “power committees” such as the House Committee on Ways and Means and the Senate Committee on Appropriations (Fenno Reference Fenno1973).
Second, we find that it is rare for a diverse collection of specialist interest groups to lobby on the same legislation. Our models confirm statistically that most interest groups lobby in just a few issue areas that are directly related to their mission. This suggests that the underlying nature of the lobbying network is different from other types of political interactions that tend to be structured by ideology, such as campaign contributions (Bonica Reference Bonica2013; Desmarais et al. Reference Desmarais, La Raja and Kowal2015) and social media connections (Barberá Reference Barberá2014; Bond and Messing Reference Bond and Messing2015). In fact, our model identifies just one major issue area that is lobbied by diverse interest groups: legislation concerning social and human rights issues. This quantitative finding is consistent with Hojnacki (Reference Hojnacki1997), who found that civic groups tend to participate in interest group alliances rather than lobbying alone.
Finally, by identifying connections that deviate most from the predictions of the biLCM, we are able to distinguish genuinely significant political connections from routine alignments of lobbying and legislative activity, such as energy firms lobbying on energy bills written by members of an energy committee. The special connections we identify in this way often coincide with campaign contributions, geographic ties between politicians and interest groups, or disruptive and industry-changing legislation.
To the best of our knowledge, ours is the first network model that accounts for all three of bipartite structure, mixed membership, and mixed interactions. Latent space models, for example, cannot explicitly describe mixed memberships. As Minhas, Hoff, and Ward (Reference Minhas, Hoff and Ward2019) have suggested, these models confound actors belonging to a single community with actors belonging to similar combinations of many communities; in our setting, they would suggest that the Chamber of Commerce and the Specialty Equipment Market Association must have similar interests merely because both lobby on a wide range of legislation. On the other hand, while stochastic block models have been adapted separately to bipartite networks (Larremore et al. Reference Larremore, Clauset and Jacobs2014) and mixed memberships (Airoldi et al. Reference Airoldi, Blei, Feinberg and Xing2008), they are not well-suited to describing mixed interactions. In our setting, they would require that the numerous interactions between a pair of powerful actors like Senator Barbara Boxer (D-CA) and the Chamber of Commerce all arise from a single shared issue of interest. Our model avoids both of these pitfalls, and provides more refined insights than both latent space models and stochastic block models, distinguishing shared broad interests from shared focused interests and numerous interactions on different issues from numerous interactions on the same issue.
The open-source software polnet is available as an R package for implementing the proposed methods. The replication materials for this paper are available through the Political Analysis Dataverse (Kim and Kunisky Reference Kim and Kunisky2020a) and Code Ocean (Kim and Kunisky Reference Kim and Kunisky2020b). The network data, the estimated community memberships of political actors, ancillary results from other models, and the visualization tools used in preparing this paper will be made publicly available at https://www.lobbyview.org (Kim Reference Kim2018).
2 The Bipartite Link Community Model
In this section, we propose a statistical model of bipartite networks of interactions between two types of actors, the Bipartite Link Community Model (biLCM). We first motivate the methodology in the context of interest groups’ interactions with politicians. We then give an abstract mathematical formulation and derive an EM algorithm to estimate the model parameters, giving a scalable implementation of the proposed method that can be applied by other researchers to analyze bipartite networks found in American politics, international relations, sociology, and political economy.
2.1 Motivation
Political networks are often organized into distinct communities Footnote 2 within which actors typically interact. Researchers have found that members of Congress form partisan communities in cosponsorship networks (Zhang et al. Reference Zhang, Friend, Traud, Porter, Fowler and Mucha2008), while larger congressional units such as committees and subcommittees form more complex communities according to subject matter (Porter et al. Reference Porter, Mucha, Newman and Warmbrand2005). Interest groups and politicians also form communities who interact via campaign contributions (Desmarais et al. Reference Desmarais, La Raja and Kowal2015). Our goal is to identify a different type of interest group–politician community, which we call a legislation community: a collection of groups and legislators that are interested in the same bills.Footnote 3
Perhaps the most common model of communities in networks is the stochastic block model (SBM) of Fienberg and Wasserman (Reference Fienberg and Wasserman1981), which Larremore et al. (Reference Larremore, Clauset and Jacobs2014) adapted to bipartite networks as the bipartite stochastic block model (biSBM). In these models, each political actor belongs to one community, and interactions depend only on actors’ respective memberships. Often, the network structure is assortative, meaning that actors interact more when they share a community, and less when they do not.
The first problem with the biSBM for our purposes is that it assigns each actor to only one community. That may be fine if the scholar is interested only in knowing the community in which an actor spends a plurality of time, but it leaves out a great deal of detail about community structure. In reality, political actors often have mixed memberships, meaning they participate in multiple communities. This can occur when actors have heterogenous interests across various policy domains or represent the interests of diverse constituents. For instance, an oil energy firm might be interested in both restrictions on utility providers and automotive pollution regulation.
Similarly, most members of Congress are interested in numerous policy domains (Lauderdale and Clark Reference Lauderdale and Clark2014) and sit on several committees that have distinct legislative jurisdictions. To account for this, we need to allow political actors to have simultaneous memberships of varying strengths in all legislation communities.
One prominent model in the SBM family that incorporates this enhancement is the mixed-membership stochastic block model (mmSBM) (Airoldi et al. Reference Airoldi, Blei, Feinberg and Xing2008). In this model, each actor has a probability distribution over communities. When two actors interact, they “roll the dice” to choose which community they will belong to for all of their interactions; how many times they interact depends only on that choice of communities. Panels (a) and (b) of Figure 1 illustrate how the biSBM differs from the mmSBM: the biSBM (panel (a)) assumes that each actor belongs to only one community (indicated by color), and members in the same community tend to interact more frequently with each other than with actors in other communities. In contrast, the mmSBM (panel (b)) allows an actor to act in different communities for different interactions.Footnote 4

Figure 1 Schematic comparison of community models. We illustrate three generative network models: the biSBM, the mmSBM, and the biLCM. The first two models are illustrated in the assortative case, where each politician community interacts strongly with just one interest group community and vice-versa. Colors indicate community memberships and, in the mixed membership cases, interaction types. (a) In the single membership model, political actors sharing a community interact more frequently. (b) The mmSBM allows for mixed memberships, but all interactions of a single pair of actors are constrained to be of a single type. (c) The biLCM allows for mixed membership as well as mixed interaction types. This captures political interactions in which actors with diverse memberships interact repeatedly for different political reasons.
Although the mmSBM has some desirable features, it does not allow for mixed interactions: an actor cannot be part of more than one community when interacting with a given counterpart. For modeling interactions between interest groups and politicians, this is a severe limitation. For example, the Chamber of Commerce interacted repeatedly with the same legislator, Senator Barbara Boxer (D-CA), by lobbying three diverse bills: 113th S. 601 “Water Resources Development Act of 2013,” 113th S. 462 “United States-Israel Strategic Partnership Act of 2013,” and 113th S. 809 “Genetically Engineered Food Right-to-Know Act.” A human analyst tasked with identifying legislation communities would certainly not conclude that all three bills belong to a single issue area. Yet a model in the mmSBM family would bizarrely insist that a single common community membership must account for every interaction involving the two actors.
To overcome this limitation, instead of modeling each interaction as a mixture of possible interactions in different communities, we model each interaction as a sum of independent interactions in all possible communities. Panels (b) and (c) of Figure 1 illustrate this difference. Under our model, illustrated in panel (c), interactions between a single pair of actors can belong to multiple communities (see also Equation (1) below). In this way, we arrive at a model similar to the link community model (LCM) of Ball, Karrer, and Newman (Reference Ball, Karrer and Newman2011) that we adapt specifically to the bipartite setting. The most similar prior work we are aware of is that of Li, Zhang, and Zhang (Reference Li, Zhang and Zhang2015), who treat the link community detection task in bipartite graphs as an optimization problem that they solve with an ad hoc genetic algorithm. Unlike that work, our model provides an underlying probabilistic generative model and therefore a statistical interpretation.
In summary, motivated by examples from interest group lobbying, we posit that political actors are organized into legislation communities, that actors are often members of multiple communities, and that two actors may interact in more than one community. As we will see, this allows us to accurately describe the activity of both powerful actors with broad interests and less prominent actors with narrower interests within the same model.
2.2 The Model
We now give a general mathematical description of the biLCM. Suppose that we have two disjoint groups of political actors, U and V, which we index by  $i \in U = \{ 1,\dots , m\}$ and
  $j \in V = \{1,\dots , n\}$. We denote the number of interactions between the pair
  $i, j$ by
  $A_{i, j}$, and organize these numbers as the entries of the interaction matrix
  $\mathbf {A} \in \mathbf {R}^{m \times n}$. This matrix may be viewed as the adjacency matrix of a bipartite graph with weighted edges, where actors in the groups U and V lie on opposite sides of the partition.
We suppose that interactions occur in k “link communities” (a generic term for “legislation communities” from the presentation above), which we index by  $z \in \{1, \dots , k\}$. Each actor i and j has a vector of parameters
  $\alpha _{i,z}$ and
  $\beta _{j, z}$, respectively, which represents their involvement in community z. The number of total interactions between i and j in community z is modeled as Poisson with a mean proportional to
  $\alpha _{i, z}\beta _{j, z}$. To impose parameter identification, we assume that for each fixed z,
  $\sum _{i = 1}^m\alpha _{i, z} = \sum _{j = 1}^n \beta _{j, z} = 1$, and we introduce another parameter
  $\kappa _z$ to capture the overall level of activity in community z, so that the number of interactions between i and j in community z has mean
  $\kappa _z \alpha _{i, z}\beta _{j, z}$. We assume that these Poisson variables are independent, thus the joint distribution of the interaction matrix is
 $$ \begin{align} \mathbf{P}(\mathbf{A} \mid \boldsymbol{\alpha}, \boldsymbol{\beta}, \boldsymbol{\kappa}) = \prod_{i = 1}^m \prod_{j = 1}^n \text{Poisson}\left(A_{i, j} \hspace{0.1cm} \bigg| \hspace{0.05cm} \sum_{z = 1}^k \kappa_z \alpha_{i, z}\beta_{j, z}\right). \end{align} $$
2.3 Estimation
We derive an EM algorithm for this model in Appendix B.1. The algorithm alternates expectation and maximization update steps until the log-likelihood of the model converges. The update equations produced by our derivation are given below, including ancillary optimization parameters  $q_{i, j}(1), \dots , q_{i, j}(k)$. The first equation is the expectation step for the ancillary parameters, and the last three equations are maximization steps for the model parameters.
 $$ \begin{align} q_{i, j}(z) &= \frac{\kappa_z \alpha_{i, z}\beta_{j, z}}{\sum_{z = 1}^k \kappa_z \alpha_{i, z}\beta_{j, z}}, \end{align} $$
 $$ \begin{align} \kappa_{z} &= \frac{\sum_{i = 1}^m \sum_{j = 1}^n A_{i, j}q_{i, j}(z)}{\sum_{i = 1}^m \sum_{j = 1}^n \alpha_{i, z}\beta_{j, z}}, \end{align} $$
 $$ \begin{align} \alpha_{i, z} &= \frac{\sum_{j = 1}^n A_{i, j}q_{i, j}(z)}{\sum_{i = 1}^m \sum_{j = 1}^n A_{i, j}q_{i, j}(z)}, \end{align} $$
 $$ \begin{align} \beta_{j, z} &= \frac{\sum_{i = 1}^m A_{i, j}q_{i, j}(z)}{\sum_{i = 1}^m \sum_{j = 1}^n A_{i, j}q_{i, j}(z)}. \end{align} $$
In practice, because the EM algorithm is not guaranteed to converge to the maximum likelihood parameters, we perform 50 randomly initialized runs and choose the parameters that attain the highest likelihood value.
3 Empirical Findings
In this section, we use the biLCM to better understand the structure of a lobbying network involving interest groups and legislators. We begin by introducing an original database of lobbying data. We then apply the biLCM to a specific dataset concerning the 113th Congress and present the estimated mixed community memberships of interest groups and legislators.Footnote 5 Our analysis illustrates a clear distinction between “specialist” and “generalist” interest groups and identifies the legislators connected to both types. We also describe what issues drive specialist interest groups to lobby outside of their domains, and we analyze a class of anomalous political connections identified by the biLCM. Finally, we discuss the benefits of this methodology over other network models.
3.1 The Lobbying Network Database
All lobbying organizations are required by law to file quarterly reports describing the issues on which lobbyists have engaged in political activities, including lobbied bills. However, organizations need not identify their political contacts. This is unfortunate, since almost 90% of lobbying reports indicate that at least one member of Congress or member of their staff was contacted.
Because we cannot directly observe lobbying interactions, we construct an original lobbying database that indirectly captures the connections between interest groups and politicians. Our database is built from the universe of reports filed between 1999 and 2017.Footnote 6 We use a suite of automated systems to (1) identify lobbied bills, (2) identify the session of Congress that those bills were introduced in, and (3) identify each bill’s sponsor. We briefly outline this process below.
First, we analyze more than two million “specific lobbying issues” found in the lobbying reports, which refer to lobbied bills by either number or title.Footnote 7 In practice, bills are often referenced by alternative names or subtitles, so bill references must be algorithmically identified. Second, we identify the session of Congress that each bill belongs to, which the report often does not mention explicitly. This empirical challenge has prevented prior works from analyzing lobbying accurately. To overcome this difficulty, we mine several signals from the report text to predict the session number, including phrases like “Act of [YEAR],” other bills identified in the same report, and similarity between bill texts and the report text mentioning them.Footnote 8 Next, we record the politicians sponsoring each bill. Finally, we identify all the actors of the lobbying sector (lobbyists, their lobbying firms, the interest groups that hire them, and so forth) that are involved in lobbying on each bill. We repeat this process for each of 1,111,859 lobbying reports, which in total link 20,092 special interest groups with 1,164 (current and former) members of Congress.
The left panel of Figure 2 shows that about 12,000 bills are introduced in each Congress and the majority of them are lobbied by at least one interest group. Very few of these bills make it to a vote as written, however. Instead, they tend to be merged into larger bills following a complex process of amendment and compromise. Importantly, we observe interactions before this noisy process takes place, and thus we witness the lobbying network at a particularly granular level.Footnote 9 Indeed, as the right panel shows, most bills are lobbied by very few interest groups, suggesting that each individual instance of lobbying tends to reflect narrow interests. A typical example: on “A bill to exempt the aging process of distilled spirits from the production period for purposes of capitalization of interest costs” (113th S. 1457), sponsored by Senator Mitch McConnell (R-KY), the Distilled Spirits Council was the only interest group to lobby.Footnote 10 This bill has never been voted on in the Senate, and therefore would never appear in roll call data.

Figure 2 Descriptive statistics of lobbying. The left panel presents the numbers of bills introduced, lobbied, and voted on in each session from the 106th through the 114th Congress. Note that the increase in the number of bills lobbied beginning with the 110th Congress is likely a function of the digitization of lobbying records and does not necessarily reflect an actual increase in lobbying. The right panel shows how many interest groups lobbied on each bill introduced in the 113th Congress. The distribution is highly skewed: the median is three while the maximum is 946 (on 113th H.R. 1, “Tax Reform Act of 2014”), and 23% of lobbied bills are lobbied by only one interest group.
3.2 Findings of the Bipartite Link Community Model
We now apply the biLCM to lobbying in the 113th Congress. To produce a suitable dataset, we take  $A_{i,j}$ to count the number of bills interest group i lobbied that politician j sponsored (see Appendix A.2 for further details on the data used in this section). We then estimate the parameters of the biLCM using
  $k = 8$ legislation communities.Footnote 11
We name the legislation communities that result by examining the interest groups that interact in them most frequently. Some involve straightforward collections of industry- or issue-specific groups: “Healthcare,” “Veterans’ Affairs,” “Technology & Telecommunications,” “Energy,” and “Finance & Insurance.” Others are broader: one, which we name “Universities & Research,” involves a mix of universities and aerospace and defense research firms (Cray, General Dynamics). Another, named “Civil Society,” includes leading civil rights associations (ACLU) as well as lobby organizations for the rights of workers (AFL-CIO), senior citizens (AARP), women (National Women’s Law Center), the disabled (Easter Seals), and others. The last, named “Retail & Transportation,” includes agricultural groups (National Corn Growers), manufacturing associations (National Association of Manufacturers), automotive firms (Nissan), retailers (Home Depot), and fuel manufacturers (British Petroleum).
To illustrate the information the biLCM provides, in the table of Figure 3 we present legislation community memberships for six interest groups that illustrate the range of lobbying behaviors the biLCM identifies in the network. Firms such as Microsoft and Arch Coal lobby on a single topic, thus they interact with politicians in a single legislation community (“Technology & Telecommunications” and “Energy,” respectively) with probability at least 85%. Firms with broader interests, such as McAfee, Inc. and British Petroleum, lobby primarily in two or three arenas. For instance, McAfee, Inc., a computer security firm, lobbied on 113th S. 1429 “Department of Defense Appropriations Act” (as did defense firms such as General Dynamics and Northrop Grumman) and 113th H.R. 756 “Cybersecurity Enhancement Act” (as did technology firms including Microsoft and Google). Accordingly, McAfee, Inc. interacts in the “Technology & Telecommunications” community with probability 31% and in the “Universities & Research” community with probability 52%. Large holding companies such as Philips North America or organizations such as the Chamber of Commerce lobby most categories of legislation, interacting in any single community with probability no more than 25%. We present analogous examples for politicians in Table F.1, finding that the legislators with the most legislation community memberships are often senior politicians or party leaders.
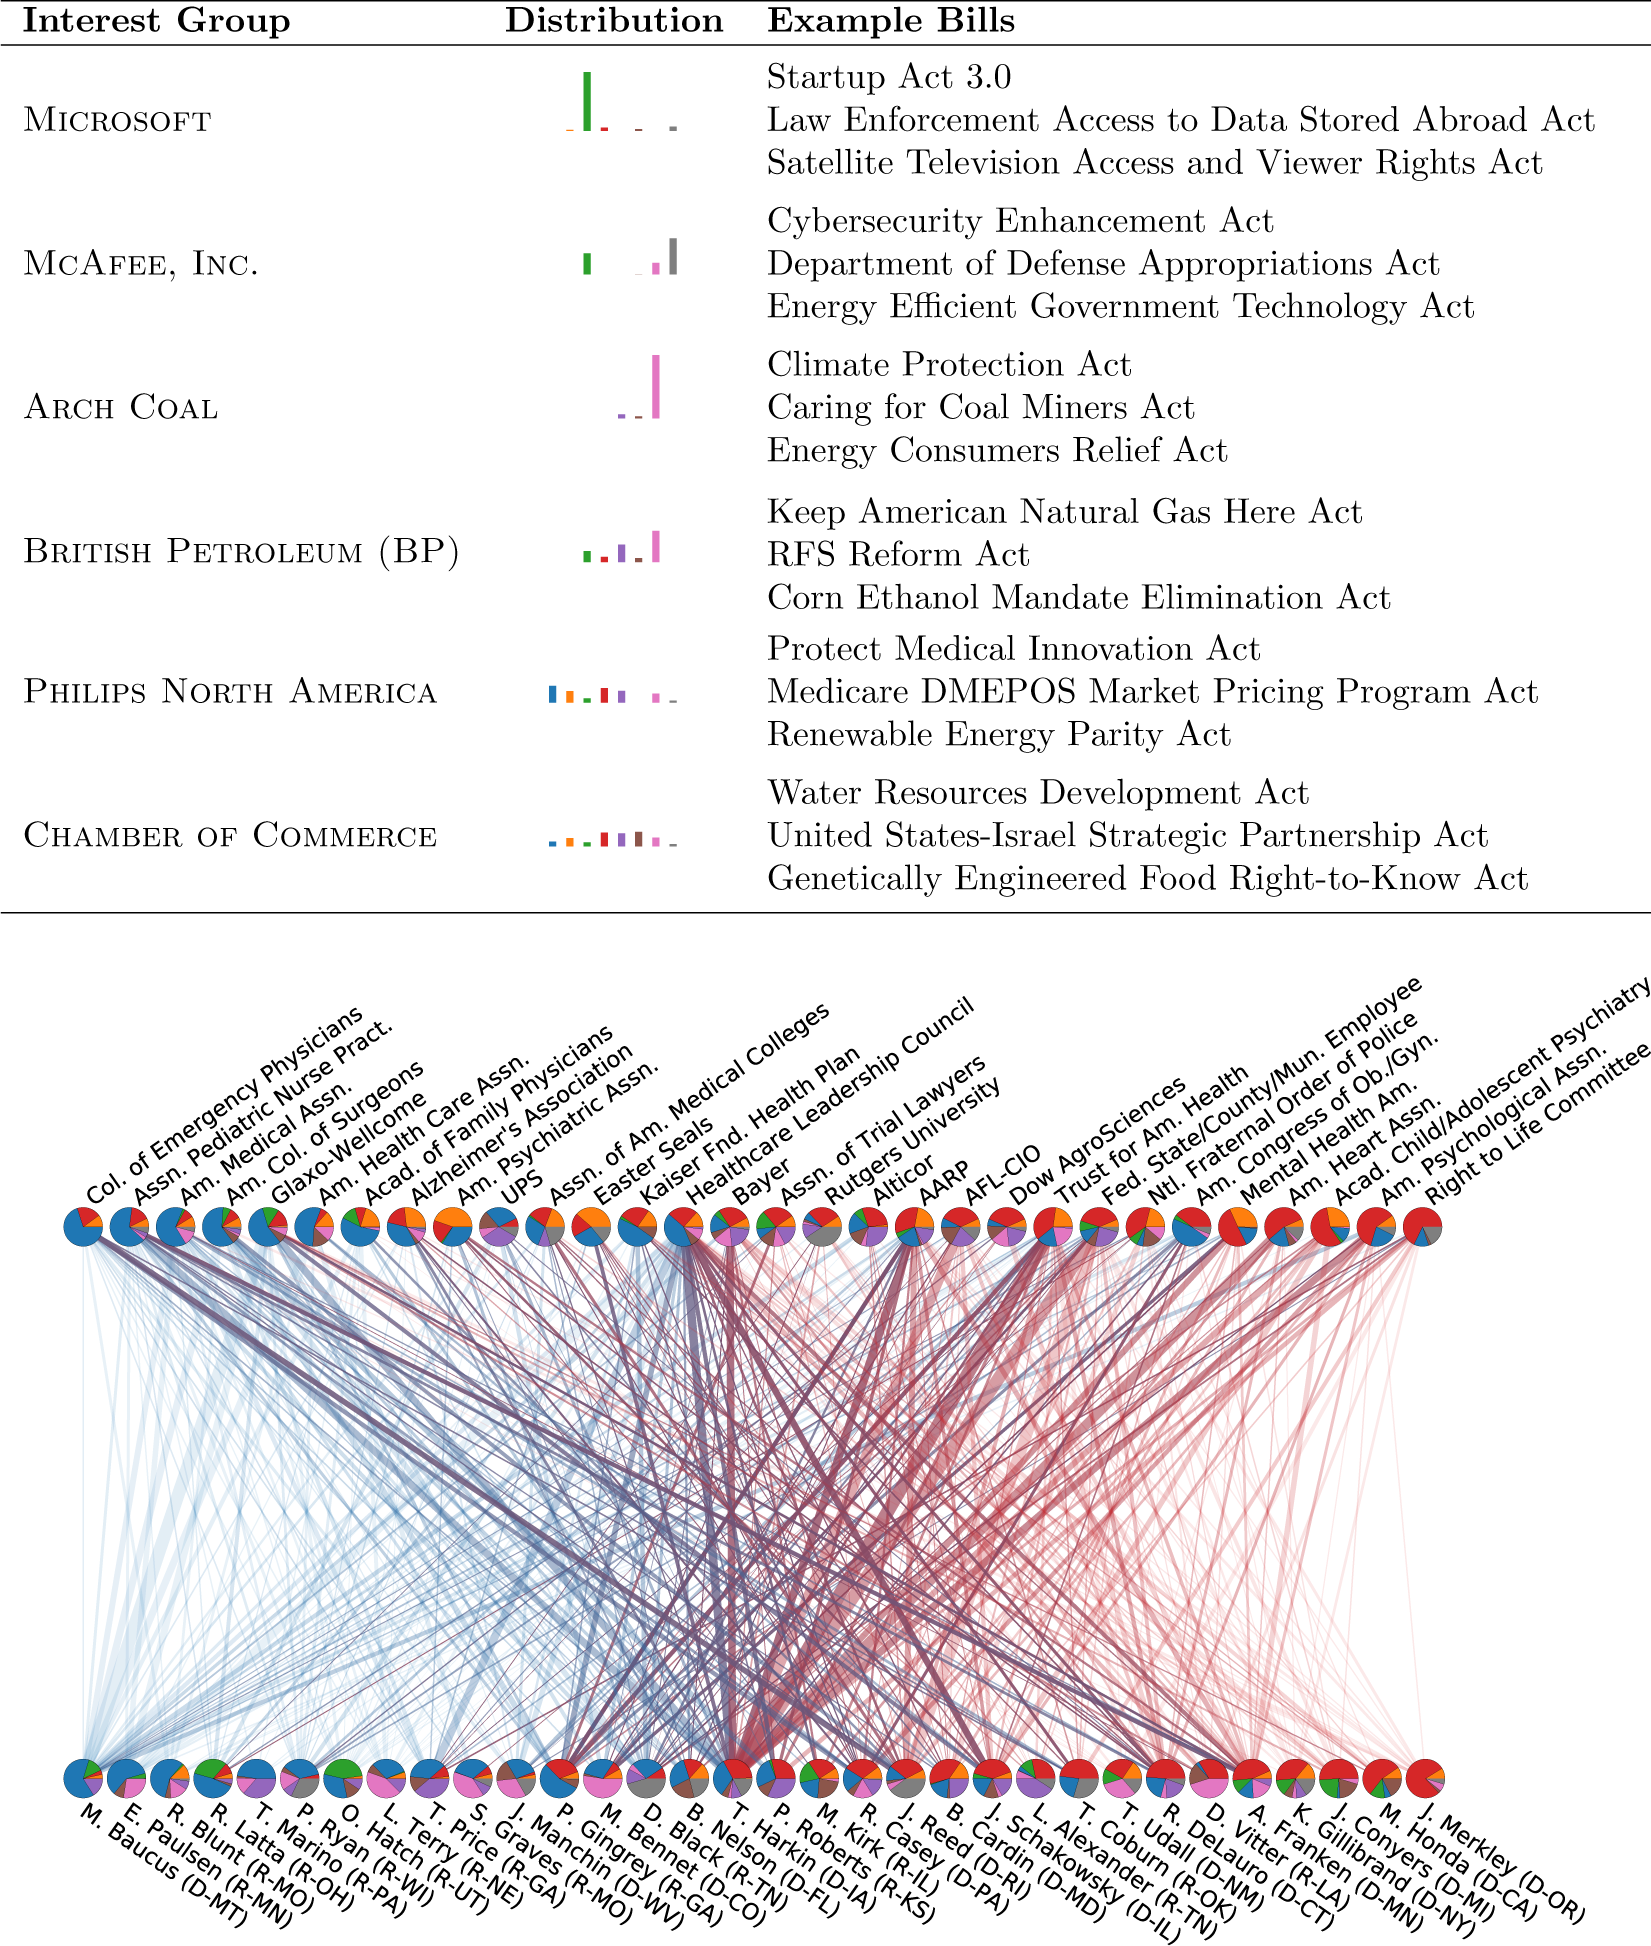
Figure 3 Legislation communities in the biLCM. In the table at the top, we give examples of interest groups, their legislation community memberships, and examples of bills that they lobbied. Memberships are plotted as histograms, with eight bars for the eight communities in the biLCM. In the bottom plot, we show mixed interactions between actors in the “Healthcare” and “Civil Society” communities within the lobbying network. Links indicate the number of interactions belonging to these communities under the biLCM, and color indicates their distribution between the two communities.
To demonstrate the network structure we find, we plot part of the lobbying network in the bottom panel of Figure 3. We show actors involved in the “Healthcare” and “Civil Society” communities as well as the classification of their interactions by the biLCM. We show interactions occurring in one community (vertical links on the left and right) in lighter colors and mixed interactions (diagonal links and vertical links in the center) in darker colors. As the figure shows, many repeatedly interacting interest group–politician dyads have interactions that belong to different communities. Thus the mixed interactions modeled by the biLCM are crucial to accurately describing the lobbying network.
Before proceeding, we describe a simple way to quantify how many different legislation communities an actor actively participates in. From the model definition, the mean total number of times interest group i lobbies in community z equals  $\kappa _z\alpha _{i, z}$, and likewise
  $\kappa _z\beta _{j, z}$ for politician j. A natural choice is then to form probability distributions
  $p_{i, z} = \frac {\kappa _z\alpha _{i, z}}{\sum _{z = 1}^k \kappa _z \alpha _{i, z}}$ and
  $q_{i, z} = \frac {\kappa _z \beta _{j, z}}{\sum _{z = 1}^k \kappa _z \beta _{j, z}}$, and consider the entropies
  $H_i = H(p_{i, 1}, \dots , p_{i, k})$ and
  $H_j = H(q_{j, 1}, \dots , q_{j, k})$, where
  $H(c_1, \dots , c_k) = -\sum c_z\log _2 c_z$. An entropy of H may then be interpreted as, roughly speaking, an actor typically participating in
  $2^H$ legislation communities. Simply put, actors with higher entropy values are members of more legislation communities than actors with lower entropy values.
Committees Associated with Specific Communities
We study the congressional committee memberships of politicians that interact in a small number of legislation communities and the memberships of politicians that interact in many legislation communities. In Figure 4, we draw bar plots of committee memberships for three groups of legislators: legislators who interact with probability at least 40% in the “Finance & Insurance” community, legislators who interact with probability at least 40% in the “Veterans’ Affairs” community, and legislators with entropy at least 2, that is, those who actively participate in at least four different communities.

Figure 4 Committee membership of politicians by community. We present bar plots of the top 10 committee memberships for legislators in different legislation communities found by the biLCM. Bars are divided by political party (red for Republican and blue for Democrat), and the horizontal bars at the top show the overall party distribution of each community. (For reference, 52% of members of the 113th Congress were Republican.)
The first two groups of politicians have committee memberships that are concentrated in committees relevant to the subject matter of their community, such as the House Committee on Financial Services and the House Committee on Armed Services. In contrast, the high-entropy politicians have committee memberships on so-called “power committees,” such as the House Committee on Ways and Means and the Senate Committee on Appropriations. These committees hold the “power of the purse,” controlling various financial aspects of governance (Fenno Reference Fenno1966).Footnote 12
Lobbying Beyond Specific Interests
Analyzing interest group alliances in lobbying using the available data is a subtle matter, as the data do not distinguish between lobbying for or against a given piece of legislation. Instead, we analyze a more general question: when do nominally domain-specific interest groups broaden their lobbying activity and lobby on legislation outside of their main interest area?
We indeed occasionally observe such lobbying in our data. For instance, the Sierra Club, an environmentalist organization that typically lobbies bills such as 113th H.R. 3826 “Protecting States, Opening National Parks Act,” also lobbied 113th H.R. 3206 “Global Sexual and Reproductive Health Act of 2013” as did Planned Parenthood. As another example, the Outdoor Industry Association, an outdoor recreation trade organization that typically lobbies bills such as 113th H.R. 5204 “Federal Lands Recreation Enhancement Modernization Act of 2014,” also lobbied 113th H.R. 1389 “Military Access to Reproductive Care and Health (MARCH) for Military Women Act.” Not surprisingly, Planned Parenthood also lobbied this bill. Accordingly, the Sierra Club and the Outdoor Industry Association participate in the “Civil Society” legislation community with probability 33% and 19%, respectively.
Observing numerous examples like these and examining the corresponding community memberships, we find one dominant pattern: when interest groups broaden their interests, it is to lobby on social issues, as represented by involvement in the “Civil Society” community. Indeed, that is the only community that appears not to admit a description in terms of a specific industry or issue. On the other hand, that community is only the fourth most active out of eight (assessing this by the  $\kappa _z$ model parameters), and thus accounts for only a modest fraction of lobbying activity. Therefore, we find evidence that narrow, industry-specific interests remain the primary determinant of lobbying activity, and other motivations play at most a secondary role. That lobbying outside of domain-specific interests is concentrated on social issues is compatible with Hojnacki (Reference Hojnacki1997), who suggests that civic groups tend to form lobbying alliances instead of lobbying alone.
Anomalous Connections
Another analysis that emerges from the biLCM is to examine the results that deviate the most from the model’s predictions. We list these connections in Table 1. As we described earlier, our analysis of the results of the biLCM finds that the legislation communities in the lobbying network are organized around actors’ interests: industry-specific groups will lobby politicians with power over that industry; groups with a variety of interests may lobby either a variety of politicians or specific politicians with broad power. The connections in Table 1, in which the numbers of observed interactions exceed those predicted by the biLCM, represent pairs of actors whose interactions must then be driven by a mechanism other than shared interests.
Table 1 Anomalous interactions identified by the biLCM. We list the 10 pairs of legislators and interest groups whose number of observed interactions deviates the most from the predictions of the biLCM. Probabilities are computed directly from Equation (1) using the estimated maximum likelihood parameters.

Indeed, investigating these interactions suggests a range of interesting explanations. In some cases, actors are connected by geography, such as Senator Jeanne Shaheen (D-NH) and Novo Nordisk (a Danish firm whose U.S. operations are headquartered in New Hampshire), and Representative Jim Costa (D-CA) and the Metropolitan Water District of Southern California. In other cases, campaign contributions show a close connection. For instance, iHeartMedia, Inc. both donated to Representative Mike Conaway (R-TX) and Senator John Barrasso (R-WY) and lobbied on bills the legislators sponsored. Finally, sometimes the interest group and politician connect over individual legislation that is important to a relevant industry, such as Representative Tom Marino (R-PA) and CVS (over regulation of opioid distribution), and Senator Michael Enzi (R-WY) and eBay (over internet sales tax). In these cases, the bills in question appear to be particularly important to their sponsors, for instance often appearing in electoral materials or receiving other publicity.
We thus find that the biLCM is a useful means of revealing “exceptional” interactions between politicians and interest groups that go beyond classification according to an issue area structure. In this way, the biLCM finds politician–interest group connections with a range of specific substantive explanations. The biLCM thus may be a useful tool for directing future work on the lobbying network that can investigate theoretical explanations for these connections.
Significance of Communities
How do we know that the community structure identified by the biLCM arises from the structured interactions of interest groups and legislators rather than merely their individual propensities to lobby or sponsor? To provide an answer, we perform a permutation test on the lobbying network to obtain a null distribution of random networks with similar activity distribution of individual actors (see Appendix B.2 for technical details). Since the biLCM can capture both single and multiple community memberships, this is a useful test of the statistical significance of the community structure find with the biLCM. Indeed, we find that interest groups in the null model have much higher numbers of legislation community memberships than do interest groups in model of the actual lobbying network, indicating that the lobbying network has a strong community structure compared to a “typical” similar network.Footnote 13
On the whole, we find that the biLCM successfully describes the multiple community memberships of political actors and how interactions among actors occur in those communities. The proposed methodology allows researchers to quantitatively estimate participation in various communities for each political actor, capturing a community structure that we often cannot directly observe in political networks. In the specific case of legislation communities, the biLCM allows researchers to relate interest groups with specialized and general interests to politicians with narrow and broad political roles. It thereby provides a useful guide to the varied interests and complex preference aggregation that drives lobbying in legislative politics.
3.3 Comparison with Other Models
We now compare the biLCM to two other types of model, latent space models and stochastic block models. We adapt these existing models to our setting, and show that the biLCM is able to distinguish key features of the lobbying network that the other models fail to identify.
3.3.1 Latent Space Models
In this section, we compare the results of the biLCM with an approach based on a latent space model (LSM), a common modeling choice for networks. The model we use for comparison is close to those of Slapin and Proksch (Reference Slapin and Proksch2008) and Barberá (Reference Barberá2014).
The Model
We model the interaction between interest group i and legislator j as a function of the Euclidean distance between the two actors’ latent positions in d-dimensional space,  $\boldsymbol {\theta }_i \in \mathbf {R}^d$ and
  $\boldsymbol {\psi }_j \in \mathbf {R}^d$, respectively, and assume that interactions have independent Poisson distributions.
To account for the differences in actors’ baseline propensities to sponsor or lobby (see Figure F.1), we include interest group- and legislator-specific “popularity” terms,  $\alpha _{i}$ and
  $\beta _{j}$, respectively (Krivitsky et al. Reference Krivitsky, Handcock, Raftery and Hoff2009). We then take the mean of the interaction
  $A_{i,j}$ to be
  $\exp (\alpha _i + \beta _j - \|\boldsymbol {\theta }_i - \boldsymbol {\psi }_j\|_2^2)$. To implement inference, it is more convenient to reparameterize in terms of
  $\tilde {\alpha }_i = \alpha _i - \|\boldsymbol {\theta }_i\|_2^2$ and
  $\tilde {\beta }_j = \beta _j - \|\boldsymbol {\psi }_j\|_2^2$. Then, to impose parameter identification and improve the numerical behavior of sampling, we impose hierarchical priors on the latent space positions and modified popularity factors. The posterior distribution under this model is then given by:
 $$ \begin{align} &\mathbf{P}\left(\boldsymbol{\alpha}, \boldsymbol{\beta}, \boldsymbol{\theta}, \boldsymbol{\psi} \mid \mathbf{A} \right) \propto \prod_{i=1}^m\prod_{j=1}^n \text{Poisson}\left(A_{i, j} \mid \exp(\tilde{\alpha}_i + \tilde{\beta}_j + 2\boldsymbol{\theta}_i^\top \boldsymbol{\psi}_j) \right) \times \nonumber\\ &\hspace{0.75cm} \prod_{i = 1}^m \mathcal{N}\left(\tilde{\alpha}_i \mid 0, \sigma_{I}^2\right) \mathcal{N}\left(\boldsymbol{\theta}_i \mid \mathbf{0}, \text{diag\ }(\boldsymbol{\tau})\right) \times \prod_{j = 1}^n \mathcal{N}\left(\tilde{\beta}_j \mid \nu, \sigma_{P}^2\right) \mathcal{N}\left(\boldsymbol{\psi}_j \mid \mathbf{0}, \text{diag\ }(\boldsymbol{\tau})\right). \end{align} $$
Computation
We estimate our model with the Stan software package (Carpenter et al. Reference Carpenter2017). In Appendix C, we include code describing our model and discuss parameter identification, the choice of dimensionality, the concentration of the posterior distribution, and sampling diagnostics.
Comparison
We now apply the LSM to the lobbying network dataset for the 113th Congress. For the two-dimensional LSM, Figure 5 presents the posterior means of the estimated latent spatial positions,  $\boldsymbol {\theta }_i$ and
  $\boldsymbol {\psi }_j$, for all interest groups i and politicians j, plotted against the DW-NOMINATE ideology dimension for politicians and sized according to popularity factor.
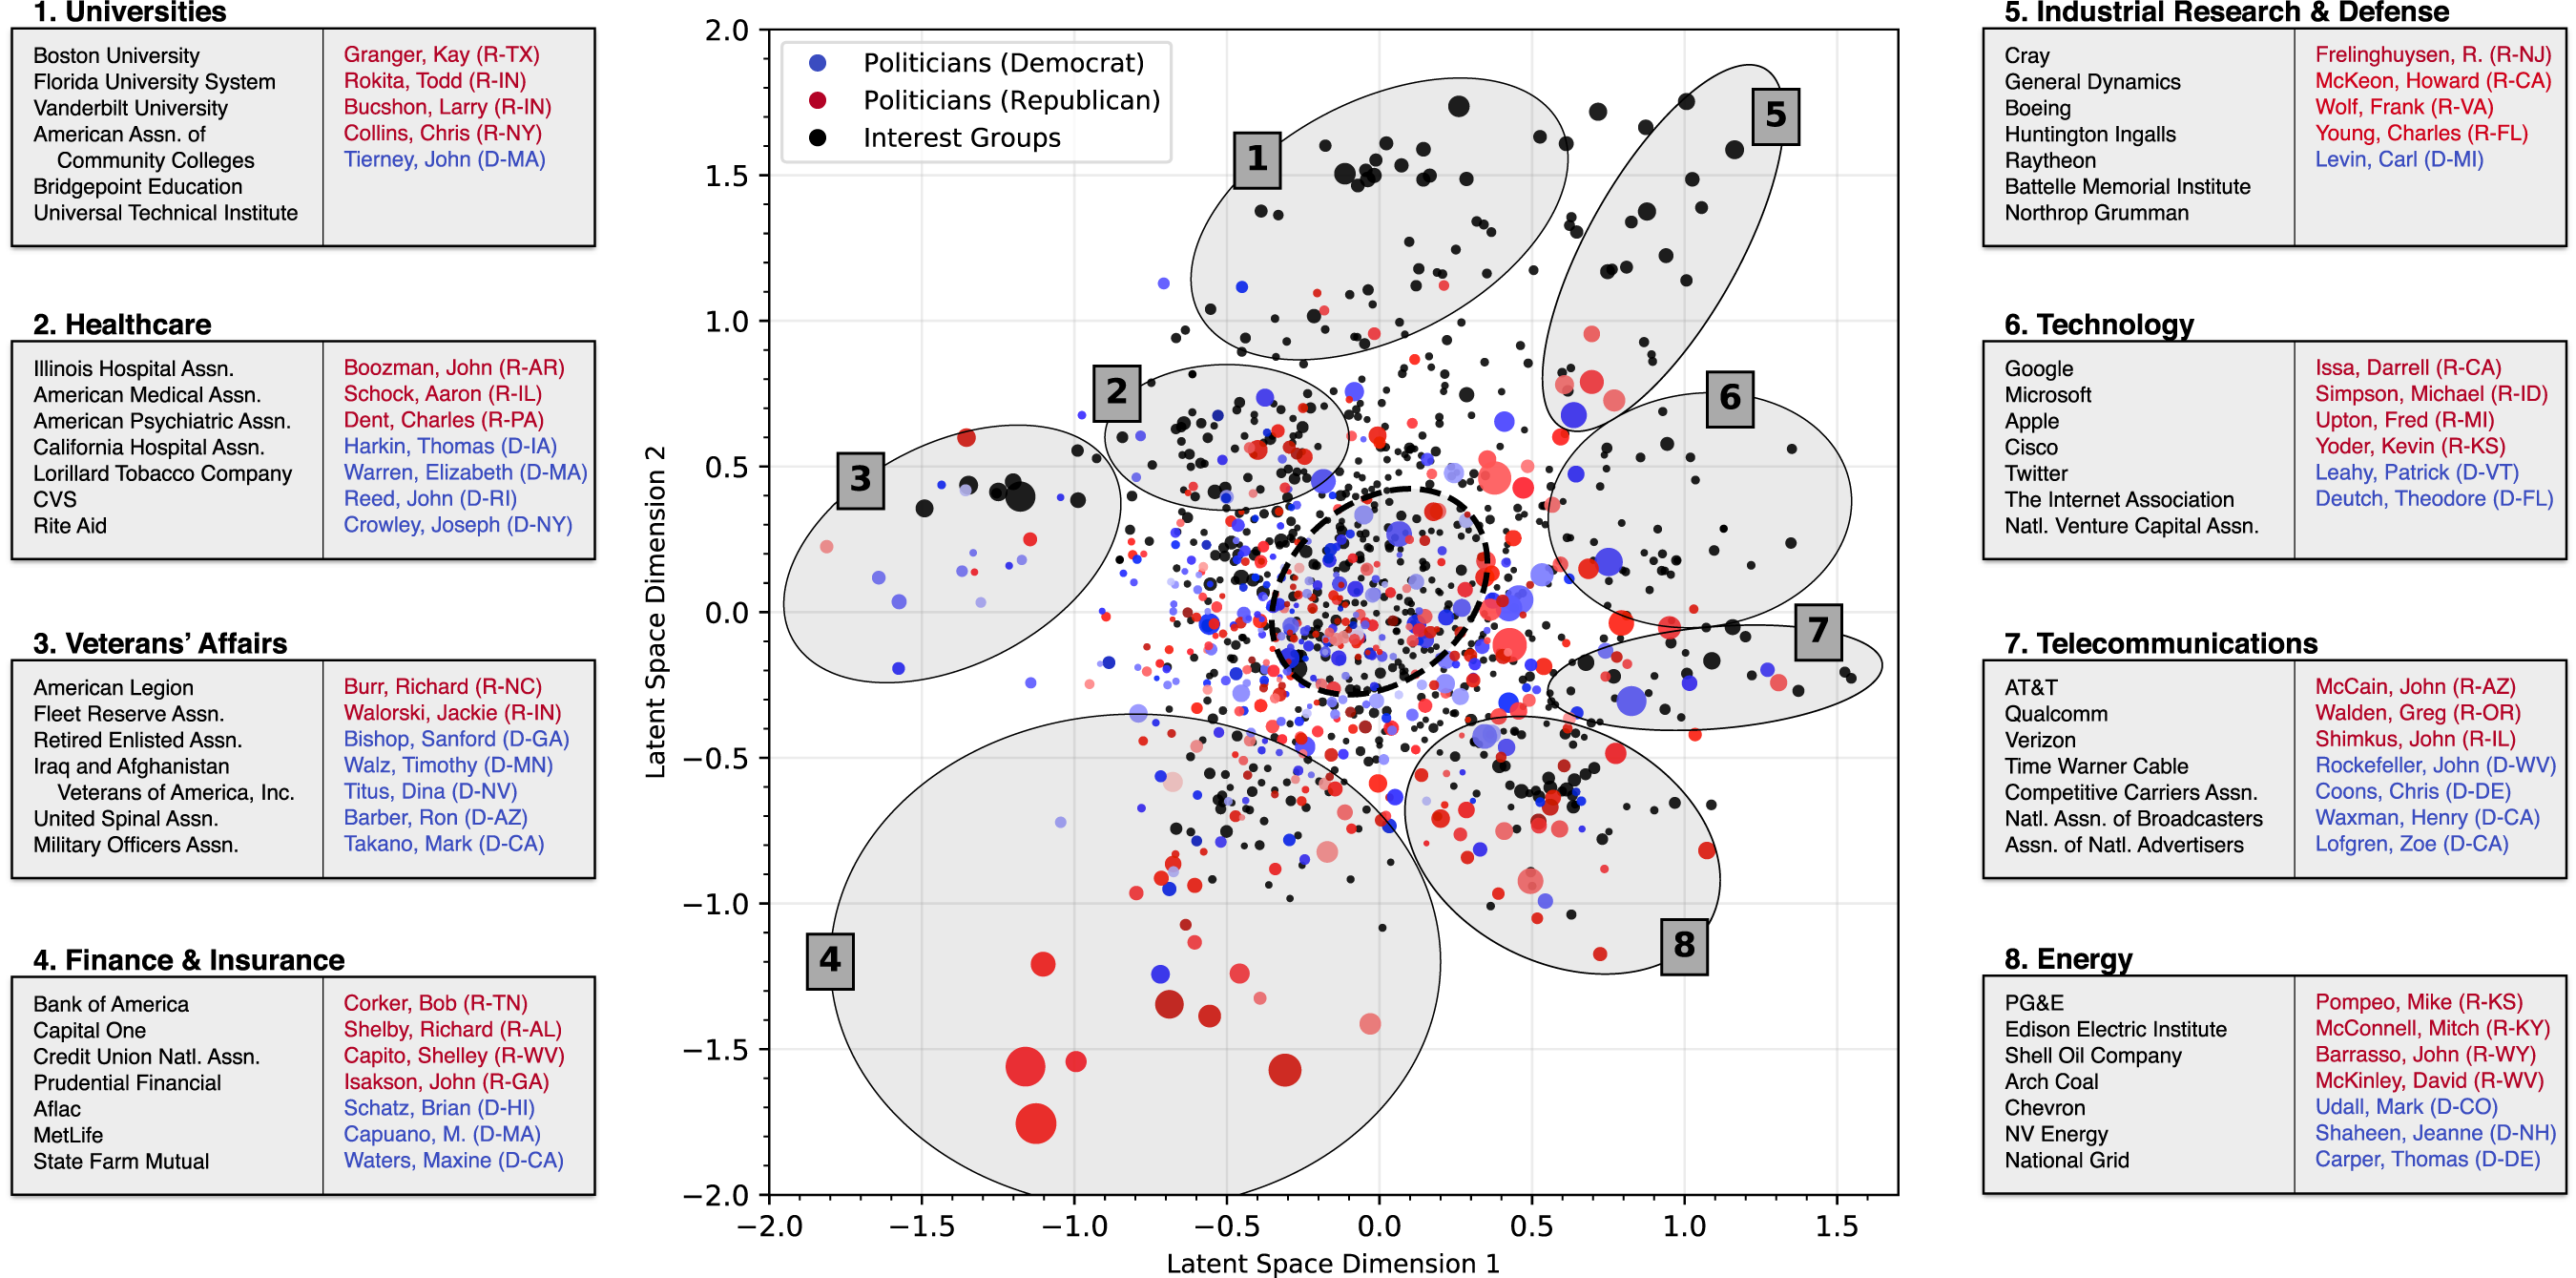
Figure 5 Estimated LSM positions: Full 113th Congress. This figure presents the two-dimensional latent space positions and popularity factors inferred from the 113th Congress dataset. ${}^{\mbox {a}}$ We indicate several significant clusters corresponding to specific industries and issue areas. Interest groups are represented with black dots while politicians are represented with colored dots according to their ideological score on the DW-NOMINATE scale. The size of each dot is proportional to the exponential of the actor’s popularity factor ($\exp (\alpha _i)$ or $\exp (\beta _j)$). We annotate the clusters with some representative members. ${}^{\mbox {a}}$ One actor with outlying mean latent positions (right of the region shown), DirectTV, Inc., is omitted for the sake of visual clarity


Figure 5 shows that the LSM finds some of the same structure as the biLCM in the lobbying network, identifying communities (shaded regions) of specific issue areas and industries, which arise as geometric clusters. In these communities, interest groups share an industry affiliation (such as “Telecommunications”) or an interest in an issue area (such as “Veterans’ Affairs”), and politicians sit on committees involved with the policies that affect those groups (see Figure F.5 in the Appendix). While often the dimensions of latent space models encode ideological information in political network models, we find that, even when tested formally with an F-test of regression models involving ideological and other covariates, the inferred LSM coordinates depend strongly only on committee memberships of politicians and industry affiliations of interest groups (see Appendix C.5). Thus the LSM appears to detect no structure in the lobbying network beyond that identified by the biLCM.
Not all regions in the LSM’s spatial representation are characterized by domain-specific political interests, however. We find that a region in the center of the latent space (marked by the dashed oval in Figure 5) is populated by politicians who are lobbied by groups with diverse interests. While this region appears to be unstructured and difficult to analyze, we find that it contains precisely those actors of high entropy we identify with the biLCM. We elaborate on this in Figure 6: the left panel repeats the latent space plot from Figure 5 but now divides the latent space into hexagonal areas and shades them according to the mean legislation community membership entropy of actors within those areas. We observe that actors with more memberships (darker hexagons) are clustered near the center of the latent space, while actors with fewer memberships (lighter hexagons) lie at the edges. We show examples in the right panel, representing each actor with a pie chart as in Figure 3. We highlight three actors with mixed memberships that we identified in Figure 3: the Chamber of Commerce, British Petroleum, and McAfee, Inc.

Figure 6 Latent space position versus legislation community distribution. The left panel divides the LSM latent space into hexagonal regions. We shade each region by the average entropy of legislation community memberships of the actors in that region: the darker the color, the more community memberships the actors have. The right panel plots example legislation community distributions at their corresponding latent positions.
The LSM’s failure to meaningfully describe the actors in the center region is related to its confounding strong ties with stochastic equivalence, as studied by Minhas et al. (Reference Minhas, Hoff and Ward2019). Simply put, two actors in the LSM may be nearby either because they themselves interact, or because they interact with others in a similar way. Like the AMEN model of that work, the biLCM mitigates this effect: repeated interactions in the biLCM occur between actors that share one dominant community membership; two actors with similar mixed memberships interact less often.
More nuanced results in the LSM are captured by the biLCM as well. For instance, in the LSM, the geometry of the clusters is consistent with common intuitions about relationships among industries. For example, the “Technology” cluster is adjacent to both the “Telecommunications” and “Energy” clusters, while the “Universities” cluster is adjacent to both the “Industrial Research & Defense” and “Healthcare” clusters. In Figure 6, actors near these border regions tend to have multiple legislation community memberships in biLCM communities. In summary, the results of the biLCM improve on those of the LSM: the biLCM captures the same single community memberships that the LSM does, but also clarifies the regions between communities and in the center of the latent space that represent varied interests of interest groups and politicians.
3.3.2 Stochastic Block Models
In this section, we compare the results of the biLCM to the biSBM of Larremore et al. (Reference Larremore, Clauset and Jacobs2014). Unlike the LSM, the biSBM explicitly models interactions as a function of community memberships; however, it lacks the mixed memberships and mixed interactions of the biLCM.
The Model
As before, we model  $A_{i, j}$ as having independent Poisson distributions whose means now depend exclusively on the community memberships of interest group i and politician j, denoted
  $x_i \in \{1, \dots , k\}$ and
  $y_j \in \{1, \dots , \ell \},$ respectively. Interactions between communities are described by a matrix
  $\mathbf {B} \in \mathbf {R}^{k \times \ell }$. We again include popularity factors
  $\alpha _i$ and
  $\beta _j$ for each interest group and politician, respectively.Footnote 14 The joint distribution of the interaction matrix is then
 $$ \begin{align} \mathbf{P}(\mathbf{A} \mid \mathbf{B}, \mathbf{x}, \mathbf{y}, \boldsymbol{\alpha}, \boldsymbol{\beta}) = \prod_{i = 1}^m \prod_{j = 1}^n\text{Poisson}(A_{i, j} \mid \alpha_i\beta_j B_{x_i, y_j}). \end{align} $$
The model described by Equation (7) is called the Degree-Corrected Bipartite Stochastic Block Model (dc-biSBM) due to the presence of popularity factors.
Computation
We perform maximum likelihood estimation for the dc-biSBM using the EM algorithm implementation provided by Larremore et al. (Reference Larremore, Clauset and Jacobs2014). As with the biLCM, this algorithm is not guaranteed to converge to the parameters maximizing the likelihood, so we take the parameters attaining the highest likelihood value out of 50 randomly initialized runs.
Comparison
The dc-biSBM suffers from the same drawbacks as the LSM: it identifies single community memberships in the lobbying network but not the multiple memberships that reflect actors’ actual varied interests. We illustrate this by comparing the LSM results from the previous section with the dc-biSBM memberships (with  $k = \ell = 8$ for comparison with the biLCM).
The left panel of Figure 7 overlays the community memberships identified by the dc-biSBM on the LSM latent space. We use the same colors for the legislation communities as we did for the biLCM,Footnote 15 and include the community boundaries from Figure 5. The figure shows that the LSM and dc-biSBM community structures are remarkably well-aligned.Footnote 16 Specifically, the boundaries that we drew in the LSM almost always correspond to distinct political communities in the dc-biSBM.

Figure 7 Latent space position versus community membership. In the left panel, we plot latent positions from the LSM marked with dc-biSBM communities. Each marker designates one community of politicians and one community of interest groups. The gray regions and the dashed oval are the ex post LSM community boundaries from Figure 5. On the right, we plot regions where pairs of dc-biSBM communities overlap in their latent positions. These lie near the central LSM region, which we mark in each plot for reference. In each plot we include only the actors from the relevant pair of communities, and highlight illustrative examples of interest groups.
The dc-biSBM provides some further insights about community structure that were not legible in the LSM. First, the dc-biSBM uncovers two distinct communities near the center of the latent space, which we named “Civil Society” and “Retail & Transportation” in the biLCM. These communities also lie near the center region of the LSM, which we found to contain the higher-entropy actors from the biLCM. But investigating more carefully, the dc-biSBM also demonstrates the importance of mixed membership modeling, as the right panels of Figure 7 illustrate. We zoom in on different parts of the center region of the LSM, focusing on three pairs of adjacent communities. We find that the communities in each pair overlap in the LSM, and actors in their intersections indeed tend to lobby on bills related to the subject matters of both communities. We again find our three examples of actors with varied interests, the Chamber of Commerce, British Petroleum, and McAfee, Inc., lying in these intersections; under the dc-biSBM, such actors belong to only one of the several communities in which they interact.
These findings confirm that, while the dc-biSBM is able to discern more structure than the LSM, its assignment of each actor to a single community is limited because many actors participate simultaneously in multiple communities in the lobbying network. The dc-biSBM thus furnishes yet more evidence that mixed membership modeling is required in order to account fully for the organization of the lobbying network.
3.4 Other Applications of the biLCM
The biLCM is applicable to a wide range of network datasets and problems in the social sciences. First, as we have illustrated, the biLCM is useful for identifying the community structure that drives repeated interactions between two distinct types of actors with varied interests. Many such networks arise in political science, including patronage networks between patrons and clients in developing countries (Jiang Reference Jiang2018), interactions between voters and politicians through campaign contributions and social media (Bonica Reference Bonica2013; Barberá Reference Barberá2014), and interactions between legislators and committees or other congressional units (Porter et al. Reference Porter, Mucha, Newman and Warmbrand2005). Second, the biLCM can be used to estimate ideal points (Poole and Rosenthal Reference Poole and Rosenthal2011) by considering roll calls as bipartite networks between legislators and bills. This allows researchers to infer ideal points of legislators and bills simultaneously. Finally, researchers may use the biLCM as a dimension reduction tool for network data beyond political applications. For example, a key challenge in the study of the global production network is to identify input–output relationships between products that are not directly observable. To better understand global value chains in international trade, the biLCM could quantify how intermediate products are allocated to produce a range of final goods.
4 Concluding Remarks
Many social and political networks have complex features that make them unsuitable for existing community detection methods. We propose the novel bipartite link community model, which models (1) networks consisting of two distinct types of actors, (2) interactions between actors driven by “mixed memberships” or multiple interests and motivations, and (3) pairs of actors having “mixed interactions” due to different alignments of interests. Because of these properties, our model is applicable in numerous settings where other techniques are not.
As an example where our model reveals new network structure, we consider interest group politics. Special interest groups influence the U.S. legislative process by lobbying for and against bills. Yet observable connections between interest groups and legislators have proved elusive, since groups need not reveal the individual politicians they contact. We therefore construct a network of interactions in the 113th Congress by connecting interest groups to legislators via the bills that were lobbied, information the groups must disclose.
While this network can be partially modeled with both latent space and stochastic block models, its key properties are observable only with the proposed model. We find that lobbying interactions occur in domain-specific communities organized around industries and political issues such as energy and veterans’ affairs. Interest groups with concerns in these domains lobby politicians who sit on committees with relevant jurisdiction, such as the House Committee on Energy and Commerce and the House Committee on Veterans’ Affairs. Furthermore, politicians who serve on power committees with broad responsibilities are members of multiple communities and interact with broad interest groups that represent diverse interests. Lastly, interest groups’ activity is typically dictated by their domain-specific interests rather than broader commitments, with the important exception of social issues.
There are currently a few technical limitations of our techniques that could be addressed by future research. First, our model requires the researcher to choose in advance the number of communities the biLCM will include. It would be interesting to either perform rigorous model selection, following the work initiated by Yan et al. (Reference Yan2014) or Peixoto (Reference Peixoto2015), or to incorporate a prior on this parameter, perhaps based on Dirichlet process methods (Miller and Harrison Reference Miller and Harrison2018). Second, our model does not take advantage of the rich covariate data available about politicians and interest groups. This could perhaps be incorporated by extending our model along the lines of Tallberg (Reference Tallberg2004) and Olivella, Pratt, and Imai (Reference Olivella, Pratt and Imai2018). Finally, to apply to general complex networks, our model should be extended to multi-partite interactions with many types of actors (such as the three-way interaction between an interest group, a politician, and a bill), as explored by Hoff (Reference Hoff2015) using tensor regression.
In summary, we present a novel and general methodology for analyzing political networks that have two types of actors who may interact with others in more than one way. To the best of our knowledge, ours is the first statistical study of lobbying networks in legislative politics that examines both politicians and interest groups using micro data. We believe applying our methodology in other settings will both yield new substantive insights and suggest more refined models suitable for political networks that involve complex interactions.
Acknowledgments
We thank Pablo Barberá, J. Lawrence Broz, Devin Caughey, Bruce Desmarais, Marina Duque, Jeff Harden, Lisa McKay, Nolan McCarty, Cristopher Moore, Michael Peress, Yunkyu Sohn, Erik Voeten, and Hye Young You for helpful comments. We also thank seminar participants at NYU-Abu Dhabi, Yale University, Duke University, Princeton University, University of California, San Diego, and University of Maryland. Conference participants at the American Political Science Association, the Asian Political Methodology annual meeting, and Political Methodology annual meeting provided thoughtful insights. The editor and the three anonymous reviewers provided helpful comments that have significantly improved this article. The open-source software polnet: Statistical Analysis of Political Networks is available as an R package for implementing the proposed methods.
Funding
This work was supported by the National Science Foundation (SES-1264090, SES-1725235 to I.K.).
Data Availability Statement
Replication code for this article has been published in Code Ocean, a computational reproducibility platform that enables users to run the code and can be viewed interactively at https://doi.org/10.24433/CO.0776811.v1. A preservation copy of the same code and data can be accessed via Dataverse at https://doi.org/10.7910/DVN/CSAJQY.
Supplementary material
For supplementary material accompanying this paper, please visit https://doi.org/10.1017/pan.2020.29.


