Introduction
Historically, the vine (Vitis vinifera L.) was an important crop cultivated across Europe and provides approximately 60% of the global wine production volume. The main producer regions are located in France, Italy and Spain, countries where viticulture registers around 33% of the global vine land cover area (OIV, 2015). In north-western Spain, Vitis vinifera L. has a significant economic and social influence. Its winery industry constitutes an important base for the local economy in a context of a progressive wine quality improvement based on the establishment of Designation Origin Areas with autochthonous varieties (MAGRAMA, 2015).
During the production cycle, final grape harvest can be strongly influenced by meteorological variables through regulation of the main plant growth biological processes (Dalla Marta et al., Reference Dalla Marta, Grifoni, Mancini, Storchi, Zipoli and Orlandini2010; Eitzinger et al., Reference Eitzinger, Orlandini, Stefanski and Naylor2010; Fernández-González et al., Reference Fernández-González, Escuredo, Rodríguez-Rajo, Aira and Jato2011; Caffi et al., Reference Caffi, Legler, González-Domínguez and Rossi2016) or development of fungal diseases (Ellison et al., Reference Ellison, Ash and McDonald1998; Fernández-González et al., Reference Fernández-González, Rodríguez-Rajo, Jato and Aira2009, Reference Fernández-González, Rodríguez-Rajo, Escuredo and Aira2013; Calanca et al., Reference Calanca, Bolius, Weigel and Liniger2011; Kocmánková et al., Reference Kocmánková, Trnka, Eitzinger, Dubrovský, Štepánek, Semerádová, Balek, Skalák, Farda, Juroch and Zalud2011). The particular climate of north-western Spain, with high temperatures and relative humidity during the grapevine vegetative cycle, can especially favour the development of fungal diseases in crops. One of the most important diseases is downy mildew, caused by the fungus Plasmopara viticola Berk et Curt. de Toni. The yeast can affect both the quantity of harvest and the quality of wine produced from infected grapes (Salinari et al., Reference Salinari, Giosué, Tubiello, Rettori, Rossi, Spanna, Rosenzweig and Gullino2006).
Grape downy mildew is a polycyclic disease that prompts primary infections caused by oospores and secondary infections by sporangia. The disease cycle starts when the oospores, which represent the sexual stage of P. viticola, which are deposited inside infected leaves, on the soil surface or within the surface layer of the soil (Carisse, Reference Carisse2016). These oospores mature during late winter and early spring. The oospores germinate and then reach morphological maturity in spring, causing the primary infections (Carisse, Reference Carisse2016). The main meteorological parameters involved in oospore dormancy completion are temperature, rainfall and humidity (Hill, Reference Hill2000; Rossi et al., Reference Rossi, Caffi, Bugiani, Spanna and Della Valle2008a, Reference Rossi, Caffi, Giosuè and Bugiani2008b; Caffi et al., Reference Caffi, Rossi, Bugiani, Spanna, Flamini, Cossu and Nigro2009). Oospore germination is favoured by temperatures above 11 °C (Park et al., Reference Park, Seem, Gadoury and Pearson1997) and inhibited by temperatures above 30 °C (Blouin, Reference Blouin2007). When oospores germinate, they form biflagellate zoospores. If they are deposited on the leaves, under moist conditions they can swim towards stomata in the water film on the abaxial leaf surface (Kiefer et al., Reference Kiefer, Riemann, Buche, Kassemeyer and Nick2002). Then they shed their flagella to form a germ tube that penetrates the stomata and encyst in the sub-stomatal cavity (Unger et al., Reference Unger, Büche, Boso and Kassemeyer2007). The encysted zoospores produce hyphae that colonize the host tissue producing ‘oil spots’ in the infected leaves, which are identified as the initial disease symptoms (Rossi et al., Reference Rossi, Caffi and Gobbin2013). Viable zoospores on the soil are dispersed to leaves and bunches of fruit growing near the ground by rain splash (Viret and Siegfried, Reference Viret and Siegfried1996; Rossi and Caffi, Reference Rossi and Caffi2012).
The secondary infection starts 5–18 days after the primary infection has occurred (Rossi et al., Reference Rossi, Caffi and Gobbin2013). P. viticola produces sporangiospores bearing sporangia containing asexual zoospores, which are the inoculum responsible for multiple secondary cycles. The sporulation period is influenced by weather parameters, mainly at night, when the relative humidity is high (Rumbolz et al., Reference Rumbolz, Wirtz, Kassemeyer, Guggenheim, Schäfer and Büche2002) and temperatures range from 10 to 32 °C, with an optimum at 20 °C (Lalancette et al., Reference Lalancette, Ellis and Madden1988; Caffi et al., Reference Caffi, Gilardi, Monchiero and Rossi2013). P. viticola disease spreads very rapidly during the secondary infection cycles. Nonetheless, the degree of primary infection is a key factor for successful control of secondary infections (Schwinn, Reference Schwinn and Spencer1981).
The most common P. viticola pest management method is the periodic application of chemical spray treatments with the aim of controlling both primary and secondary infections (Walters and Fountaine, Reference Walters and Fountaine2009). As a consequence, a significant number of treatments (between 8 and 11 applications throughout the vine vegetative cycle) are usually conducted, most of them unnecessary. The aim of the current study was to assess a system to manage P. viticola infections based on all three causal components of the disease triangle: phenological information (host conditions), biological sensor data (a pathogen indicator such as levels of airborne fungal spores) and prediction of the occurrence of ideal environmental conditions for the pathogen (based on the Goidanich Index). Using the combination of these variables to decide when to spray would clearly lead to a lower number of treatments, and thus to a reduction of both economic costs and environmental damage.
Materials and methods
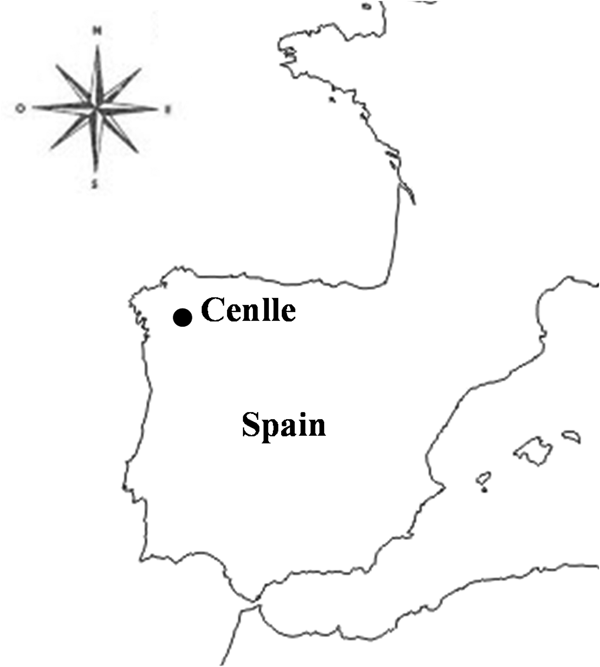
The current study was carried out in a vineyard located in Cenlle, North-West Spain (42°18′N, 8°6′W, 140 m a.s.l.), belonging to the Ribeiro Designation of Origin Area (Fig. 1). This region is characterized by a particular Oceanic–Mediterranean transition ecoclimate (Köppen, Reference Köppen1931). The main grape varieties grown are Treixadura, Godello and Loureira. According to the Geoviticulture Multicriteria Climatic Classification System (available at http://www.cnpuv.embrapa.br/ccm/ccm.en.html), most winemaking areas in this region, watered by the river Miño, would be defined as temperate and warm, sub-humid, with very cold nights (Blanco-Ward et al., Reference Blanco-Ward, García Queijeiro and Jones2007).

Fig. 1. Location of the study area.
The study period covered 2005–2016 during the active Vitis vinifera vegetative cycle, from 1 April to harvest date, during September in each year.
An aerobiological study was carried out using a Lanzoni VPPS-2000 (Lanzoni Manufacturing, Italy) volumetric spore trap (Hirst, Reference Hirst1952) located inside the vineyard 2 m above ground level (so that spore trapping would not be impeded by plant growth). The Lanzoni sampler device was calibrated with a flow of 10 litres/min. The spores were caught on a melinex film inside the device. Spore identification and counts were conducted using the protocol proposed by the Spanish Aerobiological Network – R.E.A. – (Galán Soldevilla et al., Reference Galán Soldevilla, Cariñanos González, Alcázar Teno and Domínguez-Vilches2007). The P. viticola sporangium concentration was expressed as total spores or spores/m3 of air when referring to daily mean values.
The phenological study was conducted during the active grapevine cycle (from 1 April to the harvest date) during all study years in 22 selected plants of the Treixadura variety. The phenological study was conducted following the Biologische Bundesanstalt, Bundessortenamt und CHemische Industrie (BBCH, 1997) phenological scale recommended by Lorenz et al. (Reference Lorenz, Eichorn, Bleiholder, Klose, Meier and Weber1994), used as the standardized scale for phenological observations (Meier, Reference Meier2001). A total of six principal stages were monitored, growth stage (GS) 0 (bud development), GS 1 (leaf development), GS 5 (inflorescence emergence), GS 6 (flowering), GS 7 (development of fruits) and GS 8 (ripening of berries). The crop was visited weekly during the years of study, increasing to twice a week during flowering (GS 6). The start date of each phenological phase was considered as the date when 0.50 of studied plants were observed in that stage. The date on which fungicide was applied was also noted.
In order to ascertain the possible periods of disease attack, infection risk cycles (IRC) were calculated following the methodology proposed by Goidanich et al. (Reference Goidanich, Casarini and Foschi1957). Primary contamination begins the day after the following conditions occur: vine shoots are at least 10 cm in length, total rainfall collected in 1 day ⩾10 mm and maximum temperature ⩾12 °C. The Goidanich algorithm was calculated following the table proposed by Goidanich et al. (Reference Goidanich, Casarini and Foschi1957), which represents the percentage of fungal development with values ranging from 0 to 100%. The IRC is complete (100%) at the moment when the theoretical incubation period ends and fungal contamination is evidenced by the appearance of oil spots and spore asexual fructification. After the completion of the primary infection, multiple secondary infection cycles can occur (caused by asexual spores) under the following conditions: minimum temperature ⩾11–12 °C, 4 h of leaf moisture during the period from 22:00 to 04:00 h, average temperature ranging between 13 and 27 °C and any rainfall event (Goidanich et al., Reference Goidanich, Casarini and Foschi1957).
Meteorological data (maximum, minimum and average temperatures; dew point; relative humidity; wind speed) were obtained from a Hobo Micro Station data logger from HOBO Data Loggers (Onset Computer Corporation, Bourne, MA, USA), located next to the spore sampler. The rainfall values (mm) were recorded by means of a Davis weather station also located in the vineyard. The values of the main meteorological parameters – maximum, minimum and average temperatures (°C), dew point (°C), relative humidity (%), rainfall (mm) and wind speed (m/s) – during the phenological stages are shown in Table 1.
Table 1. Main meteorological parameters -maximum, minimum and average temperatures (°C), dew point (°C), relative humidity (%), rainfall (mm) and wind speed (m/s) – during the phenological stages
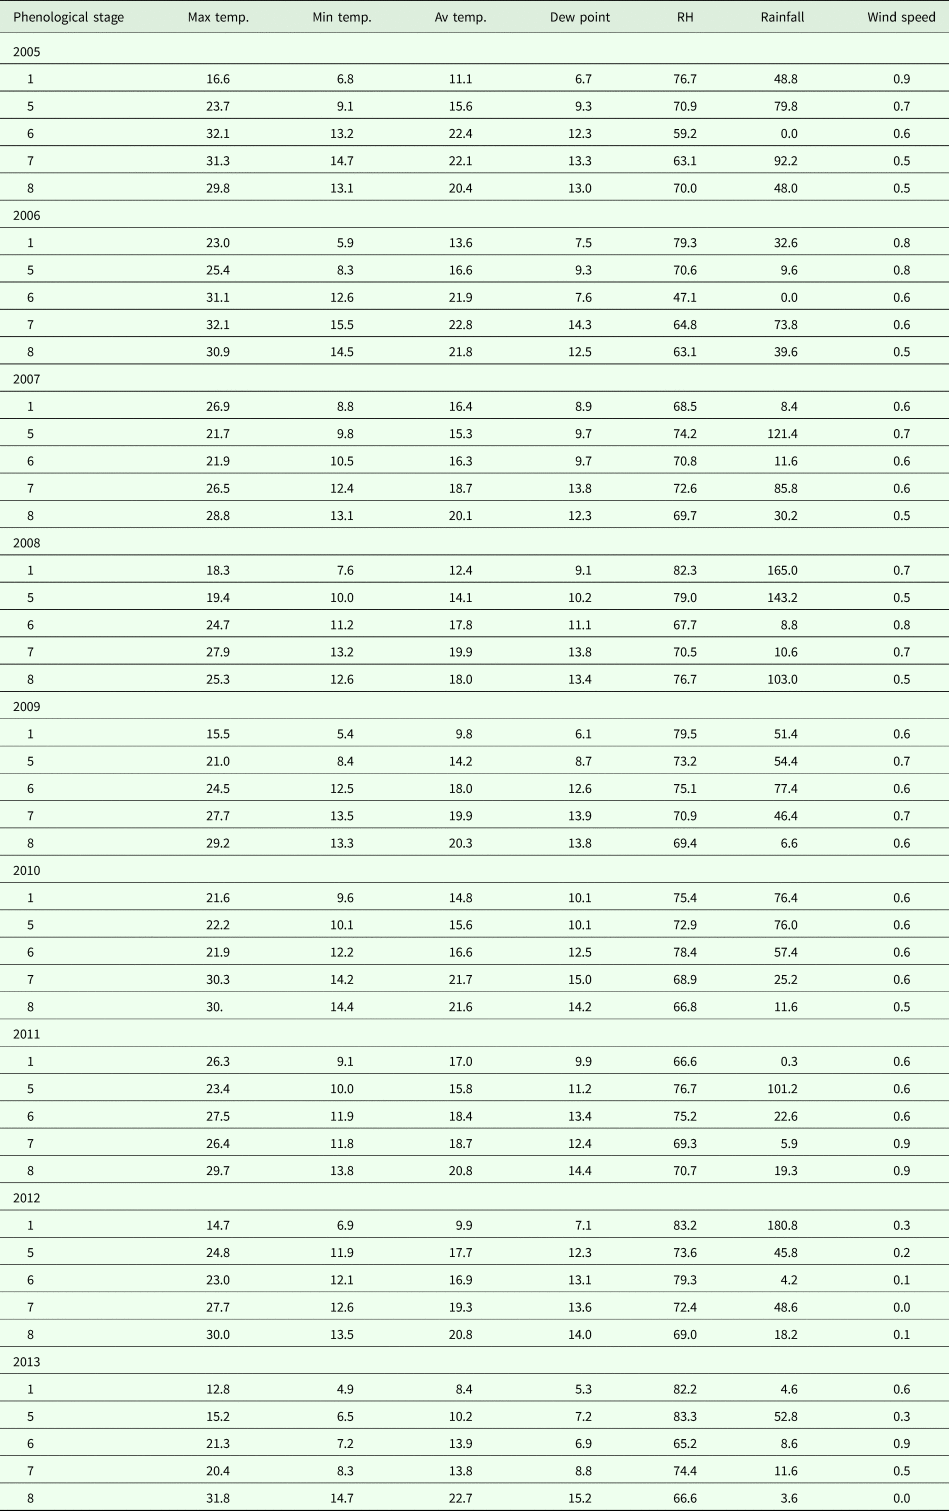
1. Leaf development; 5. Inflorescence emergence; 6. Flowering; 7. Development of fruits; 8. Ripening of berries
In order to ascertain the influence of daily weather variables on daily mean P. viticola spore concentrations, a Spearman non-linear correlation test was applied considering the meteorological values of the same day and values from the previous 7 days. Significance was calculated at P ⩽ 0.01. The results obtained by correlation analysis were considered for the design of a linear regression analysis in order to develop a model to predict P. viticola concentrations in the atmosphere of the vineyard. Variables included in the proposed model were the meteorological and phytopathological variables displaying high significance correlation level. The model was trained with harvest data from 2005 to 2013, whereas the data from 2014 to 2016 were not used for model elaboration, with the aim of proving its real accuracy. Moreover, a t test for dependent samples was carried out in order to check the significant differences between estimated and real data. For all statistical analysis, SPSS 22.0 software package was used.
Results
The duration of the Treixadura grapevine cycle ranged from 154 days during 2011 to 176 days in 2008. Generally, the longest-lasting stage was GS 7 (development of fruits) with a mean duration of 55 days throughout the study years, followed by GS 8 (ripening of berries) with 41 days and GS 5 (inflorescence emergence) with 34 days. The shorter stages were GS 1 (leaf development) at 19 days and GS 6 (flowering) with a mean of 11 days during the years of study (Table 2).
Table 2. Start date and length of the different phenological stages (days) in each study year. P. viticola total spores (spores) and maximum concentration (spores/m3) during the different phenological stages are also shown

1. Leaf development; 5. Inflorescence emerge; 6. Flowering; 7. Development of fruits; 8. Ripening of berries
The presence of P. viticola spores was not constant in the atmosphere of the vineyard during the grapevine cycle. In general, maximum spore counts were observed from the second fortnight of April to the first fortnight of May, and from the last 10 days of June to the last 10 days of September (Fig. 2, Table 2). The highest total of P. viticola spore concentrations was recorded in 2010 with 1255 spores/m3 and the lowest in 2005 with a total value of 210 spores/m3 (Table 2). Intermediate values were registered during the other years. The daily maximum peak spore value was registered on 25 June 2010 with a concentration of 125 spores/m3. The average temperature that day was 21.7 °C and there was 25.2 mm of rainfall. The moment of peak daily P. viticola maximum spore concentrations varied among the years of study: during leaf development in 2006 and 2013, inflorescence emergence in 2005, 2011 and 2012, development of fruits in 2010 and finally during ripening of berries in 2007, 2008 and 2009 (Fig. 2, Table 2).

Fig. 2. Spore concentrations (areas), rainfall values (bars), average temperature (continuous line), Goidanich Index risk periods (discontinuous vertical lines) and chemical treatments date (arrows) during the years of the study. S-0 bud development; S-1 leaf development; S-5 inflorescence emerge; S-6 flowering; S-7 development of fruits; S-8 ripening of berries.
The percentage of infection risk was calculated using the Goidanich algorithm from 2005 to 2013 (Fig. 2). The highest number of infection cycles was recorded during the 2009 harvest, with a total of 16 cycles. The years with fewest infection cycles were 2008, 2011 and 2012 (13 cycles) followed by 2010 and 2013 (15 cycles). The primary infection risk period was seen during the third fortnight of April, except in 2013 where the primary infection risk was advanced to the first half of April. The highest number of secondary infection cycles detected by the Goidanich algorithm was produced during the development of fruits and ripening of berries, coinciding with the periods of highest P. viticola concentrations (i.e. during the years 2008 and 2009 in GS 8 and during the year 2010 in GS 7). However, peak spore concentrations were advanced to GS 5 in 2011 and 2012 and to GS 1 in 2013, coinciding with the primary infection cycle detected by the Goidanich algorithm (Fig. 2).
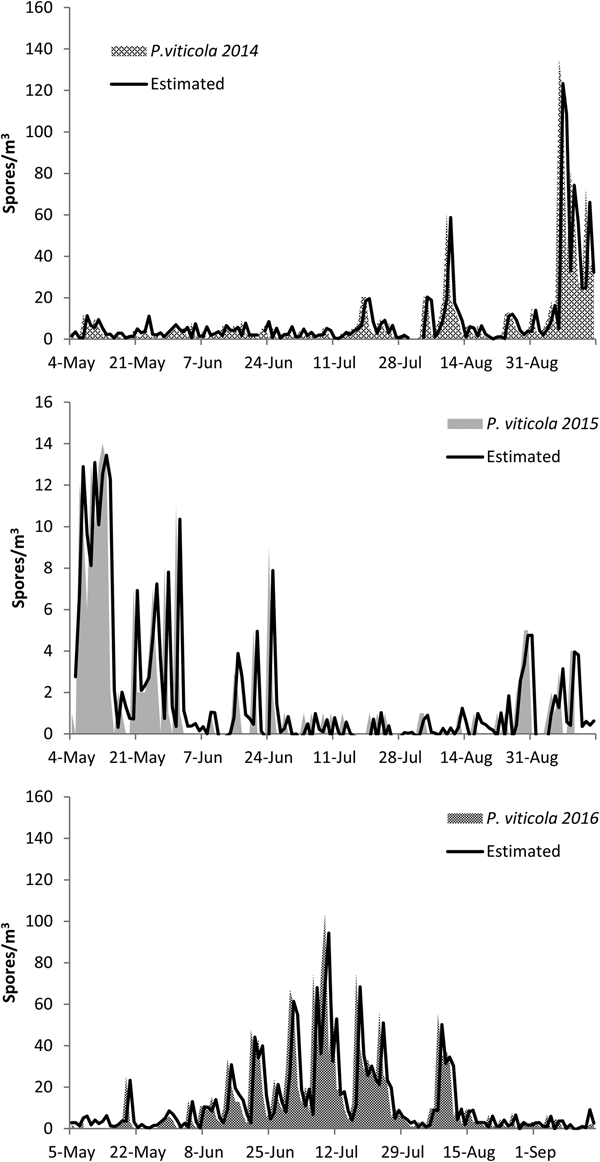
In order to determinate the influence of the main weather variables on airborne spore presence, a Spearman correlation test was carried out during the 2005–2013 data set. A positive correlation coefficient (P ⩽ 0.01) was obtained between the P. viticola spore concentrations and maximum temperature, rainfall and wind speed of the same day and the previous 7 days. In contrast, a negative correlation (P ⩽ 0.01) was obtained with minimum or average temperatures, dew point and relative humidity of the same day and the previous 7 days (Table 3). The linear regression analysis developed to predict airborne spore concentrations included as independent variables the parameters with a highly significant correlation coefficient. The best estimators of P. viticola spore concentration were fungus spore levels during the previous day, average temperature 5 days before and the rainfall 2 days before. The regression equation obtained shows an F value of 15 980, standard error of estimate of 6.906 and P < 0.001, accounting for 95.9% of the spore concentration variation (Table 4). The accuracy of the prediction regression model was assessed by means of comparing the observed and predicted P. viticola spore concentrations during 2014, 2015 and 2016 (years not used for model training). In general, the forecasts for P. viticola spores fitted the real, observed data (Fig. 3). The precision of the proposed model was also verified statistically by means of t test analysis. The results of the test indicated no significant differences between estimated and real daily P. viticola spore concentrations during 2014, 2015 and 2016 (Table 5).

Fig. 3. Graphical comparison between the sampled and predicted P. viticola spore concentrations during 2014, 2015 and 2016 harvest.
Table 3. Spearman's rank-order correlation coefficient between Plasmopara viticola spore concentrations and the main meteorological variables -maximum, minimum and average temperatures, dew point, relative humidity, rainfall and wind speed- during the same day and the previous 7 days. Maximum, minimum and average temperatures (°C), dew point (°C), relative humidity (%), rainfall (mm) and wind speed (m/s)

Table 4. Forecast model of P. viticola spore concentrations considering the data set 2005–2013

Table 5. T-test for sampled concentration P. viticola values (2014. 2015 and 2016) and the concentrations estimated by the model.

Discussion
Downy mildew is a polycyclic fungal disease, which causes both direct and indirect yield losses (Hewitt and Pearson, Reference Hewitt, Pearson, Pearson and Goheen1988; Caffi et al., Reference Caffi, Rossi, Giosué and Poni2006).
The incidence of downy mildew in 1 year will have an influence on the disease risk for the next year (Carisse, Reference Carisse2016). This fungus can overwinter as oospores, which are the main source of primary infection (Salinari et al., Reference Salinari, Giosué, Tubiello, Rettori, Rossi, Spanna, Rosenzweig and Gullino2006; Gessler et al., Reference Gessler, Pertot and Perazzolli2011; Carisse, Reference Carisse2016). Some authors have noted the importance of oospore infection in downy mildew epidemics, as they have a great potential to germinate over relatively long periods (Gobbin et al., Reference Gobbin, Pertot and Gessler2003, Reference Gobbin, Jermini, Loskill, Pertot, Raynal and Gessler2005). The current data showed that primary infections took place during a short period in the spring, whereas disease progression and, most importantly, yield reductions were caused mainly by secondary infections (Gessler et al., Reference Gessler, Pertot and Perazzolli2011). The grape downy mildew secondary attacks were regulated by synchronization of different variables such as the nature of the disease (the quantity of overwinter oospores), weather parameters (which influence pathogen development), susceptibility of the grape variety and temporal changes in organs during the growing season (Carisse, Reference Carisse2016). Amongst these, the key factors for primary and secondary infection cycles were weather variables. The optimum conditions for oospore germination occurred during spring, when rainfall is >10 mm for 1–2 consecutive days and temperature is above 10–12 °C (Laviola et al., Reference Laviola, Burruano and Strazzeri1986; Rossi et al., Reference Rossi, Caffi, Bugiani, Spanna and Della Valle2008a). Zoospore release occurred during temperatures from 5 to 30 °C, with an optimum at 20–25 °C (Caffi et al., Reference Caffi, Legler, González-Domínguez and Rossi2016). Several authors have indicated that most P. viticola infections ranged between early May to mid-July (Rumbou and Gessler, Reference Rumbou and Gessler2004; Gobbin et al., Reference Gobbin, Jermini, Loskill, Pertot, Raynal and Gessler2005; Kennelly et al., Reference Kennelly, Gadoury, Wilcox, Magarey and Seem2007). In the current study, maximum spore levels were registered from the second half of April to the second half of May in 2005, 2006, 2010, 2011, 2012 and 2013, overlapping the phenological stages 1 (leaf development) and 5 (inflorescence emergence), but during GS 8 (ripening of berries) in 2007, 2008 and 2009. During these periods, maximum temperatures around 23 °C after 1–3 rainy days were recorded. The correlation analysis reinforces these findings, as the presence of spores in the atmosphere was highly correlated with rainfall for 2 days before and maximum temperature. These results were similar to those reported in previous studies by Fernández-González et al. (Reference Fernández-González, Ramos-Valcárcel, Aira and Rodríguez-Rajo2016) in the same area and Kennelly et al. (Reference Kennelly, Gadoury, Wilcox, Magarey and Seem2007) in an area of the USA located at a similar latitude. Both Fernández-González et al. (Reference Fernández-González, Ramos-Valcárcel, Aira and Rodríguez-Rajo2016) and Kennelly et al. (Reference Kennelly, Gadoury, Wilcox, Magarey and Seem2007) also connected high spore concentrations during the first grapevine phenological stages with the winter germination of oospores, responsible for the primary infection. Inappropriate or poorly executed cultural practices, for example leaving pruning residues on the vineyard soil, could increase the primary infection incidence. Rosa et al. (Reference Rosa, Gozzini, Orlandini and Seghi1995) considered that primary infections depend on temperature and rainfall, but that secondary infections were regulated by means of temperature and continuous humidity on leaves. The optimum relative humidity for sporulation and development disease ranged from 95 to 100% in the area of study (Díaz, Reference Díaz1999). The current findings showed that continuous rainfall episodes, relative humidity values above 60% and maximum temperatures ranging from 20 to 37 °C represented the key factors for maximum spore concentrations during ripening of berries (GS 8) in 2007 and 2008. The current results were in accordance with Fernández-González et al. (Reference Fernández-González, Ramos-Valcárcel, Aira and Rodríguez-Rajo2016). During the rest of the sampled years, lower spore levels were registered because higher maximum temperatures (between 21 and 42 °C), scarce rainfall events and lower than optimum relative humidity for sporulation values (between 49 and 95%) were recorded during the same months. Studies conducted by Lalancette et al. (Reference Lalancette, Ellis and Madden1988) in North-American located at similar latitude stated that high temperatures and low relative humidity during the day could reduce sporangia survival rates.
With the aim of determining P. viticola incubation cycles, the method proposed by Goidanich et al. (Reference Goidanich, Casarini and Foschi1957) was assessed. Epidemiological conditions during the study years indicated that the incubation cycle started when the ‘three ten rules’ occurred (Baldacci, Reference Baldacci1947) during early spring; i.e. temperature reached a minimum of 10 °C, humidity concentration was 10 litres/m2 and vine shoot length was 10 cm. The primary infection risk Goidanich cycles started around 20–22 April, during GS 1 (leaf development), except in 2013 when the first infection occurred 10 days before. The model indicates that the first rainfall episodes caused the disease onset, as this rain allowed zoospores to penetrate the stomata and initiate the primary infection. Menesatti et al. (Reference Menesatti, Antonucci, Costa, Mandalà, Battaglia and la Torre2013), reporting on the first attack during leaf development, stated similar results in Northern Italian vineyards. Pedrazzini et al. (Reference Pedrazzini, Sordi, Toffolatti, Venturini, Vercesi, Šegvić Klarić and Jelić2011), in the Lombardia region, indicated that the first fungicide treatment should be applied when the Goidanich model reached 80% of the index with the aim of diminishing oospore development. In order to maintain a vineyard under the 80% infection index throughout the grapevine cycle, a great number of fungicide treatments (ranging between 8 and 11) would be needed during the sampling period used in the current study. Some authors have reported between 7 and 10 fungicide treatments in Northern Italian vineyards (Rossi et al., Reference Rossi, Caffi, Bugiani, Spanna and Della Valle2008a) and even 9–13 treatments in studies conducted in central Italy, where more favourable bioclimatic infection conditions for the pathogen occurred (Menesatti et al., Reference Menesatti, Antonucci, Costa, Mandalà, Battaglia and la Torre2013). A large number of fungicide treatments applied in vineyards has negative impacts on the environment and the economics of production (Seem et al., Reference Seem, Magarey, McCloud and Wachtel1985).
Nowadays, chemical treatments are mainly applied according to established calendars; consequently, a great number of applications are ineffective. The Goidanich model allows determination of the times at which meteorological conditions could facilitate Plasmopara attacks during the susceptible phenological stages of vine growth. Fungicides should only be applied when all three causal components of the disease triangle are present (meteorologically favourable conditions, susceptible host and pathogen presence). The disease is not produced if any one of these is lacking (Fernández-González et al., Reference Fernández-González, Rodríguez-Rajo, Escuredo and Aira2013). Atmospheric spore concentrations in the vineyard could be used as a biological sensor for pathogen presence and development. A number of worldwide surveys have sought to relate disease levels at a given time with airborne spore concentrations during previous periods (Jeger, Reference Jeger1984; Carisse et al., Reference Carisse, Savary and Willocquet2008). Studies conducted by Carisse et al. (Reference Carisse, Savary and Willocquet2008) reported a significant correlation between airborne conidium concentrations on a given date and lesion density 1 week later in North-American areas located at the same latitude as the current study. A certain threshold level of spore concentration could be used as a warning of the real risk of disease if values of the Goidanich index around 80% were recorded. Implementation of a system of this sort would clearly lead to a lower number of treatments and thus to a reduction in both economic costs and environmental damage (Seem et al., Reference Seem, Magarey, McCloud and Wachtel1985; Bugiani et al., Reference Bugiani, Govoni, Bottazzi, Giannico, Montini and Pozza1995). The current work developed a model to predict spore concentration in the atmosphere of the vineyard. The meteorological variables included in the model were average temperature, rainfall and pathogen concentration on the previous day. The equation accounted for 95.9% of predicted spore count variation, showing a better accuracy than that reported by Fernández-González et al. (Reference Fernández-González, Rodríguez-Rajo, Jato and Aira2009, Reference Fernández-González, Ramos-Valcárcel, Aira and Rodríguez-Rajo2016) in the same study area. The precision of the equation was tested with data from 2014, 2015 and 2016. The graphical representation of observed and predicted data fit well, and the t-test statistically reinforces the accuracy of the equation.
Considering the combination of the Goidanich model and biosensor information, it was found that incorrect timing of treatment administration induced the highest total annual spore concentrations in 2010 and 2008 with 1255 spores/m3 and 901, spores/m, respectively. The first phytosanitary treatments were applied a few days after (in 2008) and a few days before (in 2010) the time at which the Goidanich model reached 80% of infection risk. These conditions could favour the increase of P. viticola concentrations due to rainy episodes on these days. With the aim of decreasing primary oospore concentrations at the beginning of the growing season, the experience acquired during the current study recommended the introduction of improved cultural practices (such as the elimination of pruning residue from the vineyard). Likewise, some changes in fungicide application dates (the first fungicide treatment should be applied during winter to reduce the population of overwintering oospores).
Prediction of the periods when a crop is at risk of attack from disease is very difficult. The combination of phenological information, biological sensor data such as the airborne spore levels in the vineyard and the prediction of ideal environmental conditions for the pathogen by means of the Goidanich Index allowed the development of a precise and modern integrated pest management strategy in the vineyards, with improvement in the quality of the final product and environmental conservation.
Financial support
The study was financed by the AGL2014-60412-R project supported by the Ministry of Economy and Competitiveness of the Spanish Government.
Conflict of interest
None.
Ethical standards
Not applicable.