


1. INTRODUCTION
A Rayleigh-Taylor (RT) instability occurs when a perturbed interface between two fluids with different densities is accelerated in a direction normal to the interface from the heavy to the lighter fluid (Lord Rayleigh, Reference Lord Rayleigh1883; Taylor, Reference Taylor1950). RT instabilities grow as bubbles of lighter fluid rising into the heavier fluid, and spikes of heavier fluid falling into the lighter. RT instabilities can be single or multimode, depending on the nature of the perturbation. Multimode RT is, in particular, interesting to study since it involves the growth of hydrodynamic structures that span multiple length scales. With the course of time, these structures grow to larger scales, leading to a “bubble competition” where neighboring hydrodynamic structures coalesce and merge into still larger structures. Soon, a scale invariant regime can be reached where the subsequent growth is self-similar and independent of the initial conditions. A close counterpart of RT is the Richtmyer-Meshkov instability (Richtmyer, Reference Richtmyer1960), where the acceleration is impulsive.
Typically, the Atwood number, defined as A = (ρ2 − ρ1 )/(ρ2 + ρ1), where ρ2 and ρ1 are the densities of the heavy and light fluids, respectively, is widely used to characterize the RT instability. Several studies have been carried out in the past to understand the phenomenology of RT using analytical models, numerical simulations, and experiments. One of the earliest works on RT was the study of the rise of a single bubble, carried out by Layzer (Reference Layzer1955), but limited to A = 1. A detailed review of early RT research works can be found in Sharp (Reference Sharp1984). Later, Alon et al. (Reference Alon, Hecht, Mukamel and Shvarts1994, Reference Alon, Hecht, Ofer and Shvarts1995) have proposed an analytical model to study the growth of the RT instability, including also the case of an impulsive initial drive, i.e., the Richtmyer-Meshkov (RM) instability. They investigated both 2D and 3D instability growth, extending Layzer's work for all Atwood numbers. Scaling laws were obtained based on analytical reasoning by Oron et al. (Reference Oron, Arazi, Kartoon, Rikanati, Alon and Shvarts2001) for both these instabilities, including also a Buoyancy-Drag model where the hydrodynamic structures are modeled as to be accelerated due to buoyancy as well as decelerated by a drag force. Later, the Buoyancy-Drag model has been extended and applied to both RT and RM instabilities by Srebro et al. (Reference Srebro, Elbaz, Sadot, Arazi and Shvarts2003) and they obtained good agreement with experimental data. Numerous computational simulations of RT instability have been carried out by Youngs (Reference Youngs1984, Reference Youngs1989, Reference Youngs1991, Reference Youngs1994), establishing the classical result that the multimode RT instability grows as h ~ t 2, where h is the amplitude of the instability and t is the time. Experiments on RT instability have also been carried out by Dalziel (Reference Dalziel1993) and Dimonte and Schneider (Reference Dimonte and Schneider2000), corroborating this result. Despite these elaborate studies, RT instability still eludes researchers. For example, when a fluid interface is accelerated in a dusty gas (i.e., gas-solid particle mixture), the growth of RT instability has not been characterized in the literature. Recently, Balakrishnan and Menon (Reference Balakrishnan and Menon2011) derived and presented a multiphase buoyancy-drag model, extending the work of Srebro et al. (Reference Srebro, Elbaz, Sadot, Arazi and Shvarts2003). A multiphase Atwood number, first introduced in Ukai et al. (Reference Ukai, Balakrishnan and Menon2010), is observed to play a significant role in characterizing the dusty gas RT instability. This multiphase Atwood number, A m, is defined as:
 $$A_m=\displaystyle{{{\rm \rho} _2 \left[{1+f_2 /\lpar 1+St_2 \rpar } \right]- {\rm \rho} _1 \left[{1+f_1 /\lpar 1+St_1 \rpar } \right]} \over {{\rm \rho} _2 \left[{1+f_2 /\lpar 1+St_2 \rpar } \right]+{\rm \rho} _1 \left[{1+f_1 /\lpar 1+St_1 \rpar } \right]}}\comma \;$$
where f 1 and f 2 denote, respectively, the particle mass loading in the light and heavy gases, and are evaluated as f i = mN o /ρi, i = 1,2, where m is the particle mass and N o is the dust concentration in number per unit volume. Thus, for the definition, we can represent ρi (1 + f i/(1 + St i)) as ρim, i = 1, 2. Furthermore, St 1 and St 2 denote, respectively, the particle Stokes number in the respective fluids, which represent how fast solid particles can respond to the background fluids. See Balakrishnan and Menon (Reference Balakrishnan and Menon2011) and Ukai et al. (Reference Ukai, Balakrishnan and Menon2010) for more discussions.
It is of interest to investigate the dependence of RT instability in dusty gases, for which A m plays a significant role, just as A does so for the classical RT instability in pure gases. In particular, Balakrishnan and Menon (Reference Balakrishnan and Menon2011) showed that the problem of multiphase RT instability can be classified into four groups: (1) bubbles in a pure gas rising into a region of particles; (2) spikes in a pure gas falling into a region of particles; (3) bubbles in a region of particles rising into a pure gas; and (4) spikes in a region of particles falling into a pure gas. Furthermore, it was also shown that for classes (2) and (3), the spikes and bubbles, respectively, oscillate in a gravity wave-like phenomenon due to the buoyancy term changing sign alternatively as it crosses the multiphase interface. The spike or bubble, as the case may be, penetrates different amounts into the dusty or pure gas for every subsequent penetration. However, such oscillatory patterns have hitherto never been investigated, thereby motivating the undertaking this study. Specifically, the dependence of these oscillations on a suite of identified parameters is of interest in this study.
The investigation of such multiphase RT instabilities has applications to multiphase explosions (Balakrishnan and Menon, Reference Balakrishnan and Menon2010; Balakrishnan, Reference Balakrishnan2010), as it can be used to characterize the fireball dynamical behavior in explosions that involve solid particles, for example, aluminum particles. Also, the growth of plasma in dusty gases—which is still a field of research in its infancy—can be characterized by such simple analytic methods. Even the growth of hydrodynamic instabilities in laser-driven inertial confinement fusion can be investigated using the present analysis, particularly when other solid particles/impurities are present.
This study is organized as follows: in Section 2, we present the method of study, i.e., the multiphase buoyancy-drag model equations; in Section 3, we present the results and discussions of this study; finally, the conclusions from this study are summarized in Section 4.
2. METHOD OF STUDY
We investigate the oscillatory characteristic of the multiphase RT instability using the multiphase buoyancy-drag model (MBD), recently introduced by Balakrishnan and Menon (Reference Balakrishnan and Menon2011). Here, the rise of an RT bubble or the fall of an RT spike, in a dusty gas environment, is modeled using an evolution equation that accounts for buoyancy and drag forces. We define the velocity of a bubble and a spike, respectively, as u B and u S, the perturbation wavelength as λ, and the acceleration as g(t). Following Balakrishnan and Menon (Reference Balakrishnan and Menon2011), the equations for bubble rise and spike fall in dusty gases are given by:
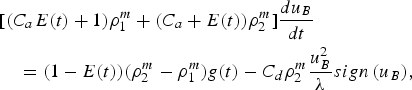 $$\eqalignno{&[ \lpar C_a E\lpar t\rpar +1\rpar {\rm \rho} _1^m+\lpar C_a+E\lpar t\rpar \rpar {\rm \rho} _2^m \rsqb \displaystyle{{du_B } \over {dt}} \cr & \quad=\lpar 1 - E\lpar t\rpar \rpar \lpar {\rm \rho} _2^m - {\rm \rho} _1^m \rpar g\lpar t\rpar - C_d {\rm \rho} _2^m \displaystyle{{u_B^2 } \over {\rm \lambda} }sign\,\lpar u_B \rpar \comma}$$
 $$\eqalignno{&[ \lpar C_a E\lpar t\rpar +1\rpar {\rm \rho} _2^m+\lpar C_a+E\lpar t\rpar \rpar {\rm \rho} _1^m \rsqb \displaystyle{{du_S } \over {dt}}\cr & \quad =\lpar 1 - E\lpar t\rpar \rpar \lpar {\rm \rho} _2^m - {\rm \rho} _1^m \rpar g\lpar t\rpar - C_d {\rm \rho} _1^m \displaystyle{{u_S^2 } \over {\rm \lambda} }sign\,\lpar u_S \rpar \comma}$$
where C a is the added mass coefficient, with values 2 for 2D and 1 for 3D, respectively, and C d is the drag coefficient, with values 6π for 2D and 2π for 3D, respectively (Srebro et al., Reference Srebro, Elbaz, Sadot, Arazi and Shvarts2003). Furthermore, the factor E(t) accounts for the amplitude dependence, and is given by E(t) = e −C ekh B, where C e is a constant that takes the values 3 for 2D and 2 for 3D (Srebro et al., Reference Srebro, Elbaz, Sadot, Arazi and Shvarts2003), and k = 2π/λ is the wavenumber. The sign () terms are used in the above expressions so that the drag term (with the minus sign in place) always acts opposite to the direction of velocity.
For multimode perturbations, a characteristic wavelength,  $\widehat {\rm \lambda}$, is used in place of λ in the above equations as perturbations can compete and merge, thereby altering the wavelength with time. The evolution equation for
  $\widehat{\rm \lambda}$ is given by:
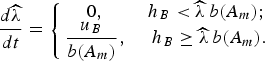 $$\displaystyle{{d\widehat{\rm \lambda} } \over {dt}}=\left\{{\matrix{ {0\comma \; } & {h_B\lt \widehat{\rm \lambda} \, b\lpar A_m \rpar \semicolon \; } \cr {\displaystyle{{u_B } \over {b\lpar A_m \rpar }}\comma \; } & {h_B \geq \widehat{\rm \lambda} \, b\lpar A_m \rpar .} \cr } } \right.$$
Here, h B is the bubble amplitude and b(A m) is a constant given by (Balakrishnan and Menon, Reference Balakrishnan and Menon2011):
 $$b\lpar A_m \rpar =\displaystyle{{0.5} \over {1+A_m }}\, \lpar 2{\rm D}\rpar \semicolon \; b\lpar A_m \rpar =\displaystyle{{1.6} \over {1+A_m }}\, \lpar 3{\rm D}\rpar .$$
Thus, in this formulation, when the bubble amplitude is comparable to the perturbation characteristic wavelength, the latter grows due to bubble competition and merging. This inevitably affects the drag term on the bubbles and spikes, with larger hydrodynamic scales resulting in faster acceleration. Finally, the bubble and spike amplitudes, h B and h S, respectively, are evaluated by integrating the expressions:
 $$u_B=\displaystyle{{dh_B } \over {dt}}\semicolon \; u_S=\displaystyle{{dh_S } \over {dt}}.$$
These equations are solved using a first-order direct integration at every time step, from which the solution is sequentially advanced. The time step, Δt, is chosen such that 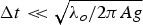 $\Delta t\lt \!\!\lt \sqrt {{\rm \lambda} _o /2{\rm \pi} Ag}$, where λo is the initial perturbation wavelength; for this study, we use
 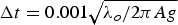 $\Delta t=0.001\sqrt {{\rm \lambda} _o /2{\rm \pi} Ag}$, which after several numerical experiments was found to suffice. See Ramshaw (Reference Ramshaw1998) for more discussions on the choice of the time step.
3. RESULTS AND DISCUSSION
We investigate the problem of bubbles in a multiphase multimode RT instability rising into a region of pure gas, and spikes in a pure gas multimode RT falling into a region of particles (dusty gas). A schematic of these two test problems is presented in Figure 1. As shown by Balakrishnan and Menon (Reference Balakrishnan and Menon2011), this problem is characterized by the bubble or spike amplitudes, as the case may be, demonstrating an oscillatory pattern due to the buoyancy term changing sign alternatively (essentially, the term ρ2m − ρ1m) in Eqs. (2) and (3).

Fig. 1. Schematic of (a) dusty gas bubbles rising into a region of pure gas; (b) pure gas spikes falling into a region of particles. The arrow denotes the sign of the acceleration, g. The small circles represent particles and the regions without circles represents the pure gas. The perturbed interface that separates the heavy and light fluids initially is shown by the distorted curve. The heavy and light fluids are appropriately identified.
In the following discussions, all dimensional units be presented in metric units.
3.1. Dusty Gas Bubbles Rising into A Pure Gas
We now investigare the rise of dusty gas RT bubbles into a pure gas. First, we consider a representative case corresponding to A = 0.25, with initial amplitude a o = 10−4 m and initial wavelength λ =10−2 m. For the particles, we assume r p = 40 μm and ρp = 2500 kg/m3. The viscosity and the gravitational acceleration are taken to be 1.5 × 10⁻⁵ Pa-s and 1 m/s2, respectively. The initial pure/dusty gas interface is located 1.5 m from the initial interface (from which the instability starts to grow initially), and the particle number density in the dusty gas is taken as N = 0.75 × 10¹⁰ m−3. We use the 3D version of the model to demonstrate bubble oscillations.
The amplitude growth of the bubbles (h B) and spikes (h S) are shown in Figure 2a Whereas the spike is unaffected, the bubble amplitude oscillates around the dusty gas/pure gas interface (located at 1.5 m) due to the alternate reversal of the sign of the buoyancy term; we also note that the amplitude of the oscillations decay with time (Fig. 2b). we denote the respective bubble amplitude on either sides of the interface as h+ and h− respectively, on the pure gas side (>1.5 m) and the dusty gas side (<1.5 m), as shown in Figure 2b; in particular, we are interested in the h +/h − ratio, and its variation with time; two ways exist for defining such a ratio: either forward (h k+1+/h k−) or backward (h k+/h k−), where subscript k identifies the k-th oscillation. Both these ratios are shown in Figure 3 and they converge at late times to a constant value ≈0.2 (for this case). This means that after a certain number of early oscillations, the oscillations attain a state such that every subsequent amplitude is a constant factor (≈0.2 in this case) of the previous amplitude.

Fig. 2. Dusty gas bubbles rising into a pure gas: (a) bubble and spike amplitude growths (b) zoomed version of the same figure showing the oscillatory bubble amplitude.

Fig. 3. Ratio of h + and h −.
Analysis also shows that this constant value for the ratio happens to be independent of the exact location of the interface, demonstrated in Figure 4a for both 2D and 3D versions of the model; if the pure/dusty gas interface is closer to the initial interface, this constant value is reached sooner; if the pure gas is farther, this ratio is reached later. Thus, bubbles rising from a dusty gas to a pure gas exhibit oscillatory patterns that at later times are characterized by a constant amplitude ratio for contiguous oscillations. Numerical experiments reveal that this constant value for the ratio happens to be dependent only on the choice of A, Am (to be demonstrated soon) and the initial characteristic wavelength of the perturbation, λo; in Figure 4b, we show the dependence of this amplitude ratio on λo for both 2D and 3D versions of the model. Analysis also reveals that the amplitude ratio is independent of the initial amplitude (not shown here for brevity).

Fig. 4. Dusty gas bubbles rising into a pure gas: effect of (a) interface location; (b) initial characteristic wavelength, λo.
Next, we identify the dependence of this ratio on A and A m. To obtain different A m, both r p and N are varied over a physically meaningful range. Typically, r p is varied in the range 4–500 μm, which is of typical interest for engineering applications (for instance, the author studied multiphase explosions in Balakrishnan (Reference Balakrishnan2010), where solid particles were considered in this range). N is varied on the order of 1010−1011 m−3, as this will result in the mass of solid particles per unit total volume to be comparable to the fluid density, for the chosen particle size range. For A = 0.7, we plot the amplitude ratio as a function of A m for the 2D and 3D versions of the model, respectively, in Figures 5a and 5b. We observe this ratio to vary over three orders magnitude or more, over the chosen range of A m. These data points involve different r p and N, and follow the same trend, indicating that for a given A and λo, this ratio depends only on A m.

Fig. 5. Variation of the ratio for A = 0.7: (a) 2D; (b) 3D.
To facilitate future comparisons with experiments, we also considered A = 0.2, 0.5, 0.9, in addition to A = 0.7, and the 3D ratios for bubble oscillations are presented in Figure 6. We observe that for oscillating bubbles, the ratio decreases with A for the same A m.

Fig. 6. Oscillating bubbles: variation of the 3D ratio for different A.
3.2. Pure Gas Spikes Falling into a Region of Particles
We now investigate the fall of pure gas spikes into a region of particles. Since the bubbles in this problem always remain in the pure gas region, we employ b(A) for this analysis. First, we consider a representative test case for A = 0.5 to demonstrate the role of the interface location and λo on spike oscillations. The initial amplitude is a o = 10−4 m and initial wavelength λo = 5 × 10⁻² m. For the particles, we assume r p = 40 μm and ρp =2500 kg/m3, as before. In addition, the same values as before are used for viscosity and the gravitational acceleration. The particle number density in the dusty gas is taken as N = 2 × 10¹⁰ m−3. First, we demonstrate that the spike oscillations, too, are insensitive to the initial location of the interface (in Fig. 7a) for a fixed λo = 5 × 10⁻² m, but depend on λo (in Fig. 7b) when the initial pure/dusty gas interface is loacted at 1.5 m from the initial interface ( from where the instability starts to grow initially). Numerical experiments reveal that the insensitivity to the location of the interface is applicable for any generic λo; also, the sensitivity to λo holds for any generic A and the initial interface location. However, one interesting observation from Fig. 7b is that for oscillating spikes, the amplitude ratio is higher for the 2D version of the model vis-á-vis 3D, unlike oscillating bubbles.

Fig. 7. Pure gas spikes falling into a dusty gas: effect of (a) interface location; (b) initial characteristic wavelength, λo.
We now also investigate A = 0.2, 0.5, 0.7, and 0.9 cases. The amplitude ratio for A = 0.5 is shown in Figure 8 for 2D and 3D . As before, the ratio monotonically increas with A m for the spikes too, although our observation is that only negative A m cases resulted in oscillatory spike behavior. As already noted above, the ratio is higher for 2D than 3D, unlike the earlier case for bubbles. These conclusions also hold for A = 0.2, 0.7, and 0.9, not shown here for brevity.

Fig. 8. Spikes in a pure gas falling into a region of particles: variation of the ratio for A = 0.5.
In Figure 9, we present the ratios for different A for oscillating spikes. As evident, the ratios increase with A for a given A m for oscillating spikes, in contrast with oscillating bubbles. Thus, oscillating bubbles and spikes have opposite trends for the ratio.

Fig. 9. Oscillating spikes: variation of the 3D ratio for different A.
3.3. Future Dections
The oscillatory characteristics of RT bubbles and spikes demonstrated in this paper is based purely on theoretical grounds. Experimental data along these lines is presently lacking, and therefore whether such oscillations can be observed in nature remains an open question. Such multiphase RT oscillations, if true, have applications to laser-driven inertial confinement fusion, where dusty gases can also be investigated. Another application of the model is in the study of particle jetting effects in explosions (Frost et al., Reference Frost, Gregoire, Goroshin, Ripley and Zhang2011). We hypothesize that the multiphase Atwood number defined earlier can serve as a useful parameter to characterize the growth of hydrodynamic instabilities in multiphase explosions. The rapid acceleration of a pure gas-dusty gas interface can result in the growth of small perturbations on the surface, which can ensue into jet-like particle structures reported by Frost et al. (Reference Frost, Gregoire, Goroshin, Ripley and Zhang2011)—this problem can be investigated with the multiphase buoyancy-drag model. For such spherical growth of instabilities, the multiphase buoyancy-drag model needs to be extended to account for divergence effects. Future work can address these issues.
4. CONCLUSIONS
The recently formulated Multiphase Buoyancy-Drag model is applied to investigate the (1) rise of dusty gas Rayleigh-Taylor instability bubbles into a region of pure gas and the (2) fall of pure gas Rayleigh-Taylor instability spikes into a region of particles. The bubbles and spikes oscillate, with the ratio of the amplitudes on the pure and dusty sides of the interface asymptoting to a constant which is dependent only on the initial Atwood number (A), the multiphase Atwood number (A m), and the initial wavelength of the perturbation (λo). Both 3D and 2D bubble and spike oscillations are studied and the dependence of the ratio on the Atwood number is opposite for oscillating bubbles and spikes.


