


1. Introduction
Turbulent convection occurs in a variety of astrophysical and geophysical flows, including convection in the ocean (Marshall & Schott Reference Marshall and Schott1999), in the outer layer of the Sun (Miesch Reference Miesch2000), and in the fluid cores of the Earth and other terrestrial planets (Busse Reference Busse2000; Olson Reference Olson2013). Many planetary bodies in the solar system undergo time-dependent rotations. For instance, the spinning rate of Mercury exhibits oscillations dominated by an 88-day periodicity. It is expected that the resulting librating force strongly influences the convective dynamo process in its fluid core that sustains Mercury’s global magnetic field (Koning & Dumberry Reference Koning and Dumberry2013). Furthermore, variation of the Earth’s rotation speed occurs due to the change of polar ice sheets between ice and non-ice ages (Doake Reference Doake1977), which may produce perturbations to the outer-core convection and lead to the observed temporal variations of the geomagnetic field (Miyagoshi & Hamano Reference Miyagoshi and Hamano2013).
Turbulent Rayleigh–Bénard convection (RBC) in a fluid heated from below has been studied extensively as a paradigmatic model for turbulent convection in recent years (Ahlers, Grossmann & Lohse Reference Ahlers, Grossmann and Lohse2009; Lohse & Xia Reference Lohse and Xia2010; Chillá & Schumacher Reference Chillá and Schumacher2012). The main component of the fluid flow in turbulent RBC is a large-scale circulation (LSC) in a vertically oriented plane that consists of buoyant plumes detached from the thermal boundary layers (see e.g. Krishnamurti & Howard Reference Krishnamurti and Howard1981; Niemela, Babuin & Sreenivasan Reference Niemela, Babuin and Sreenivasan2001; Sreenivasan, Bershadskii & Niemela Reference Sreenivasan, Bershadskii and Niemela2002; Funfschilling & Ahlers Reference Funfschilling and Ahlers2004; Brown, Nikolaenko & Ahlers Reference Brown, Nikolaenko and Ahlers2005; Xi et al. Reference Xi, Zhou, Zhou, Chan and Xia2009). An important feature of the LSC is the dynamical change of the azimuthal orientation of its circulation plane, which includes erratic reorientations, such as cessations and reversals (Sreenivasan et al. Reference Sreenivasan, Bershadskii and Niemela2002; Araujo, Grossmann & Lohse Reference Araujo, Grossmann and Lohse2005; Brown et al. Reference Brown, Nikolaenko and Ahlers2005), originated from stochastic turbulent fluctuations in the background flow, as well as azimuthal motions governed by deterministic fluid momentum transport equations (Hart, Kittelman & Ohlsen Reference Hart, Kittelman and Ohlsen2002; Brown & Ahlers Reference Brown and Ahlers2006, Reference Brown and Ahlers2007, Reference Brown and Ahlers2008; Kunnen, Clercx & Geurts Reference Kunnen, Clercx and Geurts2008).
To our knowledge, to date, the azimuthal motion of the LSC has been investigated experimentally only in the context of time-independent forcing. Examples include the Coriolis force in constant-rotation convection (Hart et al. Reference Hart, Kittelman and Ohlsen2002; Brown & Ahlers Reference Brown and Ahlers2006; Kunnen et al. Reference Kunnen, Clercx and Geurts2008; Zhong & Ahlers Reference Zhong and Ahlers2010), and the fluid pressure gradients due to the azimuthal asymmetry of the flow field created in samples with non-circular cross-sections (Song et al. Reference Song, Brown, Hawkins and Tong2014). Under these conditions the fluid acceleration is quickly damped in the presence of the viscous dissipation from the boundary layers (BLs) and does not significantly impact the LSC flow. How the LSC dynamics is influenced by azimuthal fluid acceleration therefore still remains an open question.
Several fluid models have been developed to describe the dynamics of the LSC, including stochastic models that interpret flow reversal as a random diffusion process of the LSC strength in a potential well (Sreenivasan et al.
Reference Sreenivasan, Bershadskii and Niemela2002), and deterministic models based on fluid momentum equations that predict oscillations of the LSC direction (Resagk et al.
Reference Resagk, du Puits, Thess, Dolzhansky, Grossmann, Araujo and Lohse2006) and cessations (Araujo et al.
Reference Araujo, Grossmann and Lohse2005). In order to describe the rich azimuthal dynamics of the LSC, a model consisting of two stochastic differential equations, respectively, the LSC azimuthal velocity
 $\dot{{\it\theta}}$
and thermal amplitude
$\dot{{\it\theta}}$
and thermal amplitude
 ${\it\delta}$
, was developed (Brown & Ahlers Reference Brown and Ahlers2007, Reference Brown and Ahlers2008). The model has provided predictions for aspects of the LSC dynamics such as diffusive meandering and erratic reorientation observed in experiments (Brown et al.
Reference Brown, Nikolaenko and Ahlers2005; Song et al.
Reference Song, Brown, Hawkins and Tong2014). Recently, this model was extended to include rotation effects and calculate the cessation frequency and the probability distribution of
${\it\delta}$
, was developed (Brown & Ahlers Reference Brown and Ahlers2007, Reference Brown and Ahlers2008). The model has provided predictions for aspects of the LSC dynamics such as diffusive meandering and erratic reorientation observed in experiments (Brown et al.
Reference Brown, Nikolaenko and Ahlers2005; Song et al.
Reference Song, Brown, Hawkins and Tong2014). Recently, this model was extended to include rotation effects and calculate the cessation frequency and the probability distribution of
 ${\it\delta}$
in rotating RBC (Assaf, Angheluta & Goldenfeld Reference Assaf, Angheluta and Goldenfeld2012). These theoretical results were in close agreement with the experimental observations (Zhong & Ahlers Reference Zhong and Ahlers2010).
${\it\delta}$
in rotating RBC (Assaf, Angheluta & Goldenfeld Reference Assaf, Angheluta and Goldenfeld2012). These theoretical results were in close agreement with the experimental observations (Zhong & Ahlers Reference Zhong and Ahlers2010).
Earlier experiments have been devoted to study the influence of modulated rotation on the convection instability in RBC. Niemela, Smith & Donnelly (Reference Niemela, Smith and Donnelly1991) reported that suppression of the convective instability took place only in a certain frequency range in which the modulation period is close to the momentum diffusion time across the viscous BL. Outside of this range, modulated rotation was found to result in an apparent destabilization effect, lowering the threshold for onset of convection. Thompson, Bajaj & Ahlers (Reference Thompson, Bajaj and Ahlers2002) studied the effect of modulated rotation rates on the onset of the Kuppers–Lortz (KL) instability. It was found that the modulation of the rotation could prevent the KL instability from occurring, replacing the chaotic patterns by concentric ring-shaped patterns that are generated at the cylinder boundary. Furthermore, an experimental investigation of the heat transport in turbulent RBC in the presence of modulated rotation was performed by Niemela, Babuin & Sreenivasan (Reference Niemela, Babuin and Sreenivasan2010). A sharp transition to a state of enhanced heat transport was observed at significantly large modulation amplitudes. Recent numerical simulations (Geurts & Kunnen Reference Geurts and Kunnen2014) elucidated how the enhanced heat transport in turbulent RBC is due to reorganizations of the thermal flow structures under rapidly modulated rotations. The influence of modulated rotation on the flow fields has also been investigated both experimentally and theoretically in the context of Taylor–Couette systems (see e.g. Donnelly Reference Donnelly1964; Hall Reference Hall1975; Avila et al. Reference Avila, Belisle, Lopez, Marques and Saric2008).
In this paper we present investigations of the LSC dynamics in turbulent RBC when the fluid is subjected to librating rotations. We focus on the dynamical response of the LSC azimuthal velocity
 $\dot{{\it\theta}}$
when fluid acceleration is created by oscillating Coriolis force, and the time-dependent LSC thermal amplitude
$\dot{{\it\theta}}$
when fluid acceleration is created by oscillating Coriolis force, and the time-dependent LSC thermal amplitude
 ${\it\delta}$
driven by oscillatory viscous BLs. We proceed as follows. In § 2 we describe the experimental apparatus and methods. Section 3.1 presents results pertaining to oscillations of the LSC azimuthal orientation
${\it\delta}$
driven by oscillatory viscous BLs. We proceed as follows. In § 2 we describe the experimental apparatus and methods. Section 3.1 presents results pertaining to oscillations of the LSC azimuthal orientation
 ${\it\theta}(t)$
and velocity
${\it\theta}(t)$
and velocity
 $\dot{{\it\theta}}(t)$
. Experimental results are compared with theoretical predictions from a one-dimensional model. In § 3.2 we discuss oscillations of the LSC thermal amplitude
$\dot{{\it\theta}}(t)$
. Experimental results are compared with theoretical predictions from a one-dimensional model. In § 3.2 we discuss oscillations of the LSC thermal amplitude
 ${\it\delta}$
. We extended the LSC model (Brown & Ahlers Reference Brown and Ahlers2007, Reference Brown and Ahlers2008), considering a rotation-dependent thickness of the viscous BLs and a finite relaxation time
${\it\delta}$
. We extended the LSC model (Brown & Ahlers Reference Brown and Ahlers2007, Reference Brown and Ahlers2008), considering a rotation-dependent thickness of the viscous BLs and a finite relaxation time
 ${\it\tau}$
for
${\it\tau}$
for
 ${\it\delta}(t)$
in response to the oscillating BL thickness. The model predictions are in good agreement with the experimental results. In § 3.3 we report the resonant response in
${\it\delta}(t)$
in response to the oscillating BL thickness. The model predictions are in good agreement with the experimental results. In § 3.3 we report the resonant response in
 $\dot{{\it\theta}}(t)$
observed in an intermediate modulation frequency regime, which can also be interpreted qualitatively with our model. A brief summary and discussion of the results is provided in § 4.
$\dot{{\it\theta}}(t)$
observed in an intermediate modulation frequency regime, which can also be interpreted qualitatively with our model. A brief summary and discussion of the results is provided in § 4.
2. Experimental apparatus and methods
The experiment was performed with a constant Rayleigh number
 $\mathit{Ra}\equiv {\it\alpha}g{\rm\Delta}TL^{3}/{\it\kappa}{\it\nu}=8.24\times 10^{9}$
(
$\mathit{Ra}\equiv {\it\alpha}g{\rm\Delta}TL^{3}/{\it\kappa}{\it\nu}=8.24\times 10^{9}$
(
 $g$
is the gravitational acceleration,
$g$
is the gravitational acceleration,
 ${\it\alpha},{\it\nu}$
and
${\it\alpha},{\it\nu}$
and
 ${\it\kappa}$
are the thermal expansion coefficient, the viscosity and thermal diffusivity of water,
${\it\kappa}$
are the thermal expansion coefficient, the viscosity and thermal diffusivity of water,
 ${\rm\Delta}T$
is the applied temperature difference and
${\rm\Delta}T$
is the applied temperature difference and
 $L$
is the sample height) and a constant Prandtl number
$L$
is the sample height) and a constant Prandtl number
 $\mathit{Pr}\equiv {\it\nu}/{\it\kappa}=4.38$
. We used a convection sample that had a similar design to the apparatus described in Zhong et al. (Reference Zhong, Stevens, Clercx, Verzicco, Lohse and Ahlers2009) and Zhong & Ahlers (Reference Zhong and Ahlers2010). It had circular top and bottom plates made of oxygen-free copper (OFHC, TU1). The sample was filled with deionized water at a mean temperature of
$\mathit{Pr}\equiv {\it\nu}/{\it\kappa}=4.38$
. We used a convection sample that had a similar design to the apparatus described in Zhong et al. (Reference Zhong, Stevens, Clercx, Verzicco, Lohse and Ahlers2009) and Zhong & Ahlers (Reference Zhong and Ahlers2010). It had circular top and bottom plates made of oxygen-free copper (OFHC, TU1). The sample was filled with deionized water at a mean temperature of
 $40.00\,^{\circ }\text{C}$
. It had a diameter
$40.00\,^{\circ }\text{C}$
. It had a diameter
 $D=24.1~\text{cm}$
and a height
$D=24.1~\text{cm}$
and a height
 $L=24.0~\text{cm}$
, yielding an aspect ratio of 1.00. The Plexiglas (Lexan) sidewall, 0.4 cm in thickness, was fitted into a groove in each copper plate. Three rows of eight thermistors, equally spaced azimuthally and lined up in vertical columns at heights
$L=24.0~\text{cm}$
, yielding an aspect ratio of 1.00. The Plexiglas (Lexan) sidewall, 0.4 cm in thickness, was fitted into a groove in each copper plate. Three rows of eight thermistors, equally spaced azimuthally and lined up in vertical columns at heights
 $L/4$
,
$L/4$
,
 $L/2$
and
$L/2$
and
 $3L/4$
, were placed into the sidewall so as to be within
$3L/4$
, were placed into the sidewall so as to be within
 $d=0.08\pm 0.01~\text{cm}$
from the fluid surface. We measured the temperature of each thermistor
$d=0.08\pm 0.01~\text{cm}$
from the fluid surface. We measured the temperature of each thermistor
 $T_{i}$
with a sampling frequency of 4.0 s, and fitted the function
$T_{i}$
with a sampling frequency of 4.0 s, and fitted the function
 $T_{i}=T_{0}+{\it\delta}\cos (\text{i}{\rm\pi}/4-{\it\theta}),i=1,\dots ,8$
, to the eight temperatures in each row. Following this experimental protocol, we determined the LSC thermal amplitude
$T_{i}=T_{0}+{\it\delta}\cos (\text{i}{\rm\pi}/4-{\it\theta}),i=1,\dots ,8$
, to the eight temperatures in each row. Following this experimental protocol, we determined the LSC thermal amplitude
 ${\it\delta}(t)$
and the azimuthal orientation
${\it\delta}(t)$
and the azimuthal orientation
 ${\it\theta}(t)$
of its circulating plane (Brown et al.
Reference Brown, Nikolaenko and Ahlers2005). The results shown here are from the middle-row thermistors unless stated otherwise.
${\it\theta}(t)$
of its circulating plane (Brown et al.
Reference Brown, Nikolaenko and Ahlers2005). The results shown here are from the middle-row thermistors unless stated otherwise.
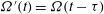
The convection sample was mounted on a rotary table. When working in a modulation mode, the rotating velocity of the sample varied according to
 ${\it\Omega}={\it\Omega}_{0}[1+{\it\beta}\cos ({\it\omega}t)]$
. We chose
${\it\Omega}={\it\Omega}_{0}[1+{\it\beta}\cos ({\it\omega}t)]$
. We chose
 ${\it\Omega}_{0}=0.104~\text{rad}~\text{s}^{-1}$
and
${\it\Omega}_{0}=0.104~\text{rad}~\text{s}^{-1}$
and
 ${\it\beta}=0.212$
, so the Rossby number
${\it\beta}=0.212$
, so the Rossby number
 $\mathit{Ro}=\sqrt{({\it\alpha}g{\rm\Delta}T/L)}/2{\it\Omega}$
varied periodically in the range (
$\mathit{Ro}=\sqrt{({\it\alpha}g{\rm\Delta}T/L)}/2{\it\Omega}$
varied periodically in the range (
 $0.31\leqslant 1/\mathit{Ro}\leqslant 0.51$
) in the presence of modulation. As depicted in grey in figure 1(a), in this range the LSC retrograde rotation rate
$0.31\leqslant 1/\mathit{Ro}\leqslant 0.51$
) in the presence of modulation. As depicted in grey in figure 1(a), in this range the LSC retrograde rotation rate
 ${\it\omega}_{LSC}$
and the thermal amplitude
${\it\omega}_{LSC}$
and the thermal amplitude
 ${\it\delta}$
exhibit the maximum responses to variations in
${\it\delta}$
exhibit the maximum responses to variations in
 ${\it\Omega}$
. The normalized modulation rate
${\it\Omega}$
. The normalized modulation rate
 ${\it\omega}/{\it\Omega}_{0}$
ranged from 0.025 to 1.0. The LSC flow velocity in its circulating plane,
${\it\omega}/{\it\Omega}_{0}$
ranged from 0.025 to 1.0. The LSC flow velocity in its circulating plane,
 $U\approx 1.5~\text{cm}~\text{s}^{-1}$
, was determined by the LSC turnover time measured through the autocorrelation functions of the sidewall temperatures (Zhong & Ahlers Reference Zhong and Ahlers2010). Thus the Strouhal number
$U\approx 1.5~\text{cm}~\text{s}^{-1}$
, was determined by the LSC turnover time measured through the autocorrelation functions of the sidewall temperatures (Zhong & Ahlers Reference Zhong and Ahlers2010). Thus the Strouhal number
 $\mathit{Sr}=L\dot{{\it\Omega}}/4{\it\Omega}U$
, which measures the ratio of the Euler force and the Coriolis force, did not exceed 0.08.
$\mathit{Sr}=L\dot{{\it\Omega}}/4{\it\Omega}U$
, which measures the ratio of the Euler force and the Coriolis force, did not exceed 0.08.

Figure 1. Dynamical properties of the LSC when the sample rotates at constant rate. (a) The mean retrograde rotation velocity
 ${\it\omega}_{LSC}$
as a function of
${\it\omega}_{LSC}$
as a function of
 $1/\mathit{Ro}$
. (b) The mean LSC amplitude
$1/\mathit{Ro}$
. (b) The mean LSC amplitude
 ${\it\delta}$
as a function of
${\it\delta}$
as a function of
 $1/\mathit{Ro}$
. Symbols: black squares, experimental data from Zhong & Ahlers (Reference Zhong and Ahlers2010) with
$1/\mathit{Ro}$
. Symbols: black squares, experimental data from Zhong & Ahlers (Reference Zhong and Ahlers2010) with
 $\mathit{Ra}=8.97\times 10^{9}$
; red circles, the present work with
$\mathit{Ra}=8.97\times 10^{9}$
; red circles, the present work with
 $\mathit{Ra}=8.24\times 10^{9}$
. The range in which we perform the modulated rotation experiment is indicated in grey. The dashed line in (b) is a linear fit to the open circles, through which we determine
$\mathit{Ra}=8.24\times 10^{9}$
. The range in which we perform the modulated rotation experiment is indicated in grey. The dashed line in (b) is a linear fit to the open circles, through which we determine
 ${\it\chi}(1/\mathit{Ro})={\it\delta}(1/\mathit{Ro})/{\it\delta}(0)=-5.1/\mathit{Ro}+3.1$
in (3.2) and (3.3).
${\it\chi}(1/\mathit{Ro})={\it\delta}(1/\mathit{Ro})/{\it\delta}(0)=-5.1/\mathit{Ro}+3.1$
in (3.2) and (3.3).
Thermistors embedded within the top and bottom conductive plates were calibrated simultaneously in a separate apparatus against a laboratory standard platinum thermometer traceable to the ITS-90 temperature scale, with a precision better than
 $0.002\,^{\circ }\text{C}$
. In each of the conductive plates, there was one thermistor at the plate centre, and six thermistors equally spaced on a circle of 21.0 cm in diameter. The temperature inhomogeneity on each conductive plate, as measured by these thermistors, was within one or two per cent of
$0.002\,^{\circ }\text{C}$
. In each of the conductive plates, there was one thermistor at the plate centre, and six thermistors equally spaced on a circle of 21.0 cm in diameter. The temperature inhomogeneity on each conductive plate, as measured by these thermistors, was within one or two per cent of
 ${\rm\Delta}T$
during the experiment. Calibration of the 24 sidewall thermistors was conducted against the top- and bottom-plate thermistors.
${\rm\Delta}T$
during the experiment. Calibration of the 24 sidewall thermistors was conducted against the top- and bottom-plate thermistors.
The finite thermal diffusion process through the sidewall to the thermistors in it causes a time delay in our measurements of the fluid temperature. The main time delay between the instantaneous fluid temperature and the temperature measured by the sidewall thermistors is estimated to be
 $d^{2}/{\it\kappa}_{s}\approx 4.6~\text{s}$
(
$d^{2}/{\it\kappa}_{s}\approx 4.6~\text{s}$
(
 ${\it\kappa}_{s}$
is the sidewall thermal diffusivity). Such a time delay has been taken into account in determining
${\it\kappa}_{s}$
is the sidewall thermal diffusivity). Such a time delay has been taken into account in determining
 ${\it\phi}_{\dot{{\it\theta}}}$
and
${\it\phi}_{\dot{{\it\theta}}}$
and
 ${\it\phi}_{{\it\delta}}$
discussed in figures 4 and 5(a). Such corrections are much less than the standard deviation of
${\it\phi}_{{\it\delta}}$
discussed in figures 4 and 5(a). Such corrections are much less than the standard deviation of
 ${\it\phi}_{\dot{{\it\theta}}}$
and
${\it\phi}_{\dot{{\it\theta}}}$
and
 ${\it\phi}_{{\it\delta}}$
.
${\it\phi}_{{\it\delta}}$
.
3. Results
3.1. Oscillations of the LSC azimuthal orientation
 ${\it\theta}$
and velocity
$\dot{{\it\theta}}$
${\it\theta}$
and velocity
$\dot{{\it\theta}}$


Figure 2(a) shows a time series of
 ${\it\theta}$
for
${\it\theta}$
for
 ${\it\omega}/{\it\Omega}_{0}=0.1$
. The azimuthal orientation of the LSC undergoes linear net rotation in the retrograde direction at an average rate
${\it\omega}/{\it\Omega}_{0}=0.1$
. The azimuthal orientation of the LSC undergoes linear net rotation in the retrograde direction at an average rate
 ${\it\omega}_{LSC}$
. Within our experimental resolution,
${\it\omega}_{LSC}$
. Within our experimental resolution,
 ${\it\omega}_{LSC}$
is determined by
${\it\omega}_{LSC}$
is determined by
 ${\it\Omega}_{0}$
, but independent of the modulation frequency
${\it\Omega}_{0}$
, but independent of the modulation frequency
 ${\it\omega}$
. However, the detrended time series
${\it\omega}$
. However, the detrended time series
 ${\it\theta}_{d}(t)=-{\it\theta}(t)-{\it\omega}_{LSC}t$
exhibited not only diffusive behaviour in long time scales, but also clear oscillations at the modulation frequency
${\it\theta}_{d}(t)=-{\it\theta}(t)-{\it\omega}_{LSC}t$
exhibited not only diffusive behaviour in long time scales, but also clear oscillations at the modulation frequency
 ${\it\omega}$
(figure 2
b). Typical power spectra of
${\it\omega}$
(figure 2
b). Typical power spectra of
 ${\it\theta}_{d}(t)$
, given in figure 2(d), show a main peak at
${\it\theta}_{d}(t)$
, given in figure 2(d), show a main peak at
 $f={\it\omega}$
in a background spectrum falling off as
$f={\it\omega}$
in a background spectrum falling off as
 $f^{-2}$
, the latter corresponding to a diffusive meandering of the LSC in the azimuthal direction. The signal-to-noise ratio of the peak for oscillations decreases with increasing
$f^{-2}$
, the latter corresponding to a diffusive meandering of the LSC in the azimuthal direction. The signal-to-noise ratio of the peak for oscillations decreases with increasing
 ${\it\omega}$
up to
${\it\omega}$
up to
 ${\it\omega}_{c}\approx {\it\Omega}_{0}$
, beyond which the modulation period
${\it\omega}_{c}\approx {\it\Omega}_{0}$
, beyond which the modulation period
 $T=2{\rm\pi}/{\it\omega}$
is less than the turnover time of the LSC. For higher modulation frequencies
$T=2{\rm\pi}/{\it\omega}$
is less than the turnover time of the LSC. For higher modulation frequencies
 ${\it\omega}\geqslant {\it\omega}_{c}$
the peak at
${\it\omega}\geqslant {\it\omega}_{c}$
the peak at
 $f={\it\omega}$
in the power spectra disappears and we see no regular oscillation in the time series
$f={\it\omega}$
in the power spectra disappears and we see no regular oscillation in the time series
 ${\it\theta}_{d}(t)$
.
${\it\theta}_{d}(t)$
.

Figure 2. Experimental data for
 ${\it\omega}=0.1{\it\Omega}_{0}$
. Time traces (a) for
${\it\omega}=0.1{\it\Omega}_{0}$
. Time traces (a) for
 ${\it\theta}(t)$
, (b) for the corresponding
${\it\theta}(t)$
, (b) for the corresponding
 ${\it\theta}_{d}(t)$
and (c) for the thermal amplitude
${\it\theta}_{d}(t)$
and (c) for the thermal amplitude
 ${\it\delta}(t)$
. Scaled power spectra (d) of
${\it\delta}(t)$
. Scaled power spectra (d) of
 ${\it\theta}(t)$
and (e) of
${\it\theta}(t)$
and (e) of
 ${\it\delta}(t)$
. The solid line in (d) denotes
${\it\delta}(t)$
. The solid line in (d) denotes
 $P_{{\it\theta}}\sim f^{-2}$
.
$P_{{\it\theta}}\sim f^{-2}$
.
Similarly, the thermal amplitude
 ${\it\delta}$
was also found to consist of oscillations in a random-fluctuation background. An example is plotted in figure 2(c) for
${\it\delta}$
was also found to consist of oscillations in a random-fluctuation background. An example is plotted in figure 2(c) for
 ${\it\omega}/{\it\Omega}_{0}=0.1$
, with its power spectrum given in figure 2(e), wherein higher harmonics appear at
${\it\omega}/{\it\Omega}_{0}=0.1$
, with its power spectrum given in figure 2(e), wherein higher harmonics appear at
 $f=(2{\it\omega},\dots ,5{\it\omega})$
in addition to the main peak at the frequency of modulation.
$f=(2{\it\omega},\dots ,5{\it\omega})$
in addition to the main peak at the frequency of modulation.
The principal information of the oscillation phases and amplitudes of
 ${\it\theta}_{d}(t)$
and
${\it\theta}_{d}(t)$
and
 ${\it\delta}(t)$
resides in their time series dominated by the randomly fluctuating background (figure 2
b,c). In order to discern their general responses to
${\it\delta}(t)$
resides in their time series dominated by the randomly fluctuating background (figure 2
b,c). In order to discern their general responses to
 ${\it\Omega}(t)$
more clearly, we divide the time series of
${\it\Omega}(t)$
more clearly, we divide the time series of
 ${\it\theta}_{d}$
and
${\it\theta}_{d}$
and
 ${\it\delta}$
according to the modulation periods. Mean values of
${\it\delta}$
according to the modulation periods. Mean values of
 $\langle {\it\theta}_{d}\rangle$
and
$\langle {\it\theta}_{d}\rangle$
and
 ${\it\delta}_{0}=\langle {\it\delta}\rangle$
are subtracted from
${\it\delta}_{0}=\langle {\it\delta}\rangle$
are subtracted from
 ${\it\theta}_{d}$
and
${\it\theta}_{d}$
and
 ${\it\delta}$
. The data are then overlaid in one modulation cycle to compose data ‘ensembles’. Modulation periods affected by erratic reorientation events defined as
${\it\delta}$
. The data are then overlaid in one modulation cycle to compose data ‘ensembles’. Modulation periods affected by erratic reorientation events defined as
 ${\it\delta}(t)\leqslant 0.1{\it\delta}_{0}$
(Brown et al.
Reference Brown, Nikolaenko and Ahlers2005) are removed from the regular oscillation data in our analysis. An example of ensembles for
${\it\delta}(t)\leqslant 0.1{\it\delta}_{0}$
(Brown et al.
Reference Brown, Nikolaenko and Ahlers2005) are removed from the regular oscillation data in our analysis. An example of ensembles for
 ${\it\omega}/{\it\Omega}_{0}=0.1$
(figure 3
a,b) shows that data points for
${\it\omega}/{\it\Omega}_{0}=0.1$
(figure 3
a,b) shows that data points for
 ${\it\theta}_{d}(t)$
and
${\it\theta}_{d}(t)$
and
 ${\it\delta}(t)$
are mostly collapsed into a sinusoidal curve. Then
${\it\delta}(t)$
are mostly collapsed into a sinusoidal curve. Then
 ${\it\theta}_{d}(t)$
is approximated to an analytical function through a fourth-order Savitzky–Golay method with window length of one modulation cycle. The azimuthal rotation velocity
${\it\theta}_{d}(t)$
is approximated to an analytical function through a fourth-order Savitzky–Golay method with window length of one modulation cycle. The azimuthal rotation velocity
 $\dot{{\it\theta}}(t)$
is then extracted from
$\dot{{\it\theta}}(t)$
is then extracted from
 ${\it\theta}_{d}(t)$
through its time derivative.
${\it\theta}_{d}(t)$
through its time derivative.

Figure 3. Data ensemble (a) of
 ${\it\theta}_{d}(t)$
and (b) of
${\it\theta}_{d}(t)$
and (b) of
 ${\it\delta}(t)$
for
${\it\delta}(t)$
for
 ${\it\omega}=0.1{\it\Omega}_{0}$
. Green lines: modulation periods affected by reorientation events, which are removed from the regular oscillation data (blue curves) for analysis. The red dotted curves show
${\it\omega}=0.1{\it\Omega}_{0}$
. Green lines: modulation periods affected by reorientation events, which are removed from the regular oscillation data (blue curves) for analysis. The red dotted curves show
 ${\it\Omega}(t)$
with arbitrary units.
${\it\Omega}(t)$
with arbitrary units.
Figure 4(a) contains data ensembles of
 $\dot{{\it\theta}}$
for three
$\dot{{\it\theta}}$
for three
 ${\it\omega}$
values. Despite the variance of
${\it\omega}$
values. Despite the variance of
 $\dot{{\it\theta}}$
about its mean oscillations, one sees that the oscillation phase is sensitive to the modulation frequency: when
$\dot{{\it\theta}}$
about its mean oscillations, one sees that the oscillation phase is sensitive to the modulation frequency: when
 ${\it\omega}$
increases,
${\it\omega}$
increases,
 $\dot{{\it\theta}}$
lags behind
$\dot{{\it\theta}}$
lags behind
 ${\it\Omega}(t)$
increasingly. For a quantitative analysis of its oscillatory response, we fitted
${\it\Omega}(t)$
increasingly. For a quantitative analysis of its oscillatory response, we fitted
 $\dot{{\it\theta}}$
in each modulation cycle to
$\dot{{\it\theta}}$
in each modulation cycle to
 $\dot{{\it\theta}}(t)=\dot{{\it\theta}}_{0}+A_{\dot{{\it\theta}}}\cos ({\it\omega}t+{\it\phi}_{\dot{{\it\theta}}})$
. Figure 4(a) shows
$\dot{{\it\theta}}(t)=\dot{{\it\theta}}_{0}+A_{\dot{{\it\theta}}}\cos ({\it\omega}t+{\it\phi}_{\dot{{\it\theta}}})$
. Figure 4(a) shows
 ${\it\phi}_{\dot{{\it\theta}}}$
as a function of
${\it\phi}_{\dot{{\it\theta}}}$
as a function of
 ${\it\omega}/{\it\Omega}_{0}$
. It appears that
${\it\omega}/{\it\Omega}_{0}$
. It appears that
 ${\it\phi}_{\dot{{\it\theta}}}$
decreases most rapidly in the regime of (
${\it\phi}_{\dot{{\it\theta}}}$
decreases most rapidly in the regime of (
 $0.1\leqslant {\it\omega}/{\it\Omega}_{0}\leqslant 0.3$
) and asymptotically reaches
$0.1\leqslant {\it\omega}/{\it\Omega}_{0}\leqslant 0.3$
) and asymptotically reaches
 $-{\rm\pi}/2$
at large
$-{\rm\pi}/2$
at large
 ${\it\omega}$
.
${\it\omega}$
.

Figure 4. (a) The phase lag
 ${\it\phi}_{\dot{{\it\theta}}}$
as a function of
${\it\phi}_{\dot{{\it\theta}}}$
as a function of
 ${\it\omega}/{\it\Omega}_{0}$
. Experimental data are shown as red circles (from middle-row thermistors), purple triangles (top-row) and green inverted triangles (bottom-row). Error bars denote the standard deviation. Black curve: the asymptotic solution of (3.1),
${\it\omega}/{\it\Omega}_{0}$
. Experimental data are shown as red circles (from middle-row thermistors), purple triangles (top-row) and green inverted triangles (bottom-row). Error bars denote the standard deviation. Black curve: the asymptotic solution of (3.1),
 ${\it\phi}_{\dot{{\it\theta}}}=-\tan ^{-1}({\it\omega}/(3{\it\nu}\mathit{Re}/4L^{2}+9{\it\nu}\mathit{Re}^{1/2}/L^{2}))$
. Red curve: numerical solutions for (3.2) and (3.3). Insets: data ensembles for
${\it\phi}_{\dot{{\it\theta}}}=-\tan ^{-1}({\it\omega}/(3{\it\nu}\mathit{Re}/4L^{2}+9{\it\nu}\mathit{Re}^{1/2}/L^{2}))$
. Red curve: numerical solutions for (3.2) and (3.3). Insets: data ensembles for
 $\dot{{\it\theta}}(t)-\dot{{\it\theta}}_{0}$
displayed in the vertical scale
$\dot{{\it\theta}}(t)-\dot{{\it\theta}}_{0}$
displayed in the vertical scale
 $[-0.04,0.04]$
(
$[-0.04,0.04]$
(
 $\text{rad}~\text{s}^{-1}$
). From left to right:
$\text{rad}~\text{s}^{-1}$
). From left to right:
 ${\it\omega}/{\it\Omega}_{0}=0.05$
, 0.1 and 0.33. (b) Extended plot for the theoretical predictions of
${\it\omega}/{\it\Omega}_{0}=0.05$
, 0.1 and 0.33. (b) Extended plot for the theoretical predictions of
 ${\it\phi}_{\dot{{\it\theta}}}$
for
${\it\phi}_{\dot{{\it\theta}}}$
for
 $0\leqslant {\it\omega}/{\it\Omega}_{0}\leqslant 1.6$
.
$0\leqslant {\it\omega}/{\it\Omega}_{0}\leqslant 1.6$
.
The increasing phase lag in
 $\dot{{\it\theta}}$
at large
$\dot{{\it\theta}}$
at large
 ${\it\omega}$
implies that fluid acceleration plays a role in determining the LSC dynamics. To explain this, an equation of motion for
${\it\omega}$
implies that fluid acceleration plays a role in determining the LSC dynamics. To explain this, an equation of motion for
 $\dot{{\it\theta}}$
is obtained from the Navier–Stokes equation, in which the LSC azimuthal acceleration is attributed to its rotational inertia, the viscous dissipation and the Coriolis force (Brown & Ahlers Reference Brown and Ahlers2006):
$\dot{{\it\theta}}$
is obtained from the Navier–Stokes equation, in which the LSC azimuthal acceleration is attributed to its rotational inertia, the viscous dissipation and the Coriolis force (Brown & Ahlers Reference Brown and Ahlers2006):
 $$\begin{eqnarray}\ddot{{\it\theta}}+\left(\frac{3{\it\nu}\mathit{Re}}{4L^{2}}+\frac{9{\it\nu}\sqrt{\mathit{Re}}}{L^{2}}\right)\dot{{\it\theta}}-\frac{3{\it\nu}\mathit{Re}}{4L^{2}}{\it\Omega}(t)=0,\end{eqnarray}$$
with the Reynolds number
 $\mathit{Re}=UL/{\it\nu}$
. When a constant rotation is applied, the azimuthal acceleration
$\mathit{Re}=UL/{\it\nu}$
. When a constant rotation is applied, the azimuthal acceleration
 $\ddot{{\it\theta}}$
is quickly damped by viscous dissipation. Also
$\ddot{{\it\theta}}$
is quickly damped by viscous dissipation. Also
 $\dot{{\it\theta}}(t)$
approaches a steady solution proportional to
$\dot{{\it\theta}}(t)$
approaches a steady solution proportional to
 ${\it\Omega}$
so
${\it\Omega}$
so
 ${\it\phi}_{\dot{{\it\theta}}}=0$
. However, when
${\it\phi}_{\dot{{\it\theta}}}=0$
. However, when
 ${\it\Omega}$
is oscillating at a frequency
${\it\Omega}$
is oscillating at a frequency
 ${\it\omega}$
, the acceleration term
${\it\omega}$
, the acceleration term
 $\ddot{{\it\theta}}$
becomes significant to modify the response of
$\ddot{{\it\theta}}$
becomes significant to modify the response of
 $\dot{{\it\theta}}$
at large
$\dot{{\it\theta}}$
at large
 ${\it\omega}$
. It is this inertia effect that causes the phase lag in
${\it\omega}$
. It is this inertia effect that causes the phase lag in
 $\dot{{\it\theta}}$
. The solution of
$\dot{{\it\theta}}$
. The solution of
 ${\it\phi}_{\dot{{\it\theta}}}$
for (3.1) is depicted in figure 4(a,b), which interprets reasonably the observed increasing phase lag when
${\it\phi}_{\dot{{\it\theta}}}$
for (3.1) is depicted in figure 4(a,b), which interprets reasonably the observed increasing phase lag when
 ${\it\omega}$
increases.
${\it\omega}$
increases.
3.2. Oscillations of the LSC thermal amplitude
${\it\delta}$

Another important aspect of the LSC dynamics in the presence of rotational modulation is the oscillations of its thermal amplitude
 ${\it\delta}$
, which is readily seen in its ensemble (figure 3
b). In order to capture its harmonic features, we fitted
${\it\delta}$
, which is readily seen in its ensemble (figure 3
b). In order to capture its harmonic features, we fitted
 ${\it\delta}(t)$
within each modulation cycle by
${\it\delta}(t)$
within each modulation cycle by
 ${\it\delta}(t)={\it\delta}_{0}+A_{{\it\delta}}\cos ({\it\omega}t+{\rm\pi}+{\it\phi}_{{\it\delta}})$
, neglecting its high-frequency oscillating components indicated in the power spectrum (figure 2
e). The term
${\it\delta}(t)={\it\delta}_{0}+A_{{\it\delta}}\cos ({\it\omega}t+{\rm\pi}+{\it\phi}_{{\it\delta}})$
, neglecting its high-frequency oscillating components indicated in the power spectrum (figure 2
e). The term
 ${\rm\pi}$
is included because
${\rm\pi}$
is included because
 ${\it\delta}(t)$
is anticorrelated to
${\it\delta}(t)$
is anticorrelated to
 ${\it\Omega}(t)$
in the low-frequency limit
${\it\Omega}(t)$
in the low-frequency limit
 ${\it\omega}\approx 0$
(figure 1
b). Figure 5 shows
${\it\omega}\approx 0$
(figure 1
b). Figure 5 shows
 ${\it\phi}_{{\it\delta}}$
and the normalized amplitude
${\it\phi}_{{\it\delta}}$
and the normalized amplitude
 $A_{{\it\delta}}({\it\omega})/A_{{\it\delta}}(0)$
as functions of
$A_{{\it\delta}}({\it\omega})/A_{{\it\delta}}(0)$
as functions of
 ${\it\omega}/{\it\Omega}_{0}$
. We observe that, with increasing
${\it\omega}/{\it\Omega}_{0}$
. We observe that, with increasing
 ${\it\omega}$
,
${\it\omega}$
,
 ${\it\delta}(t)$
lags behind
${\it\delta}(t)$
lags behind
 ${\it\Omega}(t)$
strongly and
${\it\Omega}(t)$
strongly and
 $A_{{\it\delta}}$
appears to decrease monotonically.
$A_{{\it\delta}}$
appears to decrease monotonically.

Figure 5. (a) The phase lag
 ${\it\phi}_{{\it\delta}}$
as a function of
${\it\phi}_{{\it\delta}}$
as a function of
 ${\it\omega}/{\it\Omega}_{0}$
measured in the experiments and as obtained from the model (black curve). (b) Same as panel (a), but for the normalized amplitude
${\it\omega}/{\it\Omega}_{0}$
measured in the experiments and as obtained from the model (black curve). (b) Same as panel (a), but for the normalized amplitude
 $A_{{\it\delta}}({\it\omega})/A_{{\it\delta}}(0)$
. Here
$A_{{\it\delta}}({\it\omega})/A_{{\it\delta}}(0)$
. Here
 $A_{{\it\delta}}(0)=|{\it\delta}({\it\Omega}_{max})-{\it\delta}({\it\Omega}_{min})|/2$
is the adiabatic response given in figure 1. Error bars: the standard deviations.
$A_{{\it\delta}}(0)=|{\it\delta}({\it\Omega}_{max})-{\it\delta}({\it\Omega}_{min})|/2$
is the adiabatic response given in figure 1. Error bars: the standard deviations.
To provide a quantitative interpretation of this oscillatory state, we consider a physical model in which the main degrees of freedom (
 ${\it\delta}$
and
${\it\delta}$
and
 $\dot{{\it\theta}}$
) of the LSC flow are governed by two coupled stochastic equations. The formulation of the model follows the prior works in Brown & Ahlers (Reference Brown and Ahlers2007) and Assaf et al. (Reference Assaf, Angheluta and Goldenfeld2012), with extensions to include the effects of modulated rotations noted below.
$\dot{{\it\theta}}$
) of the LSC flow are governed by two coupled stochastic equations. The formulation of the model follows the prior works in Brown & Ahlers (Reference Brown and Ahlers2007) and Assaf et al. (Reference Assaf, Angheluta and Goldenfeld2012), with extensions to include the effects of modulated rotations noted below.
The equation of motion for
 ${\it\delta}$
is a Langevin equation,
${\it\delta}$
is a Langevin equation,
 $$\begin{eqnarray}\dot{{\it\delta}}=\frac{{\it\delta}}{{\it\tau}_{{\it\delta}}}-\frac{{\it\delta}^{3/2}}{{\it\tau}_{{\it\delta}}{\it\delta}_{0}^{1/2}\sqrt{{\it\chi}({\it\Omega}^{\prime })}}+f_{{\it\delta}}(t),\end{eqnarray}$$
with
 ${\it\tau}_{{\it\delta}}=L^{2}/(18{\it\nu}\mathit{Re}^{1/2})$
,
${\it\tau}_{{\it\delta}}=L^{2}/(18{\it\nu}\mathit{Re}^{1/2})$
,
 ${\it\delta}_{0}=18{\rm\pi}{\rm\Delta}T\mathit{Pr}\mathit{Re}^{3/2}/\mathit{Ra}$
and
${\it\delta}_{0}=18{\rm\pi}{\rm\Delta}T\mathit{Pr}\mathit{Re}^{3/2}/\mathit{Ra}$
and
 ${\it\chi}({\it\Omega}^{\prime })$
is as specified below. The increment of the LSC flow strength, and hence
${\it\chi}({\it\Omega}^{\prime })$
is as specified below. The increment of the LSC flow strength, and hence
 $\dot{{\it\delta}}$
, is given by the buoyancy force and the viscous dissipation from the BLs. Similar to the theory mentioned in (3.1), the Langevin equation for
$\dot{{\it\delta}}$
, is given by the buoyancy force and the viscous dissipation from the BLs. Similar to the theory mentioned in (3.1), the Langevin equation for
 $\dot{{\it\theta}}$
is coupled to the LSC flow strength
$\dot{{\it\theta}}$
is coupled to the LSC flow strength
 $U$
. Assuming
$U$
. Assuming
 $U$
is instantaneously proportional to
$U$
is instantaneously proportional to
 ${\it\delta}$
, we obtain
${\it\delta}$
, we obtain
 $$\begin{eqnarray}\ddot{{\it\theta}}=-\!\left(\frac{{\it\delta}}{{\it\tau}_{\dot{{\it\theta}}}{\it\delta}_{0}}+\frac{{\it\delta}^{1/2}}{2{\it\tau}_{{\it\delta}}{\it\delta}_{0}^{1/2}\sqrt{{\it\chi}({\it\Omega}^{\prime })}}\right)\dot{{\it\theta}}+\frac{{\it\delta}}{{\it\tau}_{\dot{{\it\theta}}}{\it\delta}_{0}}{\it\Omega}(t)+f_{\dot{{\it\theta}}}(t),\end{eqnarray}$$
where
 ${\it\tau}_{\dot{{\it\theta}}}=L^{2}/(2{\it\nu}\mathit{Re})$
. The stochastic driving terms
${\it\tau}_{\dot{{\it\theta}}}=L^{2}/(2{\it\nu}\mathit{Re})$
. The stochastic driving terms
 $f_{{\it\delta}}$
and
$f_{{\it\delta}}$
and
 $f_{\dot{{\it\theta}}}$
in both (3.2) and (3.3) model the small-scale turbulent fluctuations. They are assumed to be Gaussian white noise with a mean diffusivity
$f_{\dot{{\it\theta}}}$
in both (3.2) and (3.3) model the small-scale turbulent fluctuations. They are assumed to be Gaussian white noise with a mean diffusivity
 $D_{{\it\delta}}=3.0\times 10^{-5}~(\text{K}^{2}~\text{s}^{-2})$
and
$D_{{\it\delta}}=3.0\times 10^{-5}~(\text{K}^{2}~\text{s}^{-2})$
and
 $D_{\dot{{\it\theta}}}=1.0\times 10^{-5}~(\text{rad}^{3}~\text{s}^{-2})$
, determined from the experimental data.
$D_{\dot{{\it\theta}}}=1.0\times 10^{-5}~(\text{rad}^{3}~\text{s}^{-2})$
, determined from the experimental data.
We note that the viscous damping for the equations of both
 ${\it\delta}$
and
${\it\delta}$
and
 $\dot{{\it\theta}}$
is caused by dissipation from the viscous BLs. In performing volume averaging, one finds that the magnitudes of these dissipation terms are proportional to
$\dot{{\it\theta}}$
is caused by dissipation from the viscous BLs. In performing volume averaging, one finds that the magnitudes of these dissipation terms are proportional to
 ${\it\lambda}^{-1}({\it\Omega})$
, with the viscous BL thickness
${\it\lambda}^{-1}({\it\Omega})$
, with the viscous BL thickness
 ${\it\lambda}$
dependent on
${\it\lambda}$
dependent on
 ${\it\Omega}$
. Over the range of
${\it\Omega}$
. Over the range of
 $1/\mathit{Ro}$
studied here (
$1/\mathit{Ro}$
studied here (
 $0.31\leqslant 1/\mathit{Ro}\leqslant 0.51$
), variations of the Ekman layer thickness play a role in influencing the LSC flow. According to linear BL theory, its thickness decreases with increasing
$0.31\leqslant 1/\mathit{Ro}\leqslant 0.51$
), variations of the Ekman layer thickness play a role in influencing the LSC flow. According to linear BL theory, its thickness decreases with increasing
 ${\it\Omega}$
, as demonstrated in recent DNS results (Kunnen et al.
Reference Kunnen, Stevens, Overkamp, Sun, van Heijst and Clercx2011).
${\it\Omega}$
, as demonstrated in recent DNS results (Kunnen et al.
Reference Kunnen, Stevens, Overkamp, Sun, van Heijst and Clercx2011).
We estimate the formation time of the Ekman layer,
 ${\it\tau}_{E}={\it\delta}_{E}^{2}/{\it\nu}\approx 9~\text{s}$
(with
${\it\tau}_{E}={\it\delta}_{E}^{2}/{\it\nu}\approx 9~\text{s}$
(with
 ${\it\delta}_{E}=({\it\nu}/{\it\Omega}_{0})^{1/2}$
is the Ekman layer thickness). It is much shorter than a modulation period. Therefore we can assume that when rotational modulation is applied, variation in
${\it\delta}_{E}=({\it\nu}/{\it\Omega}_{0})^{1/2}$
is the Ekman layer thickness). It is much shorter than a modulation period. Therefore we can assume that when rotational modulation is applied, variation in
 ${\it\lambda}$
follows adiabatically its dependence on
${\it\lambda}$
follows adiabatically its dependence on
 ${\it\Omega}(t)$
. Here we introduce a dimensionless variable
${\it\Omega}(t)$
. Here we introduce a dimensionless variable
 ${\it\chi}({\it\Omega})=[{\it\lambda}({\it\Omega})/{\it\lambda}(0)]^{2}$
(Assaf et al.
Reference Assaf, Angheluta and Goldenfeld2012). It is given by the stationary solution of (3.2) with
${\it\chi}({\it\Omega})=[{\it\lambda}({\it\Omega})/{\it\lambda}(0)]^{2}$
(Assaf et al.
Reference Assaf, Angheluta and Goldenfeld2012). It is given by the stationary solution of (3.2) with
 $\dot{{\it\delta}}=0$
and
$\dot{{\it\delta}}=0$
and
 ${\it\chi}({\it\Omega})={\it\delta}({\it\Omega})/{\it\delta}(0)$
. In practice, it is determined from fitting the experimental data of
${\it\chi}({\it\Omega})={\it\delta}({\it\Omega})/{\it\delta}(0)$
. In practice, it is determined from fitting the experimental data of
 ${\it\delta}(1/\mathit{Ro})$
in the studied regime (figure 1
b):
${\it\delta}(1/\mathit{Ro})$
in the studied regime (figure 1
b):
 ${\it\chi}(1/\mathit{Ro})={\it\delta}(1/\mathit{Ro})/{\it\delta}(0)=-5.1/\mathit{Ro}+3.1$
. A scale factor for the BL thickness,
${\it\chi}(1/\mathit{Ro})={\it\delta}(1/\mathit{Ro})/{\it\delta}(0)=-5.1/\mathit{Ro}+3.1$
. A scale factor for the BL thickness,
 ${\it\chi}({\it\Omega})^{-1/2}$
, is thus multiplied in the dissipation terms in (3.2) and (3.3). Furthermore, since the LSC flow spans the size of the sample
${\it\chi}({\it\Omega})^{-1/2}$
, is thus multiplied in the dissipation terms in (3.2) and (3.3). Furthermore, since the LSC flow spans the size of the sample
 $L$
, the response of its amplitude
$L$
, the response of its amplitude
 ${\it\delta}$
to the variation of the viscous drag from the BLs requires a relaxation time
${\it\delta}$
to the variation of the viscous drag from the BLs requires a relaxation time
 ${\it\tau}$
. The magnitude of
${\it\tau}$
. The magnitude of
 ${\it\tau}$
is assumed to be of the order of the LSC turnover time
${\it\tau}$
is assumed to be of the order of the LSC turnover time
 ${\it\tau}\approx {\rm\pi}L/U=50~\text{s}$
. This time-delay effect is included in the equations,
${\it\tau}\approx {\rm\pi}L/U=50~\text{s}$
. This time-delay effect is included in the equations,
 ${\it\Omega}^{\prime }(t)={\it\Omega}(t-{\it\tau})$
, in determining the dissipation terms. We close the dynamical system with (3.2) and (3.3), with one unknown parameter
${\it\Omega}^{\prime }(t)={\it\Omega}(t-{\it\tau})$
, in determining the dissipation terms. We close the dynamical system with (3.2) and (3.3), with one unknown parameter
 ${\it\chi}({\it\Omega})$
determined by direct fitting of the experimental data
${\it\chi}({\it\Omega})$
determined by direct fitting of the experimental data
 ${\it\delta}({\it\Omega})$
in figure 1(b). We presume that the features of high-order harmonic oscillations shown in the power spectra of both
${\it\delta}({\it\Omega})$
in figure 1(b). We presume that the features of high-order harmonic oscillations shown in the power spectra of both
 ${\it\delta}(t)$
and
${\it\delta}(t)$
and
 ${\it\theta}(t)$
(figure 2
d,e) are due to the nonlinearity of (3.2) and (3.3).
${\it\theta}(t)$
(figure 2
d,e) are due to the nonlinearity of (3.2) and (3.3).
We compare the model predictions to the experimental results. Figure 4(a) shows that, in the experimental range
 $(0\leqslant {\it\omega}/{\it\Omega}_{0}\leqslant 0.5)$
,
$(0\leqslant {\it\omega}/{\it\Omega}_{0}\leqslant 0.5)$
,
 ${\it\phi}_{\dot{{\it\theta}}}$
is underestimated by the model. Further investigations of the interplay between modulated rotations and the LSC dynamics in short time scales (such as sloshing and torsional oscillations (Funfschilling & Ahlers Reference Funfschilling and Ahlers2004; Xi et al.
Reference Xi, Zhou, Zhou, Chan and Xia2009)) may provide insight to understand the predominant inertia effect observed. However, the model does predict the increasing phase lag, which approaches
${\it\phi}_{\dot{{\it\theta}}}$
is underestimated by the model. Further investigations of the interplay between modulated rotations and the LSC dynamics in short time scales (such as sloshing and torsional oscillations (Funfschilling & Ahlers Reference Funfschilling and Ahlers2004; Xi et al.
Reference Xi, Zhou, Zhou, Chan and Xia2009)) may provide insight to understand the predominant inertia effect observed. However, the model does predict the increasing phase lag, which approaches
 $-{\rm\pi}/2$
in the high-frequency limit, as shown in figure 4(b). We also note that the results from the full dynamical model are in general agreement with the theory in (3.1). They imply that the phase lag in
$-{\rm\pi}/2$
in the high-frequency limit, as shown in figure 4(b). We also note that the results from the full dynamical model are in general agreement with the theory in (3.1). They imply that the phase lag in
 $\dot{{\it\theta}}$
is mainly attributable to the azimuthal fluid acceleration of the LSC flow, but nearly independent of the oscillations of
$\dot{{\it\theta}}$
is mainly attributable to the azimuthal fluid acceleration of the LSC flow, but nearly independent of the oscillations of
 ${\it\delta}$
. Figure 5 compares the modelling results to the experimental data for
${\it\delta}$
. Figure 5 compares the modelling results to the experimental data for
 ${\it\phi}_{{\it\delta}}$
and
${\it\phi}_{{\it\delta}}$
and
 $A_{{\it\delta}}({\it\omega})/A_{{\it\delta}}(0)$
in the experimental range of
$A_{{\it\delta}}({\it\omega})/A_{{\it\delta}}(0)$
in the experimental range of
 ${\it\omega}/{\it\Omega}_{0}$
. The model predictions are in good accord with the measurements. The phase lag in
${\it\omega}/{\it\Omega}_{0}$
. The model predictions are in good accord with the measurements. The phase lag in
 ${\it\delta}$
could be explained as mainly due to the finite relaxation time it takes for the bulk circulation to respond to the time-varying BL thickness.
${\it\delta}$
could be explained as mainly due to the finite relaxation time it takes for the bulk circulation to respond to the time-varying BL thickness.
3.3. Dynamical resonant response in
$\dot{{\it\theta}}$

Finally we point out an interesting finding of the oscillation amplitude of
 $\dot{{\it\theta}}$
from the experiment that can be reasonably predicted within the framework of our modelling analysis. In figure 6(a) we present experimental data for
$\dot{{\it\theta}}$
from the experiment that can be reasonably predicted within the framework of our modelling analysis. In figure 6(a) we present experimental data for
 $A_{\dot{{\it\theta}}}({\it\omega})/A_{\dot{{\it\theta}}}(0)$
as a function of
$A_{\dot{{\it\theta}}}({\it\omega})/A_{\dot{{\it\theta}}}(0)$
as a function of
 ${\it\omega}$
. It is apparent that the dependence of
${\it\omega}$
. It is apparent that the dependence of
 $A_{\dot{{\it\theta}}}$
on
$A_{\dot{{\it\theta}}}$
on
 ${\it\omega}$
is non-monotonic. A maximum occurs at
${\it\omega}$
is non-monotonic. A maximum occurs at
 ${\it\omega}^{\ast }=0.167{\it\Omega}_{0}$
where
${\it\omega}^{\ast }=0.167{\it\Omega}_{0}$
where
 $A_{\dot{{\it\theta}}}$
is enhanced by as much as 100 %. The appearance of this resonant-like behaviour in
$A_{\dot{{\it\theta}}}$
is enhanced by as much as 100 %. The appearance of this resonant-like behaviour in
 $A_{\dot{{\it\theta}}}$
can be understood as a result of optimal coupling of
$A_{\dot{{\it\theta}}}$
can be understood as a result of optimal coupling of
 ${\it\delta}$
and
${\it\delta}$
and
 ${\it\Omega}$
. In the limit of very slow modulations (
${\it\Omega}$
. In the limit of very slow modulations (
 ${\it\omega}\approx 0$
) we have
${\it\omega}\approx 0$
) we have
 ${\it\phi}_{{\it\delta}}\approx 0$
; and
${\it\phi}_{{\it\delta}}\approx 0$
; and
 $\dot{{\it\theta}}(t)$
instantaneously follows the time variation in
$\dot{{\it\theta}}(t)$
instantaneously follows the time variation in
 ${\it\Omega}(t)$
, such that
${\it\Omega}(t)$
, such that
 $\dot{{\it\theta}}(t)={\it\omega}_{LSC}({\it\Omega}(t))$
is given by figure 1(a). Thus
$\dot{{\it\theta}}(t)={\it\omega}_{LSC}({\it\Omega}(t))$
is given by figure 1(a). Thus
 $A_{\dot{{\it\theta}}}$
approaches the value
$A_{\dot{{\it\theta}}}$
approaches the value
 $A_{\dot{{\it\theta}}}(0)$
. Moreover, we derive from (3.3) that in this regime the variation of
$A_{\dot{{\it\theta}}}(0)$
. Moreover, we derive from (3.3) that in this regime the variation of
 $A_{\dot{{\it\theta}}}$
due to a small change in
$A_{\dot{{\it\theta}}}$
due to a small change in
 ${\it\phi}_{{\it\delta}}$
is given by (in the leading order of
${\it\phi}_{{\it\delta}}$
is given by (in the leading order of
 ${\it\phi}_{{\it\delta}}$
):
${\it\phi}_{{\it\delta}}$
):
 $A_{\dot{{\it\theta}}}({\it\omega})-A_{\dot{{\it\theta}}}(0)\sim -\sin {\it\phi}_{{\it\delta}}$
. On the other hand, when
$A_{\dot{{\it\theta}}}({\it\omega})-A_{\dot{{\it\theta}}}(0)\sim -\sin {\it\phi}_{{\it\delta}}$
. On the other hand, when
 ${\it\omega}\gg {\it\Omega}_{0}$
,
${\it\omega}\gg {\it\Omega}_{0}$
,
 $A_{{\it\delta}}$
decreases to zero (figure 5
b) and correspondingly
$A_{{\it\delta}}$
decreases to zero (figure 5
b) and correspondingly
 $A_{\dot{{\it\theta}}}\approx 0$
as well. Therefore we infer that a maximum in
$A_{\dot{{\it\theta}}}\approx 0$
as well. Therefore we infer that a maximum in
 $A_{\dot{{\it\theta}}}$
occurs in between these two extremes.
$A_{\dot{{\it\theta}}}$
occurs in between these two extremes.

Figure 6. Experimental (a) and numerical (b) data for the normalized amplitude
 $A_{\dot{{\it\theta}}}({\it\omega})/A_{\dot{{\it\theta}}}(0)$
as a function of
$A_{\dot{{\it\theta}}}({\it\omega})/A_{\dot{{\it\theta}}}(0)$
as a function of
 ${\it\omega}/{\it\Omega}_{0}$
. Here
${\it\omega}/{\it\Omega}_{0}$
. Here
 $A_{\dot{{\it\theta}}}(0)=[{\it\omega}_{LSC}({\it\Omega}_{max})-{\it\omega}_{LSC}({\it\Omega}_{min})]/2$
is the adiabatic response given in figure 1. The open symbols in (a) denote the standard deviations of
$A_{\dot{{\it\theta}}}(0)=[{\it\omega}_{LSC}({\it\Omega}_{max})-{\it\omega}_{LSC}({\it\Omega}_{min})]/2$
is the adiabatic response given in figure 1. The open symbols in (a) denote the standard deviations of
 $A_{\dot{{\it\theta}}}$
. Inset in (b): amplitude
$A_{\dot{{\it\theta}}}$
. Inset in (b): amplitude
 $A_{\dot{{\it\theta}}}({\it\omega},{\it\phi}_{{\it\delta}})$
as a function of
$A_{\dot{{\it\theta}}}({\it\omega},{\it\phi}_{{\it\delta}})$
as a function of
 ${\it\omega}/{\it\Omega}_{0}$
and
${\it\omega}/{\it\Omega}_{0}$
and
 ${\it\phi}_{{\it\delta}}$
. Its solution
${\it\phi}_{{\it\delta}}$
. Its solution
 $A_{\dot{{\it\theta}}}({\it\omega})$
with the constraint of
$A_{\dot{{\it\theta}}}({\it\omega})$
with the constraint of
 ${\it\phi}_{{\it\delta}}({\it\omega})$
(dashed red line in the
${\it\phi}_{{\it\delta}}({\it\omega})$
(dashed red line in the
 ${\it\omega}{-}{\it\phi}_{{\it\delta}}$
plane) given in (3.3) is shown as a black curve.
${\it\omega}{-}{\it\phi}_{{\it\delta}}$
plane) given in (3.3) is shown as a black curve.
To elucidate more clearly the mutual influences of
 $A_{{\it\delta}}$
and
$A_{{\it\delta}}$
and
 ${\it\phi}_{{\it\delta}}$
on
${\it\phi}_{{\it\delta}}$
on
 $A_{\dot{{\it\theta}}}$
, we solved for
$A_{\dot{{\it\theta}}}$
, we solved for
 $A_{\dot{{\it\theta}}}({\it\omega},{\it\phi}_{{\it\delta}})$
numerically from (3.3) for an oscillating function
$A_{\dot{{\it\theta}}}({\it\omega},{\it\phi}_{{\it\delta}})$
numerically from (3.3) for an oscillating function
 ${\it\delta}(t)$
with arbitrary phases (
${\it\delta}(t)$
with arbitrary phases (
 $0<{\it\phi}_{{\it\delta}}<2{\rm\pi}$
) and with its amplitude fixed to the solution
$0<{\it\phi}_{{\it\delta}}<2{\rm\pi}$
) and with its amplitude fixed to the solution
 $A_{{\it\delta}}({\it\omega})$
given by (3.2). The results of
$A_{{\it\delta}}({\it\omega})$
given by (3.2). The results of
 $A_{\dot{{\it\theta}}}({\it\omega},{\it\phi}_{{\it\delta}})$
are depicted in the inset of figure 6(b), where the non-monotonic dependence of
$A_{\dot{{\it\theta}}}({\it\omega},{\it\phi}_{{\it\delta}})$
are depicted in the inset of figure 6(b), where the non-monotonic dependence of
 $A_{\dot{{\it\theta}}}$
on
$A_{\dot{{\it\theta}}}$
on
 ${\it\phi}_{{\it\delta}}$
is clarified. The solution
${\it\phi}_{{\it\delta}}$
is clarified. The solution
 $A_{\dot{{\it\theta}}}({\it\omega})$
to the full dynamical system (3.2) and (3.3) is then determined with the constraint of
$A_{\dot{{\it\theta}}}({\it\omega})$
to the full dynamical system (3.2) and (3.3) is then determined with the constraint of
 ${\it\phi}_{{\it\delta}}({\it\omega})$
given by (3.2). It is depicted in figure 6(b) and in its inset as well. Despite the different values of
${\it\phi}_{{\it\delta}}({\it\omega})$
given by (3.2). It is depicted in figure 6(b) and in its inset as well. Despite the different values of
 ${\it\omega}^{\ast }$
and the maximum in
${\it\omega}^{\ast }$
and the maximum in
 $A_{\dot{{\it\theta}}}$
, the model offers a reasonable prediction of the resonant response of
$A_{\dot{{\it\theta}}}$
, the model offers a reasonable prediction of the resonant response of
 $\dot{{\it\theta}}$
. We conclude that oscillation of
$\dot{{\it\theta}}$
. We conclude that oscillation of
 $\dot{{\it\theta}}$
with a maximum amplitude can be produced in an intermediate
$\dot{{\it\theta}}$
with a maximum amplitude can be produced in an intermediate
 ${\it\omega}$
regime in which
${\it\omega}$
regime in which
 ${\it\delta}(t)$
has the optimal phase shift from
${\it\delta}(t)$
has the optimal phase shift from
 ${\it\Omega}(t)$
.
${\it\Omega}(t)$
.
4. Discussion
In this paper we present an experimental study of the LSC dynamics in turbulent RBC with modulated rotation. We observe clear oscillations in the LSC azimuthal rotation velocity
 $\dot{{\it\theta}}(t)$
and thermal amplitude
$\dot{{\it\theta}}(t)$
and thermal amplitude
 ${\it\delta}(t)$
. The fluid acceleration driven by oscillating Coriolis force is found, for the first time, to influence the LSC azimuthal motions and cause an increasing phase lag in
${\it\delta}(t)$
. The fluid acceleration driven by oscillating Coriolis force is found, for the first time, to influence the LSC azimuthal motions and cause an increasing phase lag in
 $\dot{{\it\theta}}(t)$
with respect to
$\dot{{\it\theta}}(t)$
with respect to
 ${\it\Omega}(t)$
when the modulation frequency increases. It is considered as a manifestation of the inertia effect of the LSC flow in the presence of rotational modulation. Moreover, the applied modulation gives rise to oscillatory BLs and we show that the resulting time-varying viscous drag may modify
${\it\Omega}(t)$
when the modulation frequency increases. It is considered as a manifestation of the inertia effect of the LSC flow in the presence of rotational modulation. Moreover, the applied modulation gives rise to oscillatory BLs and we show that the resulting time-varying viscous drag may modify
 ${\it\delta}(t)$
periodically.
${\it\delta}(t)$
periodically.
Remarkably, oscillation of the azimuthal rotation velocity
 $\dot{{\it\theta}}(t)$
with maximum amplitude occurs at modulation frequency
$\dot{{\it\theta}}(t)$
with maximum amplitude occurs at modulation frequency
 ${\it\omega}^{\ast }=0.167{\it\Omega}_{0}$
. Such a resonance-like phenomenon in a turbulent background is intriguing, since one would expect that, instead of a periodic flow with a single dominant time scale, turbulent flows with a broad frequency spectrum in the fluid interior are driven by the modulated rotations. Presently, a theoretical understanding of the resonant turbulence and the value of
${\it\omega}^{\ast }=0.167{\it\Omega}_{0}$
. Such a resonance-like phenomenon in a turbulent background is intriguing, since one would expect that, instead of a periodic flow with a single dominant time scale, turbulent flows with a broad frequency spectrum in the fluid interior are driven by the modulated rotations. Presently, a theoretical understanding of the resonant turbulence and the value of
 ${\it\omega}^{\ast }$
is lacking. However, the proposed linear response theory ((3.2) and (3.3)) provides a reasonable interpretation that the resonant response of the LSC flow occurs when
${\it\omega}^{\ast }$
is lacking. However, the proposed linear response theory ((3.2) and (3.3)) provides a reasonable interpretation that the resonant response of the LSC flow occurs when
 ${\it\delta}(t)$
is strongly correlated with
${\it\delta}(t)$
is strongly correlated with
 ${\it\Omega}(t)$
and produces the optimal driving force for oscillations in
${\it\Omega}(t)$
and produces the optimal driving force for oscillations in
 $\dot{{\it\theta}}(t)$
.
$\dot{{\it\theta}}(t)$
.
In summary, we present the first experimental study of the dynamics of the LSC in turbulent thermal convection in response to modulated rotation. These findings may, to some extent, shed new light on the nature of the large-scale flows in turbulent convection, and be relevant to observed phenomena in astrophysical and geophysical systems.
Acknowledgements
This work was supported by the National Science Foundation of China through grant no. 11202151, the Shanghai Pujiang Program 13PJ1408800 and the Fundamental Research Funds for the Central Universities. S.S. thanks the Twente Mobility Fund for financial support.


