


1. Introduction
Drop impact on solid surfaces is of key importance in a number of technological applications and industrial processes such as ink-jet printing, spray cooling of surfaces, spraying of pesticides and icing of technical surfaces. Recent reviews (Josserand & Thoroddsen Reference Josserand and Thoroddsen2016; Liang & Mudawar Reference Liang and Mudawar2017; Yarin, Roisman & Tropea Reference Yarin, Roisman and Tropea2017) give an overview of the different impact modes and dynamic regimes. In drop impact on a solid surface, the gas film underneath the drop plays a pivotal role for the impact dynamics. The film serves as a lubricant on which a radially expanding drop is ‘skating’ (Mandre, Mani & Brenner Reference Mandre, Mani and Brenner2009; Mani, Mandre & Brenner Reference Mani, Mandre and Brenner2010; Hicks & Purvis Reference Hicks and Purvis2013). It was shown that the gas film governs the drop rebound on smooth hydrophilic surfaces (De Ruiter et al. Reference De Ruiter, Lagraauw, Van Den Ende and Mugele2015). The role of the gas film for the splashing dynamics is still a matter of controversy. Some works report that it controls the splashing dynamics (Xu, Zhang & Nagel Reference Xu, Zhang and Nagel2005; Driscoll & Nagel Reference Driscoll and Nagel2011; Mandre & Brenner Reference Mandre and Brenner2012), whereas other results indicate that splashing is due to liquid lamellae decaying after the drop has largely wetted the surface (Riboux & Gordillo Reference Riboux and Gordillo2014). The gas film underneath the drop may become so thin that it evolves beyond the continuum regime, and gas kinetic effects come into play (Kolinski et al. Reference Kolinski, Rubinstein, Mandre, Brenner, Weitz and Mahadevan2012; De Ruiter et al. Reference De Ruiter, Lagraauw, Van Den Ende and Mugele2015; Chubynsky et al. Reference Chubynsky, Belousov, Lockerby and Sprittles2020).
These results motivate us to study drop impact in a situation where we can actively control the gas film. This is especially interesting in conjunction with liquid-repellent surfaces (for a recent overview, see Wang & Wang Reference Wang and Wang2022). The wetting of a surface by a liquid drop is often something to be avoided, for example to minimize the fouling of the surface. In other situations, wetting of a surface is desired, for example in cooling applications. Adaptive surfaces allowing control of their interaction with drops may therefore enable novel applications. In the present work, the control of the gas film underneath the drop is achieved via a porous surface with gas discharge. Owing to gas discharge, a drop experiences a repulsive force when approaching a surface. Such a scenario resembles that of drops impacting on a hot surface with a temperature above the Leidenfrost point of the corresponding fluid. Depending on the impact velocity and the surface temperature, different evaporation modes are observed (Liang & Mudawar Reference Liang and Mudawar2017). At comparatively low surface temperatures, a drop gets deposited and evaporates with a shape resembling that of an equilibrium drop. At high surface temperatures, a thin vapour film forms between a drop and the surface, with film boiling being the dominant evaporation mode. This Leidenfrost regime of drop impact has been studied in detail. Early attempts to characterize the dynamic regimes were hampered by limitations of the imaging equipment (Chandra & Avedisian (Reference Chandra and Avedisian1991), Wachters et al. (Reference Wachters, Smulders, Vermeulen and Kleiweg1966) and references therein), which were lifted through the advent of digital high-speed imaging. This enabled more detailed studies of the momentum loss upon rebound (Karl & Frohn Reference Karl and Frohn2000; Biance et al. Reference Biance, Chevy, Clanet, Lagubeau and Quéré2006; Bertola Reference Bertola2009; Chen & Bertola Reference Chen and Bertola2016), the drop deformation (Karl & Frohn Reference Karl and Frohn2000; Tran et al. Reference Tran, Staat, Prosperetti, Sun and Lohse2012; Castanet, Caballina & Lemoine Reference Castanet, Caballina and Lemoine2015; Khavari et al. Reference Khavari, Sun, Lohse and Tran2015; Liang et al. Reference Liang, Shen, Guo and Zhang2016; Riboux & Gordillo Reference Riboux and Gordillo2016; Breitenbach, Roisman & Tropea Reference Breitenbach, Roisman and Tropea2017; Clavijo, Crockett & Maynes Reference Clavijo, Crockett and Maynes2017; Roisman, Breitenbach & Tropea Reference Roisman, Breitenbach and Tropea2018; Lee et al. Reference Lee, Harth, Rump, Kim, Lohse, Fezzaa and Je2020), the contact time (Liang et al. Reference Liang, Shen, Guo and Zhang2016; Breitenbach et al. Reference Breitenbach, Roisman and Tropea2017; Roisman et al. Reference Roisman, Breitenbach and Tropea2018; Lee et al. Reference Lee, Harth, Rump, Kim, Lohse, Fezzaa and Je2020), and the influence of surface textures (Weickgenannt et al. Reference Weickgenannt, Zhang, Sinha-Ray, Roisman, Gambaryan-Roisman, Tropea and Yarin2011; Tran et al. Reference Tran, Staat, Susarrey-Arce, Foertsch, Van Houselt, Gardeniers, Prosperetti, Lohse and Sun2013; Agapov et al. Reference Agapov, Boreyko, Briggs, Srijanto, Retterer, Collier and Lavrik2014; Lee & Song Reference Lee and Song2016; Zhang et al. Reference Zhang, Yu, Fan, Sun and Cao2016; Clavijo et al. Reference Clavijo, Crockett and Maynes2017; Patterson, Shiri & Bird Reference Patterson, Shiri and Bird2017; Park & Kim Reference Park and Kim2019, Reference Park and Kim2020; Liu, Cai & Tsai Reference Liu, Cai and Tsai2020; Sahoo, Lo & Lu Reference Sahoo, Lo and Lu2020; Park et al. Reference Park, Kim, Yu and Ahn2021), among others. The levitation of drops on a cushion of air above porous surfaces with gas discharge was introduced by Goldshtik, Khanin & Ligai (Reference Goldshtik, Khanin and Ligai1986) as an analogue of the Leidenfrost effect. Subsequently, their static shape (Goldshtik et al. Reference Goldshtik, Khanin and Ligai1986; Duchemin, Lister & Lange Reference Duchemin, Lister and Lange2005) as well as stability (Lister et al. Reference Lister, Thompson, Perriot and Duchemin2008; Snoeijer, Brunet & Eggers Reference Snoeijer, Brunet and Eggers2009) was analysed. Self-excited star-shaped oscillations of such droplets were observed (Brunet & Snoeijer Reference Brunet and Snoeijer2011; Bouwhuis et al. Reference Bouwhuis, Winkels, Peters, Brunet, Van Der Meer and Snoeijer2013), and externally forced rotationally symmetric oscillations were suggested as a means for contactless probing of liquid properties (Papoular & Parayre Reference Papoular and Parayre1997; Perez et al. Reference Perez, Brechet, Salvo, Papoular and Suery1999; Hervieu, Coutris & Boichon Reference Hervieu, Coutris and Boichon2001). Even at gas discharge rates far below those required for drop levitation, applying a pressure difference across a porous membrane allows reversibly tuning the mobility of a drop in contact with the membrane from a low-mobility impaled state to a highly mobile Cassie–Baxter state by reducing the contact area between the drop and the membrane (Vourdas, Tserepi & Stathopoulos Reference Vourdas, Tserepi and Stathopoulos2013; Vourdas, Ranos & Stathopoulos Reference Vourdas, Ranos and Stathopoulos2015; Vourdas et al. Reference Vourdas, Pashos, Kokkoris, Boudouvis and Stathopoulos2016; Chrysinas et al. Reference Chrysinas, Pashos, Vourdas, Kokkoris, Stathopoulos and Boudouvis2018).
In this work, we report an experimental study of the impact dynamics of drops on porous membranes with gas discharge. We identify four different impact modes of the drops with the surface. The focus of our study is on the transformation of drops into bubbles, which occurs when the impact velocity of a drop is just high enough to establish contact between the membrane and the drop upon its initial approach. The onset of this regime is explained based on a scaling model that relies on the pressure buildup in the gas pocket underneath the drop.
2. Experimental set-up and methodology
Figure 1(a) shows a schematic of the experimental set-up. The set-up consists of three main components: a pressurized chamber covered with a porous membrane, a height-adjustable metal holder with a syringe pump, and an imaging system comprising a high-speed camera with illumination. The chamber is a hollow metal cylinder connected to a nitrogen supply. The syringe pump system allows generation of single drops detaching from the tip of the needle. Below, we describe briefly the main components constituting the experimental set-up. Additional details on the experimental procedure and data evaluation can be found in Appendix A.

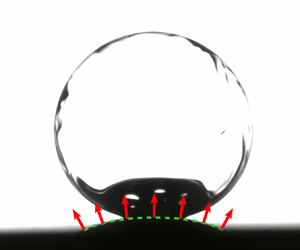
Figure 1. (a) Schematic of the experimental set-up, including a pressurized chamber covered with a porous membrane, a syringe pump for creating the drops, and an imaging system. (b) Characteristic image sequences showing the different impact modes. The label in each frame indicates the time in milliseconds. The origin of the time axis was chosen such that the first frame where the drop is impacting onto the membrane corresponds to  $t = 0$. In the case of IM0 and IM1, where no contact is established initially,
  $t = 0$ refers to the point in time where the gap between the drop and the membrane surface reaches a minimal value or is no longer visible. The sequences show drops of water with
  $R=(1.42, 1.37, 1.41, 1.42)$ mm impinging at
  $u_l=(0.18, 0.49, 0.90, 1.10)$ m s
 $^{-1}$ (corresponding to
  $ {\textit {We}}=(1.3, 9.0, 31, 47)$) onto the membrane at gas velocities
  $u_g=(2.94, 2.92, 2.95, 2.96)$ m s
 $^{-1}$ (corresponding to
  ${\rm \Delta} p_c/(2\gamma /R)=(19.1, 18.4, 19.0, 19.3)$), respectively.
2.1. Pressurized chamber
The pressurized chamber, consisting of a hollow metal cylinder, is covered by a circular plastic plate of thickness about 0.4 mm that is clamped under a metal ring. The plate has a circular centre hole with radius 5 mm. This hole is fully covered by a piece of the membrane glued to the bottom of the plate with double-sided adhesive tape. At the bottom of the chamber, there is an inlet connected to a nitrogen supply for pressurizing the chamber. The overpressure in the chamber drives the gas through the centre hole covered with the membrane. The pressure difference causes the membrane to deflect, assuming a shape comparable to a spherical cap. In order to measure the nitrogen flow rate and the pressure difference between the chamber and the atmosphere, a flow meter (Bronckhorst El-Flow Select) and a pressure sensor (Greisinger GDH200-07) are arranged close to the inlet of the cylinder.
2.2. Liquids
Table 1 lists the dynamic viscosity  $\mu _l$, mass density
  $\rho _l$, and surface tension
  $\gamma$ of de-ionized (DI) water, ethanol and surfactant solution (Triton X-100), together with the corresponding viscosity
  $\mu _g$ and density
  $\rho _g$ of nitrogen. All values refer to a temperature of about 20
  $^{\circ }$C and ambient pressure
  $p_0=1013$ hPa. The values for DI water, ethanol and nitrogen as well as the surface tension of the surfactant solution are literature values, while the remaining properties of the surfactant solution were measured with a scale or a rheometer (Brookfield DV3T).
Table 1. Material properties of fluids used in this study and parameters characterizing the dispensed drops. Here,  $\tau _{ic}$ denotes the capillary-inertial time scale, and
  $ {\textit {Oh}}$ denotes the Ohnesorge number.

2.3. Drop dispensing
Drops are dispensed from a syringe pump attached to a vertical metal holder. The metal holder comprises a metal panel that is attached to two vertical guidance bars. The panel can be moved along the guidance bars for height adjustment and has a syringe pump (KDS-210-CE) attached to it. The syringe (Hamilton Gastight TLL1750) is arranged vertically. The needle tip (gauge 25, straight tip) has outer diameter 0.52 mm and inner diameter 0.25 mm. We set a specific pump rate (0.4 ml min $^{-1}$) so a drop develops at the tip until it detaches and impinges onto the membrane below it.
For reference, table 1 also lists the average drop radii  $R$ (
$R$ ( $\pm$ one standard deviation (s.d.)) for each fluid. These are in excellent agreement with Tate's law (Tate Reference Tate1864), balancing the weight
  $4{\rm \pi} g\rho _l R^3/3$ of the drop with the capillary force
  ${\rm \pi} d_w \gamma$ suspending it at the needle tip. For this, the outer nozzle diameter was taken as wetted diameter
  $d_w$, and the Harkins–Brown correction factor given in Tsai & Wang (Reference Tsai and Wang2019) was employed. Since in our case the correction factor does not vary considerably, Tate's model also suggests that for our experiments, the capillary-inertial time scale
  $\tau _{ic}=\sqrt {\rho _l R^3/\gamma }$, a characteristic time scale of drop oscillation (Rayleigh Reference Rayleigh1879), is nearly identical for all drops dispensed, as confirmed in table 1. Furthermore, the Ohnesorge number
  $ {\textit {Oh}}=\mu _l/\sqrt {2R\gamma \rho _l}$ remains below 0.01 in all experiments. The impact velocities
  $u_l$ of the drops were in a range between about 0.2 and 2 m s
 $^{-1}$, corresponding to Weber numbers
  $ {\textit {We}}=2\rho _l u_l^2 R/\gamma$ between about 1 and 130 for water, and Reynolds numbers
  $ {\textit {Re}}=2\rho _l u_l R/\mu _l$, between about 500 and 5000 for water.
2.4. Imaging system
The imaging system includes a high-speed camera and illumination. The lens of the camera (IDT MotionPro Y4) is positioned at the same height as the membrane surface. The lamp (Schott KL250 LCD) is positioned on the opposite side to ensure proper background illumination. The camera and the chamber rest on top of height-adjustable platforms. Images were captured at frame rate  $f=1000$ Hz. While this frame rate does not allow the capture of details of the initial phase of drop deformation, it is sufficient to characterize the long-time behaviour of drop impact.
2.5. Membrane
The choice of material for the membrane covering the cylinder is dictated by the requirement of high gas permeability, translating to a high porosity and a small thickness. Further, plastic deformations due to the membrane deflection should be avoided. To meet these requirements, polymer membranes were fabricated from hydrophobic thermoplastic polyurethane (TPU) using an electrospinning process as detailed in Appendix B. The membrane is about 25  $\mathrm {\mu }$m thick and has porosity approximately 88 % and average pore diameter in the lower micrometre range. This guarantees a high gas discharge rate and a homogeneous gas flow on the scale of the droplet size. The permeability coefficient
  $K$ relates the pressure difference
  ${\rm \Delta} p_c$ across the membrane to the gas velocity
  $u_g=K\,{\rm \Delta} p_c$ at the membrane surface. For the experiments with water and ethanol, a permeability coefficient
  $K = 1.5\times 10^{-3}$ m s
 $^{-1}$ Pa
 $^{-1}$ is measured. For the experiments with the surfactant, a lower permeability value,
  $K = 0.7\times 10^{-3}$ m s
 $^{-1}$ Pa
 $^{-1}$, is quantified. Presumably, this difference in permeability can be explained by the fact that for the experiments with surfactant solutions, different membrane pieces were cut out from a larger membrane sheet with inhomogeneities, leading to the observed variation in permeability. Due to the pressure difference
  ${\rm \Delta} p_c$ across the membrane, it is deflected into a shape resembling a spherical cap, with radius of curvature
  $R_m$ between about 6 and 11 mm.
In order to gain information about the wetting properties, measurements on flat membranes without any gas discharge were performed. When wetted with water, the electrospun TPU membranes show a very large contact angle hysteresis. Therefore, the membranes are sticky to drops, i.e. drops do not easily roll off. The advancing contact angle is difficult to measure because of the discontinuous movement of the three-phase contact line on the sticky surface, but it is approximately 145 $^{\circ }$. The receding contact angle is close to zero, that is, the retraction of the contact line occurs only when the contact angle is so small that it can no longer be measured. We attribute this behaviour to a wetting state that is neither a complete Cassie state nor a complete Wenzel state. Such mixed wetting states have been observed for complex surface morphologies and are sometimes referred to as a ‘rose petal effect’ (Feng et al. Reference Feng, Zhang, Xi, Zhu, Wang, Xia and Jiang2008; Bormashenko Reference Bormashenko2015). By contrast, if a wetting experiment is performed with a small ethanol drop, then all of the liquid is absorbed into the highly porous membrane. This can be attributed to the Wenzel wetting state in which the liquid fills the entire pore space (Feng et al. Reference Feng, Zhang, Xi, Zhu, Wang, Xia and Jiang2008; Bormashenko Reference Bormashenko2015).
3. Experimental results
3.1. Impact modes
By varying the drop impact speed and gas flow rate, we have identified four different modes of drop impact, in the following referred to as ‘impact modes’ (IM). Characteristic image sequences from which the differences between the impact modes become apparent are displayed in figure 1(b). The different impact modes are characterized as follows (see also supplementary movies 1–4 available at https://doi.org/10.1017/jfm.2022.921).
(i) IM0. The drop bounces back without getting in contact with the membrane.
(ii) IM1. Upon its initial approach, the drop does not touch the membrane. However, the drop deformation induces a shape oscillation, upon which the south pole of the drop touches and sticks to the membrane.
(iii) IM2. Contact between the membrane and the drop is established upon its initial approach, after which the drop wets the membrane surface.
(iv) IM3. Contact between the membrane and the drop is established upon its initial approach. Already during its spreading phase, the drop detaches from the membrane and rebounds, leaving behind only a few wet spots on the membrane surface.
The most remarkable phenomenon observed in the experiments was the transformation of drops into bubbles. This occurs when the impact velocity of a drop is just high enough to induce impact mode 2, i.e. the velocity of the drop is sufficient to establish contact with the surface upon its primary approach. Image sequences showing the bubble formation are displayed in figure 2(a) for results obtained with DI water, and figure 2(b) for results for the two-component system DI water  $+$ Triton X-100, where Triton X-100 is a non-ionic surfactant. During most of the bubble formation process, the three-phase contact line remains pinned owing to the large contact-angle hysteresis of the surface, except for the final stages of bubble inflation for the surfactant solution. After the oscillations of the drop have been damped, the gas flow through the membrane deforms the drop and inflates it to a bubble that is attached to the surface. Below, the approach of a drop to the membrane and the corresponding deformation will be analysed in some detail based on numerical simulations. The inflation of the bubble continues until it finally bursts, visible in the last frame of each image sequence. The addition of surfactant increases the bubble lifetime by more than one order of magnitude. The formation of bubbles from water and water
  $+$ Triton X-100 drops can also be seen in supplementary movies 5 and 6.

Figure 2. Image sequences showing the transformation of a drop to a bubble, for (a) a 2.81 mm diameter DI water drop, and (b) a 1.98 mm diameter DI water  $+$ Triton X-100 drop with 0.01 mass % of surfactant added. The label of a frame indicates the time in milliseconds, where
  $t=0$ corresponds to the moment of impact. In the respective last frames, the bursting of the bubble is visible. The drops with
  $R=(1.41, 0.99)$ mm impinge at
  $u_l=(0.67, 1.00)$ m s
 $^{-1}$ (corresponding to
  $ {\textit {We}}=(17, 66)$) onto the membrane at gas velocity
  $u_g=(1.64, 1.86)$ m s
 $^{-1}$ (corresponding to
  ${\rm \Delta} p_c/(2\gamma /R)=(10.6, 43.9)$), where the first value refers to water, and the second to surfactant solution.
Figure 3 shows impact regime maps for drops of water and ethanol, with different symbols indicating different impact modes. The  $x$-axis encodes the gas velocity
  $u_g$ at the membrane surface in terms of the pressure drop across the membrane,
  ${\rm \Delta} p_c$, normalized by the Laplace pressure inside the drop. The
  $y$-axis encodes the drop impact velocity
  $u_l$ in terms of the square root of the Weber number
  $\sqrt { {\textit {We}}}= {\textit {Oh}}\, {\textit {Re}}$. The lines represent fits according to the scaling model presented below. First, we consider the case of water drops. As already mentioned, when increasing the impact velocity, to a good approximation the bubble formation sets in when the transition to IM2 is observed, that is, the bubble formation is initiated when the drop starts touching the membrane upon its initial approach. IM3 appears as a rare case found only in a rather limited parameter range at high gas velocities. A drop rebound without getting in touch with the membrane (IM0) occurs only at very low impact velocities, and at high impact velocities, IM2 prevails. The impact regime map for ethanol shows the same clear trend as far as the transition to IM2 and the onset of bubble formation are concerned. However, here IM1 occurs only within a narrow range of gas velocities, whereas IM3 is observed over the entire velocity range, separating IM2 from IM0. The range of impact velocities for which IM0 is observed is broader than for water. The bubbles formed from ethanol are generally less distinct than for water, reaching only much smaller diameters until they burst. For water, two somewhat different bubble formation modes were observed, as described below.

Figure 3. Impact regime maps in a space spanned by the non-dimensional pressure drop  ${\rm \Delta} p_c/(2\gamma /R)$ across the membrane and the square root of the impact Weber number,
  $\sqrt { {\textit {We}}}= {\textit {Oh}}\, {\textit {Re}}$, for (a) water and (b) ethanol. The different symbol shapes indicate the different impact modes, where full symbols indicate cases where bubble formation was observed. The lines are fits according to the scaling model (4.2).
3.2. Further classification of bubble formation
For water, two different classes of bubble formation events were observed. Most of the time, a bubble is able to fully develop over time spans of at least 30 ms up to several hundred ms, before finally bursting (seen in figure 2). Besides these fully developed bubbles, there are also events in which less distinct bubbles are formed. In some of the experiments with water, the initial stages of bubble formation were observed, followed by bursting of the bubble after a few milliseconds. A corresponding example is shown in figure 4. The reasons behind the second bubble formation mode with non-distinct bubbles could not be uncovered. In figure 5, these two bubble formation modes are assigned to the data points shown in figure 3(a), displaying only those data points corresponding to bubble formation.

Figure 4. Time-lapse images showing the formation of a non-distinct bubble after impact of a water drop. The label of a frame indicates the time in milliseconds, where  $t=0$ corresponds to the moment of impact. In the last frame, the bursting of the bubble is visible. The drop with
  $R=1.33$ mm impinges at
  $u_l=1.26$ m s
 $^{-1}$ (corresponding to
  $ {\textit {We}}=57.4$) onto the membrane at gas velocity
  $u_g=3.83$ m s
 $^{-1}$ (corresponding to
  ${\rm \Delta} p_c/(2\gamma /R)=23.3$).

Figure 5. Bubble formation modes for water in a space spanned by the non-dimensional pressure drop across the membrane,  ${\rm \Delta} p_c/(2\gamma /R)$, and the square root of the impact Weber number,
  $\sqrt { {\textit {We}}}$. Only the data points where a bubble forms are displayed. The plot includes the data points corresponding to fully developed bubbles and those corresponding to their non-distinct version, as well as the linear fit of the scaling model, described in (4.2).
In the case of ethanol, the bubbles are generally less distinct than for water, reaching only much smaller diameters until they burst, which usually occurs a few milliseconds after impact. In contrast to water, ethanol easily gets absorbed into the membrane, and a pinned three-phase contact line is not observed.
3.3. Wetting diameter
As already indicated, during most of the bubble formation process for water, the three-phase contact line remains pinned owing to the large contact-angle hysteresis at the membrane. The contact line approximately has the shape of a circle whose diameter  $2R_{wet}$ is called the wetting diameter. Thus the wetting diameter indicates the initial points of contact and the extension of the gas pocket forming below the drop during impact. Figure 6 shows the wetting radius, normalized by the radius of the impinging drop, for events where a bubble forms from a water drop both with and without surfactants. Evidently, for a wide range of gas and liquid velocities, the wetting radius is close to the drop radius, irrespective of whether or not the drop contains surfactant. It is emphasized that the wetting diameter is inherently different from the spreading diameter. Since the radial expansion and receding of the drop occur mainly above the membrane surface, it is not bound by the same limitations as the wetting diameter. Therefore, the independence of the Weber number, which the wetting diameter shows, does not apply to the spreading diameter.

Figure 6. Non-dimensional wetting diameter from experiments in which a bubble forms, as a function of (a) the non-dimensional pressure drop across the membrane and (b) the square root of the Weber number.
4. Simulation and scaling model
The most distinct feature that the two impact regime maps of figure 3 have in common is the transition to IM2 and the corresponding onset of bubble formation. In the following, these phenomena will be analysed using numerical simulations and a scaling model.
4.1. Finite-element simulations
The simulations of drop impact are based on the interface tracking scheme as implemented in the commercial finite-element solver COMSOL Multiphysics. In brief, an axisymmetric model was set up in which the incompressible Navier–Stokes equations together with the continuity equation are solved in the liquid and gas phases. The two fluid domains are coupled by the kinematic condition at the liquid surface and the condition for the total stress, ensuring continuity of the tangential stress and relating the mean curvature of the surface and the surface tension to the jump in normal stress across the surface. The gas velocity at the membrane surface is obtained based on the permeability coefficient and the pressure drop across the membrane. Since the experiments indicate that the membrane deformation due to drop impact is negligible, a fixed surface shape is assumed. Details concerning the simulation model can be found in Appendix C.
Figure 7 shows time-lapse images of a drop impact simulation. The pressure field is shown as a colour map. This point in the parameter space spanned by impact and gas velocities is not far from the onset of bubble formation. The most notable feature of the numerical results is the formation of a gas-filled pocket between the membrane and the drop. This pocket grows with time up to a radial extension of the order of the drop radius, until finally the drop is pushed away from the surface, and a gap between the liquid and a solid surface opens through which gas escapes. The pressure inside the gas pocket is close to the pressure inside the chamber. This is seen more clearly in figure 8(a), showing the time evolution of the pressure on the membrane surface in the same simulation. Effectively, this means that for a relatively long time, the hydrodynamic resistance for gas flow through the membrane is much lower than that for gas escape from the pocket. The time evolution of the drop approaching the membrane can also be seen in the corresponding supplementary movie 7.

Figure 7. Image sequence showing results of the numerical simulations for a 2.66 mm diameter water drop impacting on the membrane with velocity 0.56 m s $^{-1}$ (
 $ {\textit {We}}= 11.5$,
  $\sqrt { {\textit {We}}}=3.4$) at gas velocity 2.26 m s
 $^{-1}$ and pressure difference
  ${\rm \Delta} p_c = 1404$ Pa across the membrane (
 ${\rm \Delta} p_c/(2\gamma /R) = 12.8$). The pressure field (pressure relative to the atmosphere) is shown as a colour map. The number in each frame indicates the time in milliseconds, where
  $t=0$ corresponds to the time instant where the distance between droplet surface and the membrane is minimal.

Figure 8. Simulation results for the pressure and force acting on an impacting drop. (a) Time series showing the development of the non-dimensional pressure relative to the atmosphere on the membrane surface, for the same conditions as considered in figure 7. The numbers in the legend indicate the time  $t$, non-dimensionalized with
  $\tau _{ic}$, where
  $t/\tau _{ic}=0$ corresponds to the time instant where the distance between the drop surface and the membrane is minimal. (b–d) Time evolution of the force
  $F_z$ acting on the drop in the
  $z$-direction, normalized with
  ${\rm \Delta} p_cR^2$, for the three different pressure differences
  ${\rm \Delta} p_c = (1404, 1748, 2093)$ Pa (gas velocity
  $u_g= (2.26, 2.80, 3.34)$ m s
 $^{-1}$,
  ${\rm \Delta} p_c/(2\gamma /R) = (12.8, 16.0, 19.1)$) corresponding to (b–d), respectively. In each plot, four different impact Weber numbers are considered, where in each case the highest one represents conditions close to the onset of IM2. (e) Non-dimensional time after which the momentum of the impacting drop is reduced to half of its initial value, obtained from the integrals of the curves in (b–d), as a function of
  $\sqrt {We}$.
4.2. Scaling model
These insights from the numerical simulations aid the formulation of a scaling relationship describing the onset of bubble formation. According to the simulations, the signature of the transition to IM2 is the formation of a gas-filled pocket between membrane and drop with a pressure close to that inside the chamber. Let  $u_l$ be the drop velocity upon impact,
  $R$ the drop radius (based on a spherical drop shape), and
  $\tau$ the rebound time, which is the characteristic time span between impact and rebound (Antonini et al. Reference Antonini, Jung, Wetzel, Heer, Schoch, Moqaddam, Chikatamarla, Karlin, Marengo and Poulikakos2016), also referred to in the literature as contact time (Richard, Clanet & Quéré Reference Richard, Clanet and Quéré2002) or residence time (Liang & Mudawar Reference Liang and Mudawar2017). Based on a large number of experiments with different impact velocities and gas flow rates (see Appendix D), we conclude that
  $\tau$ is virtually independent of the drop impact velocity and the gas velocity. This observation is consistent with results from drop impact experiments on non-porous surfaces (Bartolo, Josserand & Bonn Reference Bartolo, Josserand and Bonn2005; Bird et al. Reference Bird, Dhiman, Kwon and Varanasi2013) and can be explained by the fact that with increasing
  $u_l$, the radial spreading of the droplet upon impact becomes faster, but the spreading diameter increases. Indeed, for planar surfaces, the rebound time is found to be of the order of the lowest-mode oscillation period of a spherical drop
  $\tau /\tau _{ic} = {\rm \pi}/\sqrt {2}\approx 2.2$, with experimental values
  $\tau /\tau _{ic} = 2.6 \pm 0.1$ for rebound from superhydrophobic surfaces (Richard et al. Reference Richard, Clanet and Quéré2002),
  $2.2 \pm 0.2$ from sublimating surfaces (Antonini et al. Reference Antonini, Jung, Wetzel, Heer, Schoch, Moqaddam, Chikatamarla, Karlin, Marengo and Poulikakos2016), and
  $2.65 \pm 0.20$ in the hot Leidenfrost regime (Biance et al. Reference Biance, Chevy, Clanet, Lagubeau and Quéré2006). The fact that
  $\tau$ and
  $\tau _{ic}$ are nearly constant in our experiments (see Appendix D and table 1) is consistent with the result from the literature that
  $\tau$ is proportional to
  $\tau _{ic}$.
Based on that, the scale of the average acceleration that a drop experiences upon impact is given by  $u_l/\tau _{ic}$, and the corresponding force is given by
  $Mu_l/\tau _{ic}$, with
  $M$ being the drop mass. Based on the numerical simulations, the scale of the pressure pushing a drop away from the membrane is given by
  ${\rm \Delta} p_c$. Both from the simulations and from the experimental results on the wetting diameter, we infer that during the spreading phase, the gas-filled pocket below the drop grows radially until it reaches an extension of about
  $R$, after which it opens and the pressurized gas can escape (see figures 7 and 8a), or the liquid touches the membrane to form a bubble. The force pushing the impacting drop away from the membrane therefore is of the scale
  ${\rm \Delta} p_c\,R^2$, and the force balance during impact then reads
 \begin{equation} \rho R^3\,\frac{u_{lb}}{\tau_{ic}} \sim R^2\,{\rm \Delta} p_c, \end{equation}
where  $u_{lb}$ indicates the impact velocity characteristic for the onset of bubble formation. Even though figure 8(a) suggests that the pressure below the drop decreases on a time scale significantly shorter than
  $\tau _{ic}$, the force acting upon the drop stays relevant much longer. To further elucidate this behaviour, figures 8(b–d) show the force on the drop due to the gas phase for three different cases, obtained by integrating the stress tensor over the surface of the drop. The three cases differ in the pressure inside the chamber, and the corresponding impact velocities are varied up to a point in the parameter space close to the onset of IM2. In all curves, the pressure force from the scaling model corresponds to a value of 1. The average non-dimensional force
  $F_z/(R^2{\rm \Delta} p_c)$ that acts within the time span of
  $\tau _{ic}$ ranges from 0.34 up to 0.58, which means that in an order-of-magnitude sense,
  $R^2{\rm \Delta} p_c$ represents the average force acting on an impacting drop. Also, the time evolution of the force shown in figures 8(b–d) indicates that the capillary-inertial time scale seems to be the relevant time scale in the impact process. Then the force balance (4.1) can be rewritten as
 \begin{equation} \sqrt{{\textit{We}}_b} = {\textit{Oh}}\,{\textit{Re}}_b = \alpha\,\frac{{\rm \Delta} p_c}{2\gamma/R}, \end{equation}
with the Laplace pressure  $2\gamma /R$ inside the drop as a characteristic pressure scale. Here,
  $ {\textit {We}}_b$ and
  $ {\textit {Re}}_b$ are the Weber and Reynolds numbers based on
  $u_{lb}$. The dimensionless pre-factor
  $\alpha$ introduced above serves as a fitting parameter and is expected to be of the order of unity. To check the validity of (4.2), corresponding linear fits to the data points in figures 3(a,b) with the lowest impact velocity corresponding to IM2 were computed. Apparently, the transition to IM2 is well described by a linear relationship, with values for
  $\alpha$ of 0.3 (water) and 0.18 (ethanol).
Essentially,  $\alpha$ is expected to be a function of the dimensionless groups governing the problem. The question arises of what could cause the significantly different
  $\alpha$ values for ethanol and water. We hypothesize that the reason lies in the different wetting properties of the membrane when comparing water with ethanol. An indication of this is the difference in impact mode at impact velocities just below the onset of bubble formation observed in the two cases. In the case of ethanol, IM3 (with initial contact and subsequent detachment) is the dominant mode below onset, while it can be IM1 (no initial contact) and to a lesser extent IM3 for water. In this context, it needs to be borne in mind how the initial contact of an impacting drop with a surface is established on a microscopic level. When the gas film separating the drop and the surface has become very thin, small liquid bridges nucleate between the drop and the solid, and rapidly grow in time (de Ruiter et al. Reference de Ruiter, Oh, van den Ende and Mugele2012; Kolinski, Mahadevan & Rubinstein Reference Kolinski, Mahadevan and Rubinstein2014; Kolinski et al. Reference Kolinski, Kaviani, Hade and Rubinstein2019). For this process, asperities of the surface play an important role, which is why we expect that for the comparatively rough membrane surfaces used in our experiments, the formation of liquid bridges will be a key process for the initial contact with the surface. The difference in bridge-formation dynamics between water and ethanol could explain the different
  $\alpha$ values.
While we are not aware that the forces and stresses on drops impacting on a surface with gas discharge have ever been studied, there is a substantial corresponding body of work for drops impacting on passive surfaces (Cheng, Sun & Gordillo Reference Cheng, Sun and Gordillo2022). Initially, the pressure curves displayed in figure 8(a) show the same qualitative behaviour as the curves found on passive surfaces (Cheng et al. Reference Cheng, Sun and Gordillo2022). Specifically, the pressure maximum is found in the region of closest distance between the membrane and the drop surface. At later stages, however, the pressure maximum is found at  $r = 0$. This marked difference to the case of passive surfaces is due to the fact that the outflow through the membrane is redirected radially, causing a viscous pressure drop. Another aspect that may be discussed in the light of the existing literature on drop impact is our choice for the time scale appearing in (4.1). A frequent choice for the time scale entering the force balance is the impact time
  $2R/u_l$, which would introduce an additional factor
  $u_l$ in (4.1). Notably, for the cases considered here, this time scale is quite close to
  $\tau _{ic}$. When formulating a scaling model with
  $2R/u_l$ as characteristic time scale, the transition to IM2 is not described nearly as well as with the fit curves shown in figure 3. We take this as additional support for choosing
  $\tau _{ic}$ as the relevant time scale in the scaling model.
We stress that the scale  $R^2\,{\rm \Delta} p_c$ for the force repelling the impacting drop from the membrane used in the scaling analysis applies only to impact close to the onset of bubble formation, where the impact velocity of the drop and the corresponding pressure drop across the membrane depend on each other. As can be seen in figures 8(b–d), a lower impact velocity will – everything else being equal – lead to a lower force. For drop impact on passive surfaces, the temporal evolution of the impact force follows a universal curve for sufficiently high
  $ {\textit {Re}} \gtrsim 200$ (Cheng et al. Reference Cheng, Sun and Gordillo2022), when time is normalized by the impact time
  $D/u_l$, and force by the inertial scale
  $\rho u_l^2 D^2$. For drops impacting on a surface with gas discharge without contact on the initial approach (impact mode IM0 or IM1), a gas cushion repels the drop during the entire rebound process, leading to a different dynamics. Notably, the gas flow into the cushion from the membrane yields a different pressure distribution compared to passive surfaces. This can be seen in figure 8(a), where the curves at later times no longer exhibit a maximum at finite values of
  $r/R$. Correspondingly, the universal scaling characteristic for passive surfaces does not apply.
It is visible in figures 8(b–d) that the time instant of the force peak slightly shifts to higher values with increasing impact velocity, suggesting at first glance that the chosen time scale cannot ensure universality. But since the force peak contains only instantaneous information, it is not suitable for this type of analysis. Instead, a specific integral quantity should be chosen to cover a larger time span. Therefore, figure 8(e) shows the time instant where the drop momentum (integrated from the force curves in figures 8(b–d)) reaches half of the initial drop momentum ( $Mu_l$). The resulting time scale is denoted as
  $t_{0.5}$ and is non-dimensionalized with the capillary-inertial time scale
  $\tau _{ic}$. If plotted over the square root of the impact Weber number, only a negligible dependence is seen, reinstating the chosen time scale as the relevant one in this scenario.
5. Conclusion
In conclusion, we have studied the impact of drops on sticky porous membranes with gas discharge. We have identified four different impact modes that were displayed in dynamic regime maps spanned by non-dimensional versions of the gas velocity at the membrane surface and the drop impact velocity. The most remarkable aspect of the dynamics is the transformation of a drop into a bubble, which occurs when a drop just overcomes the repulsion by the gas flow and wets the surface. This transition is well described by a simple scaling relationship based on a balance between inertia and the repulsive force due to the gas flow. In this regime, a gas cushion forms below a drop with a pressure close to that in the pressurized chamber, indicating that the hydrodynamic resistance for gas discharge through the membrane is significantly lower than for discharge through the thin film above the membrane. We expect that on this basis, further fascinating drop impact regimes will be discovered, since the parameter space that includes the permeability coefficient of the membrane, the gas velocity and the wetting properties of the surface, among others, leaves extensive room for future studies.
Supplementary movies
Supplementary movies are available at https://doi.org/10.1017/jfm.2022.921.
Funding
This work was supported by the Deutsche Forschungsgemeinschaft within the Collaborative Research Centre 1194 ‘Interaction between Transport and Wetting Processes’, Project A02b.
Declaration of interests
The authors report no conflict of interest.
Appendix A. Experimental procedures and data evaluation
The three main parameters to be varied in the course of the measurements are the gas flow rate, the impact height and the type of fluid. After a specific liquid has been chosen, a specific gas flow rate is set before the impact height is adjusted. The impact height is the height difference between the uppermost point of the membrane and the lowermost point of the drop in the moment where it detaches from the needle. The highest point of the membrane depends on the gas flow, since higher flow rates increase its deflection. To prevent further adjustments, the gas flow is turned on prior to height adjustment. First, the flow rate is set, and then the impact height is adjusted, starting at low heights and successively increasing the height after every successful experiment. After all impact heights for a specific gas flow rate have been investigated, a different flow rate is chosen and the height variation repeated.
The measured gas flow rate needs to be converted into the gas velocity at the membrane surface. This is done by considering the effective membrane surface area. The hole in the plate that covers the chamber has radius  $b=5$ mm. This leads to the initial surface area without gas flow
  $A_{init}={\rm \pi} b^2$. In the case of gas discharge, the membrane deflects and increases its surface area. This effective area is calculated using the equation of a spherical cap, based on the radius of curvature
  $R_m$:
 \begin{equation} A_{eff} = 2{\rm \pi} R_m\left(R_m-\sqrt{R_m^2-b^2}\right). \end{equation}
The radius of curvature can be measured from the experiments. With that, the gas velocity at the membrane surface is obtained from the volume flow  $Q$ as
 \begin{equation} u_g = \frac{Q}{A_{eff}}. \end{equation}
Without any drag force due to the gas, the impact velocity of a drop would be given as  $\sqrt {2gh}$, where
  $g$ is the gravitational acceleration and
  $h$ is the impact height. However, while the drag force is not very pronounced, it is detectable, which means that the naive expression for the impact velocity overestimates the impact velocity in a measurable manner. Therefore, instead of calculating the impact velocity, it is measured from the last few frames before impact. The corresponding vertical displacement of the drop's centre of mass
  ${\rm \Delta} h$ is determined by averaging the height differences of the uppermost and lowermost points of the drop. The time increment
  ${\rm \Delta} t$ corresponding to that is related to the number of frames
  $n$ recorded by the high-speed camera and the frame rate
  $f$ by
  ${\rm \Delta} t = (n-1)/f$. With that, the impact velocity is obtained as
  $u_i = {\rm \Delta} h/{\rm \Delta} t$.
Appendix B. Membrane fabrication
Hydrophobic thermoplastic polyurethane (TPU) membranes were fabricated, based on the following process. We dissolved 2 g TPU powder and 4 wt.% octadecyltriethoxysilane in a mixture of dimethylformamide and tetrahydrofuran (1 : 1 volume ratio), then stirred for 24 h to achieve homogeneous mixing. Subsequently, the solution fills 5 ml plastic syringes. A syringe pump is employed to control the flow rate of the solution (1 ml h $^{-1}$), and a constant voltage (18 kV) is applied between the needle and a rotating drum. The latter is used as the surface onto which the fibres were deposited to form a membrane. This way, after a time span of 2.5 h, a 25
  $\mathrm {\mu }$m thick fibre membrane with porosity approximately 88 % is formed (process temperature approximately 25
  $^{\circ }$C). Finally, the membrane is annealed at temperature 120
  $^{\circ }$C for 36 h in a vacuum drying oven. Scanning electron micrographs of the membrane surface are shown in figure 9. The intertwined fibres with diameter
  $1.12 \pm 0.13$
  $\mathrm {\mu }$m have a smooth surface and form random networks. The tensile strength of the membrane is about 4 MPa.

Figure 9. Scanning electron micrographs at two different magnifications, showing the surface of the electrospun TPU membrane.
Appendix C. Finite-element simulations: model and implementation
Simulations of the drop impact were performed using the commercial finite-element solver COMSOL Multiphysics (version 5.6, COMSOL AB, Stockholm, Sweden) based on the interface tracking scheme as implemented in the ‘moving mesh interface’ for capturing the flow of two immiscible fluids. An axisymmetric model was set up in which the incompressible Navier–Stokes equations together with the continuity equation,
 \begin{equation} \rho_i\left(\frac{\partial\boldsymbol{u}_i}{\partial t} + \left(\boldsymbol{u}_i\boldsymbol{\cdot}\boldsymbol{\nabla}\right) \boldsymbol{u}_i\right)= \boldsymbol{\nabla}\boldsymbol{\cdot}\boldsymbol{\mathsf{T}}_i +\rho_i \boldsymbol{g},\quad \boldsymbol{\nabla}\boldsymbol{\cdot} \boldsymbol{u}_i = 0, \end{equation}
are solved in the liquid and the gas phase. Subscripts  $i$ on the velocity
  $\boldsymbol {u}_i$ and pressure fields
  $p_i$ indicate the phase, with
  $\rho _i$,
  $\mu _i$ and
  $\boldsymbol{\mathsf{T}}_i$ the respective density, viscosity and stress tensor for incompressible Newtonian fluids,
 \begin{equation} \boldsymbol{\mathsf{T}}_i ={-}p_i \boldsymbol{I} + \mu_i\left(\boldsymbol{\nabla}\boldsymbol{u}_i + \left(\boldsymbol{\nabla}\boldsymbol{u}_i\right)^{\rm T}\right) \end{equation}
and  $\boldsymbol {g}$ as acceleration due to gravity. At the interface between the two phases, the velocity field is continuous,
  $\boldsymbol {u}_1 = \boldsymbol {u}_2$, and the stress condition includes surface forces due to the surface tension
  $\gamma$ acting normal to the interface:
 \begin{equation} \boldsymbol{n}_s \boldsymbol{\cdot} \boldsymbol{\mathsf{T}}_2 = \boldsymbol{n}_s \boldsymbol{\cdot} \boldsymbol{\mathsf{T}}_1 + \gamma (\boldsymbol{\nabla}_s\boldsymbol{\cdot}\boldsymbol{n}_s)\boldsymbol{n}_s, \end{equation}
where  $\boldsymbol {n}_s$ is the interface-normal pointing outwards from fluid 1, and
  $\boldsymbol {\nabla }_s = (\boldsymbol {I}-\boldsymbol {n}_s\boldsymbol {n}_s)\boldsymbol {\cdot }\boldsymbol {\nabla }$ is the surface gradient operator with the identity matrix
  $\boldsymbol {I}$. Mesh points on the interface are moved with velocity
  $\boldsymbol {u}_{mesh}=(\boldsymbol {u}_1\boldsymbol {\cdot }\boldsymbol {n}_s)\boldsymbol {n}_s$, tracking the interface, and this displacement of the mesh is propagated into the domain using a Yeoh smoothing method, inspired by the Yeoh hyperelastic model for the deformation of elastic materials (Holzapfel Reference Holzapfel2000).
The computational domain is sketched in figure 10. We assume rotational symmetry around the  $z$-axis pointing in the direction opposite to the gravitational acceleration. Since there are no indications of any membrane deformation due to drop impact from the experiments, a fixed membrane shape is assumed. The computational domain has radius
  $R_d = 6.65$ mm and height
  $H_d = 9.82$ mm, partially bounded from below by the spherical-cap surface of the membrane, having radius of curvature
  $R_m = 10.17$ mm and protruding
  $h_m = 1.5$ mm into the domain along the
  $z$-axis. A spherical drop of radius
  $R = 1.33$ mm is initially located at the symmetry axis, with a gap of
  $h_0 = 3$ mm between the drop and the membrane.

Figure 10. Sketch of the simulation domain.
On all boundaries except for the symmetry axis and the surface of the membrane, the static pressure is set to  $p(z) = p_0 - \rho _g gz$, with
  $p_0 = 1013.3$ hPa. As indicated in figure 10, the origin of the
  $z$-axis is chosen to coincide with the intersection of the membrane and the axis of symmetry. On the surface of the membrane, a locally varying normal gas velocity
  $u_g=K(p_{res}-p)$ is prescribed, with membrane permeability
  $K=1.61\times 10^{-3}$ m s
 $^{-1}$ Pa
 $^{-1}$, pressure
  $p$ at a specific point on the membrane surface, and reservoir pressure
  $p_{res}=p_0+{\rm \Delta} p_c$. For reasons of numerical stability, the gas velocity is ramped up from zero to the above value within the first millisecond of the simulation. The material properties used in the simulation are those for DI water and nitrogen from table 1. The gravitational acceleration is set to
  $g = 9.81$ m s
 $^{-2}$. For the time sequence shown in figure 7, the pressure drop across the membrane is set to
  ${\rm \Delta} p_c = 1404$ Pa, and the drop is released with initial velocity
  $u_{d,0}=\sqrt {2g\times 13\,\mathrm {mm}}=0.505$ m s
 $^{-1}$ towards the membrane, corresponding to impact height
  $h_0+13\,\mathrm {mm}=16$ mm and impact velocity approximately 0.56 m s
 $^{-1}$ (corresponding to
  $ {\textit {We}}=11.5$).
C.1. Discretization and grid independence
For the simulations, the domain was discretized using a triangular mesh with maximum element size 40  $\mathrm {\mu }$m and minimum element size 0.5
  $\mathrm {\mu }$m while resolving narrow regions by at least 5 elements. Since the mesh deforms in the course of a simulation, automatic re-meshing was used to avoid large mesh distortions. This resulted in meshes consisting of approximately 100 000 elements. Linear basis functions were used for both velocity and pressure (
 ${\rm P}1+{\rm P}1$ elements). The discretized nonlinear set of time-dependent equations was solved using the implicit backward differentiation formula time-stepping method (Butcher Reference Butcher2016) together with the MUMPS solver (MUltifrontal Massively Parallel Solver) (Amestoy et al. Reference Amestoy, Buttari, Duff, Guermouche, L'Excellent and Uçar2011) for the linearized equations.
To ensure that the numerical resolution is sufficient, a convergence study was performed for the impact scenario shown in figure 4 of the main text. Five different meshes were initialized, with numbers of elements ranging from 47 000 to 123 000. The pressure difference between a point on the symmetry axis right at the membrane surface and the ambience was taken as indicator for convergence, which, at the same time, is a key quantity entering the scaling model described in the main text. From the smallest to the largest mesh, the relative pressure varies by only about 0.6 %, confirming that the numerical results are virtually mesh-independent.
Appendix D. Rebound time
The scaling model uses the rebound time  $\tau$ as a parameter and is based on the assumption that
  $\tau$ is virtually independent of the drop impact velocity and the gas velocity. Here,
  $\tau$ is the time span from impact to rebound, therefore including the spreading and receding phase. In order to identify these two phases, the normalized spreading diameter is used, which is defined as
 \begin{equation} \beta(t)=\frac{D(t)}{D_{max}}, \end{equation}
where  $D(t)$ is the drop diameter at time
  $t$ (measured in the radial direction), and
  $D_{max}$ is the maximum spreading diameter.
Figure 11 shows experimental results for the dimensionless spreading diameter as a function of time for gas velocities ranging from 1.5 to about 4 m s $^{-1}$, impact velocities ranging from 0.4 to 1.9 m s
 $^{-1}$, and different liquids (DI water and ethanol). The corresponding Weber numbers range from 8 to 140. In total, 109 curves are shown in the diagram, each correlating to a single experiment with either IM1, IM2 or IM3. Experiments with IM0 are almost entirely excluded since they correspond to very low Weber numbers and therefore show a significantly different behaviour. Due to the time resolution of 1 ms in our experiments, each curve interpolates between 6 to 11 individual data points acquired during each drop impact event. The spreading and receding phases are clearly visible as positive and negatives slopes. Apart from some scatter in the data, the different curves collapse onto a single master curve. To a good approximation, the rebound time seems to be independent of the gas velocity, the drop impact velocity and the type of liquid.

Figure 11. Experimental data on the normalized spreading diameter as a function of time for different gas velocities, drop impact velocities and liquids. The time axis is defined such that  $t/\tau _{ic}=0$ corresponds to the time at which the drop reaches the maximum diameter. The colours are used merely to make the curves visually distinguishable.


