Introduction
Linear accelerators are available with an option that allows independent movement of the collimator jaws. This option may be used to create wedge-shaped dose distributions by moving one of the independent collimator jaws during irradiation, while the opposite jaw remains stationary. The clinical implementation of a dynamic wedge requires measurement of the central axis percentage depth doses, central axis wedge factors and beam profiles. The delivery of an enhanced dynamic wedge (EDW) is a simple one-dimensional intensity modulation, for which only two parameters are modulated during the course of treatment: jaw position and beam intensity. When combined, these modulations create a fluence profile in real time, which is similar to a physical wedge of a particular angle.Reference Ahmad, Hussain, Muhammad, Abbas and Matiullah1
The wedged isodose profile is created by the integration of the dose that is deposited as the jaw sweeps across the field from the open to the closed position. Because of the jaw’s motion, different parts of the field are exposed to the primary beam for different lengths of time. This creates the wedged dose gradient across the field. Throughout the treatment, dose is delivered and the jaw is moved under computer control.Reference Kijewski2, Reference Leavitt, Martin, Moeller and Lee3 The relationship between the delivered dose and the jaw position is well defined within the control system, and is accurately followed in order to create the wedge-shaped field of the desired wedge angle. Computer control ensures that the delivered dose and jaw position follow the exact particulate pattern that produces the prescribed dose distribution. The relationship between the delivered dose and the jaw position in dynamic wedge treatment is based on a segmented treatment table (STT), which provides a tabular representation of the jaw position versus the fraction of the dose that is delivered. For EDWs, treatment uses two STTs that are independent of the initial field size and wedge angle.Reference Rutonjski, Kuzmanović, Baucal, Petrović and Teodorović4, Reference Chang and Gibbons5
In this study, a Seven29 detector array (PTW, Freiburg, Germany) was used to evaluate EDW dosimetry. The purpose of the study was to examine the wedge factors and beam profiles of a wedge field. Different angles, available energies and clinically relevant depths were examined. A comparison study was also conducted between the Eclipse treatment planning software and the actual dose measurements acquired through the two-dimensional (2D) array.
Methods
PTW 2D array
The PTW Seven29 ion chamber array is composed of Seven29 air vented cubic ionisation chambers (5×5×5 mm), each of which has a centre-to centre spacing of 1 cm. It is used to measure the dose generated in a plane by a radiation beam. Graphite is used as the wall material. The material that surrounds the vented ionisation chamber is poly methyl methacrylate.
Solid water phantom
Solid water phantoms are the closest approximation to water.
They provide a convenient and reliable alternative for photon and electron beam quality assurance. Solid water is flexible, and it does not break under impact. Slices are available at thicknesses of 0·1–7 cm. The material can be easily machined and adapted to most ionisation chambers.
Scanning of the solid water phantom with the 2D array at different depths
This scanning was performed for EDW planning in the Eclipse treatment planning system. For this purpose, solid water phantoms were scanned with the 2D array using a computed tomography scanner (GE Optima; GE Healthcare, Little Chalfont, UK). Four different depths were assessed: 2·5, 5, 10 and 15 cm. Scanning was performed after the lasers had been aligned properly. The scanned images are then sent to the Eclipse treatment planning system. The setup is shown in the Figure 1.

Figure 1 Setup for the scanning of solid water phantom with the 2D array. The CT scanner used is GE optima. Abbreviation: CT, computed tomography.
EDW planning using the Eclipse treatment planning system
Using the scanned images, plans were created in the Eclipse treatment planning system version 10(Figure 2). Several different wedge angles were selected: 15°, 25°, 30°,45° and 60°. For each depth (2·5, 5, 10 and 15 cm) and each wedge angle, plans were created with energies of 6 and 15 MV. The wedges were measured in two different directions (IN and OUT directions). A total of 100 CGy was delivered in each case. For each delivery, the required monitoring units (MUs) were calculated. Profiles were taken for the same depth that was used in the verification plan for both profile directions and energies.

Figure 2 Verification plan in Eclipse treatment planning system using solid water phantoms with 2D array (for depth 10 cm).
Measurement using the 2D array
The measurements were taken in the Varian Clinac iX (Varian Medical Systems, Palo Alto, CA, USA) linear accelerator (LINAC) using the PTW 2D ion chamber array (Friburg, Germany). The gantry and collimator were set to 0°. The field size was fixed to 10×10 cm2, with a constant source-to-chamber distance of 100 cm. The field size was symmetric and constant throughout the measurement. Solid water phantoms with different depths (2·5, 5, 10 and 15 cm) were arranged over the 2D array. The source-to-surface distance was different in each case. The pre-calculated MU was delivered for each wedge angle and with different orientations. For each delivery, Verisoft software (PTW) provided a table of dose values that corresponded to each of the detector positions, isodose lines and isodose areas. The measurement setup in Linac is shown in Figure 3.

Figure 3 Measurement setup in linac (Varian Clinac iX) where 2D array with solid water phantoms are arranged on the couch.
To determine the wedge factor for each depth, the dose was calculated without the wedge in the Eclipse planning system, for both 6 and 15 MV. The required MUs were calculated at the time of planning. After the dose calculation, the dose profiles were taken. In the LINAC setup, the calculated MU was delivered in the X-ray fixed mode for both energies and depths. The doses were obtained from Verisoft. Wedge factors were also measured for different wedge angles. The measured wedge factors were compared with the treatment planning system.
Results
Beam profiles were reconstructed with the help of a spreadsheet program that was built in-house and that employed the data obtained from the 2D array measurements. The profile illustrated the difference between EDW planning and measurements using 2D array.
Figures 4a–4f shows the beam profiles of wedge angles 15°, 45° and 60° for a depth of 5 cm and an energy 6 MV. Figures 5a–5f displays the profiles of the same wedge angles and energy for a depth of 10 cm. Figures 6a–6f and 7a–7f present results for energy of 15 MV.

Figure 4 Beam profiles of EDW for TPS versus measured dose for 6 MV at 5 cm depth (IN and OUT orientation of 15°,45° and 60° wedges). Abbreviations: EDW, enhanced dynamic wedge; TPS, treatment planning system.

Figure 5 Beam profiles of EDW for TPS versus measured dose for 6 MV at 10 cm depth (IN and OUT orientation of 15°,45° and 60° wedges). Abbreviations: EDW, enhanced dynamic wedge; TPS, treatment planning system.

Figure 6 Beam profiles of EDW for TPS versus measured dose for 15 MV at 5 cm depth (IN and OUT orientation of 15°,45° and 60° wedges). Abbreviations: EDW, enhanced dynamic wedge; TPS, treatment planning system.

Figure 7 Beam profiles of EDW for TPS versus measured dose for 15 MV at 10 cm depth (IN and OUT orientation of 15°,45° and 60° wedges). Abbreviations: EDW, enhanced dynamic wedge; TPS, treatment planning system.
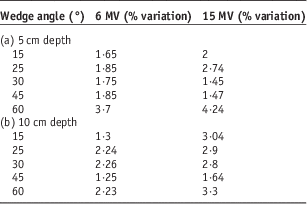
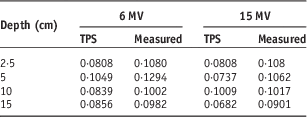
Table 1a presents the percentage deviation between planned and measured doses at the shoulder region in the profile for a 5-cm depth. Table 1b shows results for a 10-cm depth. Table 2 provides the standard deviations between the dose values at the shoulder region in the profile, as shown for different depths in planning and array measurements. Values of both energies are given.
Table 1 % variation (±) between planned and measured doses at shoulder region in the profile (IN—direction)

Table 2 Standard deviation between doses at shoulder region in the case of eclipse planning and 2D array measurement at different depths (IN direction)

Abbreviation: TPS, treatment planning system.
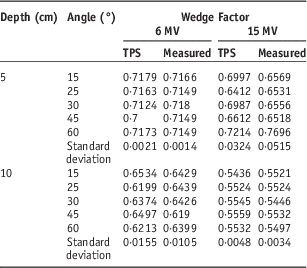
In addition, the open-field planning and measurement data were used to find the wedge factors for each wedge. The results in Table 3 include the standard deviations between the wedge factors, as planned and measured.
Table 3 Wedge factor obtained from TPS and array measurement and standard deviation between wedge factor for different wedge angles for 5 and 10 cm depth

Abbreviation: TPS, treatment planning system.
Discussion
The data that had been acquired from array measurements and planning were used to obtain beam profiles and wedge factors. These beam profiles and wedge factors were compared with the Eclipse treatment planning system to determine significant differences between the two in a quantitative manner. Different studies have been published regarding EDW dosimetry that uses 2D diode arrays and linear detector arrays.Reference Ahmad, Hussain, Muhammad, Abbas and Matiullah1, Reference Salk, Blank, Machold, Rau, Schneider and Röttinger6, Reference Allahverdi, Mohammadkarim, Esfehani, Nedaie, Shirazi and Geraily7 In addition, studies have been published on the field-size dependence, depth dependence and off-axis dependence of physical and non-physical wedges.Reference Ahmad, Hussain, Muhammad, Abbas and Matiullah1, Reference Salk, Blank, Machold, Rau, Schneider and Röttinger6, Reference Robertson and Webb8–Reference McCullough, Gortney and Blackwell19
When the profiles obtained from planning and measurements were compared, it was found that the profiles were in agreement with each other, with the exception of some points, including the ‘toe’ and ‘heel’ regions. From the figures (Figures 4–7 (a–f)), it was understood that, as depth increased, the shoulder-like region in the profiles reduced for both of the energies. In addition, as depth increased, the percentage deviation between planned and measured doses at the shoulder region reduced at larger wedge angles (45°, 60°; Table 1). From this we can state that in the case of therapeutic depths the EDW would deliver accurate dose. Further, the standard deviations between planning and array measurement dose values were in acceptable ranges at the shoulder region of the profiles for different depths.
The dose at the heel portion of the profiles represents the open-field dose. All EDW treatments start with some portion of the dose being delivered as an open field. In other words, a portion of the total dose is delivered before the jaw starts moving. After the appropriate fraction of the total dose has been delivered, the jaw starts sweeping the field from the open to the closed position. The exact fraction of total dose that has been delivered as an open field is a function of the selected energy, field size and wedge angle.
In our study, there was no significant difference between wedge factors obtained from planning and measurement (Table 3). In addition, the standard deviation between the wedge factors was lower and within tolerances. In the case of physical wedges, many studies have proven that the wedge factor changes significantly with depth. This is a result of the beam hardening effect. However, in the case of EDW, there was no significant change in the wedge factor with depth for any wedge and either energy. This is a result of the lack of the beam hardening effect, because of which the delivered dose corresponds more closely to the planned dose. Even though the beam hardening effect is absent, one can observe small changes in the wedge factor according to depth. This may be a consequence of the energy fluence imbalance across the wedge direction.Reference Ahmad, Hussain, Muhammad, Abbas and Matiullah1
Conclusion
Based on the results of our study, it can be conclude that the Seven29 2D ion chamber array can be used effectively to obtain the dosimetric characteristics of an EDW. Using the spreadsheet program that we built in-house, EDW profiles can be reconstructed from the 2D array data in a simple and accurate manner.
Acknowledgement
This work was carried out with whole hearted support from the faculty and other staffs of Department of Radiation Oncology, Malabar Cancer Centre, Thalassery, Kerala, India.
Financial Support
This research received no specific grant from any funding agency, commercial or not-for-profit sectors.


