


Introduction
Latest developments in the area of microwave breast imaging consist of improving both the signal processing and image formation step [Reference Foroozan, HosseinKhah and Adve1–Reference Tajik, Trac and Nikolova5] as well as the performance of data acquisition equipment [Reference Islam, Ullah, Alam, Singh and Cho6–Reference Wang and Xu8]. Thanks to these advancements, different research groups have manufactured their pre-clinical imaging setups [Reference Islam, Samsuzzaman, Islam, Kibria and Singh9–Reference Wang13] aiming at breast screening in a larger number of women.
During the past two decades, the mortality rate caused by breast cancer has steadily decreased [Reference Malvezzi, Carioli, Bertuccio, Boffetta, Levi, La Vecchia and Negri14]. The reason for this trend can partly be explained by more women going through routine screening tests, such as X-ray mammography and magnetic resonance imaging (MRI). Given the ionizing radiation of X-rays, this type of mammography is confined to women over 40 years. On the other hand, due to the high costs of manufacturing and maintenance, screening by MRI devices is usually only recommended to women with a family history of breast cancer. These restrictions have forced researchers to look for other possibilities in order to compensate for the aforementioned limitations [Reference Garcia-Uribe, Erpelding, Krumholz, Ke, Maslov, Appleton, Margenthaler and Wang15–Reference Ozmen, Dapp, Zapf, Gemmeke, Ruiter and van Dongen18]. Microwave imaging systems have several advantages including cost-effectiveness, non-ionizing nature of microwave radiation, high dynamic range, availability of amplitude and phase information, and the ability to implement frequent check-ups [Reference Chandra, Zhou, Balasingham and Narayanan19–Reference Wörtge, Moll, Krozer, Bazrafshan, Hübner, Park and Vogl24]. In addition, microwave breast-imaging techniques may complement the diagnostic information about the tumors’ microenvironment given by the analysis of the tumors’ permittivity. A disadvantage is the larger wavelength of the microwave approach, so that recent developments aim at mm-wave breast-imaging systems which have a wavelength that is comparable with medical ultrasound systems [Reference Prati, Moll, Kexel, Nguyen, Santra, Aliverti, Krozer and Issakov25].
While microwave tomography methods provide the permittivity map of breast tissue, they suffer from considerable computational expenses for solving the ill-conditioned inverse scattering problem [Reference Kwon and Lee26]. Hence, it might be advantageous to consider radar-based microwave-imaging systems equipped with real-time image processing. However, many image reconstruction techniques have their own obstacles, e.g. assuming a constant and frequency independent relative permittivity [Reference Moll, Kelly, Byrne, Sarafianou, Krozer and Craddock27, Reference Wörtge, Moll, Krozer, Bazrafshan, Hübner, Park and Vogl24].
From the signal processing point of view, the aim of most radar-based methods is to synthetically focus the backscattered energy on the position of dominant scatterers [Reference Lazebnik, Popovic, McCartney, Watkins, Lindstrom, Harter, Sewall, Ogilvie, Magliocco, Breslin, Temple, Mew, Booske, Okoniewski and Hagness28]. In the case of breast imaging, the dominant scatterer could imply the presence of malignancy. Confocal methods such as delay and sum and delay multiply and sum [Reference Elahi29, Reference Sun, Zhang, Cui and Qu30] are well recognized and have been used as standard techniques to assess performances of other image reconstruction schemes. A comparison of several digital beamforming techniques was proposed in [Reference Moll, Kexel and Krozer31]. Time-reversal-based algorithms also exhibit better performances in high cluttered medium and show promising results for breast tissues with severe inhomogeneities [Reference Hossain and Mohan32, Reference Yousefnia, Zadeh, Dehmollaian and Madannejad33]. Space-time beamforming methods claim that they are able to eliminate couplings between array elements and also compensate for path loss and frequency dispersion [Reference Bond, Li, Hagness and Veen34]. One of the main challenges in the implementation of all these methods is to make an efficient estimation of the relative permittivity of the breast tissue [Reference Martellosio, Pasian, Bozzi, Perregrini, Mazzanti, Svelto, Summers, Renne, Preda and Bellomi35].
In this work, we introduce and compare qualitative and quantitative techniques for breast cancer imaging using a transmission-based imaging setup that operates in the frequency range from 1 to 9 GHz. The first algorithm follows the root-mean-square deviation (RMSD), analog to [Reference Wörtge, Moll, Krozer, Bazrafshan, Hübner, Park and Vogl24], to compute a qualitative breast-imaging map based on relative signal changes. The second algorithm uses, similar to [Reference Bourqui and Fear36], the differences between the time of arrival of electromagnetic waves propagating through air and breast tissue. However, the implementation of the phase center compensation is not needed here, because the transmitter and receiver are always aligned and move simultaneously to scan the breast tissue. This leads to a two-dimensional (2-D) map of estimated dielectric permittivity. In the third algorithm, the attenuation level of the transmission signals are computed and mapped to a 2-D image. This paper presents both, numerical results derived from simulation models and also clinical results obtained during an initial patient study. The experimental measurements are compared with X-ray mammograms of the same breast.
Experimental data acquisition
Figure 1 shows a schematic of our experimental setup which was previously introduced in [Reference Wörtge, Moll, Mälzer, Krozer, Hübner, Bazrafshan, Vogl, Santarelli, Popović and Nikolova37]. The imaging system consists of two low loss plexiglass plates with 5 mm thickness used for breast compression. During the tests, the upper plate could move in the vertical direction to ensure a proper mechanical contact between the plates and the breast. Two ultra-wideband (UWB) bowtie antennas [Reference Moll, McCombe, Hislop, Krozer and Nikolova38] for transmitting (top) and receiving (bottom) are connected to a HP 8720C vector network analyzer. Other UWB antenna sensors could have been used as well such as Vivaldi antennas [Reference Çayören, Abbak and Akduman39], dipole antennas [Reference Ley, Helbig and Sachs40], wide-slot antennas [Reference Gibbins, Klemm, Craddock, Leendertz, Preece and Benjamin41], or dielectrically scaled horn antennas [Reference Schwarz, Stephan and Hein42]. Measurements are performed in the frequency domain from 1 to 9 GHz using 101 frequency points with a sweep time of 90 ms. Next, the frequency domain measurements are transformed into time domain t using an inverse Fourier transform.

Fig. 1. Schematic of the experimental breast-imaging setup.
Both antennas can move in the horizontal direction to continuously scan a specified sensing volume in two dimensions. The measurement points and scan directions are depicted in Fig. 2 showing the meander-shaped scanning path. The whole system is controlled by an iPC25 (Isel, Eichenzell, Germany) using a Matlab interface. A measurement at coordinates (x, y) in the breast tissue is called S(x, y; ω) where ω represents the frequency. At the end of the scan a measurement in air is taken outside the breast region called S 0(x, y; ω).
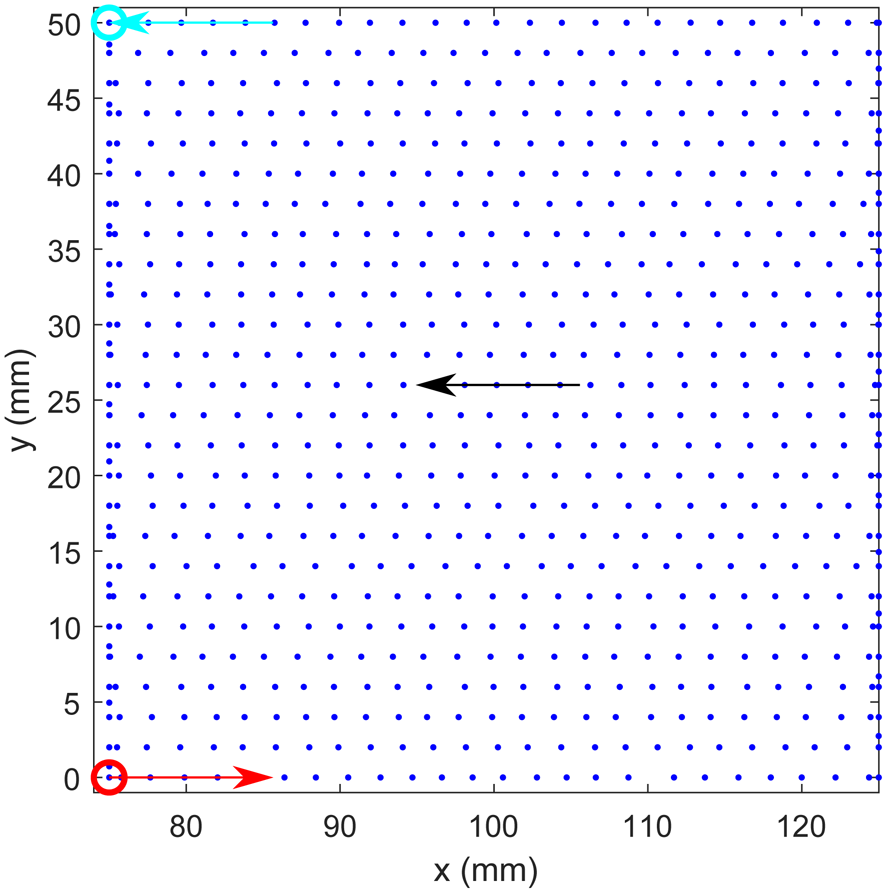
Fig. 2. Illustration of the spatial sampling during one breast scan. The scanning area is limited to 50 mm × 50 mm due to the limited examination time in the clinical study of 3 min.
The main advantages of our setup compared to related prototype systems are:
(i) no matching medium needed.
(ii) a mild breast compression is used to examine breasts with different size and geometry.
(iii) through a control unit it is possible to scan the breast tissue in a series of continuous points. Using only two antennas eliminates the need for a HF switching network.
(iv) simplified image reconstruction, because information on relative permittivity is not required.
Imaging algorithms
The numerical and experimental data are processed by three different imaging algorithms that are described below. Since the RMSD has been used for image formation in [Reference Wörtge, Moll, Mälzer, Krozer, Hübner, Bazrafshan, Vogl, Santarelli, Popović and Nikolova37], not all results are presented in the results section.
Root-mean-square deviation
A qualitative 2-D microwave image I RMSD(x i, y j) can be computed by the RMSD according to

where the signal duration is expressed in samples and is denoted by τ. Here, x i and y i represent the Cartesian coordinates of the measurement position and s(x i, y i; t) represents the time-domain radar signal recorded at (x i, y i).
Effective permittivity mapping
A quantitative 2-D microwave image can be obtained by a time difference analysis between a measurement in the breast s(x i, y j; t) and a measurement in air s 0(x, y; t). The time difference Δt(x i, y j) between the first peaks maximum of s(x i, y j; t) and s 0(t) is computed and transformed into a permittivity map using the relationship:

where c 0 is the speed of light in free space and d is the separation distance between the antennas.
Attenuation mapping
The third method also leads to a quantitative 2-D microwave image. The algorithm computes the attenuation map I(x i, y j) for every point in the imaging domain by processing the maximum of first peaks of corresponding transmission signals $\hat {s}\lpar x_i\comma\; y_i\semicolon\; t\rpar$ according to:

The denominator serves as reference and is the global maximum of the first peaks of all signals.
Numerical modeling
Description of the numerical model
In this section, we discuss a numerical model for malignant tissue detection in the frequency range from 1 to 9 GHz. The setup includes antennas as sensors, and a simplified numerical breast model for which the frequency-dependent material properties were derived from experimental measurements. Simulations are conducted by using CST Microwave Studio [Reference Systemes43].
Antenna modeling
In this study, an UWB bowtie antenna [Reference Moll, McCombe, Hislop, Krozer and Nikolova44] is used for the transmitter (Tx) and receiver (Rx) as shown in Fig. 3. The bowtie antenna has a width of t w = 9.9 mm, length t d = 10.5 mm, and a gap between two radiators of t g = 0.8 mm. In order to transform the antenna's input impedance to 50 Ω, a tapered microstrip line (balun) is used. Furthermore, the bowtie antenna is designed to radiate into the patient's breast without a coupling medium. Assuming an average relative permittivity of ɛr = 10 the bowtie antenna is placed inside a matching solid medium, filled with Eccostock HiK (ɛrHiK = 10 [45]). Dimensions of the block are $22\, {\rm mm}\times 35\, {\rm mm}\times 17\, {\rm mm}\ \lpar w\times l \times h\rpar$ .
.

Fig. 3. Geometry of the bowtie antenna, after [Reference Moll, McCombe, Hislop, Krozer and Nikolova44].
Figure 4 shows the reflection coefficient at the antenna input. According to the figure, the antenna has a 10 dB return loss in the ultra-wideband frequency range from 2 to 9 GHz.

Fig. 4. Simulated reflection coefficient of a bowtie antenna, after [Reference Moll, McCombe, Hislop, Krozer and Nikolova44].
Detection scheme
A simplified numerical breast phantom for tumor detection is modeled and simulated. The main goal is to understand the behavior of the RMSD-based imaging technique in the proposed transmission-based imaging configuration. Figure 5 shows a 2-D view of the setup where the Tx and Rx face each other and move in one direction simultaneously along the x-direction. The antenna structure from the previous section is used for both sensors. Between the antennas is a homogeneous dispersive tissue, including skin and fat layers. Material properties are shown in Fig. 6 [Reference Martellosio, Pasian, Bozzi, Perregrini, Mazzanti, Svelto, Summers, Renne, Preda and Bellomi46]. Each skin layer has a thickness of t skin = 2.5 mm, and the thickness of the fat layer is t fat = 50 mm. In addition, both sensors contact directly to the skin surface. The scanning step is d scan = 1 mm over 150 mm for maximum resolution.

Fig. 5. Simulation setup for cancer tissue detection using two bowtie antennas (Tx–Rx).

Fig. 6. Material properties of skin, fat, and tumor models, after [Reference Martellosio, Pasian, Bozzi, Perregrini, Mazzanti, Svelto, Summers, Renne, Preda and Bellomi46].
The differential detecting procedure is divided into two steps:
(i) Baseline scanning (no tumors): the antennas scan along the sample, which does not have any cancer tissues. Transmission signals between Tx–Rx are set as references (baseline values).
(ii) Detection scanning (with tumor): in this scenario, a spherical tumor with diameter $\emptyset = 8$
 mm is placed at position x = 71 mm. Transmission signals are recorded again and compared to the baseline signals.

Numerical results
In Fig. 7, an illustrative numerical time-domain signal is displayed. In order to explore the possibility to localize a tumor, the deviation between the tumor-free state and the state with tumor is considered. Therefore, the RMSD between both transmissions measurements is evaluated for all antenna positions according to equation (1). The early portion of the signal turns out to be particularly indicative. In Fig. 8, the normalized RMSD is plotted for all the antenna positions where below-average RMSD values have been zeroized. Therefore, at positions with a significant contribution to the RMSD the tumor can be localized.

Fig. 7. Exemplary transmission signal at antenna position 71 mm from the numerical simulation (top row) with the corresponding deviation between the pristine and the scenario with tumor (bottom row).

Fig. 8. RMSD of the numerical signals between the pristine and the scenario with tumor.
Experimental results
In Figs 9(a) and 10(a) X-ray images of the breast tissues for patients A and B are displayed and the scanned regions of the breasts during microwave data acquisition are shown by blue rectangles. The scanning area is limited to 50 mm by 50 mm based on the ethics vote with the reference number 2/16 obtained from the ethics committee of the J.W. Goethe-Universitätsklinikum (Frankfurt am Main, Germany).

Fig. 9. Comparison between X-ray image and microwave image for patient A. The microwave image is estimated through time delays caused by the propagation through the breast when compared to air. Locations with higher relative permittivity could be interpreted as cancerous tissue. The final thickness of the compressed breast is 44 mm during microwave examination and is 41 mm during X-ray examination.

Fig. 10. Comparison between X-ray image and microwave image for patient B. The microwave image is formed by calculating the signal's attenuation. Locations with higher attenuation could be interpreted as cancerous tissue. The final thickness of the compressed breast is 43 mm during microwave examination and is 37 mm during X-ray examination.
Looking at Fig. 9(b), one can see the permittivity map using equation (2) for patient A. Compared with the corresponding X-ray image, the area with higher permittivity enclosed by the red circle can be determined as cancerous region. However, if we consider the parts confined by red circles in Figs 9(a) and 9(b) we can see a variability of permittivity of malignant tissue which is in agreement with the obtained results of [Reference Lazebnik, Popovic, McCartney, Watkins, Lindstrom, Harter, Sewall, Ogilvie, Magliocco, Breslin, Temple, Mew, Booske, Okoniewski and Hagness28]. This result indicates that even cancerous regions have inhomogeneous dielectric properties.
The microwave attenuation image obtained using equation (3) for patient B is depicted in Fig. 10(b) and the zone with higher attenuation implies the tumor location. Comparing the microwave image confined in the red circle with its counterparts in the X-ray image confirms tumor existence. Like in the previous case, the attenuation of cancerous region is not constant.
An analysis on signal level is provided in Fig. 11(a) in which transmission signals in air are compared with transmission signals from two points in the breast of patient A, namely P 1 and P 2 as shown in Fig. 9(b). The time of arrivals for their first peaks are t Air, t 1, and t 2. From these quantities the time difference Δt in equation (2) can be derived. In contrast to what we would have expected the time delay of the signal with the highest attenuation is not automatically the signal with greatest time delay. This fact can also be explained by the strong variability of dielectric properties of breast tissues obtained through spectroscopic studies [Reference Lazebnik, Popovic, McCartney, Watkins, Lindstrom, Harter, Sewall, Ogilvie, Magliocco, Breslin, Temple, Mew, Booske, Okoniewski and Hagness28; Reference Goram, Moll, Wörtge, Krozer, Hübner, Bazrafshan and Vogl47]. Another signal example is depicted in Fig. 11(b) showing transmission signals of patient B at the positions P 3 and P 4 shown in Fig. 10(b). The differences in peak amplitude of the first maximum is labeled as ΔS. The corresponding maxima are processed in equation (3) to compute the attenuation map.

Fig. 11. (a) Exemplary transmission signals in patient A illustrating the variations in time of arrival; (b) transmission signals obtained from patient B illustrating variations in signal attenuation.
Conclusions
This paper presented three image formation techniques for microwave breast imaging in a transmission-based configuration. A qualitative imaging was based on the RMSD. Two quantitative image reconstruction methods for UWB microwave breast imaging exploit variations in time delay for permittivity mapping and variations in amplitude for attenuation mapping, respectively. Besides a numerical breast phantom, initial results from a patient study have been presented and the results have been compared to X-ray mammography.
Acknowledgments
J.M., C.K., D.H.N., and V.K. gratefully acknowledge financial support of this research by the Federal Ministry of Education and Research (Grant Number: 13GW0361D).
 Elham Norouzzadeh received her B.S. and M.S. degrees in electrical engineering in 2011 and 2014 from the Shahid Bahonar University of Kerman, Kerman, Iran and the Sharif University of Technology, Tehran, Iran, respectively. She is currently pursuing her Ph.D. degree in Electrical Engineering-Communication at the Department of ECE, K. N. Toosi University of Technology, Tehran, Iran. Her interests are UWB microwave imaging in biomedical applications, antenna and propagations, wireless and optical communications, and passive UWB Beamforming.
 Somayyeh Chamaani received her B.S. degree in electrical engineering from the Sharif University of Technology in 2004 and her M.S. and Ph.D. degrees in electrical engineering from the K. N. Toosi University of Technology in 2006 and 2011. She joined K. N. Toosi University of Technology in 2011 as an Assistant Professor of Electrical Engineering. Her research focuses on UWB antennas; UWB identification; UWB sensing; and UWB localization.
 Jochen Moll received his Dipl.Ing. and Ph.D. degrees in mechanical engineering from the University of Siegen, Germany, in 2007 and 2011, respectively. Presently, he is a Postdoctoral Research Assistant with Goethe University Frankfurt, Germany. His research interests include radar techniques for biomedical applications, signal processing, and imaging techniques. His research profile is located at http://www.jochenmoll.de.
 Christian Kexel received his B.Sc. and M.Sc. in physics from Technical University Darmstadt, Germany and Goethe University Frankfurt, Germany, respectively. He is currently pursuing his Ph.D. degree in physics from Goethe University. His research interests include signal processing and imaging techniques.
 Duy Hai Nguyen received his B.Eng. and M.Eng. in electrical engineering from the Frankfurt University of Applied Sciences, in 2012 and 2015, respectively. He is currently pursuing his Ph.D. degree in physics from Goethe University. His research focuses on antenna design for medical applications.
Frank Hübner received his Dipl.-Ing. degree in medical engineering from the Fachhochschule Gießen–Frberg, Giessen, Germany, in 2004, and his Ph.D. degree from Goethe-Universität Frankfurt, Frankfurt, Germany, in 2013. He was involved in medical imaging and diagnostic techniques including MRI and CT. Since 2005, he has been a Research Assistant with the Institute for Diagnostic and Interventional Radiology, Goethe-Universität Frankfurt. His current research interests include thermal ablation treatment procedures, especially laser-induced and microwave thermal therapies.
 Babak Bazrafshan received his M.Sc. degree in physics from Universität Heidelberg, Heidelberg, Germany, in 2008, and his Ph.D. degree from the Department of Physics, Goethe-Universität Frankfurt, Frankfurt, Germany, in 2013. He was involved in medical imaging and diagnostic techniques including MRI and CT. Since 2013, he has been a Research Assistant with the Institute for Diagnostic and Interventional Radiology, Goethe-Universität Frankfurt. His current research interests include application of microwaves for thermal therapy and diagnostics, MRI-based methods for diagnostics, as well as the development of tissue-mimicking phantoms.
 Thomas J. Vogl was born in Munich, Germany, in 1958. He received the Dr.Med. from the Ludwig Maximilian University of Munich (LMU), Munich, Germany, in 1983. In 1989, he was a Specialist in radiology with LMU, where he was a Senior Physician with the Radiological Clinic from 1990 to 1992. From 1992 to 1998, he was the Chief Senior Physician with Charité Berlin, Berlin, Germany, where he was a C3 Professor in 1993. Since 1998, he has been a Full Professor with Goethe-Universität Frankfurt, Frankfurt, Germany. His current research interests include interventional radiology cancer therapies such as transarterial chemoembolization and hyperthermia, as well as diagnostic radiology methods such as MRI- and CT-based diagnostic procedures. Dr. Vogl is member of several scientific associations and the Editorial Board of different scientific journals. He was a recipient of 13 national and international prizes and awards including the Hermann–Holthusen Ring from the Deutsche Röntgengesellschaft in 1994 and the Pater-Leander-Fischer Preis from the Deutsche Gesellschaft für Lasermedizin in 2003.
 Viktor Krozer (M’91–SM’03) received his Dipl.-Ing. and Dr.-Ing. degrees in electrical engineering from Technical University Darmstadt, Darmstadt, Germany, in 1984 and 1991, respectively. In 1991, he was a Senior Scientist with Technical University Darmstadt working on high-temperature microwave devices and circuits and submillimeter-wave electronics. From 1996 to 2002, he was a Professor with the Technical University of Chemnitz, Germany. From 2002 to 2009, he was a Professor in electromagnetic systems, with DTU Elektro, Technical University of Denmark, and was the Head of the Microwave Technology Group. Since 2009, he has been an endowed Oerlikon-Leibniz-Goethe Professor in terahertz photonics with Goethe University Frankfurt, Frankfurt, Germany, and heads the Goethe-Leibniz-Terahertz-Center. He is also with Ferdinand-Braun-Institut (FBH), Berlin, Germany, leading the THz Components and Systems Group. His research interests include terahertz electronics, MMIC, nonlinear circuit analysis and design, device modeling, and remote sensing instrumentation.


