Introduction
Among the various sophisticated and highly advanced radiotherapy techniques, proton beam therapy (PBT) has emerged as the most promising treatment modality because it shows precise targeting of the tumour site and deposits maximum dose to the malignant region.Reference Iqbal, Gillin, Summers, Dhanesar, Gifford and Buzdar 1 Due to the very low exit dose, PBT ensures maximum sparing of organs at risk. Proton beams demonstrate a well-defined range on entering into the medium. Beyond that range, no energy is deposited. It contains a highly concentrated and high-dose volume in a narrow region termed as Bragg peak.Reference Smith 2 Due to this unique property, PBT is recommended for the treatment of tumours near sensitive areas like brain, skull or spinal cord. As Bragg peak width is only few millimetres in depth, it is broadened by passive scattering and spot scanning techniques to create spread out Bragg peak (SOBP) for the delivery of a uniform dose distribution to the target volume.Reference Paganetti, Jiang, Adams, Cheng and Rietzel 3 , Reference Grusell, Montelius, Brahme, Rickner and Russell 4
The University of Texas, M. D. Anderson Proton Therapy Center at Houston (PTC-H) is providing PBT through both passive scattering (double scattering) and spot scanning techniques to combat cancer near sensitive sites in the body. It has a Hitachi synchrotron (Hitachi America, Ltd, Tarrytown, NY, USA) (70–250 MeV) and G1, G2 and F2 scattering beam lines with double scattering approach. Each beam line has small, medium and large snouts with 10, 18 and 25 cm diameter, respectively, and 8 beam energies (100–250 MeV). Each beam line has 24 options.Reference Smith, Gillin and Bues 5 Snout is a part of the nozzle lying closest to the patient and it consists of a compensator and aperture.
PBT requires a high level of quality control over the whole process from the treatment planning to the treatment delivery.Reference Gillin, Zhu and Sahoo 6 For this purpose, Radiation Physics Department of PTC-H contributes to the quality assurance (QA) of treatment planning systems and treatment delivery equipment to ensure optimal and accurate treatment delivery. Bijon Arjomandy et al. established the QA procedures to ensure accurate and safe treatment delivery from the synchrotron placed at M. D. Anderson PTC-H.Reference Arjomandy, Sahoo and Zhu 7 Actis et al. have also developed and discussed the daily QA procedures to assess the dosimetric parameters of the proton beam in their published work.Reference Actis, Meer, König, Weber and Mayor 8 Gillin et al. have provided commissioning data for the proton beam using discrete spot scanning technique at PTC-H.Reference Gillin, Sahoo and Martin 9
This investigation is aimed to report on the impact of large and medium snouts on the dosimetric specifications of the proton beam as a crucial part of the QA procedures performed at PTC-H. This study is also intended to analyse the output dependency of proton beam on various gantry angles and the effect of both snout sizes on the beam output.
Materials and methods
This exploration included Hitachi synchrotron (Hitachi America, Ltd, Tarrytown, NY, USA) placed at The University of Texas, M. D. Anderson Proton Therapy Center at Houston (PTC-H), for the extraction of eight proton beam energies of 100, 120, 140, 160, 180, 200, 225 and 250 MeV. Each beam energy took a different beam spill from the synchrotron.Reference Gillin, Sahoo and Martin 9 , Reference Coutrakon, Slater and Ghebremedhin 10 The maximum time length of 4·4 seconds was required by each spill. In the synchrotron, the beam was accelerated to its maximum energy and then decelerated after each spill. The deceleration lasted for only 1 second. Again the beam began to accelerate until the protons gained the required energy. Before extracting the proton beam from the synchrotron, the beam energy was examined by measuring the orbit position and revolution frequency.
The given proton beam energies from G1 scattering beam line using medium and large snouts were applied to an MP3-P water phantom (PTW, Freiburg, Germany) at the gantry angles of 0, 90, 180 and 270 degrees. The isocentre of gantry rotation was kept within 1 mm under all gantry angles. This phantom is a fully automated 3D water tank with up to 38 cm scanning depth. Due to the pulsed nature of the synchrotron, the scanning equipment was reviewed to ensure that this equipment would function during the 1·5 seconds between spills. A PTW Markus chamber (PTW 34045) was used to measure the range, Pristine Bragg peaks, SOBPs, CMD, beam output, flatness and symmetry in the water phantom. This chamber has a plate separation of 1 mm and a sensitive volume of 0·02 cm3. It can be positioned accurately at 0·1 mm in this water scanning system. It was positioned in such a manner that the centre of the chamber was aligned with the central axis of the field. This detector measured range at the 90% dose location in the water phantom along the central axis of the beam. Proton beam energies (100–250 MeV) on entering into the phantom showed variation in their range from 4·3 cm for 100 MeV beam to 28·5 cm for 250 MeV beam. Flatness was determined by computing the ratio between maximum and minimum doses.
 ${\rm Flatness}\left( \,\%\, \right){\equals}{\rm Dmax}\,/\,{\rm D}\,{\rm min}{\,\times}100\,\%\,$
Symmetry was analysed by taking the ratio of the doses at two symmetric points relative to the field central axis.
 ${\rm Symmetry}\left( \,\%\, \right){\equals}\left[ {{\rm D}\left( {{\rm x},{\rm y}} \right)} \right]\,/\,\left[ {{\rm D }\left( {{\minus}{\rm x},{\minus}{\rm y}} \right)} \right]{\,\times}100\,\%\,$
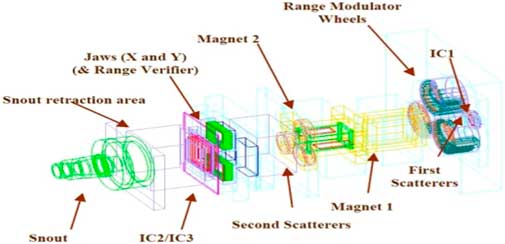
Double scattering technique was used for the creation of SOBPs to ensure the delivery of uniform dose distribution to the target volume.Reference Mock, Bogner, Georg and Auberger 11 – Reference Schaffner and Pedroni 14 This technique used a combination of scatterers, range modulation wheels (RMWs), compensators and field-shaping apertures (comparison of surface doses). Scatterers spread the proton beam laterally. RMW added together Bragg peaks of different beam energies and weights to spread the stopping region of proton beam at depth.Reference Iqbal, Gillin, Summers, Dhanesar, Gifford and Buzdar 1 The aperture was positioned on the retractable snout and shaped the lateral edges of the beam. Compensators were placed at the end of the snout to conform the beam distally. An air gap of 8 cm was maintained between the snout and the water tank to reduce scattering. In this investigation, beam dosimetric data were obtained using a medium and large snouts. Medium and large snouts determined the treatment field sizes of 18 and 25 cm2, respectively. The isocentre was adjusted at the middle of the SOBPs. Beam data processing and management were performed by the MOSAIQ System from IMPAC Medical System. The schematic representation of double-scattering technique is given below.
Results
In PBT, an extensive QA program is required to validate the beam characteristics to confirm the functionality of the treatment delivery and patient safety system.Reference Newhauser 15 , 16 Constancy of the beam dose, range uniformity, width of SOBP, flatness and symmetry at any one angle (0 or 90 or 180 or 270 degree) and beam output dependence on gantry angle are among the essential dosimetric checks of the QA process.
The checks of QA program are given below for the beam energies 250, 225, 200, 180, 160, 140, 120 and 100 MeV at the gantry angles of 0, 90, 180 and 270 degrees using medium and large snouts for G1 scattering beam line (Figure 1).
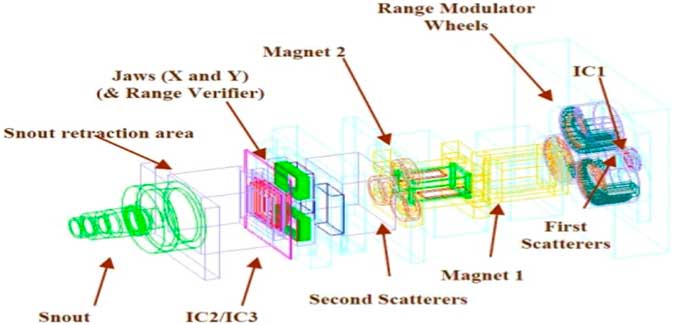
Figure 1 Representation of double-scattering technique for the creation of spread out Bragg peaks (SOBPs).
Range, centre modulation depth (CMD) and width of SOBP of proton beam are given in Figures 2a, 2b and 2c using medium and large snouts, respectively. The range of the proton beam in the medium or the water phantom depends upon the energy of the proton beam.Reference Nichiporov, Hsi and Farr 17 The ICRU Report 78 has defined the range as the depth along the beam central axis in water to the distal 90% point of the maximum dose value, and SOBP width as the distance in water between the distal and proximal 90% points of the maximum dose value. 16 , Reference Newhauser and Zhang 18 It varied from 4·3 to 28·5 cm for the beam energies ranging from 100 to 250 MeV when medium snout (18 × 18 cm) was used. The width of SOBP ranged from 4 to 10 cm both with medium and large snouts. The dose deposited by the proton beam was measured at the centre of SOBPs and corresponded to the CMD. This is documented in IAEA TRS 398 report. 19 For proton beam of nominal energy 250 MeV, with range of 28·5 cm in phantom using medium snout, 1 MU became equal to 1 cGy dose when determined at the CMD of 23·5 cm which is situated at the centre of 10 cm SOBP.
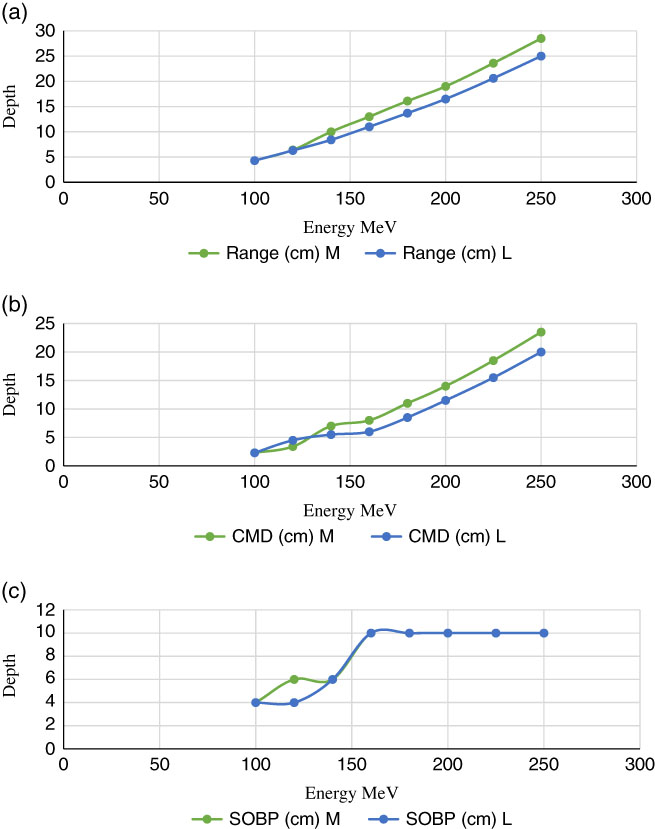
Figure 2 (a) Representation of the range of proton beam in the water phantom using medium (M) and large (L) snouts. (b) Representation of CMD of the proton beam in the water phantom using medium (M) and large (L) snouts. (c) Representation of SOBPs of the proton beam in the water phantom using medium (M) and large (L) snouts. Abbreviations: CMS, centre modulation depth; SOBPs, spread out Bragg peaks.
With the large snout (25 × 25 cm), the proton beam ranged from 4·3 to 25 cm for beam energies ranging from 100 to 250 MeV. CMD at which depth doses were determined varied from 2·3 to 20 cm. A dose of 1 cGy was measured at CMD of 20 cm with beam range of 25 cm at the centre of SOBP of 10 cm width using large snout. The range of the proton beam was smaller with large snout as compared to that with medium snout.
The uniformity of the proton beam dose distribution around the target volume was confirmed by determining the flatness and symmetry of the beam dose measured from the depth dose profile in both X and Y directions using medium and large snouts.
In this approach, IAEA TRS 398 dosimetry protocol was used. It defined the clinically acceptable limits of ±2·5% for both flatness and symmetry. As seen from the data in Table 1, all the values of flatness and symmetry remained within their limits recommended by the dosimetry protocol, with both medium and large snouts. The highest observed value of flatness was 1·99%, and it depicted more inhomogeneous dose distribution around the target volume but within the recommended limits.Reference Shamsi, Atiq, Atiq, Buzdar, Iqbal and Iqbal 20 Flatness is merely the ratio between the two doses and it can be varied by the size and shape of the phantom, which in this case, remained unchanged.Reference Hossain and Rhoades 21 Symmetry was not affected by the range of the proton beam inside the phantom.Reference Pathak, Mishra, Singh and Mishra 22
Table 1 Flatness and symmetry of dose distribution of proton beam at 0 degree gantry angle

In Table 2, symmetry and flatness of the proton beam at 90 gantry angle did not exceed the limits recommended by the dosimetry protocol. Flatness and symmetry ranged from 0·88% to 2·05% and 0·82% to 1·98%, respectively, with medium and large snout sizes. From these results, mean of flatness X and flatness Y was 1·30% and 1·41% with medium snout and 1·25% and 1·30% with large snout. Their mean values showed a much homogeneous dose distribution around the target site. Similarly, symmetry X and symmetry Y had mean values of 1·51% and 1·28% with medium snout and 1·31% and 1·42% with large snout. Snout sizes did not produce any variations in these values.
Table 2 Flatness and symmetry of dose distribution of proton beam at 90 degree gantry angle

At the gantry angle of 180 degree in Table 3, flatness and symmetry remained within the 2·5% specified limit for all beam energies. Flatness X and flatness Y mean values were 1·25% and 1·27%, respectively, and symmetry X and symmetry Y mean values were 0·87% and 1·14% with medium snout. For flatness X and Y the mean values were 1·18% and 1·01% with large snout. Mean of symmetry X and Y values was 1·46% and 1·30% with large snout size.
Table 3 Flatness and symmetry of dose distribution of proton beam at 180 degree gantry angle

For gantry angle of 270 degrees in Table 4, flatness (X and Y) varied from 0·76% to 1·92%. Symmetry (X and Y) values varied from 1·02% to 1·81%. All these values were found within tolerance limits for the given set of beam energies.
Table 4 Flatness and symmetry of dose distribution of proton beam at 270 degree gantry angle

This exploration was further extended to the analysis of output of the beam versus angle of the synchrotron’s gantry with medium and large snouts as shown in Table 5.
Table 5 Output dependency of proton beam Q (nC/pC) on gantry angle

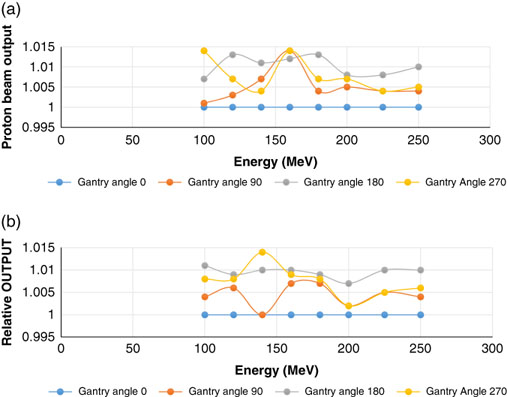
Table 5 represents the gantry output of a synchrotron at the pre-mentioned gantry angles and beam energies. Output was defined at the centre of SOBP with both medium and large snouts.Reference Henry, Robertson, Therriault-Proulx and Beddar 23 The output of proton beam was seen nearly the same for all the given beam energies. While determining output with medium snout, the discrepancy of 1·1% was observed between the maximum and minimum mean values of output for all the given set of energies. There occurred a difference of 0·9% between the maximum and minimum mean values of output with large snout. For all the given beam energies, mean output of the proton beam showed a deviation of 12%, 11·9%, 11·9% and 12·1% between medium and large snout at 0, 90, 180 and 270 degree angle, respectively. The highest observed difference in output between medium and large snout was approximately 27%.
Figure 3a reveals the gantry output at the angles 0, 90, 180 and 270 degrees relative to the gantry output at 0 degree angle. All the relative outputs at 90, 180 and 270 degree angles were found close to the gantry output at 0 degree angle. The maximum observed deviation was of 1·48% from the output at 0 degree angle.

Figure 3 (a) Representation of relative output to zero gantry angle output with medium snout. (b) Representation of relative output to zero gantry angle output with large snout.
Relative output to zero gantry angle output with large snout is given in Figure 3b. Beam output data at 0, 90, 180 and 270 degree angles was consistent to that at 0 degree angle with a negligible deviation of 1·4%.
Overall, a very consistent beam output data were observed at all the given angles, but negligible deviations were noticed owing to the fact that as protons go through the varying thickness of the scattering material, there occurs a slight deviation in the energy spectrum.Reference Zhao, Sun and Grantham 24
Discussion
From the dosimetric results of proton beams from G 1 scattering beam line, medium snout can provide the possibility for the treatment of target with depth ranging from 4·3 to 28·5 cm, for example, for prostate cancer. With the large snout, tumours lying in a depth of up to 25 cm can be treated with a maximum treatment field of 25 × 25 cm.Reference Zhao, Sun and Grantham 24
The quality of proton beam depends on the parameters like flatness and symmetry. The QA procedure in clinical practice of radiation treatment and the treatment results relies on the dosimetric parameters (flatness and symmetry) of treatment delivery. ICRU report 78 and TRS report 398 specified flatness ≤3% and symmetry ≤2%. The limits suggested by these reports and also presented in other published studies were also satisfied in this exploration. 16 , 19 , Reference Nath, Biggs and Bova 25 – Reference Klein, Hanley and Bayouth 28 All of the flatness and symmetry values, determined for both medium and large snouts in this investigation at all the given gantry angles, remained within the tolerance limits.
While acquiring dosimetric data for proton beams, the determination of output dependency on gantry angle is essential because of the presence of a fine wedge that cause the compensation for magnet shifting during gantry rotation.Reference Zhao, Sun and Grantham 24 It was noticed in this exploration that beam output at all the given beam angles and beam energies were approximately 12% higher with large snout as compared to that medium snout at SOBP centre.
Conclusion
Flatness and symmetry were found within limits with both medium and large snouts. The large snout produced higher beam output than that of medium snout at the centre of SOBP. This exploration can be extended to the determination of beam output, flatness and symmetry with a small snout.
Acknowledgements
Thanks to Higher Education Commission of Pakistan (HEC) for providing funds for the research visit to The University of Texas and to the M. D. Anderson Proton Therapy Center, Houston (PTC-H), The University of Texas for allowing this research visit.
Financial support
This research project did not receive any grant.
Conflicts of interest
None
Ethical standards
This article does not contain any studies with human participants or animals performed by any of the authors.
Informed consent
Not applicable in this exploration.