INTRODUCTION
Peatlands, marshlands, and oxbow lakes located at a farther distance from the archeological sites are generally considered background sites in geoarcheological investigations. Primarily, these sites preserve records of the natural evolution of the landscape. Nevertheless, potential signs of human activities are recorded as well. Besides natural succession, understanding the nature and driving mechanisms of climate- and human-induced changes preserved in these records is gaining importance in conservation measures not only in Hungary but around the world as well. To achieve these goals, the establishment of a firm, independent chronology is needed. Marshlands, peatlands, and lakes preserve organic and/or carbonate samples suitable for radiocarbon accelerator mass spectrometry (14C AMS) dating and the construction of such chronological models. However, besides those of instrumental measurements, uncertainties related to fluctuations of the 14C curve used in calibration of conventional 14C ages to calendar dates can yield sometimes significantly different chronologies (Bronk Ramsey Reference Bronk Ramsey2009; Reimer et al. Reference Reimer, Bard, Bayliss, Beck, Blackwell, Bronk Ramsey, Buck, Cheng, Edwards, Friedrich, Grootes, Guil- derson, Haflidason, Hajdas, Hatté, Heaton, Hoffmann, Hogg, Hughen, Kaiser, Kromer, Manning, Niu, Reimer, Richards, Scott, Southon, Staff, CSM and van der Plicht2013). Relying on various statistical and probabilistic approaches, choosing the right age-depth model is crucial regarding the reliability of chronological paleoenvironmental reconstructions (Bronk Ramsey Reference Bronk Ramsey2009; Reimer et al. Reference Reimer, Bard, Bayliss, Beck, Blackwell, Bronk Ramsey, Buck, Cheng, Edwards, Friedrich, Grootes, Guil- derson, Haflidason, Hajdas, Hatté, Heaton, Hoffmann, Hogg, Hughen, Kaiser, Kromer, Manning, Niu, Reimer, Richards, Scott, Southon, Staff, CSM and van der Plicht2013). However, choosing the best model is not always straightforward, especially when we need good point estimates (Michczyński Reference Michczyński2007; Walanus Reference Walanus2008). So, comparison of different age-depth models and consideration of the background mathematics and priors is important, as seen in recent works of Blaauw et al. (Reference Blaau, Christen, Benett and Reimer2018). In this paper, in addition to newly gained 14C dates, several age-depth models relying on various probabilistic approaches are presented from a marshland sequence from the southern part of the Danube-Tisza Interfluve. The congruency of each model and calculated accumulation rates are tested to find the best chronology. After choosing the best chronology, multiproxy (sedimentological, geochemical, palynological, mollusk) paleoenvironmental data are presented along a timeline starting from the Late Glacial, helping us to outline the evolutionary history of the referred marshland and signs of climate- and human-induced changes.
STUDY AREA LOCATION, GEOLOGY, GEOMORPHOLOGY, CLIMATE, AND VEGETATION
The study site is located near the village of Császártöltés at the eastern margin of the Holocene Danubian floodplain. The marshland occupies an oxbow lake basin corresponding to one of the numerous Pleistocene branches of the Danube River (Figure 1). Since the Early Pleistocene the Danube had been traversing the area of the Danube-Tisza Interfluve building extensive alluvial fans (Sümeghy Reference Sümeghy1944, Reference Sümeghy1953, Reference Sümeghy1955; Miháltz Reference Miháltz1953; Molnár Reference Molnár2015). Starting out near Budapest the river charged into the Tisza River at Szeged, SE Hungary. Besides a natural westward avulsion, because of rejuvenating neotectonics activity near the cities of Kalocsa and Baja ca. 40 ka the Danube incised into its alluvium reaching its modern N–S course (Sümeghy Reference Sümeghy1944, Reference Sümeghy1953, Reference Sümeghy1955; Miháltz Reference Miháltz1953; Molnár Reference Molnár2015). This process displaced the former riverbed to a lower elevation of ca. 100 m ASL allowing for the development of a broad floodplain studded with numerous branches and oxbow lakes. One of these former oxbow lakes hosts our studied marshland. As hydrological connections were preserved with the modern river even after the cut-off, sufficient water supply through strictly the groundwater allowed for the maintenance of a marshland ecosystem. The adjacent loess and sand covered alluvial fan, found ca. 20–40 m above the modern floodplain, was turned into dry high bluffs. Today the Danubian floodplain is covered by fluvisols, while the adjacent high bluffs host chernozems and andosols. The climate of the area is continental with strong Sub-Mediterranean influences. The average annual temperature is 10°C. The annual precipitation varies between 500 and 600 mm (Borhidi Reference Borhidi1961, Reference Borhidi1993).
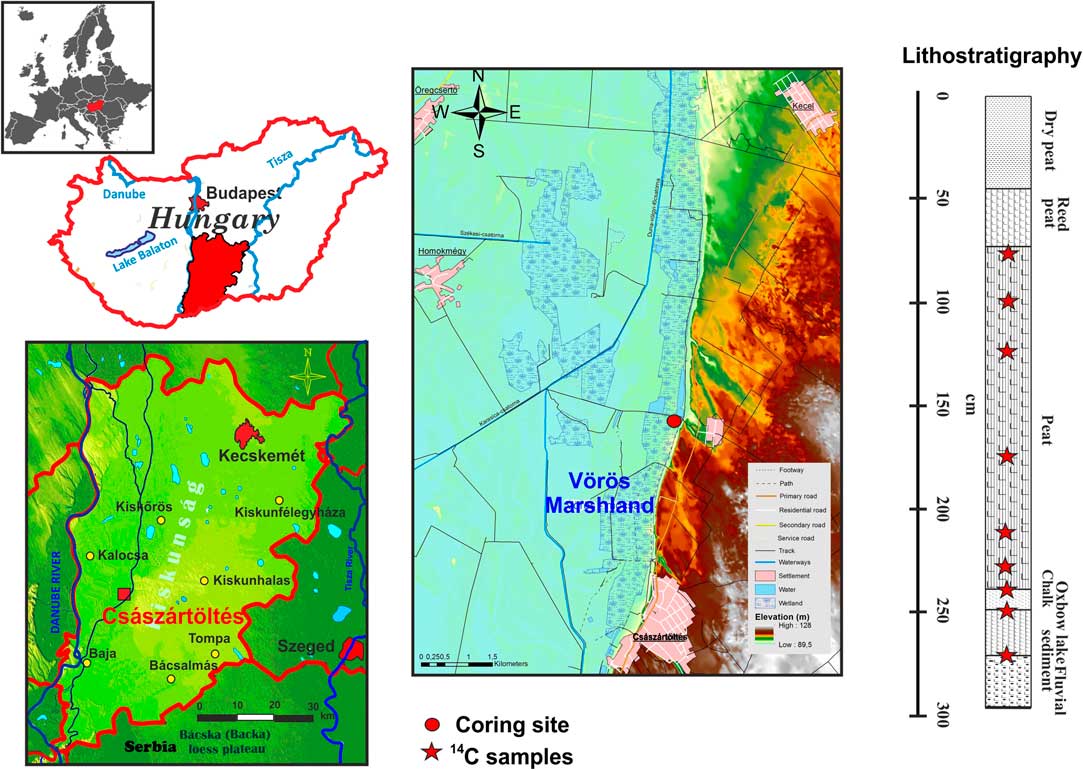
Figure 1 Location, geology, geomorphology of the study site with sampling points for 14C analysis.
The natural vegetation of the sand dunes and loess covered high-bluff is made up of Junipero-Populetum scrub and sandy grasslands formed by Bromus squarrosus, Secale sylvestre, Stipa borystenica, and Festuca vaginata. Well-drained areas are occupied by oak forests (Iridi variegatae-Quercetum roboris, Polygonato latifolii-Quercetum roboris). Recently, most of the area is a cultural landscape with plowlands and vineyards. The natural vegetation is preserved only at certain spots. The floodplain hosts marshlands with patches of Fraxino pannonicae-Alnetum forests (Tóth Reference Tóth1979, Reference Tóth1996; Pócs Reference Pócs1991; Rakonczay Reference Rakonczay2001 ; Borhidi Reference Borhidi2003).
MATERIAL AND METHODS
Sampling
Because of peat mining in the study site that lasted for more than a hundred years (Molnár Reference Molnár2015) there are only a few sites where intact peat layers occur. Two sites were chosen for potential sampling based on the presence of a continuous record from the sandy fluvial bedrock all the way to the topmost altered peat layers not subjected to mining. Two overlapping cores of 270 cm length were extracted conforming to the general practice in Quaternary paleoenvironmental studies (Aaby and Digerfeldt Reference Aaby and Digerfeldt1986) using a 5 cm-diameter Russian-type corer. After transportation to the laboratory, the cores were cut in half lengthwise. Sections for paleobotanical, geochemical, sedimentological analyses were stored at 4°C in accordance with the international standards. The cores were subsampled for further analysis at 2- and 1-cm intervals.
Lithostratigraphy, LOI and Trace and Major Element Analysis
The main lithostratigraphic features of the sedimentary sequence were determined and described using the internationally accepted system Troels-Smith (Reference Troels-Smith1955), developed for unconsolidated sediments. To determine the organic, carbonate and inorganic content samples were subjected LOI (loss-on-ignition) following the method presented by Dean (Reference Dean1974). Concentration of selected major and trace elements carrying information on erosion-induced soil in wash (Na, K), carbonate sources (Ca, Mg), as well as oxygen content (Mn) and pH (Fe) of the waterbody (Richardson et al. Reference Richardson, Aguilar and Nealson1988; Langlet et al. Reference Langlet, Alleman, Plisnier, Hughes and André2006, Reference Langlet, Alleman, Plisnier, Hughes and André2007; Lazareth et al. Reference Lazareth, Vander Putten, André and Dehairs2003; Gulyás et al. Reference Gulyás and Sümegi2011a, Reference Gulyás and Sümegi2011b; Gulyás and Sümegi Reference Gulyás and Sümegi2012a, Reference Gulyás and Sümegi2012b) was determined using water soluble extracts. Samples were analyzed by a Perkin-Elmer AAS spectrometer. Concentrations are reported as parts per million (ppm).
14 C Dating
Eight peat and one reed samples were selected for 14C analysis between the depths of 80 and 260 cm, as the uppermost 80 cm represented dried-out altered peat. AMS 14C dating was performed in the Hertelendi Laboratory of Environmental Studies in the Institute for Nuclear Research of the Hungarian Academy of Sciences in Debrecen (Hungary). Some of these measurements were carried out within the lab of ETH Zürich as part of a collaboration program (Arno-Synal Reference Arno-Synal2016). From the bottom of the sequence (206 cm) a single terrestrial gastropod was also submitted for AMS dating to the Radiocarbon Lab at Gliwice (Czernik and Goslar 2007) (Table 1). Certain herbivorous gastropods are known to yield reliable ages for dating deposits of the past 40 ka with minimal estimates of shell age offsets on the scale of perhaps a couple of decades This enables the construction of age models with resolution on the sub-centennial scale. (Sümegi and Hertelendi Reference Sümegi and Hertelendi1998; Pigati et al. Reference Pigati, Quade, Shanahan and Haynes2004, Reference Pigati, Rech and Nekola2010, Reference Pigati, McGeehin, Muhs and Bettis2013; Xu et al. Reference Xu, Gu, Han, Hao, Lu, Wang, Wu and Peng2011; Újvári et al. Reference Újvári, Molnár, Novothny, Páll-Gergely, Kovács and Várhegyi2014). Based on Hungarian studies by Sümegi and Hertelendi (Reference Sümegi and Hertelendi1998) and Újvári et al. (Reference Újvári, Molnár, Novothny, Páll-Gergely, Kovács and Várhegyi2014), the sampled taxon was chosen accordingly. The preparation of the samples and the actual steps of the measurement followed Hertelendi et al. (Reference Hertelendi, Csongor, Záborszky, Molnár, Gál, Győrffi and Nagy1989, Reference Hertelendi, Sümegi and Szöőr1992) and Molnár et al. (Reference Molnár, Janovics, Major, Orsovszki, Gönczi, Veres, Leonard, Castle, Lange, Wacker, Hajdas and Jull2013). Conventional 14C ages were converted to calendar ages using the software OxCal 4.2 online (Bronk Ramsey Reference Bronk Ramsey2009) and the most recent IntCal13 calibration curve (Reimer et al. Reference Reimer, Bard, Bayliss, Beck, Blackwell, Bronk Ramsey, Buck, Cheng, Edwards, Friedrich, Grootes, Guil- derson, Haflidason, Hajdas, Hatté, Heaton, Hoffmann, Hogg, Hughen, Kaiser, Kromer, Manning, Niu, Reimer, Richards, Scott, Southon, Staff, CSM and van der Plicht2013). Calibrated ages are reported as age ranges at the 2-sigma confidence level (95.4%).
Table 1 List of AMS dated samples by depth, material type as well as conventional 14C ages.

Age-Depth Modeling
Four types of age-depth models have been applied for our dataset. The first is the popular classical model of linear interpolation (Blaauw Reference Blaauw2010), which assumes that accumulation rates were constant between neighboring dated depths and changed, potentially abruptly, exactly at the dated depths (Bennett Reference Bennett1994; Blaauw and Heegaard Reference Blaauw and Heegaard2012). Then a classical polynomial model was also applied. In this case 95% confidence intervals were calculated via Monte Carlo simulation of 10,000 iterations. Finally, we tested two Bayesian models that use gamma and Poisson distributions as prior information.
Bacon (Blaauw and Christen Reference Blaauw and Christen2011) models the accumulation rates of many equally spaced depth sections based on an autoregressive process with gamma innovations (here set at mean 40–80 and shapes 0.5–1.5 to allow for many accumulation rates, memory strength was 4 with a memory mean of 0.7, section thickness was set to 20, 10, 5, 2, 1, respectively in several runs). Based on the observed major lithostratigraphic boundaries between different oxbow lake sediments at 245 and between oxbow lake sediments and overlying peat at 230 cm, boundary conditions were also added into this model.
OxCal’s P_sequence (Bronk Ramsey Reference Bronk Ramsey2009) was also tried with the granularity set to the size of the most dominant grain in the sequence (silt) (k=0.3). Here two sub models were run. One without an inner boundary and one where a stratigraphic boundary has been introduced at 230 cm similarly to the previous Bayesian gamma sequence model. Ages were calculated for 1-cm intervals along with 95% CI to assess uncertainty. Point estimates are based on the mean values. The received ages of the different models were evaluated for integrity and congruence as well as statistically significant differences using the non-parametric methods of pairwise Mann-Whitney U test for equality of medians and the Kolmogorov-Smirnov test for equality of distributions (Sokal and Rohlf Reference Sokal and Rohlf1995). Mean 95% confidence ranges and maximum and minimum confidence values have also been calculated and compared to assess similarities and differences in uncertainty of ages for different parts of the profile. Sedimentation rates (mm/year) with 95% confidence ranges have been calculated and compared for all age-depth models.
Paleoecological Analyses of Pollen Grains and Mollusk Fauna
Samples of 1-cm3 wet sediment for pollen analysis were processed at 4-cm intervals in the pollen laboratory of the Department of Geology and Paleontology at University Szeged using standard HF methods. Lycopodium spore tablets of known volume were added to each sample (Stockmarr Reference Stockmarr1971) to work out pollen concentrations. Pollen and spores were identified and counted under a light microscope at 400–1000× magnification. According to Magyari et al. (Reference Magyari, Chapman, Passmore, Allen, Huntley and Huntley2010), a minimum 500 pollen grains were counted. For the identification of pollen and spores the reference database at the Department of Geology and Paleontology, University of Szeged and pollen atlases and keys were used (Moore et al. Reference Moore, Webb and Collinson1991; Reille Reference Reille1992, Reference Reille1995, Reference Reille1998). The point-count method of Clark (Reference Clark1982) was applied to determine microcharcoal concentrations. Percentages of terrestrial pollen taxa, excluding Cyperaceae, were calculated using the sum of all those taxa. Percentages of Cyperaceae, aquatics, and pteridophyte spores were calculated relative to the main sum plus the relevant sum for each taxon or taxon group. Works of Behre (Reference Behre1981, Reference Behre1988) regarding human impact were adopted in interpretation as these considers the appearance of weeds that spread because of human effect in addition to cultivated cereals for identifying human impact on the landscape (Jones Reference Jones1992).
Mollusk shells were collected from 2 to 4 cm thick subsamples taken at regular intervals throughout the core. The aquatic malacofauna was divided into three ecological groups following the classifications of Boycott (Reference Boycott1934), Sparks (Reference Sparks1961), Ložek (Reference Ložek1964), and Krolopp and Sümegi (Reference Krolopp and Sümegi1995): (1) moving-water habitat preferring species (rheophilous species), (2) universal species demanding steady water inundation and tolerating organic-rich waters (catholic), and (3) species tolerant to periodic water supply (slum group). These ecological types in addition to the ratio of aquatic/terrestrial gastropods carry information on inundation events and changes in habitat types. Terrestrial gastropods were grouped considering their temperature preference (warmth-loving and cold-resistant), humidity preference (waterbank, humidity loving (hygrophilous); humidity tolerant (mesophilous); drought tolerant (xerophilous) as well as habitat type (grassland, open parkland, woodland elements) (Krolopp Reference Krolopp1973, Reference Krolopp1983; Lozek Reference Ložek1964; Sparks Reference Sparks1961). Dominance values (relative percentages) of these ecotypes thus carry information on habitat types, temperature and humidity.
RESULTS
14C Analysis and Age-Depth Models
Conventional 14C ages for the studied depth intervals and material type are presented in Table 1. Four age-depth models have been constructed. Table 2 depicts ages produced by simple calibration and gained via P_Sequence models.
Table 2 List of calibrated unmodeled and modeled ages for two types of P_Sequence models.

Based on simple calibration of 14C dates sediment accumulation must have started between 12,060 and 11,640 cal BC and have come to an end between 1030 and 1260 AD. Similar age ranges were gained in P_Sequence models without and with stratigraphic boundaries. However, both models have confined better the initial age ranges resulting in a slight reduction of uncertainties compared to simple calibration. When results of P_Sequence models are compared (Table 2) the model, where a stratigraphic boundary was introduced at the start of peat formation yielded dates with somewhat lower uncertainty at certain depths compared to the one without this inner boundary. However, difference between the two P_Sequence models is negligible.
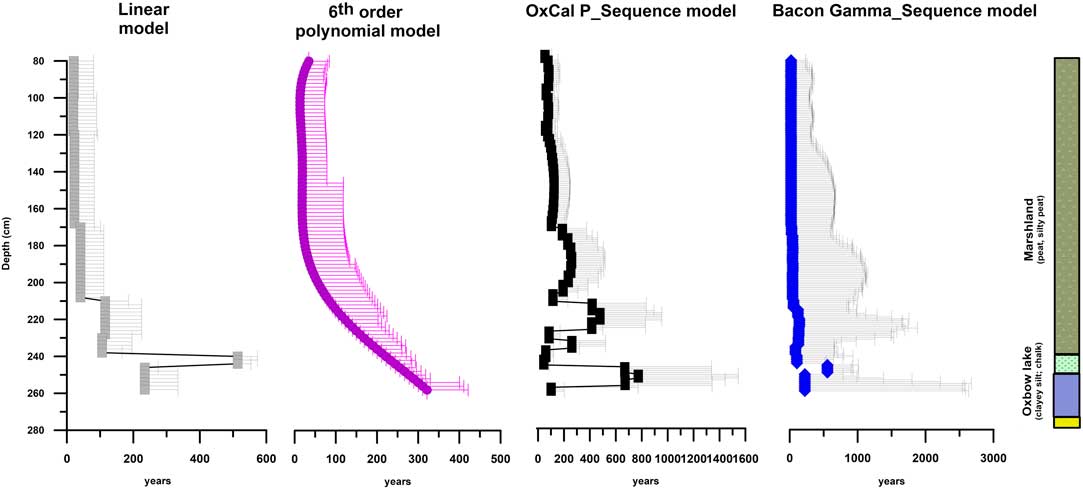
Figure 2 presents the results of the linear fit, polynomial, Gamma_Sequence, Poisson_Sequence models with their 95% confidence ranges (Table S1). All three models display a similar trend with upward decreasing uncertainty. There is no significant difference between the point estimate ages of the individual models (see Table S2). However, 95% confidence ranges are different. The highest 95% confidence range of 751 yr with a minimum of 215 yr at 80-cm depth and a maximum of 2652 yr at 258-cm depths are observed for the Gamma_Sequence model. Yet the prior on accumulation rates (acc. shape:0.5, acc. mean:40 year/cm) is very close to the posterior accumulation rate received by the model. The higher (0.5) memory values indicate a relatively smooth sediment accumulation, which is congruent with our understanding of peat accumulation. These values were set after numerous runs of the model with different settings. So, in this sense, despite the wider confidence intervals, the Gamma_Sequence model seems acceptable. The lowermost uncertainties are restricted to the upper 200 m of the sequence similarly to the other models too. The narrowest range of 95% CI is observed for other three models rendering them seemingly better suited for age-depth model construction than the Gamma_Sequence model at first sight. The 6th order polynomial and linear fit models seems to have the narrowest 95% CI ranges. The P_Sequence model has also very narrow 95% CI ranges close to those of the linear and polynomial models. Point estimate age values however are not significantly different as stated previously. Based on this information any models would be suitable for calculation of sedimentation rates and building an age-depth model for proxies.
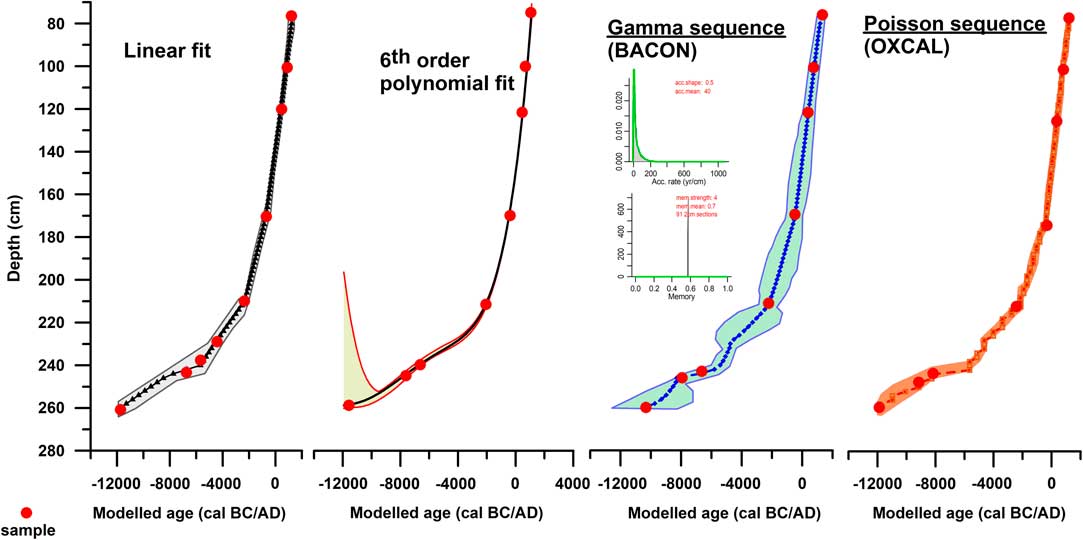
Figure 2 Comparison of constructed age-depth models relying on probabilistic approaches. Model 1: simple calibration, linear fit, Model 2: simple calibration 8th order polynomial fit, Model 3: Bayesian modeling using Gamma_distribution approach of Bacon, Model 4: Bayesian models using Poisson_distribution approach of OxCal (horizontal bars represent 95% CI ranges).
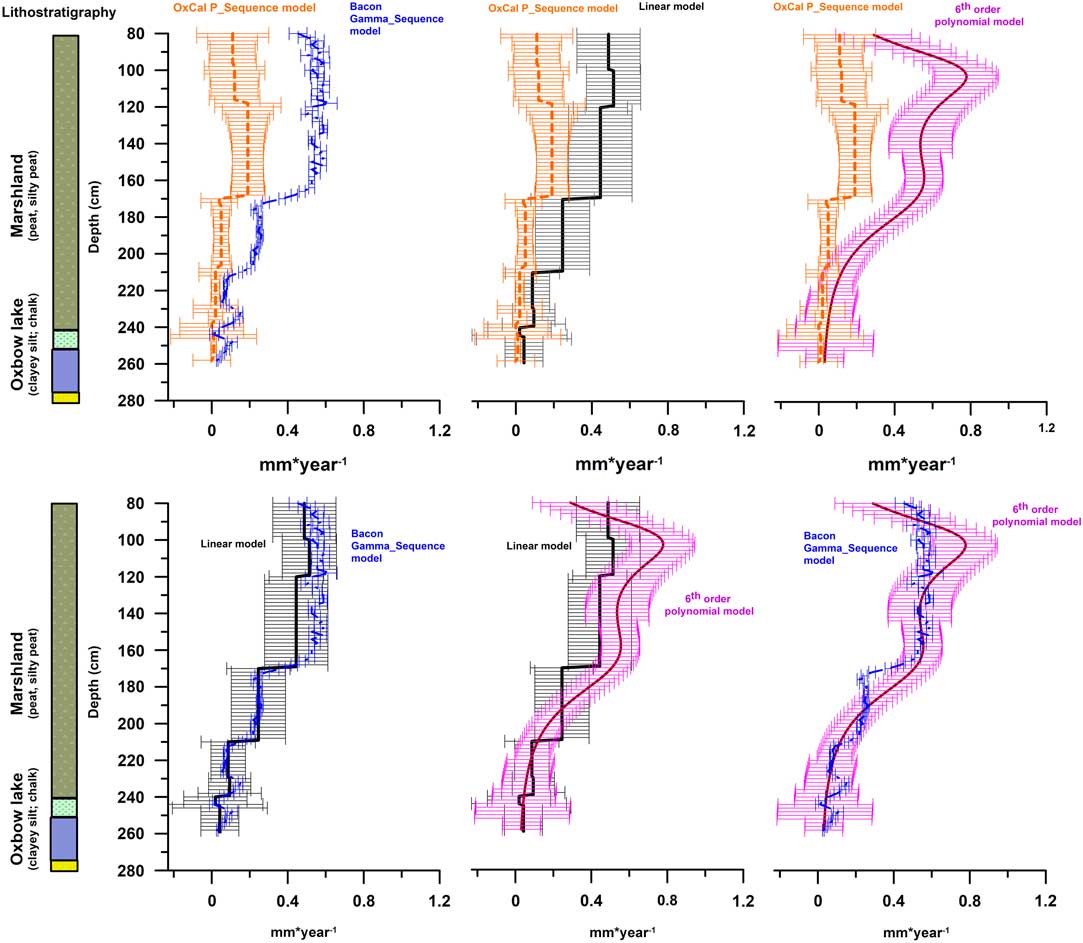
The picture is somewhat different when we compare variation of sedimentation rates calculated using the different models (Figure 3).

Figure 3 Comparison of calculated sedimentation rates using different age-depth models for the marshland sequence (horizontal bars represent 95% CI ranges).
There is a significantly upward increasing trend in accumulation rates according to all constructed age-depth models (Mann-Kendall test p: 0.785) with the highest rates observed in the uppermost ca. 40 cm of the profile corresponding to the Roman Age, Migration Age, and Early Middle Ages. However, there is a significant difference in the distribution of the calculated mean sedimentation rates of certain age-depth models (Kruskal-Wallis p: 3.88E-43; Table S3). The P_Sequence model significantly underestimates the sedimentation rates compared to other models (Table S3). The 95% confidence intervals of all models are relatively wide with the lowest ranges restricted to the middle of the profile. An exception is the Gamma_Sequence model because it considers the a-priori given accumulation rates, which are well fitted to the posterior ones (Figure 2). So, despite the relatively wide 95% confidence interval ranges of calibrated ages yielded by the model (Figure 2) compared to the others, the best confined sedimentation rates are observable here, which would lead us to choose this age-depth model for proxies too. Mean SR values of the Gamma_Sequence model are significantly different from both the linear and the P_Sequence models (Table S3). However, there is no significant difference between the mean SR values of this and the polynomial model. Their mean values and 95% confidence ranges are clearly overlapping. SR rates, however, are much more smoothed due to the nature of the polynomial model. In contrast, SR rates seem to show minor variations on the Gamma_Sequence model. From a sedimentological point of view choosing the Gamma_Sequence model and/or the polynomial model seems to be the best. When we look at the temporal resolution of the different models per sampling interval (years/cm) (Figure 4) the upper 100 cm of the dated part provides a centennial resolution for the cycle analysis of our proxy data when 95% CI are considered as well. Mean values here offer a resolution at the sub-centennial scale of 40–60 yr. In the oxbow lake sequence and the initial phase of peat accumulation the sampling resolution corresponds to multi-centennial age variations.

Figure 4 Comparison of temporal resolution of 1-cm sampling intervals for the different age-depth models.
Lithology, Geochemistry, Sedimentation Rates
The bedrock (280–275 cm) is made up of very fine sandy fine sands (Ga4) of white-grey color (10 YR 1/7) (Munsell and Notation Reference Munsell and Notation1954) representing the deposits of the original river branch preceding the emergence of an oxbow lake. Based on the available 14C dates from the depth of 260 cm this fluvial stage must have emerged during the Late Glacial phase of the last ice age (before 12,000 BC). The first datable geological series is made up of greyish-white (10 YR 1/8) clayey chalk and coarse silts and silty clays (Lc2As2). These layers contain abundant Chara remains and mollusk shells representing the deposits of an oligotrophic well-lit oxbow lake (Figure 5).
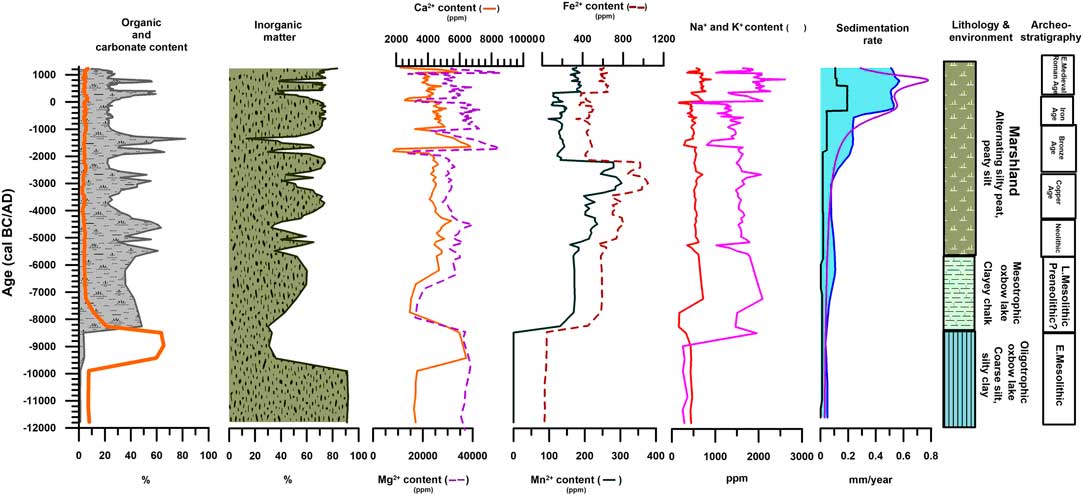
Figure 5 Observed sedimentological, geochemical changes indicating various stages of marshland evolution in light of known archeostratigraphy.
This lake phase lasted from 12,000 to 8400 cal BC corresponding to the Early Mesolithic. Sediment accumulation rates were minimal during this stage with a clear dominance of inorganic matter, minimal signs of erosion of the adjacent areas as seen in the low Na, K values, a relatively high and stable Mg content and upward increasing Ca and carbonate content. The peak carbonate and Ca values accompanied by a significant drop in the inorganics between 9500 and 8600 BC indicate the emergence of a shallow carbonate rich oxbow lake. As seen by the low Mn and Fe levels primary production was negligible and the dissolved oxygen of the water was high with relatively normal pH. There is a marked increase in the organics accompanied by a major drop in the Ca, Mg and carbonate values in the next stage corresponding to the Late Mesolithic between ca. 8400 and 6000 cal BC. The concentration of inorganics is gradually increasing towards the 7th century BC reaching a stable plateau followed by minor fluctuations upwards in the profile. Although accumulation rates are lower compared to the previous period, a significant rise in the K as well as the Mn, Fe values indicate a strong drop in the dissolved oxygen levels, pH as well as the expansion of K rich littoral vegetation marking the development of a mesotrophic lake, which gradually evolved into a eutrophic system (Figure 5). From about 6000 cal BC (Early Neolithic), there is a marked change the accumulating deposits with the appearance of alternating layers of peat silty peat and peaty silts representing natural cycles of a marshland. Between 5600 and 4500 cal BC corresponding to the Middle and Late Neolithic there are cyclical ca. 20% increases and drops in the organic content with similar contrasting fluctuations of the inorganics. These may signal human/and or climate induced changes. As this period represents the appearance of farming cultures these fluctuations may indicate deforestation induced nutrient in wash into the marshland. However, as the three peaks in organics clearly correlate with increases in Ca and Mg concentrations with minimal carbonate content of the deposits another source of organic matter can be assumed. Expansion of reed and sedge rich in Ca, Mg implying a shallowing of the open water marshland could be blamed as well. There are further increases in the Mn and Fe content of these marshland deposits compared to the previous lacustrine phase indicating a gradual increase in the pH and a reduction of dissolved oxygen, increase in primary production.
Besides the Neolithic, other major cyclical rises in the organic matter are connected to Copper Age and Bronze Age cultures with multiple peaks, which again may hint to human induced changes. The gradual upward increase in the Mn and Fe content until the Late Copper and Early Bronze Ages (2500–2300 cal BC) indicates a further increase in pH and primary production accompanied by decreasing dissolved oxygen levels. From the opening of the Bronze Age there is a twofold increase in accumulation rates to 0.3 mm/year coevally with the marked drop in Mn, Fe concentration as well as marked fluctuations of the Ca, Mg, levels. Organic peaks between 2000 and 1000 cal BC correlate well with the highest Ca and Mg concentrations in the entire sequence implying again a natural source of Ca, Mg from reed and sedge vegetation. This is also justified by the appearance of reed peat in this part of the profile. The periods of the Bronze Age, Iron Age, Roman Age (2500 BC–475 AD) are all characterized by somewhat lower pH and primary production values comparable to those recorded during the L. Mesolithic. The next major ca. twofold increase in sediment accumulation around 800 cal BC must indicate the activities of Iron Age communities. The rising trend in Fe and Mn as well as the peak values of K, Na plus a clear dominance of inorganics also indicate a silting up of the marshland basin, which might be attributed to deforestation induced erosion of the settling communities. The Early Medieval period marks the final stage of marshland evolution.
Multiproxy Paleoecological Results
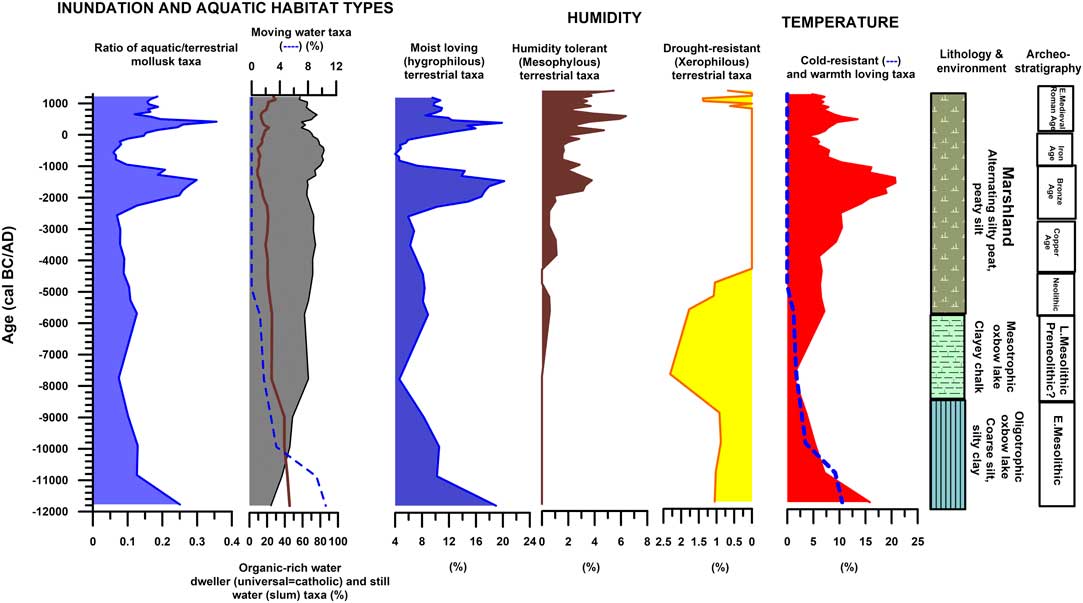
The ratio of aquatic/terrestrial mollusk was uniformly low throughout the entire sequence apart from 3 major peaks at 11,800 cal BC, 1600 cal BC, 500 cal AD (Figure 6). Another small peak at 5800 cal BC also turns up. Abundance variations of hygrophilous terrestrial taxa clearly follow those of aquatics with peaks located at the same intervals. These coevally noticed peaks may signal periods of high stand an increased humidity. The lowermost peak clearly represents the initial phase of lake development. This period is characterized by a high abundance of moving-water mollusk taxa and collective abundance peaks of warmth-loving and cold-resistant elements (Figure 5). The small peak at 5800 cal BC is correlated with the flood events reconstructed for the Tisza Basin (Sümegi Reference Sümegi2003, Reference Sümegi2007; Magny et al. Reference Magny, de Beaulieu, Drescher-Schneider, Vannière, WalterSimonnet, Millet, Bossuet and Peyron2006; Sümegi and Molnár Reference Sümegi and Molnár2007; Gulyás and Sümegi Reference Gulyás and Sümegi2012a, Reference Gulyás and Sümegi2012b) for the period of the Early Neolithic leading to the transformation of the Körös Culture as well. This event is correlated with the 5b IRD event generally characterized by increased oceanic influences, higher precipitation rates and lake high stands in Western Europe and Western Hungary (Magny et al. Reference Magny, de Beaulieu, Drescher-Schneider, Vannière, WalterSimonnet, Millet, Bossuet and Peyron2006; Gulyás and Sümegi Reference Gulyás and Sümegi2011a, Reference Gulyás and Sümegi2011b, Reference Gulyás and Sümegi2012a, Reference Gulyás and Sümegi2012b). The next peak at 1600 cal BC correlates well with other paleoecological records implying a humid Middle Bronze Age in Hungary (Sümegi et al. 2012). The final peak at cal 500 AD hallmarks another wet climatic phase known as the Late Antique Little Ice Age (Büntgen et al. Reference Büntgen, Myglan, Lyungquvist, McCormick, Cosmo, Sigl, Jungclaus, Wagner, Krusic, Esper, Kaplan, de Vaan, Luterbacher, Wacker, Tegel and Kirdyanov2016). There must have been an upward gradual increase in the temperature of the area from the all-time low at 7600 cal BC to its peak at 1600 cal BC, corresponding to a humid Middle Bronze Age. The other major peak in temperature is dated to the period of the Roman Climatic Optimum (Wang et al. Reference Wang, Surge and Walker2013; Büntgen et al. Reference Büntgen, Myglan, Lyungquvist, McCormick, Cosmo, Sigl, Jungclaus, Wagner, Krusic, Esper, Kaplan, de Vaan, Luterbacher, Wacker, Tegel and Kirdyanov2016). Similar conditions have been documented for Western Hungary as well for the same period (Sümegi et al. Reference Sümegi, Törőcsik, Jakab, Gulyás, Pomázi, Majkut, Páll, Persaits and Bodor2009; Sümegi et al. 2012).

Figure 6 Abundance variations of selected ecological groups of aquatic and terrestrial mollusks acting as proxies of temperature, humidity changes in the vicinity of the site in addition to fluctuations of aquatic habitat types.
In terms of the vegetation (Figure 7) there is a clear dominance of woodlands from 12,000 to 6000 BC corresponding to the periods of the lake phases. The number of weeds was minimal indicating no or minimal human influence on the landscape. There is a slight decrease in the arboreal vegetation during the first phase of the Late Neolithic accompanied by a drop in weeds and rise in non-arboreal vegetation, which may signal slight forest clearance of Mesolithic hunters for the creation of hunting paths. The first major transition is connected to the appearance of the first farmers at 5800 cal BC. Increased pressure on the landscape from human activities is clearly seen in a rapid rise of weeds, the appearance of cereals and reduction of the arboreal vegetation (Figure 7). This remained constant through the remaining periods with minor fluctuations present only in the individual proxy values. There are two peaks in cereal concentrations, which are also all-time highs in the profile, dated to the Roman Age and the early periods of the Hungarian Kingdom. These are both accompanied by cyclical rises in weed abundances. A different type of land use primarily relying on free-range animal husbandry instead of plant cultivation characterizes the intervening period of the Migration Age. This is also seen in our records leading to the expansion of arboreal vegetation, reduction of non-arboreals, cereals and weeds, implying a regeneration of arboreal vegetation in the forest steppe ecotone surrounding the marshland (Sümegi et al. Reference Sümegi, Persaits and Gulyás2012).
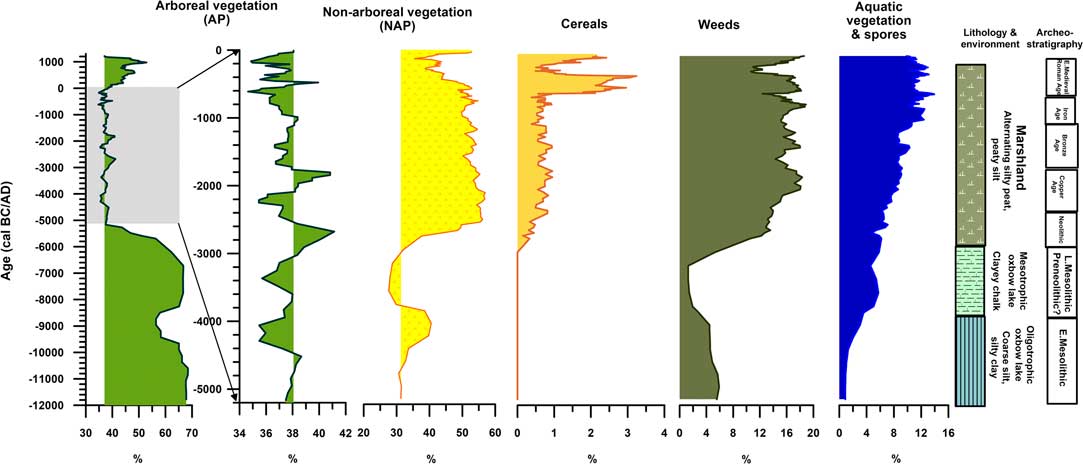
Figure 7 Abundance variations of sums of selected pollen types reflecting changes in the arboreal, non-arboreal vegetation, aquatic habitats as well as human activities (cereals, weeds).
CONCLUDING REMARKS
In our work the adoption of 14C analysis and the comparison of various age-depth models built using statistical and probabilistic approaches enabled the construction of a reliable chronology suitable for tackling climate- and/or human-induced changes in a marshland sequence from southern Hungary. All four models yielded reliable ages; the polynomial, linear as well as the P_Sequence models had the narrowest 95% CI ranges. The Gamma_Sequence model yielded relatively wide 95% CI ranges but in the upper 1 m of the profile confidence intervals were comparable to those of other models. From a sedimentological point of view the Gamma_Sequence model of Bacon seemed to be the best as both the prior and posterior accumulation rates are similar. This prior is not included in other models. Our geological record provided multiproxy data spanning ca. 13 kyr. Numerous changes observed in our records could have been correlated clearly with the appearance and activities of certain cultural groups indicating human-induced alterations of the landscape. In several cases climate-driven changes could have been identified as well, which were all correlable with globally observed records. Timing of these changes at the centennial or even sub-centennial scale requires precise chronologies, which could be established only via reducing uncertainties in dating and calibration as much as possible. This can only be achieved via the construction and quantitative comparison of various age-depth models using probabilistic approaches such as those in our work. The newly established chronology will enable tackling the presence of natural cycles in our record in the future.
ACKNOWLEDGMENTS
The research was supported by the European Union and the State of Hungary, co-financed by the European Regional Development Fund in the project of GINOP-2.3.2-15-2016-00009 “ICER” and OTKA Grant 109510.
Supplementary material
To view supplementary material for this article, please visit https://doi.org/10.1017/RDC.2018.112