Introduction
Many scholars, such as Benyus (Reference Benyus1998), Chakrabarti et al. (Reference Chakrabarti, Sarkar, Leelavathamma and Nataraju2005), Vincent et al. (Reference Vincent, Bogatyreva, Bogatyrev, Bowyer and Pahl2006), Chakrabarti and Shu (Reference Chakrabarti and Shu2010), Sartori et al. (Reference Sartori, Pal and Chakrabarti2010), Vattam et al. (Reference Vattam, Helms and Goel2010), Pawlyn (Reference Pawlyn2011), and Pedersen Zari (Reference Pedersen Zari2015), have interpreted bio-inspired thinking and production using different perspectives. Further, many researchers have long debated the immense potential of bio-inspired (or biomimetic) design. In addition, in the field of architecture, many buildings have been constructed based on the bio-inspired point of view. Today, architecture, particularly bio-inspired design, emphasizes design that rather than merely imitating, is based on the functions of the natural environment.
Natural functions can be mathematically analyzed and expressed using computer algorithms. Some of the popular bio-inspired algorithms are swarm intelligence algorithms and genetic algorithms (GAs), and these algorithms are used in the field of architecture to solve various problems. For example, Rajan (Reference Rajan1995), Chatzi and Koumousis (Reference Chatzi and Koumousis2009), van Embden Andres et al. (Reference van Embden Andres, Turrin and von Buelow2011), and Hofmeyer and Davila Delgado (Reference Hofmeyer and Davila Delgado2015) used GAs for structural optimization. Further, the GA was used by Jo and Gero (Reference Jo and Gero2006), Rawat et al. (Reference Rawat, Shahani, Natu, Badami and Hingorani2012), and Su and Yan (Reference Su and Yan2015) in space planning; Wang et al. (Reference Wang, Zmeureanu and Rivard2005), Attia et al. (Reference Attia, Gratia, De Herde and Hensen2012), and Agirbas (Reference Agirbas2018) in green building design; and Mukerjee et al. (Reference Mukerjee, Agrawal, Tiwari and Hasan1997) in shape studies. Fourie and Groenwold (Reference Fourie and Groenwold2002) and Felkner et al. (Reference Felkner, Chatzi and Kotnik2013) are among the researchers who used particle swarm optimization (PSO), a slightly more advanced version of the swarm intelligence algorithm, in the field of structural optimization. Moreover, in their study, Hu et al. (Reference Hu, Wang, Wang, Wang and Zhang2014) used the PSO to select the most appropriate machining scheme. In addition, hybrid algorithms based on the evolutionary algorithm have been extensively studied, for example, the study by Ahlquist et al. (Reference Ahlquist, Erb and Menges2015).
There are general studies on the optimization of Reynolds' (Reference Reynolds1987) boids algorithm (rule-based swarm algorithm) with GAs, for example by Chen et al. (Reference Chen, Kobayashi, Huang, Nakao, Gabrys, Howlett and Jain2006) and Alaliyat et al. (Reference Alaliyat, Yndestad and Sanfilippo2014). There are also general studies on the optimization of Reynolds' (Reference Reynolds1987) boids algorithm with the PSO, for example, by Cui and Shi (Reference Cui and Shi2009) and Alaliyat et al. (Reference Alaliyat, Yndestad and Sanfilippo2014). However, to date, no study has examined the simultaneous use of the swarm intelligence algorithm and GA in the field of architecture. However, the simultaneous use of these two algorithms can undoubtedly provide different problem solutions in the architectural world.
In the field of architecture, while there has been no review of the simultaneous use of the swarm algorithm and GA, there have been extensive reviews on the algorithms used in the field of building design (especially on optimization). For example, Attia et al. (Reference Attia, Hamdy, O'Brien and Carlucci2013), Evins (Reference Evins2013), Machairas et al. (Reference Machairas, Tsangrassoulis and Axarli2014), Nguyen et al. (Reference Nguyen, Reiter and Rigo2014), and Shi et al. (Reference Shi, Tian, Chen, Si and Jin2016) reviewed the optimization methods in the field of building design. In addition, Wetter and Wright (Reference Wetter and Wright2004), Elbeltagi et al. (Reference Elbeltagi, Hegazy and Grierson2005), Wright and Alajmi (Reference Wright and Alajmi2005), Tuhus-Dubrow and Krarti (Reference Tuhus-Dubrow and Krarti2009), Kämpf et al. (Reference Kämpf, Wetter and Robinson2010), and Hamdy et al. (Reference Hamdy, Palonen and Hasan2012) examined the performance of various algorithms in determining design solution.
The agents in the PSO algorithm move through the problem space in order to find the best solution, but Reynolds' (Reference Reynolds1987) boids algorithm (a rule-based swarm algorithm) does not perform optimization like the PSO algorithm. However, it is used for navigation and obstacle avoidance problems. In the conceptual design stage of architectural design, the features of this algorithm may conceivably be important for the production of form alternatives within the boundaries of the parcel, especially on the building scale. Therefore, this study focuses on this algorithm and uses the GA to list the results that can be achieved with this algorithm, in line with the objectives.
The main research question addressed by this study is as follows: Can the two bio-inspired algorithms work together in the field of architecture? Therefore, the hypothesis of this study is that rule-based swarm intelligence, which serves as a simulation, can be optimized with the GA. To test this hypothesis, the study optimized the rule-based swarm algorithm with the GA. This optimization test marks the first test of this hybrid algorithm. Therefore, the optimization was intentionally based on a simple architectural problem of increasing the surface area. Further, it was envisaged that architectural solutions would remain at the conceptual level.
This study addresses the following secondary research question: Can digital pathways be developed to provide more flexible solutions in the conceptual design phase? Today, the conceptual design stage involves the use of various computer programs. However, in terms of changing or incorporating new details, conceptual design, which is performed by these programs, is less flexible than manual sketching. Therefore, new methods to provide more flexible solutions should be developed. Accordingly, this study aims to develop a more efficient method for the conceptual design stage by using new technologies and computer programs.
Background
Conceptual design stage
According to Yu et al. (Reference Yu, Gu, Ostwald and Gero2015), architectural design is a non-linear process that enables the constant refinement of ideas. Goel (Reference Goel1992) lists the following phases of the architectural design process: problem structuring, preliminary design, refinement, and detailing. Preliminary design, which is a creative process, involves the consideration of several ill-structured design options until the desired shape is achieved. This is a conceptual design phase because, in this phase, the designer expresses their design using a sketch or an abstract and refrains from providing a detailed description.
In the conceptual design stage (particularly, the sketching stage at the very beginning of the design process), the designer considers many design possibilities (Schon, Reference Schon1983; Garner, Reference Garner and Thistlewood1992; Schon and Wiggins, Reference Schon and Wiggins1992; Goel, Reference Goel1995; Suwa and Tversky, Reference Suwa and Tversky1996; Lipson and Shpitalni, Reference Lipson and Shpitalni2000; Do, Reference Do2002). In this process, the designer performs observations and makes visual documentation. The ideas developed during this creative process have a significant impact on the final product (Jin and Benami, Reference Jin and Benami2010).
Constraints and objectives limit the number of solutions at the beginning of the design process; hence, it is better to define these aspects at the conceptual design stage. While producing form, designers consider both constraints and objectives, which are the facilitators of the design process. Otherwise, the number of design alternatives will increase, and designers will face difficulty in making decisions (in the absence of certain constraints, objectives, or rules). The following are feasible examples of design constraints: constraints imposed by material use, economic competence, daylight use, energy minimization, structural constraints, and the desired surface area, and limitations caused by the surrounding structures, parcel boundaries, floor height, and aesthetic concerns. The designers image their design according to these constraints and objectives and perform a type of optimization. However, the computational design offers facilities to make the optimization of the work easier for the designer.
Swarm intelligence
To clarify the complex swarm intelligence behavior, researchers often consider the natural behavior of social insects (Bonabeau et al., Reference Bonabeau, Dorigo and Theraulaz1999; Dorigo et al., Reference Dorigo, Bonabeau and Theraulaz2000; Camazine et al., Reference Camazine, Deneubourg, Franks, Sneyd, Theraulaz and Bonabeau2001; Theraulaz et al., Reference Theraulaz, Gautrais, Camazine and Deneubourg2003; Dorigo and Stutzle, Reference Dorigo and Stutzle2004). As examples of swarm behavior, researchers have examined the internal organization of ant colonies (Theraulaz and Bonabeau, Reference Theraulaz and Bonabeau1995), bee colonies (Camazine, Reference Camazine1991), schools of fish (Partridge, Reference Partridge1982), and flocks of birds (Reynolds, Reference Reynolds1987). These examples clarify that swarm behavior, which seems complex, is based on simple rules, and subsequently, these swarm intelligence rules can be converted into computer algorithms. In multi-agent system-based swarm intelligence algorithms, agents perform self-organization by exhibiting autonomous behavior. This study uses a flocking model that is based on the model referred to as a “boid” by Reynolds (Reference Reynolds2017). According to Reynolds (Reference Reynolds2017), the complex behavior of birds in their natural environment depends on three mathematical rules: alignment, separation, and cohesion. When birds in a flock fly in the same direction, each bird maintains a certain distance from its neighboring birds, and this is called the separation rule. Further, each bird follows a direction that is determined by the average overall orientation of the flock, and this is the alignment rule. Finally, each bird takes its position relative to the average position, which is the cohesion rule. Therefore, although each bird acts in accordance with its neighbor's environment, the final result is that each bird affects the swarm's geometry and self-organization. Therefore, long-term swarm behaviur and movement remain unpredictable (Fig. 1).
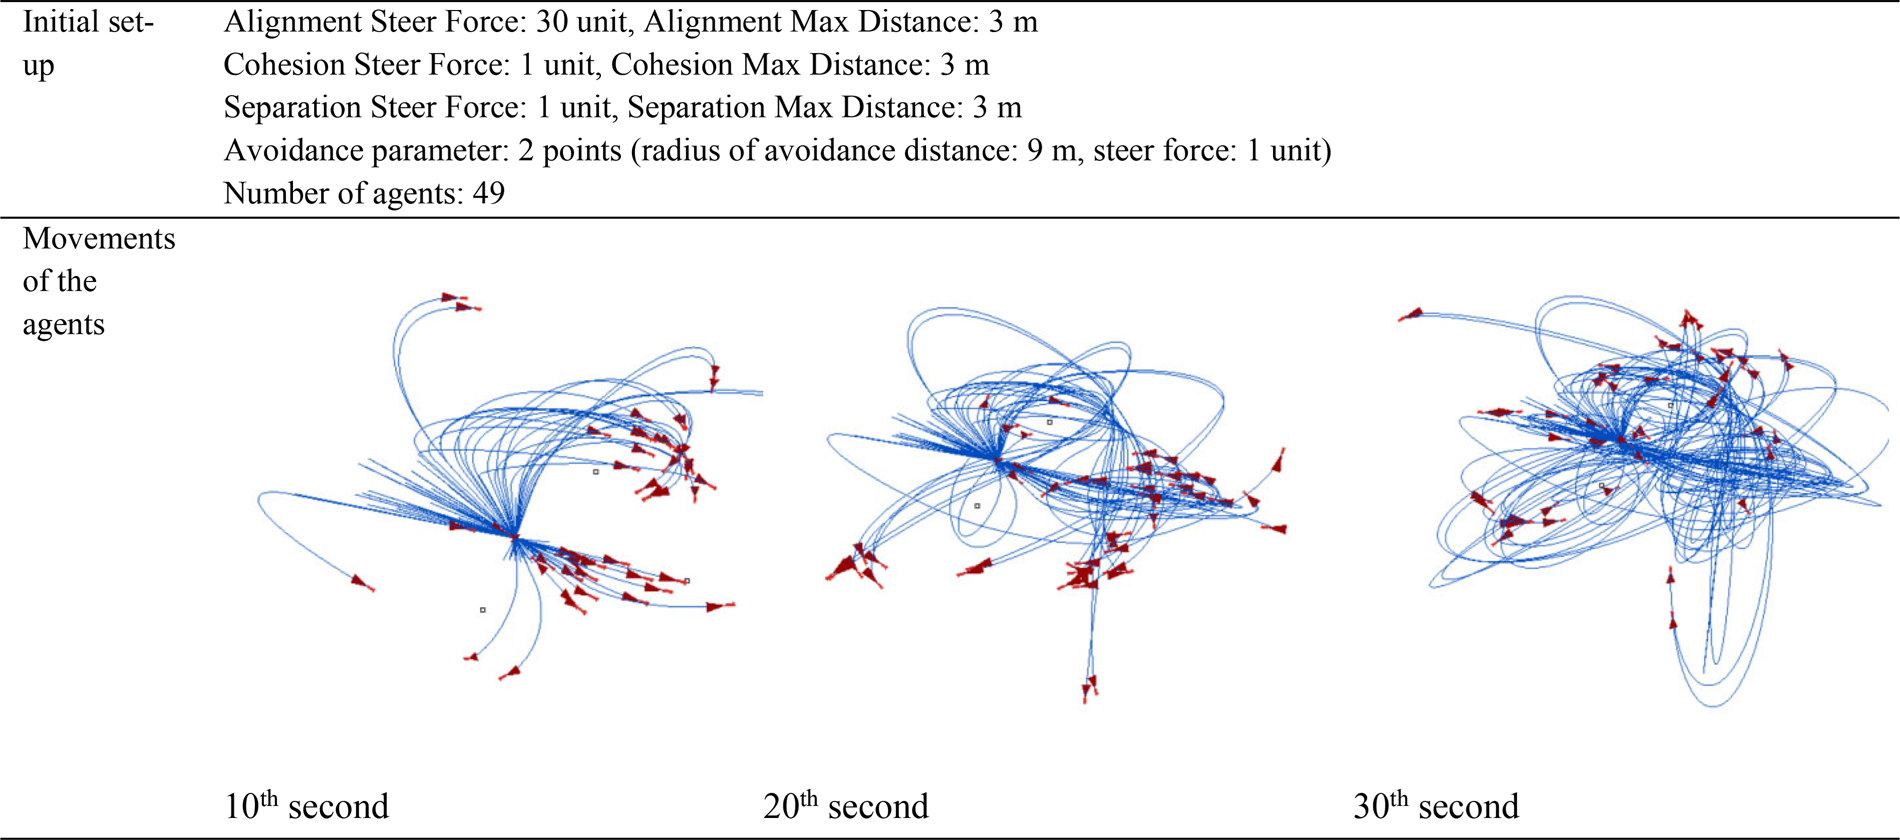
Fig. 1. Self-organization of agents according to the defined alignment, separation, and cohesion values.
The swarm algorithm has been further developed and used in optimization studies. The PSO is the swarm algorithm that provides optimization (Eberhart and Kennedy, Reference Eberhart and Kennedy1995; Kennedy and Eberhart, Reference Kennedy and Eberhart1995; Eberhart et al., Reference Eberhart, Dobbins and Simpson1996). In addition, many studies have examined this algorithm in detail (Reddy and Kumar, Reference Reddy and Kumar2007; Kramar et al., Reference Kramar, Cica, Sredanovic and Kopac2015; Adeniran and El Ferik, Reference Adeniran and El Ferik2017; Ab Rashid et al., Reference Ab Rashid, Tiwari and Hutabarat2019), and in general, most of these studies are results oriented.
Genetic algorithms
Today, in the field of computational design, optimization is generally performed using GAs (Goldberg and Holland, Reference Goldberg and Holland1988; Frazer, Reference Frazer1995; Bentley and Wakefield, Reference Bentley and Wakefield1997; DeLanda, Reference DeLanda2002). To date, many studies have examined GAs in detail (Rasheed and Hirsh, Reference Rasheed and Hirsh1999; Hofmeyer and Davila Delgado, Reference Hofmeyer and Davila Delgado2015; Su and Yan, Reference Su and Yan2015).
Using the principles of evolutionary biology, inheritance, mutation, selection, and crossover, GAs offer solutions to various design problems in a short time (Renner and Ekárt, Reference Renner and Ekárt2003; Kim, Reference Kim2013; Yu et al., Reference Yu, Austern, Jirathiyut and Moral2014). These algorithms, which have very complicated programming structures, can easily be used through the Galapagos program developed by David Rutten (Rutten, Reference Rutten2013; González and Fiorito, Reference González and Fiorito2015).
Methods
Constraints, variables, and objectives
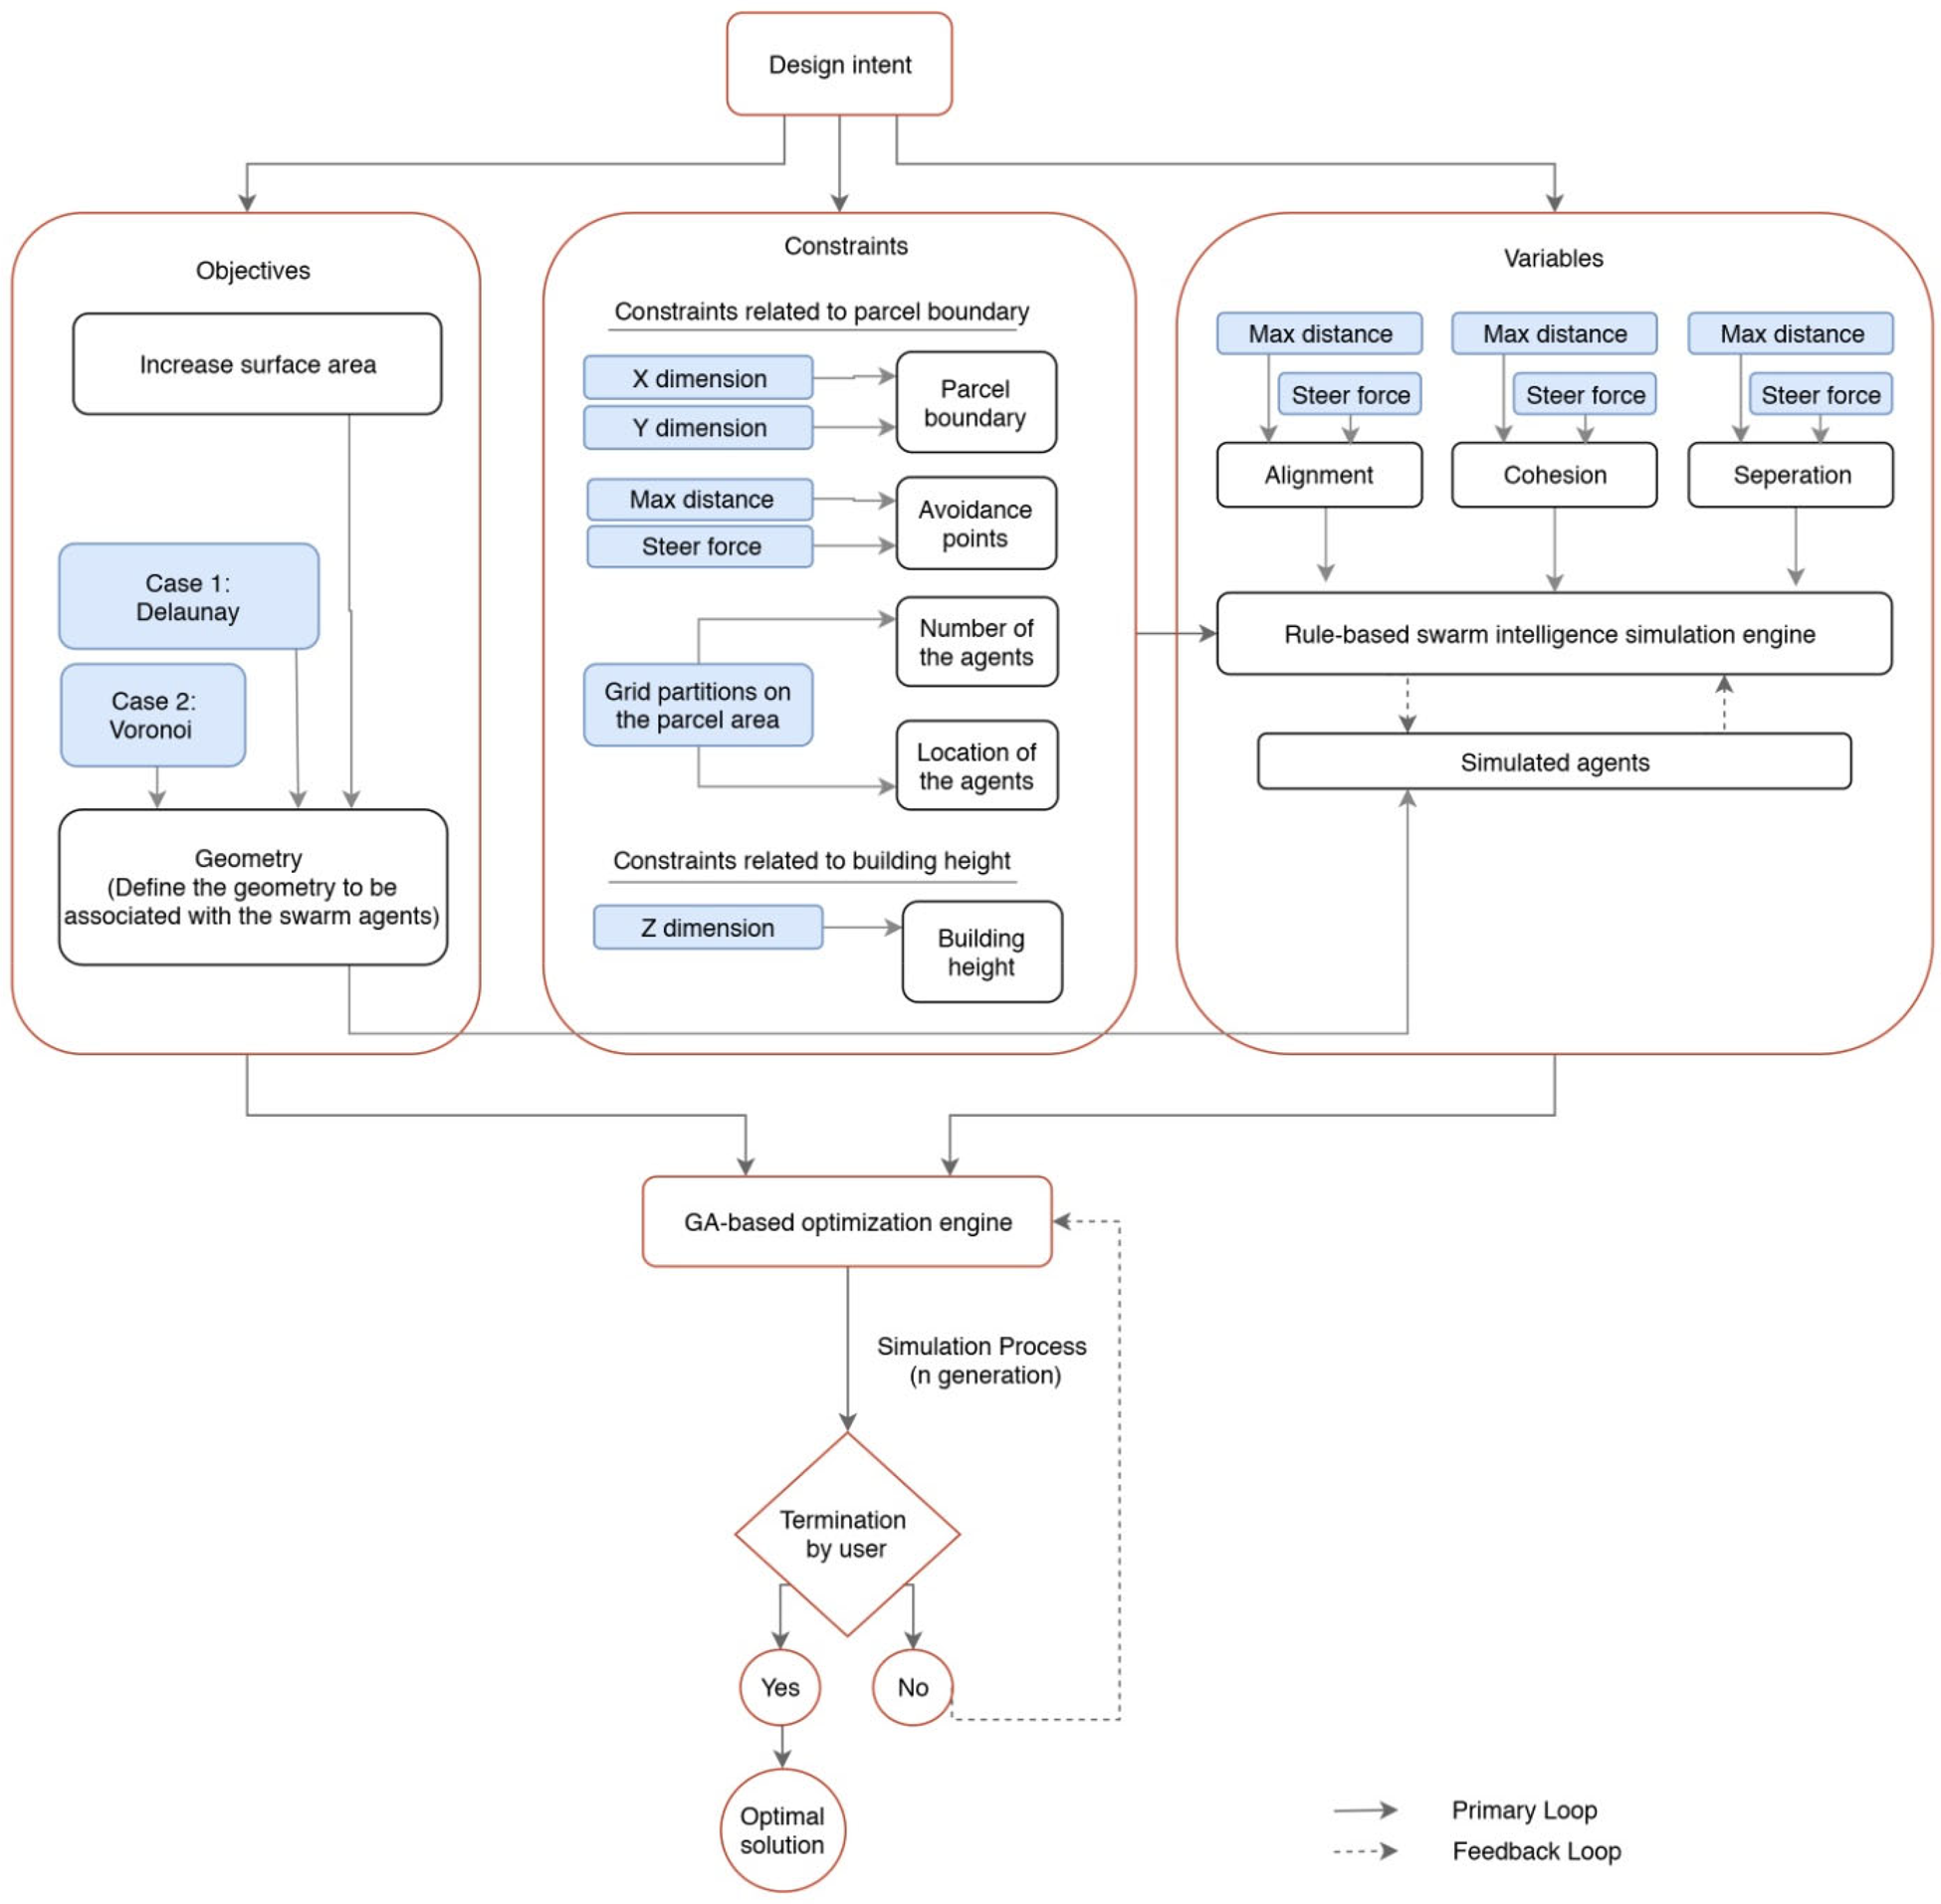
For the developed model, the parcel boundary and building height boundary were defined as the constraints. Further, the avoidance points connected to the swarm simulation were the constraints, as they are related to the boundary limits of the site. In addition, the number and location of the agents, which were also related to the boundary limits of the site and whose values were maintained constant throughout the simulations, could also be defined as constraints. The objective was the enhancement of the surface area of the Delaunay or Voronoi-based form (Figs. 2, 3).

Fig. 2. Flowchart of the simulation script to maximize the surface area of the Delaunay/Voronoi mesh created by swarm agents.

Fig. 3. The developed script.
The variables were the values related to alignment, cohesion, and separation that determined the paths of agents in the swarm simulations. However, as the swarm geometry is directly determined by the agents, we observed the geometry associated with the form in the simulation. Therefore, the Delaunay or Voronoi-based form, which is connected to the swarm agents, was considered a variable (Fig. 2). The Delaunay mesh form (Lee and Schachter, Reference Lee and Schachter1980) and Voronoi-based form (Benvenuti et al., Reference Benvenuti, Ceccanti and De Kestelier2013; Tedeschi, Reference Tedeschi2014) were separately connected to the agents in the swarm intelligence simulation. Delaunay and Voronoi geometries were used because they can provide form as a product in a certain complexity; they are directly connected to swarm agents (and, hence, to point geometry), that is, they do not complicate the simulation process; and form certain surfaces (or geometries that can become surfaces). However, other geometries with the same characteristics can be used in the simulations as well.
Computer software
In this study, all of the processes were performed in Grasshopper, which works as a plug-in to the Rhino program and provides a visual programming language environment. In addition, the study used Locust, Weaverbird, and Galapagos as add-ons to Grasshopper.
Model setup
For the swarm intelligence simulation, the study used Locust, which was developed as an add-on for the Grasshopper program created by Cerver Design studio (Cerver tools, 2018). First, a “bounding box” component was connected to the Locust Brain component in the Locust add-on. This box component was calibrated according to parcel boundaries and building height, and the simulation boundaries were defined. The height of the box was set as 12 m, as the assumed maximum achievable building height was 12 m. Further, the box's width was set as 12 m and the length as 16 m, which were in line with the boundaries of the parcel's usage area. In this manner, the movement boundaries of the agents in the swarm simulation were determined (Figs. 2, 4). Later, the starting points of the agents were connected to the Locust Brain component. These points were positioned on the ground plane and distributed in an equal ratio to the parcel. The designer determined the number of starting points, which is also the number of agents, and the distribution of these points according to the parcel's size. A grid was created by making five partitions each in the X and Y axes, and the points on the grid were defined as starting points (25 agents). In addition, while determining the partition ratio, it was assumed that the simulation could be run easily, and there were sufficient agents to create the desired form. The aforementioned number of partitions can be changed according to the formal complexity that can be achieved based on the number of agents and the parcel size.

Fig. 4. The parcel and specified constraints (the arrows highlighted in red represent swarm agents; and the building height limit is 12 m, parcel boundaries are 12 m to 16 m).
The alignment, cohesion, and separation parameters, which correspond with the three main rules of swarm intelligence, can be separately inputted to the Locust Brain component. Further, there are two input values for alignment, cohesion, and separation; steer force and distance. Steer force specifies how power influences alignment, cohesion, or separation; and distance indicates the maximum distance between neighboring agents for alignment, cohesion, or separation. In this study, the steer force value is between 1 and 3 units (as a floating point), and the distance value is between 1 and 15 m (as a floating point) for alignment; the steer force value is between 1 and 3 units (as a floating point), and the distance value is between 1 and 15 m (as a floating point) for cohesion; and the steer force value is between 1 and 3 units (as a floating point), and the distance value is between 1 and 15 m (as a floating point) for separation (Table 1). However, these values can be assigned randomly or lie within very broad ranges. This is because Galapagos, which was used later in the script, finds the best value range. The values of these inputs can be changed parametrically, as well. The changes in these values cause variations in the overall behaviors of the swarm agents, as the former may cause variations in the minimum and maximum distances among the agents. However, the probability combination values of these input values can be very high. In particular, the combination probability values increase with an increase in the number value interval (Fig. 2).
Table 1. Results depicting the maximization of the area of the Delaunay mesh within the specified constraints

In addition, the avoidance point parameter can be added to the Locust Brain component. This parameter allows the agents to escape from specified points. Within the scope of this study, two avoidance points were defined in the considered area. These points were located in the middle of the buildings next to the parcel. The avoidance parameter has two inputs, steer force and distance. Based on the influence of the power of the agents moving away from the specified points, the steer force value was assigned the default value of 1 unit. Further, based on the impact of the distance of the agents moving away from the specified points, the distance parameter was set as 9 m. Therefore, the agents in the swarm simulation moved away from these points (i.e., from the buildings on the side). Based on the desired design, the script may contain different numbers of avoidance points in different locations (Fig. 2).
The agents can be identified as points in the swarm intelligence simulation output. A Delaunay mesh component was initially used, which is a Grasshopper component because it enables the creation of a complex form with ease by providing the points as inputs and involves a mesh geometry that allows the simulation to be performed at high speeds. The point geometry, that is, the input of the Delaunay mesh component, was connected to the swarm agents, which were the output of the swarm intelligence simulation. Hence, based on the simulation of the swarm agents, Delaunay mesh geometries were created. For the second experiment, the study used Voronoi geometry, which is, again, complex geometry. The Voronoi geometry was divided using the Catmull–Clark subdivision component, which is a component of the Weaverbird add-on. Subsequently, a thickness value was input to the division frame to provide a more complex mesh. The point input of the Voronoi component, which is the same as the one used in the Delaunay geometry, was connected to the agents in the point geometry, which was the output of the swarm intelligence simulation. In this manner, according to the simulation of the swarm agents, different Voronoi mesh geometries were created (Fig. 2).
Optimization simulation
In this study, for a particular parcel, the maximization of the surface area of the Delaunay/Voronoi mesh created by the agents throughout the simulation was defined as the criterion. This enabled the testing of how the mesh can be placed in the parcel with the maximum surface area at the conceptual level. However, it is very difficult for this formation to capture the combination of the agent parameters that form the maximum surface area by adjusting the number of slider parameters (the values of inputs of the alignment, cohesion, and separation components) and then running the simulation. Therefore, Galapagos, which was developed as an add-on for Grasshopper based on GA, was used as an optimization tool to determine the options for the most suitable values. The genome part of Galapagos (representing the variables to be used to reach the fitness value) was connected to the number value parameters (six inputs) of the steer force and distance inputs of alignment, cohesion, and separation. Further, the numerical value of the Delaunay mesh surface/Voronoi mesh average surface area to be formed as a result of the swarm simulation was connected to the fitness part. Subsequently, the Galapagos optimization was initiated without a runtime limit, and the process was set to maximize the value (initial settings for the optimization process: maximum stagnant: 50, population: 50, initial boost: 2, maintain: 5%, and inbreeding: +75%; Fig. 2).
Results and discussion
Case 1: Delaunay mesh
Using the Galapagos program, 20 experiments were conducted to identify the combination of alignment, cohesion, and separation values that increases the surface area of the Delaunay mesh (Table 1). In the first experiment, the alignment, cohesion, and separation values were randomly assigned before starting the simulation. In the experiments, the combination of alignment, cohesion, and separation values identified by the Galapagos program at the end of each experiment was used as the combination of the initial values for these parameters in the next experiment. This is because, in the swarm simulation, the combination of the initial values of the agents is important, as it allows the agents to influence each other's organization throughout the simulation process. In addition, more than one generation was produced in each of these 20 experiments to achieve the optimized result. At least 49 generations were produced in each of these experiments, and the number of generations produced in each experiment is illustrated in Table 1.
At the conclusion of all of the experiments, the combinations of the alignment, cohesion, and separation values determined by the Galapagos program to maximize the surface area value were found to be different from each other. An important reason is that the organization of swarm agents among themselves in each combination was different (in other words, each simulation recorded different movements of the agents), providing different Delaunay geometries for different combinations as well. However, all of the experiments provided area values between 253.16 and 548.54 m2 (Table 1). Hence, in the model, each of the 20 experiments provided information about the maximum surface area of the corresponding form, which could be created with different combinations of the swarm simulation. This enabled the designer to identify the combination accurately of the starting values at which the maximum surface area could be reached.
A detailed examination of these 20 experiments reveals the following: The steer force values range between 1 and 3 units; alignment steer force has a maximum value of 2.80 unit and a minimum of 1.32 unit; cohesion steer force value ranges between the upper and lower limits of 2.99 unit and 1.41 unit, respectively; and separation steer force value varies from 2.73 unit to 1.05 unit. In other words, the values can vary significantly according to different combinations. Further, based on the limited distance values between 1 and 15 m, the alignment distance has a maximum value of 13.23 m and a minimum of 1.88 m, the range of the cohesion distance value is 14.58–2.50 m, and the range of the separation distance value is 12.23–1.65 m. In other words, the distance values can vary extensively according to different combinations. However, the value of one parameter does not increase in response to an increase in the values of other parameters. On the contrary, the other parameters have smaller values. For example, in experiment 1, the separation, alignment, and cohesion distances were 11.58 m, 13.23 m, and 5.13 m, respectively. Similarly, in experiment 2, the cohesion, alignment, and separation distances were 12.80 m, 11.06 m, and 5.61 m, respectively (Table 1).
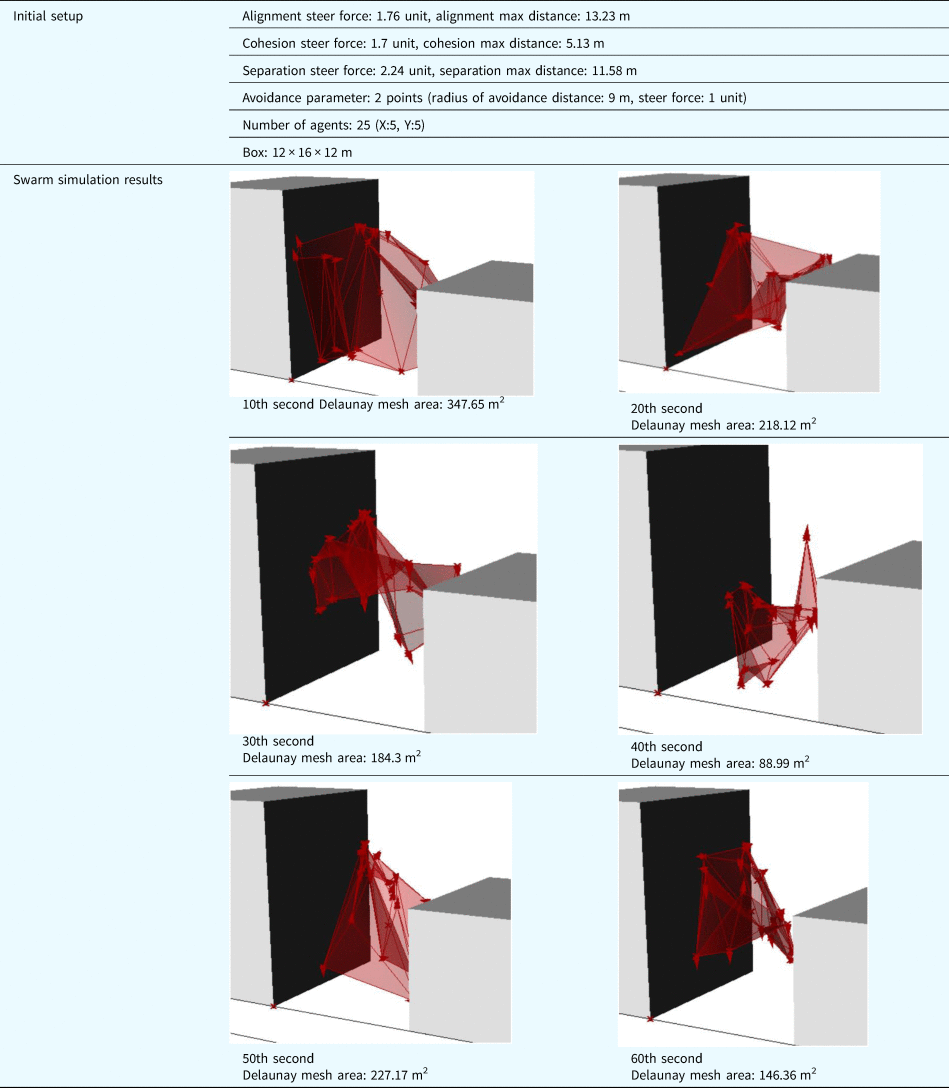
In terms of maximizing the surface area, the aforementioned values, which were obtained from the model as a result of optimization, can be utilized to achieve a more efficient form-finding process. Accordingly, an experiment in which a swarm simulation was initiated with the values obtained at the end of the initial optimization was performed. As seen from the simulation process, the values of the Delaunay mesh surface areas tended to increase (Table 2), and the fluctuations in the area value were caused by the movements of agents in the simulation and, hence, considered normal.
Table 2. Sections of the swarm simulation initiated by the values obtained from the first Galapagos optimization for the Delaunay mesh area
Case 2: Voronoi mesh
Using the Galapagos program, 20 experiments were conducted to identify the combination of alignment, cohesion, and separation values that increases the average surface area of the Voronoi mesh. A process similar to the one performed in the Delaunay mesh experiment was followed. Further, similar to the Delaunay mesh case, different combinations of the alignment, cohesion, and separation values were determined by the Galapagos program to achieve the maximum surface area value. The major reason is that the organization of swarm agents among themselves in each combination was different, such that each combination formed a different Voronoi geometry. However, the experiments provided area values between 420.15 and 1261.74 m2 (Table 3), and at least 25 generations were produced in each of these experiments. The number of generations produced in each experiment is illustrated in Table 3.
Table 3. Results of maximizing the area of the Voronoi mesh within the specified constraints
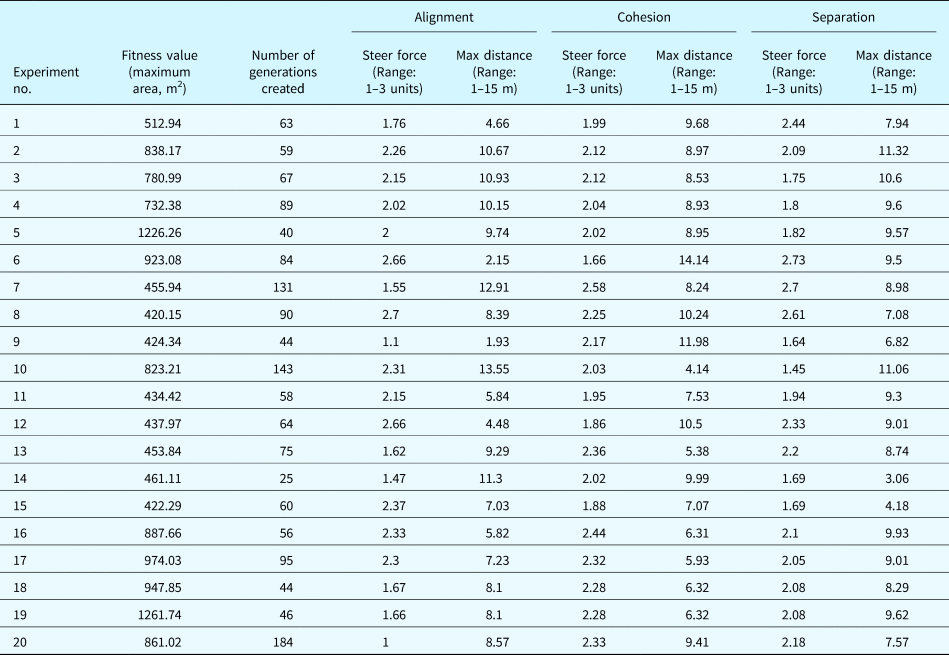
A detailed examination of the results of the 20 experiments reveals the following: the steer force values range between 1 and 3 units, the alignment steer force has a maximum value of 2.70 unit and a minimum of 1.00 unit, the cohesion steer force value is between 2.58 and 1.66 units, and the separation steer force value is between 2.73 and 1.45 units. In other words, the values vary significantly according to the different combinations. From the limited distance values between 1 and 15 m, the alignment distance value varies between 13.55 and 1.93 m, the cohesion distance value is between 14.14 and 4.14 m, and the separation distance value is between 11.32 and 3.06 m. In other words, the distance values vary significantly according to the different combinations. However, similar to the Delaunay mesh experiment, the value of one parameter does not increase in response to an increase in the values of other parameters. In contrast, the other parameters have smaller values. For example, in experiment 1, the separation, alignment, and cohesion distances are 7.94 m, 4.66 m, and 9.68 m, respectively. Similarly, in experiment 2, the cohesion, alignment, and separation distances are 8.97 m, 10.67 m, and 11.32 m, respectively (Table 3).
Similar to the case of the Delaunay mesh, an experiment in which a swarm simulation was initiated with the values obtained at the end of the initial optimization was conducted for the Voronoi mesh. As seen from the simulation process, the values of Voronoi mesh surface areas tend to increase with the progress of the experiment (Table 4). The fluctuations in the area value were caused by the movements of agents in the simulation and, hence, considered normal.
Table 4. Sections of the swarm simulation initiated by the values achieved from the first Galapagos optimization for the average Voronoi mesh area

The number of agents in the swarm simulation; locations of the agents; and initial values of the alignment, cohesion, and separation parameters are the factors determining how a swarm simulation will formally occur. In the experiments conducted in this study, the number and locations of agents were kept constant. The simulation was initiated with random alignment, cohesion, and separation values. At the end of the experiments, GA optimization was performed to identify the combination of alignment, cohesion, and separation values in the swarm simulation that created the maximum surface area values.
Opposite objective test
In this study, to test the accuracy of the information produced by the proposed model, a process to minimize the surface area of the Delaunay mesh produced by swarm simulation was determined as a criterion, and a test operation was carried out. In this process, apart from applying the settings to minimize the area value of the objective (criterion) in the optimization step, the constraints and methodology were exactly the same as the process for determining the maximum surface area.
This process aimed to test the accuracy of the information included in the model by performing an opposite operation. In this process, test experiments for the Delaunay mesh were conducted to examine whether the forms, which could be formed in a swarm simulation and could cover the minimal area, occurred or not. The test trials revealed that forms with very low area values could be obtained by swarm simulation optimization (Table 5), and the model took only a short time to provide this information. All of the experiments revealed area values between 104.21 and 0 m2. In the swarm simulation, when the agents came very close to each other and became concentrated in some regions, the area value can fall to 0, which is reflected in the results. Hence, the model could provide information on the minimum surface area of the form that resulted from the swarm simulation in different combinations in each of the 20 experiments. This assisted the designer in identifying the combination of starting values that could yield the minimum surface area.
Table 5. Results of the minimization of the area of the Delaunay mesh (fitness value) within the specified constraints

A detailed examination of the 20 test results reveals that among the steer force values that are limited between 1 and 3 units, the values of the alignment steer force have a maximum of 2.63 unit, and a minimum of 1.49 unit, the cohesion steer force value has a maximum of 2.68 unit and a minimum of 1.23 unit, and the separation steer force value is at a maximum 2.78 unit and a minimum of 1.14 unit. In other words, the values can vary significantly among the combinations. From the limited distance values between 1 and 15 m, the alignment distance has a maximum value of 14.76 m and a minimum of 2.93 m, the cohesion distance has a maximum value of 12.03 m and a minimum of 1.17 m, and the separation distance has a maximum value of 12.15 m and a minimum of 3.04 m. Finally, once again, the distance values varied extensively for different combinations (Table 5).
On concluding the experiments that were part of the test, the combination of alignment, cohesion, and separation values in the swarm simulation that created the minimum surface areas could be identified using GA optimization.
This test examined whether the script can work effectively by using opposite objectives (minimizing surface area). All of the other values in the main test were kept the same, and as a result, the script could perform the minimizing surface area task, which is the opposite objective. In particular, although the value ranges of the variables (the values related to alignment, cohesion, and separation) are the same with the main test, the decrease in fitness values obtained as a result of GA optimization demonstrated that the script could perform the opposite task. In addition, in the swarm simulation, which began by taking the values in the third experiment, the decrease of the area covered by the Delaunay form is noticeable in a short time (Table 6).
Table 6. Sections of the swarm simulation initiated by the values achieved from the third Galapagos optimization for the Delaunay mesh area (minimizing the surface area)

Analysis of the relationship between the values and the surface area
Another analysis was made to observe how the alignment, cohesion, and separation values affect the surface area of the form in the swarm simulation. To understand the effect in the Delaunay mesh form, first, a simulation experiment was carried out with the alignment steer force value: 1, alignment maximum distance value (m): 2, cohesion steer force value: 1, cohesion maximum distance value (m): 2, separation steer force value: 1, and separation maximum distance value (m): 2. Then, keeping the other values constant, an experiment with an increased alignment maximum distance value of 5 m, an experiment with an increased cohesion maximum distance value of 5 m, and another experiment with an increased separation maximum distance value of 5 m were conducted. This experiment was performed for the first 5 and 10 s because beyond this time, the form was found to be influenced by environmental factors owing to the effect of the bounding box. Therefore, the change could not be clearly observed (Table 7).
Table 7. Analysis of the change of the surface area according to the alignment, cohesion, and separation values

A SF: Alignment steer force value, A MD: Alignment maximum distance value (m), C SF: Cohesion steer force value, C MD: Cohesion maximum distance value (m), S SF: Separation steer force value, S MD: Separation maximum distance value (m)
According to this analysis, the separation maximum distance value variable has the potential to increase the area of the form. If the environmental factors had no effect on shaping the form, it would be reasonable to retain the separation maximum distance value variable high to maximize the surface area because the separation feature enlarges the distance between the agents, and therefore increases the surface area formed between the agents. However, in this study, this is not a criterion as the environmental factors (sidewalls) affect the swarm simulation, and the swarm agents are self-organized in line with these environmental factors. However, GA optimization offers us a potential value combination (incorporation with environmental factors into the process), so we can obtain a form that may emerge during the swarm simulation. However, there may be increases and decreases in the surface area during the simulation period of this combination.
It should be noted that, in these simulations, the form changes every second. Therefore, depending on the computer used, the results may vary. The computer used in this study is a portable workstation (equipped with the Intel Core i7 – 3820QM processor – 8 MB Cache up to 3.70 GHz, 8 GB RAM, 500 GB Hard Disk Drive, 7200 rpm, and a separate NVIDIA Quadro K2000M graphics processor with 2GB DDR3 Memory). In the rule-based swarm intelligence simulation, 6% CPU was used, and in the combined simulation (swarm + GA optimization), 17% CPU was used.
Conclusions
This study is the first test on the simultaneous use of two bio-inspired algorithms in the field of architecture. As depicted by the case studies, the combined model developed by the study is effective. In other words, the two bio-inspired algorithms, the swarm intelligence algorithm and GA, could work together. Specifically, the GA optimized swarm agents in motion.
In this study, the parcel boundary and the maximum achievable height of the mass were the constraints in the swarm simulation, and the maximization of the average surface area of the Delaunay/Voronoi mesh associated with the alignment, cohesion, and separation values was defined as the criterion (objective). Accordingly, the swarm simulation was optimized using the Galapagos program to achieve the desired values. As this study focused on the effective use of two bio-inspired algorithms together, other architectural parameters (e.g., functional, structural, and material parameters) were excluded from the study's scope, with the exception of increasing the surface area parameter, which was determined as an objective.
The ability of two bio-inspired algorithms to run together is the main inference of this study. However, based on the results obtained in this study, the following additional inferences are open for discussion.
Normally, the rule-based swarm algorithm does not work as an optimization algorithm. As many combinations of alignment, cohesion, and separation values are possible in the rule-based swarm intelligence approach, it is very difficult to identify maximum or minimum values of specific criteria and constraints without using an optimization tool. Therefore, the benefit of the combined method produced in this study is that the combination values of self-organizing swarm agents can be found through optimization (with the GA).
Today, the concept design process has changed from a two-dimensional approach (e.g., manual sketches on paper) to a static three-dimensional approach (e.g., digital sketches on computer-aided design programs). Accordingly, concept design with intelligent modeling and simulation tools has started superseding other, less advanced, methods. However, computer programs can sometimes restrict the flexibility of the designer, as they do not facilitate sufficient form formation during the conceptual design phase. Therefore, as suggested by this study, various new methods, which can be used in computer-aided design platforms, should be developed. In this study, the method, which involved the simultaneous use of two bio-inspired approaches – the swarm intelligence algorithm and GA – by utilizing advanced technologies, enabled the designer to increase the speed of the sketching process in the conceptual design stage of architectural design. The digital sketches, which were formed in line with the established criteria and constraints throughout the simulation, could introduce new ideas to the designer, which may inspire the designer to initiate a process of rediscovery. As demonstrated in the case studies (Delaunay and Voronoi), optimization offers various form alternatives (in accordance with the established objectives and constraints) to the designer and thereby, strengthens the conceptual design stage.
Limitations and future work
As the main focus of this study was based on the simultaneous use of two algorithms, an experiment was carried out on a simple objective. However, using more sophisticated objectives, experiments should be done on the interoperability of these two algorithms in the field of architecture and design.
In the combined method, Galapagos optimization was initiated without a runtime limit. However, the number of generations produced was observed to differ in each test. Consequently, the computation times were also different for each test. Another observation was that the computation time varied according to the objective of minimizing or maximizing the surface area of the form and according to the type of form being used. Moreover, the number of swarm agents and the width of the area that the swarm agents effect, has a significant impact on the computation time. The type of computer hardware was also found to influence the computation time. It will therefore be advantageous to perform various tests and comparative analysis on the aforementioned topic.
In this paper, if we make inferences in line with the objective chosen within the scope of optimization, the optimization of boids does not provide direct results (within the scope of Voronoi and Delaunay geometries). The results demonstrate that the optimal parameter values for alignment, cohesion, and separation can vary, and the run time of the swarm simulation affects the resulting geometry. However, GA optimization provides a conclusion about the overall value range, and this could be an answer to another research question within the scope of this study: “Can digital pathways be developed to provide more flexible solutions in the conceptual design phase?” The method used in this study may be suitable for the conceptual design phase in the digital environment because this method contributes to the sketching process in the digital environment with different alternatives offered to the designer, and thus, the designer can revise and reshape their ideas. This conforms to the definition of ill-structured design options that should take place in the conceptual design phase.
As a future direction of this study, the maximization of the surface area using a multi-objective optimization add-on (e.g., the Octopus add-on) should be optimized using another parameter. Some examples of this other parameter are the provision of daylight control using the Honeybee add-on, the generation of environmentally conscious architectural designs using the Ladybug add-on, the provision of acoustic control using the Pachyderm add-on, and the provision of structure-related controls using the Karamba add-on.
Asli Agirbas is an Associate Professor in the Department of Architecture at Fatih Sultan Mehmet Vakif University. She received her MS Arch from Pratt Institute, New York and her PhD from Mimar Sinan Fine Arts University, Istanbul. Her recent research interest is focused on the use of swarm intelligence in architectural design. She also published articles about parametric design, CAD education, and macro-scale designs and optimization in the field of architecture.