


Inventories consisting of Likert-type items are often characterized in the context of item response theory (IRT) by fitting Samejima’s (Reference Samejima1970) graded response model (GRM) to data. The simplest version of a Likert-type item is the yes-no item, also used in some inventories (e.g., Bortolotti, Tezza, de Andrade, Bornia, & de Sousa Júnior, Reference Bortolotti, Tezza, de Andrade, Bornia and de Sousa Júnior2013; Olatunji et al., Reference Olatunji, Woods, de Jong, Teachman, Sawchuk and David2009) and for which the polytomous GRM reduces to the dichotomous two-parameter logistic model (2PLM). However, the advantages of n-ary over binary response modes are well known and the use of Likert-type items with 4–6 response options is widespread. In contrast to reliance on polytomous IRT models for tests with Likert-type items, knowledge or ability tests are still characterized mostly via dichotomous IRT models. This is certainly the only option for tests consisting of true-false or constructed-response items (e.g., Nogami & Hayashi, Reference Nogami, Hayashi, van der Linden and Glas2010; Verschoor & Straetmans, Reference Verschoor, Straetmans, van der Linden and Glas2010), but many tests consist of multiple-choice items that admit several polytomous IRT characterizations. Yet, tests with multiple-choice items are massively analyzed under the three-parameter logistic model (3PLM; see, e.g., Bulut & Kan, Reference Bulut and Kan2012; Kalender, Reference Kalender2012; Nogami & Hayashi, Reference Nogami, Hayashi, van der Linden and Glas2010; Olea, Abad, Ponsoda, & Ximénez, Reference Olea, Abad, Ponsoda and Ximénez2004; Olea, Abad, Ponsoda, Barrada, & Aguado, Reference Olea, Abad, Ponsoda, Barrada and Aguado2011; Rudner, Reference Rudner, van der Linden and Glas2010). No evidence-based argument seems to have been put forth to justify the use of the dichotomous 3PLM over polytomous models for multiple-choice items.
Quite to the contrary, previous research suggests that a polytomous characterization of multiple-choice tests renders more efficient instruments. For instance, De Ayala (1989; see also De Ayala, Reference De Ayala1992) compared the workings of Bock’s (Reference Bock1972) nominal response model (NRM) and the 3PLM in an adaptive testing environment and the results showed that use of the NRM permitted estimating ability with considerably fewer items than were needed under the 3PLM. This is because the item information function (IIF) arising from the NRM characterization is higher than that arising from the 3PLM characterization of the same item, which in turn renders a higher test information function (TIF) and lower standard errors (SEs) for ability estimates. This superiority of the NRM is presumably gained from information provided by the distractors marked by the examinee (see Dodd, De Ayala, & Koch, Reference Dodd, De Ayala and Koch1995), which the 3PLM entirely overlooks. Another reason for the superior performance of polytomous models may lie in general statistical properties of estimates in multinomial compared to binomial situations (see García-Pérez, Reference García-Pérez and Roskam1989, Reference García-Pérez1993). A switch toward polytomous models for multiple-choice items might thus allow estimating ability more accurately (i.e., with lower SEs) despite the fact that the same items and responses are used in the process. It is remarkable in this respect that the multiple-choice model (MCM) of Thissen and Steinberg (Reference Thissen and Steinberg1984) has never been compared to the NRM or the 3PLM as to its capability to offer a more efficacious characterization of multiple-choice items.
The main goal of this paper is to compare 3PLM, MCM, and NRM characterizations of multiple-choice items and tests. The ultimate criterion for the comparison is whether the IIFs and the ensuing TIFs are superior under polytomous characterizations, and also whether the MCM outperforms the NRM in this respect. The comparison spans three scenarios. First, when the models are fitted to empirical data from a large sample of responses to a 43-item multiple-choice test with five options per item. Second, when the models are fitted to simulated data generated from known item parameters under a plausible polytomous extension of the 3PLM. Third, when the models are fitted to simulated data generated from known item parameters under the MCM. The first scenario gives a picture of how parameter estimates and model curves vary across fitted models for empirical data coming from an unknown data-generation process, and it also serves the important purpose of checking the data for evidence of some theoretical features of polytomous models regarding how distractor endorsement frequencies vary with ability. The second and third scenarios allow investigating whether the known reality that generated the data is more adequately represented in the NRM or MCM characterizations than in the 3PLM characterization.
The plan of the paper is as follows. The next section describes the three IRT models to be compared and their theoretical implications on distractor endorsement frequencies. Then, empirical data from the first scenario are analyzed in search for those theoretical features, and comparative results for the three fitted IRT models are presented. Subsequent sections present results under the two other (simulation) scenarios. It should be emphasized that the goal of this paper is to compare alternative characterizations of the same data with an eye towards identifying the reasons for differences (if they were found) in IIFs and TIFs across models. For this reason, issues that are typically addressed in simulation studies of other purposes (e.g., sample size needed for accurate item parameter recovery and ability estimation) will only be partially and indirectly addressed here. The ultimate goal of the analyses presented here is to gather the evidence that might allow an informed decision as to whether the dichotomous 3PLM should be replaced with the polytomous NRM or MCM for the characterization of multiple-choice items.
Alternative IRT characterizations of multiple-choice items
It is hardly contentious that the true function describing how the probability of a correct response varies with ability should not differ according to what model a psychometrician chooses to fit to multiple-choice data. Although this true function is always unknown, for the purpose of illustration consider a multiple-choice item with five response options whose true item response function (IRF) under the 3PLM were as shown in the left panel of Fig. 1a. This starting point seems adequate given the massive use of the 3PLM to characterize multiple-choice items, but it should not be taken to imply that the 3PLM IRF must be the true function for multiple-choice items. This IRF describes how the probability p of a correct response varies with ability θ through
 $$p({\rm{\theta }}) = c + {{1 - c} \over {1 + \exp [ - 1.7a({\rm{\theta }} - b)]}}.$$

Figure 1. Alternative characterizations of a multiple-choice item in which the probability of a correct response has a fixed relation to ability. The left column shows IRFs or ORFs and the right column shows IIFs (black curve) and option information curves where applicable, for the 3PLM characterization (a), and two alternative MCM characterizations (b and c).
The IIF for this item (with parameters in Fig. 1a) is shown also in Fig. 1a and is given by
 $$I({\rm{\theta }}) = {{{{1.7}^2}{a^2}[1 - p({\rm{\theta }})]\,{{[p({\rm{\theta }}) - c]}^2}} \over {p({\rm{\theta )}}\,{{{\rm{(1}} - c)}^2}}}.$$
Now consider a theoretical characterization of this item under the MCM, where the option response function (ORF) for option k (where 1 ≤ k ≤ n and n is the number of options in the item) describes the probability that an examinee of ability θ marks option k through
 $${p_k}({\rm{\theta }}) = {{\exp [{a_k}{\rm{\theta }} + {c_k}] + {d_k}\exp [{a_0}{\rm{\theta }} + {c_0}]} \over {\sum\nolimits_{m = 0}^n {\exp [{a_m}{\rm{\theta }} + {c_m}]} }}$$
with the constraints
 $\sum\nolimits_{k = 0}^n {{a_k}} = \sum\nolimits_{k = 0}^n {{c_k}} = 0$
and
$\sum\nolimits_{k = 0}^n {{a_k}} = \sum\nolimits_{k = 0}^n {{c_k}} = 0$
and
 $\sum\nolimits_{k = 1}^n {{d_k}} = 1$
. Item parameters under this alternative characterization must be such that the ORF for the correct answer describes the same shape as the 3PLM IRF (shown in the left panel of Fig. 1a). This can be theoretically achieved in several ways and one of them is through the MCM parameters given in Fig. 1b,
Footnote 1
which embed the extra assumption that the ORF for all distractors is nearly the same. This reflects the desirable characteristics that (1) all distractors are equally attractive to examinees of any given ability and (2) all response options (i.e., the correct answer as well as all distractors) are equally attractive to examinees of very low ability. The IIF under the MCM is given by
$\sum\nolimits_{k = 1}^n {{d_k}} = 1$
. Item parameters under this alternative characterization must be such that the ORF for the correct answer describes the same shape as the 3PLM IRF (shown in the left panel of Fig. 1a). This can be theoretically achieved in several ways and one of them is through the MCM parameters given in Fig. 1b,
Footnote 1
which embed the extra assumption that the ORF for all distractors is nearly the same. This reflects the desirable characteristics that (1) all distractors are equally attractive to examinees of any given ability and (2) all response options (i.e., the correct answer as well as all distractors) are equally attractive to examinees of very low ability. The IIF under the MCM is given by
 $$I({\rm{\theta }}) = \sum\limits_{m = 1}^{\rm{n}} {{{{{\left[ {\left( {{a_m}\,{f_m}{\rm{(\theta }}) + {a_0}\,{d_m}\,{f_0}{\rm{(\theta }})} \right)\,\sum\nolimits_{s = 0}^n {{f_s}{\rm{(\theta }})} - \left( {{f_m}{\rm{(\theta }}) + {d_m}\,{f_0}{\rm{(\theta }})} \right)\,\sum\nolimits_{s = 0}^n {{a_s}\,{f_s}{\rm{(\theta }})} } \right]}^2}} \over {\left( {{f_m}{\rm{(\theta }}) + {d_m}\,{f_0}{\rm{(\theta }})} \right)\,{{\left[ {\sum\nolimits_{s = 0}^n {{f_s}{\rm{(\theta }})} } \right]}^3}}}}$$
with
 ${f_m}({\rm{\theta }}) = \exp [{a_m}{\rm{\theta }} + {c_m}]$
and is plotted in the right panel of Fig. 1b along with the information functions for each response option. Despite separate consideration of distractors, the IIF in Fig. 1b is identical to that in Fig. 1a.
${f_m}({\rm{\theta }}) = \exp [{a_m}{\rm{\theta }} + {c_m}]$
and is plotted in the right panel of Fig. 1b along with the information functions for each response option. Despite separate consideration of distractors, the IIF in Fig. 1b is identical to that in Fig. 1a.
But not all items have equally attractive distractors. For instance, some options are on some items easily identifiable as distractors whereas others may be more attractive than the correct answer to examinees of low ability. Figure 1c shows an alternative MCM characterization, which holds if options 4 and 5 are hardly ever regarded as plausible answers whereas options 2 and 3 are more attractive than the correct answer to examinees of low ability. Note in the left panel of Fig. 1c that the ORF for the correct answer is still the same as that in Figs. 1a and 1b. Despite the change in distractor functioning, the resultant IIF (right panel of Fig. 1c) remains unchanged.
The properties illustrated in Fig. 1 hold whenever the distractor ORFs are monotone decreasing and regardless of the value of the 3PLM parameter c or the inclusion of a lapse parameter in the four-parameter extension of the 3PLM. In these cases the IIF arising from the MCM is identical to that arising from the 3PLM and, therefore, separate consideration of the distractors does not provide any additional information. Nevertheless, distractors with non-monotonic ORFs (not illustrated here) are also conceivable and those render authentic information gains. This feature is an empirical characteristic of the items and, in principle, an MCM characterization will render higher IIFs than a 3PLM characterization when distractor endorsement frequencies vary non-monotonically with ability.
Other polytomous models have also been used to characterize multiple-choice items. One of them is the NRM whose workings were assessed in the context of adaptive testing by De Ayala (Reference De Ayala1989, Reference De Ayala1992). In the NRM, the ORF for option k is given by
 $${p_k}({\rm{\theta }}) = {{\exp [{a_k}{\rm{\theta }} + {c_k}]} \over {\sum\nolimits_{m = 1}^n {\exp [{a_m}{\rm{\theta }} + {c_m}]} }},$$
with the constraint
 $\sum\nolimits_{k = 1}^n {{a_k}} = \sum\nolimits_{k = 1}^n {{c_k}} = 0$
and the IIF is given by
$\sum\nolimits_{k = 1}^n {{a_k}} = \sum\nolimits_{k = 1}^n {{c_k}} = 0$
and the IIF is given by
 $$I({\rm{\theta }}) = \sum\limits_{m = 1}^{\rm{n}} {{{{f_m}{\rm{(\theta }})\,{{\left[ {{a_m}\,\sum\nolimits_{s = 1}^n {{f_s}{\rm{(\theta }})} - \sum\nolimits_{s = 1}^n {{a_s}\,{f_s}{\rm{(\theta }})} } \right]}^2}} \over {\,{{\left[ {\sum\nolimits_{s = 1}^n {{f_s}{\rm{(\theta }})} } \right]}^3}}}} ,$$
where
 ${f_m}({\rm{\theta }}) = \exp [{a_m}{\rm{\theta }} + {c_m}]$
. An alternative characterization of the item in Fig. 1 under the NRM is not illustrated because the NRM cannot theoretically produce an ORF for the correct answer that has a non-zero lower asymptote and an upper asymptote at unity, as shown next. Let option 1 be the correct answer. An upper asymptote at unity requires a
1 > 0 and a
1 >> a
k
for all k ≠ 1 so that, from Equation 5,
${f_m}({\rm{\theta }}) = \exp [{a_m}{\rm{\theta }} + {c_m}]$
. An alternative characterization of the item in Fig. 1 under the NRM is not illustrated because the NRM cannot theoretically produce an ORF for the correct answer that has a non-zero lower asymptote and an upper asymptote at unity, as shown next. Let option 1 be the correct answer. An upper asymptote at unity requires a
1 > 0 and a
1 >> a
k
for all k ≠ 1 so that, from Equation 5,
 $\mathop {lim}\limits_{{\rm{\theta }} \to \infty } {p_1}({\rm{\theta }}) = 1$
. However, a
1 > 0 also produces a lower asymptote at zero because
$\mathop {lim}\limits_{{\rm{\theta }} \to \infty } {p_1}({\rm{\theta }}) = 1$
. However, a
1 > 0 also produces a lower asymptote at zero because
 $\mathop {lim}\limits_{{\rm{\theta }} \to - \infty } {p_1}({\rm{\theta }}) = 0$
. Then, the NRM can only roughly approximate a curve like that in the left panel of Fig. 1a at abilities beyond the lower-asymptotic regime, also failing to approximate accurately the shape of the ORFs for the distractors: By an argument analogous to the previous one, the ORF for one of the distractors under the NRM will be monotone decreasing with an upper asymptote at unity and a lower asymptote at zero.
$\mathop {lim}\limits_{{\rm{\theta }} \to - \infty } {p_1}({\rm{\theta }}) = 0$
. Then, the NRM can only roughly approximate a curve like that in the left panel of Fig. 1a at abilities beyond the lower-asymptotic regime, also failing to approximate accurately the shape of the ORFs for the distractors: By an argument analogous to the previous one, the ORF for one of the distractors under the NRM will be monotone decreasing with an upper asymptote at unity and a lower asymptote at zero.
In sum, any multiple-choice item that is adequately described by the 3PLM IRF must have an alternative characterization under the MCM such that the ORF for the correct answer is identical to the 3PLM IRF. In contrast, corresponding ORFs under the NRM must differ and their distorted shape may produce more favorable but spurious IIFs compared to those under the 3PLM or the MCM. This may explain the results reported by De Ayala (Reference De Ayala1989, Reference De Ayala1992) and the presumed capability of the NRM to extract information from incorrect responses at low abilities. The question that arises is whether the increase in information provided by the NRM applied to multiple-choice items is authentic or is instead an artifact of such distortions. At the same time, recourse to the MCM should not produce any gain in the conditions of Fig. 1 (i.e., with monotone decreasing distractor ORFs). The three studies presented next investigate these issues.
EMPIRICAL STUDY
The main goal of this empirical study is to look for evidence regarding how distractor endorsement frequencies vary across proficiency levels, with an eye toward determining whether or not the distractor ORFs are monotone decreasing for these items. A secondary goal is to obtain and compare alternative IRT characterizations of the items.
Data set
The data set comes from a 43-item knowledge test taken by 1090 students in an introductory economics course. The last option in each 5-choice item was ‘none of the above’ (NOTA), which was the correct answer on 11 items. The paper-and-pencil test was administered with instructions to answer all items and number-correct (NC) scores had been used for course grading.
Analysis
Score distributions and score statistics as well as major item statistics were computed. Option endorsement curves (empirical trace lines) were computed as a function of NC score with a sliding-window approach: The option endorsement frequencies at each NC score X were computed from aggregated data across examinees whose NC score was within three units of X. factor 9.2 (Lorenzo-Seva & Ferrando, Reference Lorenzo-Seva and Ferrando2006) was used to assess dimensionality. multilog 7.03 (du Toit, Reference du Toit2003) was used to estimate item parameters under three IRT models: the polytomous NRM and MCM and the dichotomous 3PLM. Default options were used except for the 3PLM, where a Gaussian prior with mean −1.4 and standard deviation 0.5 was imposed on the logit of pseudo-guessing parameters. Ability estimates were computed as the expected a-posteriori (EAP) value given the examinee’s responses and the estimated item parameters.
Results: Classical analysis and empirical trace lines
NC scores ranged from 9 to 41 with a mean of 24.26 and a standard deviation of 5.70. Cronbach’s alpha was .752, a mild value often found for multiple-choice tests. Inspection of item statistics revealed four items with very low or even negative item-total correlations and the difficulty index was below the chance level of .2 also for some items. The reasons underlying the deficient behavior of these items will be apparent in the empirical trace lines discussed next.
Figure 2 shows empirical trace lines for a subset of the items, including three of the suspect items mentioned in the preceding paragraph (Results for other items are available upon request). In principle, the empirical trace line of the correct answer is expected to increase with NC score (a proxy for the respondent’s ability) whereas distractor trace lines are expected to drop down to zero (monotonically or non-monotonically) with increasing NC score. As seen in Fig. 2, not all items fulfill these expectations.

Figure 2. Empirical trace lines for a subset of the 43 items in the test (panels). In each panel, each line joins the empirical proportion of times that a given option in the item was marked by respondents whose NC score is within 3 units of the nominal value at the abscissa. A star next to only one of the option labels in the insets indicates that this was the correct answer.
For instance, on item 1 low scorers seem attracted toward options 2 and 5 whereas option 4 seems unattractive to all scorers. The attractiveness of the NOTA option (option 5) slightly increases and then drops down, but it still remains relatively attractive to high scorers. In contrast, the attractiveness of the three other distractors drops down monotonically as ability increases. Monotone decreasing distractor trace lines are observed across the board and this was also the case for items not shown in Fig. 2.
Three of the suspect items (items 7, 15, and 33; see the bottom row of Fig. 2) have undesirable trace lines for other reasons. On item 7, the empirical trace line of the correct answer (the NOTA option) slowly increases with ability but one of the distractors is massively selected by all scorers and its trace line shows a mild positive slope. Item 15 displays an even less desirable pattern, with the trace line of the correct answer (the NOTA option) embedded amongst those of low-popularity distractors whereas the trace line of a very attractive distractor sharply increases with NC score. Finally, item 33 displays the equally undesirable characteristic that the trace lines for all response options are relatively flat, with two distractors being chosen more often than the correct answer except by the highest scorers. Item 33 seems an extremely difficult item with little psychometric value, whereas the scarce psychometric value of items 7 and 15 seems to lie in a confusing wording. Item 31 was the fourth suspect item, in which the trace line of the correct answer was relatively flat with a height around .6 whereas the trace lines for the distractors were also flat and similar in height to one another. Since the items had not been miskeyed, the test would be a better instrument without items 7, 15, 31, and 33. Although improving this test was not a goal here, these items were removed and all analyses repeated for the resultant 39-item test.
The skewness and kurtosis of the empirical distributions of item scores prompted the use of tetrachoric rather than product-moment correlations in the analysis of dimensionality. A factor analysis of the 39-item test indicated a good fit for the unidimensional solution (GFI = .92) whereas a two-dimensional solution did not result in a meaningfully better fit (GFI = .95) and instead resulted in a correlation of .621 between the two factors. In any case, the simulation studies reported later in this paper (where data were generated to be strictly unidimensional) reveal that the features of the IRT characterizations to be reported in the next section are not caused by the dimensionality of the data, even when multidimensionality may arguably be suspect.
In sum, empirical trace lines show that distractor endorsement frequencies are generally monotone decreasing functions, with non-monotonic curves observed at most for one option in exceptional items. Given that the smallest NC score on the test is 9, the shape of empirical trace lines in the NC range 0–8 remains unknown. Yet, wild guessing on this test yields a chance score of 8.6 and, then, the left end of the empirical trace lines in Fig. 2 can be regarded as revealing the asymptotic low-ability behavior of the putative ORFs. The conditions illustrated in Fig. 1 thus seem to hold for these items and, hence, MCM and NRM characterizations should not render higher IIFs and TIFs than a 3PLM characterization. This issue is addressed next.
Results: IRT analysis
Item parameter estimates from IRT analyses of the 39-item test did not differ meaningfully (if at all) from estimates in the IRT analysis of the original 43-item test. For this reason, model curves are described next for the original 43-item test, as this allows looking at model curves for the suspect items too. However, TIFs and ability estimates discussed later come from the 39-item test.
One would expect MCM and NRM to approximate the set of empirical trace lines shown in Fig. 2 through ORFs with suitable parameters, and the dichotomous 3PLM to approximate the empirical trace line of the correct answer through an IRF with also suitable parameters. One would also expect the three characterizations to render a similar ORF for the correct answer. Figures 3–5 respectively show the estimated ORFs under the MCM and NRM and the estimated IRFs under the 3PLM for the items in Fig. 2. It should be noted that the abscissa for the empirical trace lines in Fig. 2 is the NC score whereas the abscissa for the curves in Figs. 3–5 is the unobservable ability. Ability in IRT is monotonically but nonlinearly related to NC score and, hence, the horizontal axis in Fig. 2 and that in Figs. 3–5 differ only by a nonlinear distortion. This distortion further differs across fitted models, a well-known consequence of an arbitrary metric in the parameter estimation process which can nevertheless be equated post hoc. Equating is not necessary for our purposes here but it must be kept in mind that the shapes described by the ORFs or IRFs at the low end of the ability continuum in Figs. 3–5 may not reflect accurately the characteristics of the empirical trace lines at the low end of the NC score range in Fig. 2 due to the nonlinear distortion of the ability scale under each model. A comparison of empirical trace lines and fitted ORFs or IRFs must also consider that the latter can be drawn within any arbitrary range of ability levels whereas the range of empirical trace lies is limited to the observed range of NC scores. Thus, besides a nonlinear transformation of the horizontal axes, empirical trace lines and fitted curves should only be compared within the range dictated by the underlying relation between estimated ability and NC score (see Fig. 9 below).


On this proviso, the ORFs in Figs. 3 (MCM) and 4 (NRM) differ somewhat across models but their central parts describe reasonably well the paths of empirical trace lines (compare with Fig. 2). Yet, and almost invariably across items, the ORFs under these polytomous characterizations have features at the low-ability end that are not seen at the low-NC end in Fig. 2. Specifically, a large number of estimated distractor ORFs are non-monotonic under both models and many of the estimated ORFs for correct answers are also non-monotonic under the MCM. Since the data do not provide any evidence supporting this low-end behavior of the fitted ORFs (see Fig. 2), the low ends of the ORFs displayed in Figs. 3 and 4 seem to reflect only the outcomes of a flexible parameter estimation process and the unmatched ranges discussed at the end of the preceding paragraph. On the other hand, the 3PLM account (see Fig. 5) also seems adequate, although its IRFs also differ somewhat from the ORF for the correct answer under the MCM or NRM characterizations. It should be stressed that both polytomous models fitted the data approximately identically: With the 39-item test, the overall −2logL was 69,306 for the MCM and 69,684 for the NRM, with the minimally better fit of the MCM being a simple outcome of the flexibility gained by a larger number of free parameters per item (14 vs. 8). There were also no major differences across models as to how they fitted the data on an item-by-item basis, despite the differences in estimated ORFs that can be observed in Figs. 3 and 4. It should be remembered in this respect that the ORFs plotted in Figs. 3 and 4 cover a broader range of ability levels than the empirical data cover and that the models further differ in their mapping of ability to NC score as to linearity and range (see Fig. 9 below). Given this flexibility in accommodating the range and scale of the underlying ability scale, it should not be surprising that both polytomous models can fit the data approximately identically in quantitative terms. This is further illustrated in Fig. 6 for four sample items. Continuous curves are the fitted ORFs for each item under the MCM (left column) and NRM (right column) whereas symbols depict the empirical option endorsement frequencies as a function of the estimated ability of each examinee under each model. To prevent excess jaggedness, the ordinate of each data point is the average proportion endorsement of the corresponding option across examinees whose estimated ability (under the model of concern in each case) is within 0.15 units of the nominal ability at the abscissa of the point. Two aspects of these plots are worth pointing out. The first is that both models fit the data approximately equivalently, although through different ability estimates and with ORFs of different shapes; the second is that for neither model can the shapes of the ORFs be regarded as determined by the data below θ = −2, since there are actually no data there. For any given item, the ORFs arising from the two models are meaningfully different in this low-end region and, as will be seen later, the spurious characteristics of the ORFs in this region have strong implications on IIFs and the TIF.

Figure 6. Option response functions under the MCM (left column) and NRM (right column) characterizations of four sample items (rows) along with empirical option endorsement proportions (symbols) plotted as a function of the ability estimated for each examinee under each model. Each data point is the average endorsement proportion for examinees with abilities within 0.15 units of the nominal ability at the abscissa of each point.
More detailed goodness-of-fit analyses could be conducted for a final decision as to which model fits the data better in an absolute sense, or as to which one gives a more economical account considering the number of parameters in each model (e.g., through the AIC or the BIC). Many approaches exist to address this issue whose outcomes do not always select the model that generated the data because the performance of these methods varies with characteristics of the unknown reality underlying the data (Kang, Cohen, & Sung, Reference Kang, Cohen and Sung2009). Given the results in Figs. 2–6, all models seem equally tenable empirically and a final decision based on goodness-of-fit tests or model-selection approaches mistakes the goal of our analyses, which include also the simulation studies reported later in this paper and in which the underlying reality of the data is known. From the practical considerations that motivated this research, the issue is not which model fits the data a little better or somewhat more economically but which of alternative accounts that seem equally plausible empirically is more advantageous for the characterization of a test with an eye to estimating ability with greater precision. And this is where the arbitrarily estimated low ends of polytomous ORFs play a substantial role.
Figure 7 displays the estimated IIF for the items in Fig. 2 under each model. IIFs from the 3PLM generally lie under those arising from either polytomous model, which thus seem to extract more information at low ability levels. This seems only a result of estimated ORFs that are non-monotonic with peaks (or troughs) at low abilities (see Figs. 3 and 4) that are not backed up by the data (see Fig. 6). The effects add up across items and the implications at the overall test level are shown in Fig. 8a for the 39-item test: The TIF under the dichotomous (3PLM) characterization is inferior to those under the polytomous (MCM or NRM) characterizations at low ability levels, and the NRM characterization is inferior in this respect at high ability levels.

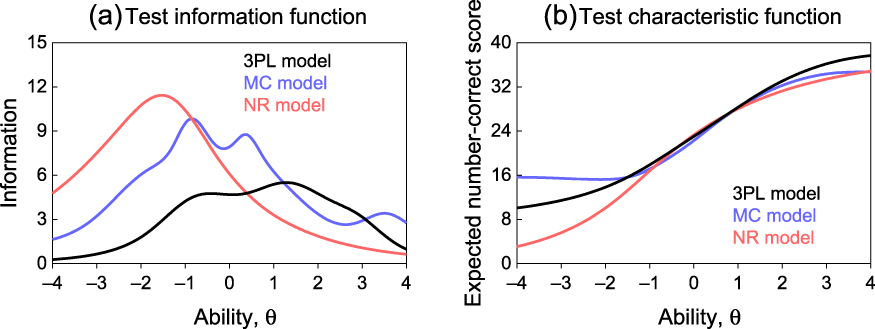
Figure 8. Test information function (a) and test characteristic function (b) under each of the three alternative characterizations of the 39-item test.
A higher TIF suggests that estimated abilities have lower SE via polytomous characterizations, but Fig. 8b shows that the test characteristic function only differs across models in the low-ability range, that is, where models differ as to their flexibility to produce non-monotonic shapes for ORFs. Figure 9 further suggests that the choice of model does not have major effects on ability estimation, as estimates from all models are tightly (though differently) related to NC scores. MCM estimates are slightly less so, mostly because they vary greatly according to which distractors were selected by low scorers (Thissen, Steinberg, & Fitzpatrick, Reference Thissen, Steinberg and Fitzpatrick1989). Ability estimates are also tightly related across characterizations (see Fig. 10). These features indicate that the only major difference across models is the accuracy with which ability has presumably been estimated (i.e., the SEs of ability estimates), with polytomous models nominally outperforming the 3PLM.
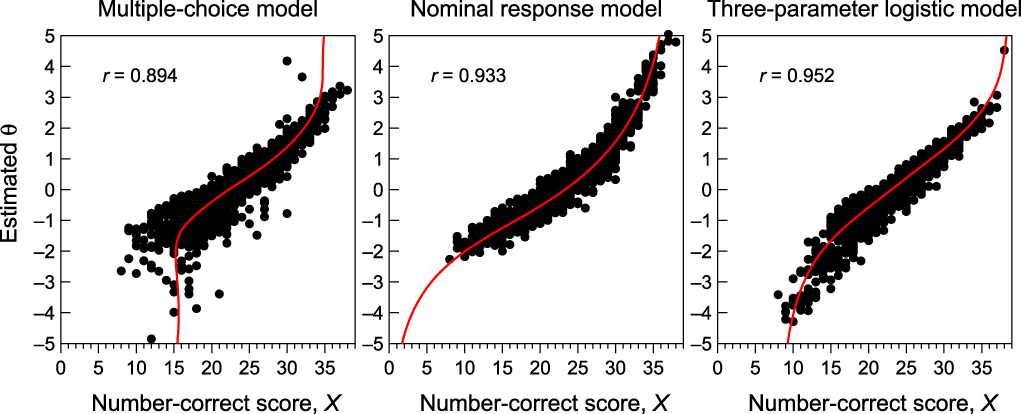
Figure 9. Scatter plot of (and correlation between) estimated ability and NC score under alternative characterizations of the 39-item test. In each panel, the red curve is the test characteristic function replotted from Fig. 8b. According to this, the three models fit the data adequately.

Figure 10. Scatter plots of (and correlations between) estimated abilities for all pairings of IRT models for the 39-item test. Data points are not scattered around the diagonal because ability estimates are not equated across characterizations and, thus, their distributions have different means and standard deviations.
In sum, the results of the NRM characterization of this empirical data set agree with those of De Ayala (Reference De Ayala1989, Reference De Ayala1992): Compared to the 3PLM characterization, the TIF is higher at low abilities and lower at high abilities. The MCM characterization produces an analogous outcome. These results arise from data for which the generating model and the true item characterization are unknown. The next two sections study the origin of these outcomes using simulated data for which the true ORFs, IIFs, and TIFs are known.
FIRST SIMULATION STUDY
This simulation study investigates the outcomes of fitting the NRM, MCM, and 3PLM to multiple-choice data generated to comply with the decreasing distractor ORFs illustrated in Fig. 1.
Method
To prevent estimation errors due to scarcity of data, a sample of 40,000 examinees was used whose ability θ was normally distributed with zero mean and unit variance. A 40-item multiple-choice test with five options per item was assumed in which the probability of a correct response was given by the 3PLM IRF in Equation 1. Item parameters were drawn from a uniform distribution on [0.59, 1.18] for a, from an also uniform distribution on [−2, 2] for b, and with a fixed value of .2 for c. A binary process governed by these IRFs determined whether a correct response would be given; if the response was incorrect, a polytomous extension (inspired by the nested approach of Suh & Bolt, Reference Suh and Bolt2010) determined which distractor was marked. A multinomial process was thus used such that the probability of selecting distractor i (1 ≤ i ≤ 4) was d
i
, with
 $\sum\nolimits_{i = 1}^4 {{d_i}} = 1$
. The set of d
i
parameters for each item was drawn so that no individual d
i
was below .03 or above .77. This process is analogous to that assumed in the illustration of Fig. 1, rendering ORFs that conform to both the 3PLM and the MCM. It can easily be seen that the IIF under this polytomous extension is identical to that under the 3PLM, which is the true IIF for each item in this study. The resultant data were analyzed as described above for the empirical data set.
$\sum\nolimits_{i = 1}^4 {{d_i}} = 1$
. The set of d
i
parameters for each item was drawn so that no individual d
i
was below .03 or above .77. This process is analogous to that assumed in the illustration of Fig. 1, rendering ORFs that conform to both the 3PLM and the MCM. It can easily be seen that the IIF under this polytomous extension is identical to that under the 3PLM, which is the true IIF for each item in this study. The resultant data were analyzed as described above for the empirical data set.
With this data generation process, the expectation is that MCM and 3PLM characterizations render analogous estimated IIFs and TIFs, as the conditions of Fig. 1 hold. In comparison, the NRM characterization is expected to produce a TIF that is higher at low abilities and lower at high abilities, as a result of estimated ORFs with a lower asymptote at zero for correct answers.
Results
The process by which the data were generated is strictly unidimensional but dimensionality was also confirmed statistically. Due to the large sample size, the uniform spread of difficulty, and exact conformity to the 3PLM, Cronbach’s alpha was .898. Figure 11 displays results for three representative items, revealing how misestimation of item parameters under polytomous models distorts estimated IIFs.

Figure 11. Illustrative results from the simulation study, showing empirical trace lines of sample items (a) as well as their 3PLM (b), MCM (c), and NRM (d) characterizations. In (b)–(d), the top row shows the true ORF for the correct answer as a dashed curve and the estimated IRF/ORFs as colored curves; the bottom row shows the true IIF as a dashed curve and the estimated IIF as a red curve. Continuous black curves in the top row of (b) show the true ORFs of the distractors in the generating model.
Empirical trace lines in Fig. 11a clearly identify an easy item (left column), an item of intermediate difficulty (center column), and a difficult item (right column). Note that the low end of the empirical trace lines does not reveal the known characteristics of the generating ORFs, namely, a lower asymptote at .2 for the correct answer and distractor ORFs that are flat on the left end and decrease monotonically as ability increases. This is not a result of the nonlinear mapping of ability onto NC score. In retrospect, trace lines in Fig. 2 (from nearly 40 times less data than here) could not have provided strong evidence of monotone decreasing ORFs even if they held.
As seen in Fig. 11b, the 3PLM characterization recovers item parameters adequately, as manifested in estimated IRFs (or IIFs) that are almost identical to the true IRFs (or IIFs). In turn, the MCM characterization (Fig. 11c) yields parameter estimates that very accurately reproduce the true ORFs in items of medium or high difficulty (center and right columns) and, hence, estimated IIFs are almost identical to the true ones. Yet, lack of empirical evidence as to what the left end of the ORFs of easy items should be like results in spurious parameter estimates that render the non-monotonic ORFs in the left column of Fig. 11c. As a result, the estimated IIF is bimodal with a notch at about θ = −2.3 for this item.
Finally, the NRM characterization (Fig. 11d) displays its inability to render non-zero lower asymptotes for the ORF of the correct answer. For easy items (left column), parameter estimates make the ORF of the correct answer much too steep, resulting also in a spurious overestimate of the IIF; for items of intermediate difficulty (center column), parameter estimates render ORFs of adequate steepness that nevertheless head for a zero lower asymptote, thus shifting down the estimated IIF; for difficult items (right column), estimated item parameters render very shallow ORFs that severely underestimate the IIF.
Quantitatively, the fit of the polytomous models was almost identical at the overall level, with −2logL valued at 2,621,242 for the MCM and 2,626,203 for the NRM. No differences in goodness of fit could be observed across models at the item-by-item level either. This is again understandable despite the resultant differences in the shape of estimated ORFs, for the reason illustrated in Fig. 6. As a result, the parameter-estimation process produces estimated ORFs that are only constrained within the central and upper regions of the ability range, allowing the fitted ORFs to display any convenient shape at the low end without compromising the fit to the data.
These results show that the MCM and NRM characterizations overestimate the IIFs of easy items and that the NRM characterization also underestimates the IIF of difficult items. With 40,000 examinees, these outcomes cannot be regarded as problems arising from the use of small samples. Consequences at the overall test level can be seen in Fig. 12a once the different ability metrics underlying each fit have been equated. Footnote 2 Compared to the true TIF, the estimated TIF arising from the 3PLM characterization is identical, that arising from the MCM characterization slightly underestimates the TIF in the low-ability range due to the artifactual notch in the IIF of easy items (see Fig. 11c), and the NRM characterization greatly overestimates the TIF at low abilities and underestimates it at intermediate and high abilities. The presumed SE of ability estimates is correspondingly affected, although test characteristic functions are again similar across models except at very low abilities (see Fig. 12b) and the relation between estimated and true ability is almost identically tight across characterizations (see Fig. 13).
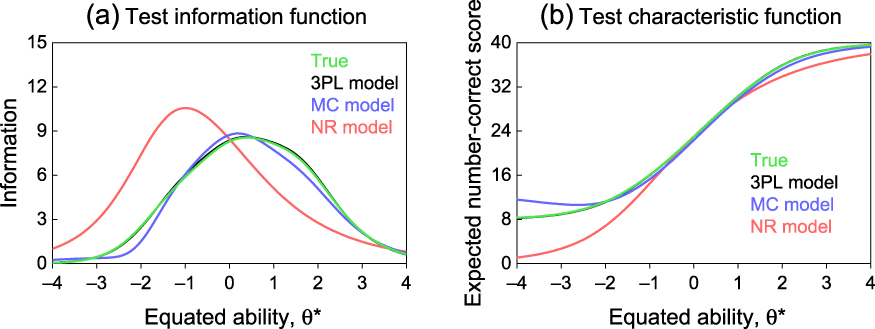
Figure 12. Test information function (a) and test characteristic function (b) under each of the three alternative characterizations of the 40-item test in the first simulation study.

Figure 13. Scatter plot of (and correlation between) estimated and true ability under alternative characterizations of the 40-item test in the first simulation study.
SECOND SIMULATION STUDY
The preceding simulation used items that exactly conform to the 3PLM and MCM with monotone decreasing distractor ORFs. Results confirmed the hypotheses that the MCM characterization does not outperform the 3PLM characterization in these conditions and that the NRM characterization renders an estimated TIF that is spuriously higher at low abilities and spuriously lower at high abilities. The study reported next used items that conform exactly to the MCM but not necessarily to the 3PLM, and removed the constraint of monotone decreasing distractor ORFs.
Method
Item responses under the MCM were generated for items with parameters taken from the MCM characterization of the empirical data reported above. As discussed earlier, estimates for some items rendered ORFs that displayed strong non-monotonic behaviors not backed up by empirical trace lines (see, e.g., items 12, 16, and 17 in Figs. 2 and 3). Parameters from items 12, 16, 17, and 23 were excluded from the simulation for this reason and data were generated for the remaining 39 items. Removal of these four items still kept non-monotonic distractor ORFs within and across the remaining items. This set of item parameters may not be strictly realistic, but no other approach to generating MCM item parameters seems available. In any case, this strategy has been used in other studies (e.g., Abad, Olea, & Ponsoda, Reference Abad, Olea and Ponsoda2009) and also servers our purposes here.
Results
Data were analyzed as described for the preceding simulation but most graphical results are omitted in this description. The NRM characterization showed the same misbehavior illustrated in Fig. 11d for the preceding simulation: spurious overestimation of the IIF of easy items, downward shift of the IIF of items of intermediate difficulty, and underestimation of the IIF of difficult items. The 3PLM characterization underestimated the IIF of items of low and moderate difficulty, surely due to the fact that the true ORF of the correct answer could not be well approximated by a logistic IRF. And, naturally, the MCM characterization was the most accurate across the board although it rendered parameters that slightly misrepresented the non-monotonicity of the true ORFs and occasionally resulted in a slight underestimation of the IIFs at low abilities. Figure 14a shows the consequences on the estimated TIFs. Only the MCM characterization reproduced the true TIF except for a minor underestimation at low abilities; the 3PLM characterization missed actual information provided by the choice of distractors (given the non-monotonic ORFs) at low abilities; and the NRM characterization again rendered the only type of TIF that this model can produce. As was the case in the preceding simulation, test characteristic functions were similar across models except at low abilities (see Fig. 14b) and the relationship between true and estimated ability was also similarly tight across models.
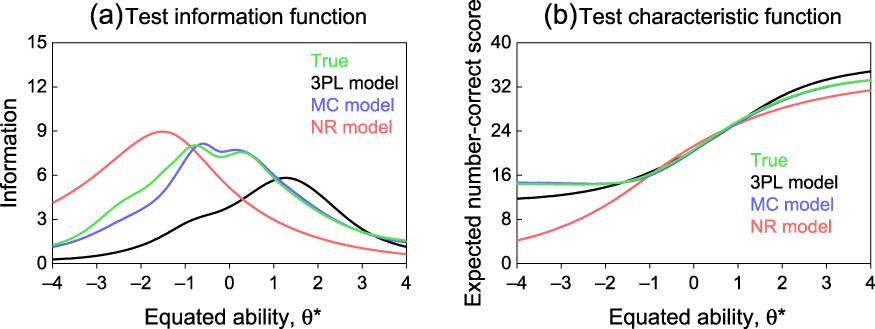
Figure 14. Test information function (a) and test characteristic function (b) under each of the three alternative characterizations of the 39-item test in the second simulation study.
Discussion
Summary of results
The empirical study presented here rendered results analogous to those reported by De Ayala (Reference De Ayala1989, Reference De Ayala1992) in that the TIF arising from the NRM fit was superior to that provided by a 3PLM fit at low ability levels, although it was inferior at intermediate and high ability levels. The MCM had not been used before in a similar comparison but results from the analysis of this data set show an analogous trend (see Fig. 8a). The empirical study also showed that distractor endorsement frequencies are generally monotone decreasing functions, in contrast to what estimated ORFs from MCM and NRM tend to be. This characteristic of parameter estimates from polytomous models seems responsible for the apparent gain in the information they extract.
Simulation studies investigated this behavior in two cases: when distractor ORFs are monotone decreasing and when they are not. In both cases, the NRM rendered a spurious overestimation of the IIF of easy items and an also spurious underestimation of the IIF of difficult items. Both types of misestimation are a consequence of the inability of the NRM to reproduce an ORF for the correct answer with a non-zero lower asymptote. For the MCM and the 3PLM, the empirical results were not fully reproduced in the simulations: Given sufficient data (40,000 examinees) and distractor ORFs that are monotone decreasing (first simulation study), the MCM characterization only results in a slight misestimation of the TIF that otherwise does not show any advantage over the accurate TIF estimated through the 3PLM; when the generating distractor ORFs are non-monotonic (second simulation study), the MCM misestimates the true TIF minimally at low abilities whereas the 3PLM severely underestimates it at low and intermediate abilities.
With respect to our main goal here, the NRM is inappropriate for multiple-choice items for which the probability of a correct response asymptotes meaningfully above zero at low abilities, as is usually the case. As regards a choice between the 3PLM and the MCM, the latter seems more appropriate because it can theoretically accommodate items for which the distractor ORFs are monotonic or non-monotonic whereas the 3PLM is only appropriate for items with monotone decreasing distractor ORFs. This conclusion needs some qualification, as discussed next.
Adequacy of the MCM
Reliance on the theoretical flexibility just described for routine adoption of the MCM in the calibration of multiple-choice items faces some difficulties. Parameter estimation under the MCM is known to be problematic (Abad et al., Reference Abad, Olea and Ponsoda2009; Thissen et al., Reference Thissen, Steinberg and Fitzpatrick1989) and it is not at all clear that estimated non-monotonic ORFs reveal actual characteristics of the items in this respect. As discussed above, empirical trace lines in our empirical data (see Fig. 2) hardly ever showed clear evidence of non-monotonicity and yet the MCM generally estimated non-monotonic ORFs (see Fig. 3). The reality underlying our empirical data is unknown, but ORFs might truly be monotone decreasing; yet, weak empirical evidence to this effect (due to few low-proficiency examinees in the sample) and too much flexibility in parameter estimation probably cooperate to routinely render non-monotonic ORFs under an MCM characterization. Data from our first simulation study permit assessing this surmise, as those data were generated from monotone decreasing ORFs. Results in Fig. 12a may seem to indicate that the surmise is wrong, but those results come from a sample of 40,000 examinees. The analysis was thus repeated with a subset of 1,090 examinees (the same number as in our empirical study) and the MCM estimated ORFs with pronounced non-monotonicities in almost all items. The consequences at the overall test level are shown in Fig. 15a: The MCM grossly overestimates the true TIF at low abilities (as does the NRM, although this is not news) whereas the 3PLM still estimates the true TIF adequately despite the relatively small sample size (compare with Fig. 12a). But, again, test characteristic functions are very similar across models except at low abilities (see Fig. 15b), and estimated ability is also about equally tightly related to true ability for all models. A further re-analysis now using data from 3000 examinees produced the same outcome and only when sample size exceeded 5000 did the estimated TIF from the MCM start to resemble the true TIF.

Figure 15. Test information function (a) and test characteristic function (b) under each of the three alternative characterizations of the 40-item test in the first simulation study when data from only 1090 examinees were used.
These results indicate that the outcomes of fitting the MCM to a data set of the usual size should be taken cautiously, as there is always the risk of spuriously overestimating IIFs and TIFs due to what seems to be a tendency of the MCM to estimate non-monotonic ORFs. With a sufficiently large sample (as in our simulation studies), data can indicate whether or not the estimated ORFs should be monotone decreasing, but the size that the sample should have to achieve this goal surely varies with true item parameters and across ability distributions. Dependable MCM parameters for real items do not seem to have been reported, which is a pre-condition for simulation studies aimed to determine the conditions that prevent an MCM characterization from rendering artifactual IIFs and TIFs.
Other polytomous models for multiple-choice items
Other IRT models for multiple-choice items have been recently proposed (e.g., Abad et al., Reference Abad, Olea and Ponsoda2009; Bolt, Cohen, & Wollack, Reference Bolt, Cohen and Wollack2001; Bolt, Wollack, & Suh, Reference Bolt, Wollack and Suh2012; Revuelta, Reference Revuelta2004, Reference Revuelta2005, Reference Revuelta2010; San Martín, del Pino, & De Boeck, Reference San Martín, del Pino and De Boeck2006; Suh & Bolt, Reference Suh and Bolt2010). Some of these models share with the NRM the structural feature that the ORF for the correct answer has a lower asymptote at zero and, hence, their incapability to reflect the non-zero lower asymptote of multiple-choice items makes them theoretically unfit. Then, use of those models with multiple-choice items will incur the same misestimation of IIFs described here for the NRM, giving the impression that they extract information from incorrect responses. Yet, some of these new models can indeed accommodate a non-zero lower asymptote in the ORF of the correct answer and, hence, they may render realistic IIFs potentially superior to those arising from the 3PLM. Before studies are carried out to address these comparisons, it is worth commenting on one of these models.
Suh and Bolt (Reference Suh and Bolt2010) proposed a nested multiple-choice model in which the ORF of the correct answer is given by the 3PLM function whereas the ORFs of the distractors arise from an NRM-like split of the undifferentiated “incorrect” category in the 3PLM. Footnote 3 They also derived the IIF to be the sum of the IIF under the 3PLM plus the sum of the distractor information functions. By definition, then, and unless item parameters are such that the distractors do not contribute any information whatsoever, the IIF under this model is no smaller than the IIF under the 3PLM for the same item. It should be noted, however, that their definition differs from the conventional definition in which the IIF is the weighted sum of the contributions from each option, where the weights are the ORFs. Clearly, the IIFs should be defined analogously for a fair comparison of alternative models for multiple-choice items.
Conclusion
Characterization of multiple-choice items under the MCM or the NRM does not necessarily extract authentic information from incorrect responses, as the appearance that these models do so (via higher TIFs) can be a spurious consequence of either parameter estimation errors due to insufficient data (under the MCM) or the inadequacy of the model ORFs (under the NRM). An adequate polytomous model for multiple-choice items would nevertheless be advantageous for items with non-monotonic ORFs. In the absence of evidence to this effect, the presumed gain in IIF and TIF via polytomous characterizations must be taken with caution, as this may simply be a spurious outcome. Inspection of empirical trace lines in search for evidence of non-monotonic ORFs seems a good starting point for the analysis of large data sets in calibration studies.
The analyses reported here belong in the context of fixed-length testing, which is indeed the context in which items are calibrated for subsequent use in adaptive testing. With a calibrated item pool, adaptive testing proceeds by sequentially selecting and administering the most informative item at the current estimated ability. Adaptive testing thus relies heavily on the adequacy and accuracy of the IIFs obtained in the calibration stage. The results reported here are relevant in this context because the use of a polytomous calibration that is affected by the problems discussed here will result only in an apparent increase in the precision of ability estimates, as the higher IIFs and accompanying smaller SEs of ability estimates will be artifactual and fictitious.
This research was supported by grants PSI2009–08800 from Ministerio de Ciencia e Innovación (Spain) and PSI2012–32903 from Ministerio de Economía y Competitividad (Spain).


