Introduction
The demand for renewable energy sources to reduce the use of fossil fuels and to diversify the energy generation matrix is an aspect of fundamental importance for sustainability and economic growth (Silva et al., Reference Silva, Pires, Ribeiro, Machado, Blain and Ohashi2016).
Sugarcane (Saccharum officinarum L.) constitutes one of the most important crops in Brazil (Martini et al., Reference Martini, de Aragão, Sanches, Galdos, da Silva and Dalla-Nora2018), due to its value for sugar production and as a renewable energy source for ethanol production (biofuel), as well as for co-generation of electricity. For these reasons, sugarcane cultivation is expanding to new frontiers and there is a constant demand for higher yields. In this context, the breeding programme for genetic improvement of sugarcane from the Interuniversity Network for the Development of the Sugar-Alcohol Sector (RIDESA, 2010) has developed Republic of Brazil (RB) varieties for the cultivation characteristics found in Brazil, increasing agri-business revenue (Santos et al., Reference dos Santos, Duarte Filho, Soriano, da Silva, Nascimento, Barbosa, Todaro, Ramalho Neto and Almeida2012).
Current methods for identification of specific sugarcane varieties are limited to genomic analyses and visual discrimination. Although only small samples are typically required for genomic analyses, the analytical equipment and expertise needed are considerable, and genomic assessment of intron variability can lead to further complications in the discrimination process (Johnson et al., Reference Johnson, Viator, Veremis, Richard and Zimba2008; Santiago et al., Reference Santiago, Pereira, de Souza, Steindorff, Cunha, Gaspar, Fávaro, Formighieri, Kobayashi and Molinari2018). On the other hand, visual discrimination is possible with trained staff, but the results vary with personnel and location due to differences between plants of different ages and to distinct agricultural practices associated with, among others, soil fertilization and irrigation, sun exposure and dry leaf removal.
Visible/near infrared (Vis/NIR) spectroscopy, coupled with multivariate methods, has allowed the development of fast and reliable routine analyses in many fields, including agriculture, food, petrochemicals and pharmaceuticals. In general, these analyses have considerable advantages over traditional methodologies including cost, throughput, non-destructive sample preparation and analysis, as well as risk reduction where potentially dangerous chemicals and/or procedures are involved (Su et al., Reference Su, He and Sun2017).
Past studies have investigated the use of Vis/NIR hyperspectral data acquired using satellites to discriminate sugarcane varieties (Galvão et al., Reference Galvão, Formaggio and Tisot2005; Fortes and Demattê, Reference Fortes and Demattê2006; Everingham et al., Reference Everingham, Lowe, Donald, Coomans and Markley2007). With the same purpose, Johnson et al. (Reference Johnson, Viator, Veremis, Richard and Zimba2008) evaluated the potential of hyperspectral reflectance and pigment data by proximal sensing of leaves. Despite combining multivariate methods and spectral indices, most of these studies reported difficulties in differentiating sugarcane varieties and evaluating the spectral signatures of whole plants and leaves. More recently, spectroscopic techniques have been applied for estimating sugarcane yields and mapping sugarcane planting areas (Zhou et al., Reference Zhou, Huang, Wang, Zhang, Kuang, Zhong and Song2015; Carvalho et al., Reference de Carvalho, de Morais, de Lima, Júnior, Nascimento, de Faria and de Almeida Teixeira2016; Verma et al., Reference Verma, Garg and Prasad2017).
The present work aimed to classify four Brazilian sugarcane varieties using Vis/NIR spectral reflectance measurements of stalks and multivariate statistical methods (principal component analysis (PCA), factorial discriminant analysis (FDA), stepwise forward discriminant analysis (SFDA) and partial least-squares discriminant analysis (PLS-DA)) not yet evaluated in previous studies. The sugarcane stalk was selected due to its importance for varietal identification (Wagih et al., Reference Wagih, Musa and Ala2004; Cheavegatti-Gianotto et al., Reference Cheavegatti-Gianotto, de Abreu, Arruda, Bespalhok Filho, Burnquist, Creste, di Ciero, Ferro, Figueira, Filgueiras, Grossi-de-Sá, Guzzo and Hoffman2011) and has not been used in previous scientific studies.
Materials and methods
Sugarcane cultivation
Sugarcane plants (S. officinarum L.) were cultivated inside a non-acclimatized greenhouse located at the Agricultural Meteorology Experimental Station (20°45′45″S, 42°52′04″W, 690 m a.s.l.), which is part of the Agricultural Engineering Department at the Federal University of Viçosa, State of Minas Gerais, Brazil. According to Köppen classification, the local climate is Cwa (warm temperate – mesothermal), with dry winter and rainy summer (Kottek et al., Reference Kottek, Grieser, Beck, Rudolf and Rubel2006).
The greenhouse structure was a Quonset frame (7 × 15 m floor area and 3.5 m height) built with galvanized structural steel tubing and covered with a transparent polyethylene film (150 µm). The arches were spaced 2.5 m on centre and supported on concrete posts 2 m high at the sidewalls. The greenhouse was oriented with the ridge running east to west. A white plastic insect screen made from high-density polyethylene (thread and opening sizes of 0.28 and 1.00 mm, respectively) was used on the sidewalls to allow natural ventilation while protecting the plants from insects, enabling pesticide-free production.
The experiment was carried out with four Brazilian sugarcane varieties: RB867515, RB855453, RB928064 and RB92579 (Fig. 1). The agronomic and morphological features of the sugarcane varieties, adapted from RIDESA (2010), are presented in Table 1.
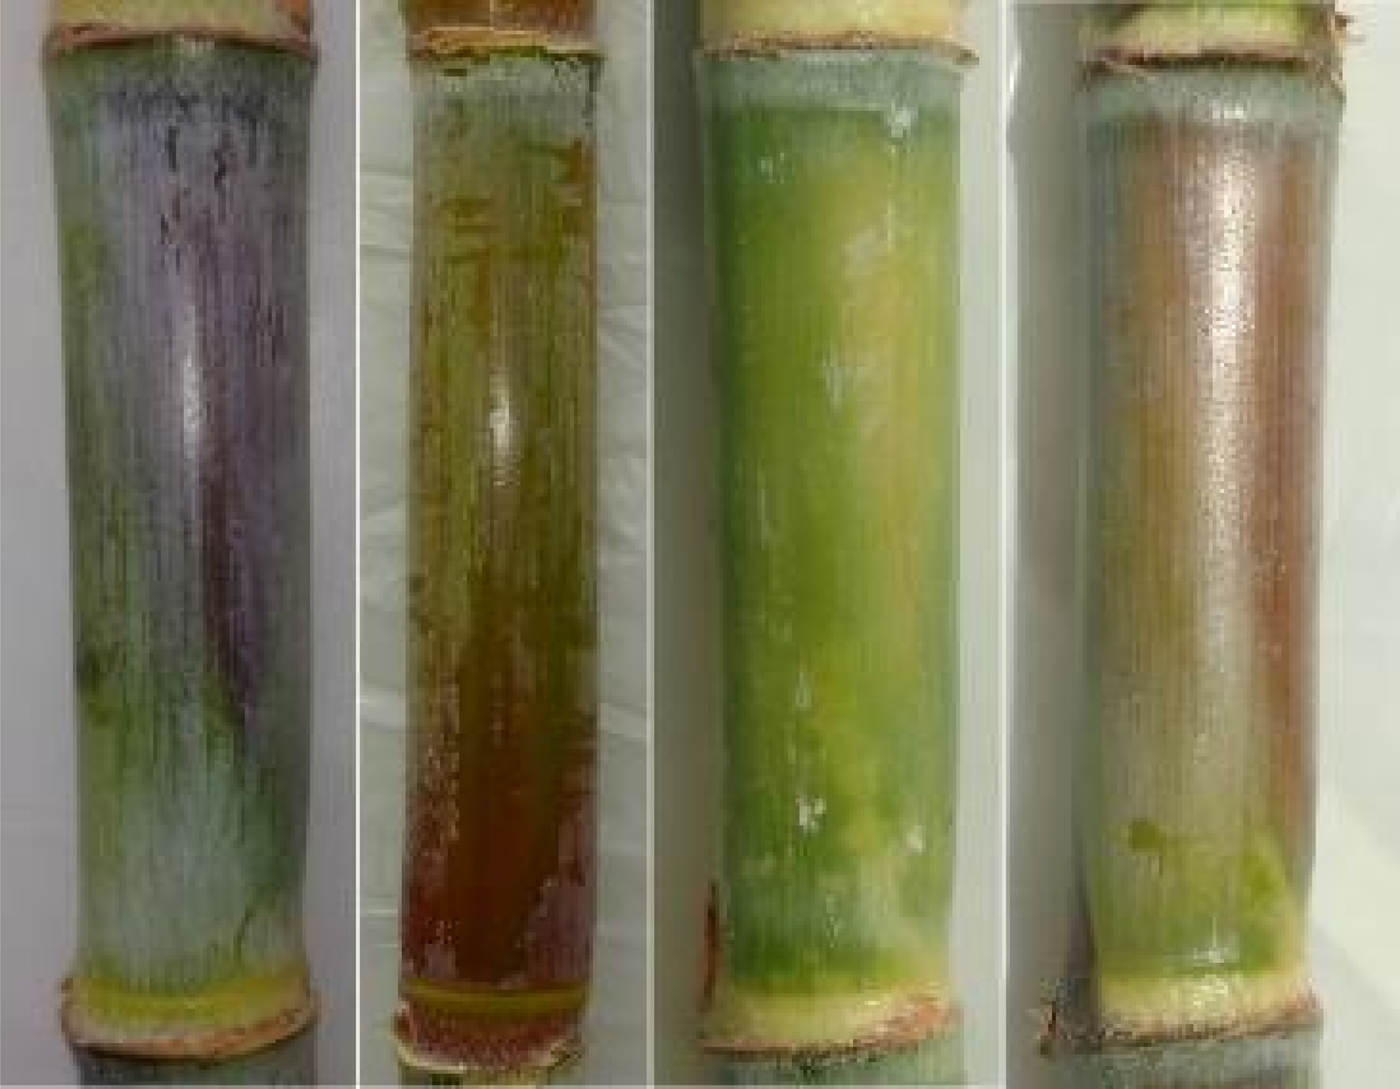
Fig. 1. (Colour online) Stalks of the Brazilian sugarcane varieties (from left to right: RB867515, RB855453, RB928064 and RB92579).
Table 1. Agronomic and morphological features of the Brazilian sugarcane varieties

Visual inspection does not allow reliable discrimination between RB867515, RB855453 and RB92579, since these varieties all present purplish stalks under exposure to sunlight (Fig. 1), as well as similar morphological and agronomic features (Table 1). Although RB928064 presents green-yellowish stalks when exposed to solar radiation, visual confusion can occur when the other three varieties have not been exposed to solar radiation or when they present stalk wax.
Billets of the four varieties were planted in a substrate composed of pine bark, wood sawdust, coconut fibre, rice hulls and vermiculite (Bioplant Prata, Bioplant, Nova Ponte, Minas Gerais, Brazil). Plastic pots with volumetric capacity of 15 litres were used to accommodate the substrate, whose physical properties were 5.7 pH, 0.8 dS/m electrical conductivity and 260 g/l dry apparent density. A hole was drilled in the bottom of each pot to allow leachate drainage and the pots placed over polypropylene troughs with longitudinal slope of 4%. The superior surface of the troughs had holes spaced 0.5 m apart to receive leachate from the pots. Two billets of the same variety were germinated in each pot, but only the vigorous and healthy plant was cultivated. During the sugarcane growth period, all young emerging shoots were pruned.
Sugarcane plants were fertigated with a nutrient solution prepared by diluting two stock solutions A and B (50 times concentrated) in equal proportions (1:1) into a 100 litres water reservoir to obtain an electrical conductivity of 3 dS/m. Stock solution A was prepared with calcium nitrate and potassium nitrate. Stock solution B was prepared with monoammonium phosphate, magnesium sulphate and potassium chloride, as well as micronutrients (copper sulphate, zinc sulphate, manganese sulphate, boric acid, sodium molybdate and iron chelate). The nutrient solution concentration was monitored by a portable conductivity meter (CDH-42, Omega, Stamford, Connecticut, USA) with temperature compensation.
The nutrient solution was applied to the crop by a drip irrigation system with 32 W fertigation pumps commanded by a microcontroller board (Duemilanove, Arduino, Ivrea, Turin, Italy) connected to an electromechanical relay board (LRT-R04DR, LR Informática Industrial, Porto Alegre, Rio Grande do Sul, Brazil). In this experiment, fertigation events were established to maintain the water matrix potential in the substrate between field capacity and −10 kPa.
The experiment consisted of 192 plants disposed in 32 rows. Each plant row was composed of six pots spaced 0.5 m apart. However, 80 plants were effectively evaluated as experimental units according to a completely randomized design in a double factorial arrangement. The other plants were cultivated for boundary effects. The number of plants of each variety was identical.
Stalk reflectance measurements
At 163 days after planting, 12 experimental units of each variety were randomly selected for field spectroscopy measurements, totalizing 48 sugarcane stalks.
Spectral reflectance was measured with a portable spectrometer (JAZ-EL350, Ocean Optics, Dunedin, Florida, USA) coupled to a tungsten–halogen light source. The spectrometer was pre-configured to acquire and store reflectance data (450–1000 nm range) into a memory card, with a spectral resolution of 1.3 nm. A reflection probe (R400-7-VIS-NIR, Ocean Optics) was used to emit light onto the sugarcane stalks and collect the reflected light. This probe is a bifurcated optical fibre assembly (Y type) composed of two fibres of same diameter (400 µm), connected to the spectrometer and light source. The other extremity of the probe was inserted in a holder of anodized aluminium and vertically positioned at 90° in relation to the stalks. A high-reflectivity specular reflectance standard (STAN-SSH, Ocean Optics) was used as a reference to measure spectral reflectance.
The reference standard measurements were made before the spectral reflectance measurements in sugarcane stalks and after the light source warmed up. Reflectance values were calibrated by a software (OceanView, Ocean Optics) and expressed as a relative percentage of the reference standard (Steidle Neto et al., Reference Steidle Neto, Toledo, Zolnier, Lopes, Pires and da Silva2017):
 $$R_\lambda ^{{\rm cal}} = \left( {\displaystyle{{R_\lambda ^{{\rm leaf}} - R_\lambda ^{{\rm dark}}} \over {R_\lambda ^{{\rm ref}} - R_\lambda ^{{\rm dark}}}}} \right)\;100$$
where  $R_\lambda ^{{\rm cal}} $ is the calibrated spectral reflectance from the stalks (%),
  $R_\lambda ^{{\rm leaf}} $ is the original spectral reflectance from the stalks (dimensionless),
  $R_\lambda ^{{\rm dark}} $ is the spectral reflectance considering light absence (dimensionless) and
  $R_\lambda ^{{\rm ref}} $ is the spectral reflectance from the diffuse reflectance standard (dimensionless). The spectral reflectance considering light absence was obtained by obstructing the light input at the holder.
Before spectral reflectance measurements were taken, two marks were made along each stalk length (dividing it into three equal areas) with the purpose of standardizing the data acquisition. Three measurements were performed in the centre of each divided area, totalizing 432 spectral signatures when considering the 48 stalks. Data were transferred and processed by an electronic worksheet and an average spectral signature was obtained for each sugarcane stalk area, totalizing 144 spectra that were used in the spectral analysis.
Multivariate methods
Principal component analysis, FDA, SFDA and PLS-DA were used to classify the sugarcane stalks according to the variety. Ballabio and Todeschini (Reference Ballabio, Todeschini and Sun2009) and Misaki et al. (Reference Misaki, Kim, Bandettini and Kriegeskorte2010) affirmed that many different techniques can be used for classification purposes, but the discriminant and multivariate methods are more attractive due to their simplicity and lower computational efforts. Each of these methods has its own algorithm tuned for best discrimination.
Principal component analysis was performed before supervised discriminant analysis to derive the first principal components from the spectral data and to examine the possible grouping of samples, also detecting spectral outliers. Principal component analysis is an unsupervised pattern recognition method that transforms the original data into new variables, called principal components, which are orthogonal and uncorrelated (Bro and Smilde, Reference Bro and Smilde2014). This statistical multivariate method is useful for separating samples according to their common spectral characteristics, which is achieved by determining a smaller dimension hyperplane on which the points will be projected from the higher dimension (Berrueta et al., Reference Berrueta, Alonso-Salces and Héberger2007). It has been used widely to observe similarities among different samples, reducing the data dimensionality while keeping most of the original information (Karoui et al., Reference Karoui, Dufour and De Baerdemaeker2007; Li and He Reference Li and He2008).
In the current study, PCA was performed on the sugarcane spectral reflectance values following procedures proposed by Saporta (Reference Saporta2006), where the original data matrix was decomposed into score, loading and residual matrices. Loading matrix represented the correlation of the original variables with the principal components, while residuals meant the part of data that were not explained by the PCA model. Score matrix represented the relationship between the principal components and the original data, indexing the magnitude of principal components for each observed sample value.
Factorial discriminant analysis, SFDA and PLS-DA are supervised methods, meaning that the number of categories and the samples that belong to each category are defined previously (Ballabio and Todeschini, Reference Ballabio, Todeschini and Sun2009).
Among the objectives that can be assigned to FDA method are the determination of the most discriminative variables with regard to specific category and the determination of the category of a sample based on its spectral signature (Bourennane et al., Reference Bourennane, Couturier, Pasquier, Chartin, Hinschberger, Macaire and Salvador-Blanes2014). According to Berrueta et al. (Reference Berrueta, Alonso-Salces and Héberger2007), this is the most frequently used supervised pattern recognition method, differing from the PCA in that FDA selects a direction that achieves maximum separation among the given classes. In the current study, FDA assessed new variables (discriminant factors) that were linear combinations of selected principal components resulting from the PCA analysis, allowing a better separation of the centres of gravity of the considered classes (Devaux et al., Reference Devaux, Bertrand, Robert and Qannari1988).
Stepwise forward discriminant analysis has also been adopted for spectrometer-driven discrimination in different research fields (Martínez-Pinilla et al., Reference Martínez-Pinilla, Guadalupe, Ayestarán, Pérez-Magarino and Ortega-Heras2013; Giambanelli et al., Reference Giambanelli, Ferioli, Koçaoglu, Jorjadze, Alexieva, Darbinyan and D'Antuono2014). The main difference between SFDA and the other methods is that its algorithm applies a threshold to add a new discriminant factor based on the PCA analysis (Bertrand et al., Reference Bertrand, Courcoux, Autran, Meritan and Robert1990), which in the current study was one divided by the number of classes. Wanitchang et al. (Reference Wanitchang, Terdwongworakul, Wanitchang and Nakawajana2011) affirmed that SFDA selects the discriminant factors by retaining statistically significant variables and removing insignificant ones.
Partial least-squares discriminant analysis is another well-known method that assigns an unknown sample to one of the available classes based on its spectral signature. Berrueta et al. (Reference Berrueta, Alonso-Salces and Héberger2007) noted that this method is suitable for data sets with high degree of inter-correlation between the independent variables. In the current study, PLS regular regression methods were used for performing discriminant analysis, as proposed by Ballabio and Consonni (Reference Ballabio and Consonni2013). For this, a Y matrix was constructed, consisting of four columns associated with the sugarcane varieties and many lines as there were spectra. Each spectrum was considered an observation and had the value 1 for the class it belongs to and 0 for the others. Another matrix, called X, consisted of the original data. In contrast to PCA, both X and Y matrices were decomposed in score, loading and residual matrices. Thus, a model was developed for each class and the closer an observation of a certain column in Y was to 1, the more likely it was considered a member of a particular variety. This procedure guaranteed that observations were always classified in one of the available classes. During the model development, data reduction was conducted seeking discriminant factors, which were linear combinations of the original variables, and were calculated in a way to maximize the covariance with the available classes.
Spectra were pre-treated by centring, normalization and second-order derivative prior to PCA, FDA, SFDA and PLS-DA analyses. Preliminary tests indicated that these pre-treatments were best for obtaining lower discrimination errors, also improving the accuracy of the models. According to Moscetti et al. (Reference Moscetti, Haff, Stella, Contini, Monarca, Cecchini and Massantini2015), centring is capable of improving classification accuracy for most of the discriminant methods by enhancing the differences between spectra. Normalization was performed for adjusting the spectral data from the different groups (varieties) to an identical baseline. Yuan et al. (Reference Yuan, Huang, Loraamm, Nie, Wang and Zhang2014) reported that this pre-treatment facilitates subsequent spectral analysis and comparisons in discrimination purposes. Centring and normalization were calculated following the procedures recommended by Martens and Naes (Reference Martens and Naes1992). The second-order derivative allowed the correction of additive and multiplicative effects in the spectral data, which appear due to physical effects and result in non-uniform scattering throughout the spectrum (Cozzolino et al., Reference Cozzolino, Cynkar, Shah and Smith2011). The derivative was calculated by the Savitzky–Golay method (Savitzky and Golay, Reference Savitzky and Golay1964) with 25 derivative points (window for calculation). The algorithms of the pre-treatments were included in the SCILAB software (Scilab Enterprises, Versailles, France), which was also employed for all calculations required by the multivariate and discriminant methods.
Two-thirds of the samples (24 spectra of each variety, totalling 96 spectra) were used as the calibration and cross-validation data set and one-third (12 spectra of each variety, totalling 48 spectra) as the external validation data set. This sampling plan followed the recommendation by Kramer (Reference Kramer1998) to ensure data set representativeness. The number of samples used in the calibration process corresponded to more than ten times the number of variable components in the experiment (variety). Each component was considered as an independent source of variation in the data.
During the calibration with cross-validation, some samples were left out from the model fit and used for discriminating the varieties based on the calibrated model. Then, prediction residuals were calculated and the process was repeated with another sub-set of the calibration data set, until every sub-set was left out once. All prediction residuals were combined, so that the final model was that with the lower prediction residual. This model was then used with the external validation data set, and independent discriminations were performed.
The PCA results were visualized with the score plot of the first two principal components aiming to provide the most efficient two-dimensional representation of the sugarcane variety information contained in the data set. The performances of the supervised models were evaluated by confusion matrices and percentile classification errors. The confusion matrices represented the numbers of observations attributed to each variety compared with the reference labels. The diagonals of the confusion matrices contained the correct classifications, and their numbers were compared with the total number of observations. Confusion matrices were processed with both calibration/cross-validation and external validation data sets. Loading plots were also used to identify which wavelengths were more relevant to the sugarcane variety discrimination.
Results
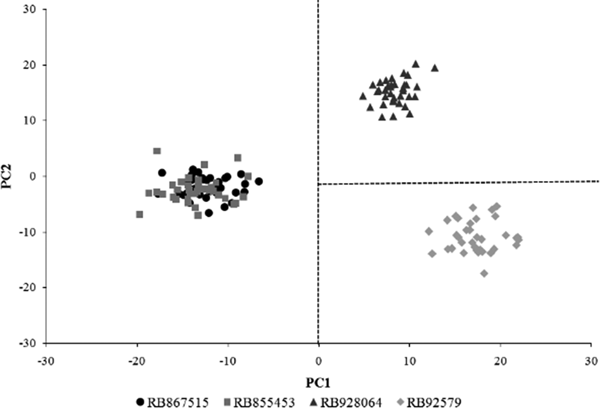
The PCA score plot of the first two principal components (PC1 and PC2), considering the four sugarcane varieties analysed in the current study, is presented in Fig. 2; PC1 and PC2 represented 57 and 30% of the data variance, respectively.

Fig. 2. Score plot of the first two principal components of principal component analysis (PCA) model built with the spectra of the calibration set of RB867515, RB855453, RB928064 and RB92579 sugarcane varieties.
Since PCA scores overlapped between RB867515 and RB855453 varieties when considering the four sugarcane varieties, classifiers of only three varieties were tested. These sugarcane classifiers may be useful in growing regions or industries where the RB867515 and RB855453 are not cultivated simultaneously or when only the RB928064 and RB92579 require to be discriminated. When analysing the PCA score plots of the two well-discriminated varieties (RB928064 and RB92579) and one of the overlapped ones (RB867515 or RB855453), it is possible to clearly distinguish all varieties (Figs 3 and 4), but the PC1 and PC2 thresholds were changed depending on the third variety used in the analysis. In the first case, the first principal component (PC1) explained 53.2% of the original variance (Fig. 3). The combination of PC1 and PC2 (representing a total of 88.9% of the original variance) showed an excellent differentiation of the sugarcane varieties, with positive PC2 values always describing RB928064 variety, positive PC1 and negative PC2 values describing RB92579 variety, and negative PC1 and PC2 values describing RB867515 variety. In the second case, the first two PCs explained 55.5% (PC1) and 37.2% (PC2) of the data variance, which accounted for 92.7% of the total variance (Fig. 4). In this case, the RB928064 resulted in PC2 values higher than five, the RB92579 was associated with positive PC1 values and PC2 smaller than five, and RB855453 resulted in negative PC1 and PC2 values smaller than five.

Fig. 3. Score plot of the first two principal components of principal component analysis (PCA) model built with the spectra of the calibration set of RB867515, RB928064 and RB92579 sugarcane varieties.

Fig. 4. Score plot of the first two principal components of principal component analysis (PCA) model built with the spectra of the calibration set of RB855453, RB928064 and RB92579 sugarcane varieties.
Principal component analysis is an unsupervised pattern recognition method. That is, samples are grouped into a number of classes without initial qualification of their class assignment. Thus, PCA comprises an exploratory procedure, seeking inherent similarities of data and comprising the first step of analyses for detecting patterns in different measured data. As quantitative discrimination cannot be achieved in the PCA and two varieties overlapped when analysing the four sugarcane varieties, FDA, SFDA and PLS-DA were applied in an attempt to improve the classification procedure of sugarcanes considering the RB867515, RB855453, RB928064 and RB92579 varieties. These are supervised methods, which group data into predefined classes (varieties) during training procedures, allowing the computation of the classification accuracy.
Models for one to eight discriminant factors were investigated while building the models. For all supervised methods, the optimal classifications occurred with two discriminant factors, which are linear combinations of the initial selected data that maximize the discrimination among the varieties. This choice was based on the evolution of the calibration and cross-validation errors, as more discriminant factors were considered in each model. That is, the number of discriminant factors was incremented until calibration and cross-validation errors did not vary or were greater than the previous analysis. It is important to note that models with fewer discriminant factors tend to be less complex and present a faster processing.
Table 2 summarizes the results of FDA, SFDA and PLS-DA models for calibration with cross-validation in terms of correct classifications and confusion matrices. Correct classifications of RB92579 and RB928064 varieties were observed for 100% of the calibration with cross-validation data set when using the three studied methods. Considering the other studied varieties, correct classifications varied between the methods, with PLS-DA reaching 87.5% of correct classifications for both RB867515 and RB855453 varieties. The overall correct classification of each method was calculated by averaging the individual classification percentiles of each variety, resulting in accuracies of 93.7, 92.8 and 90.6% for PLS-DA, FDA and SFDA, respectively.
Table 2. Confusion matrices resulting from FDA, SFDA and PLS-DA analyses for the calibration with cross-validation considering the four sugarcane varieties

Discrimination results for external validation using FDA, SFDA and PLS-DA methods are presented in Table 3. After verifying the validation with independent data set, it is possible to confirm that the PLS-DA method was most effective for classifying the four sugarcane varieties, reaching overall correct classification of 82.0%, followed by FDA and SFDA with 81.4 and 73.6%, respectively.
Table 3. Confusion matrices resulting from FDA, SFDA and PLS-DA analyses for the external validation considering the four sugarcane varieties

The loading plots (Figs 5–7) provide an additional interpretation of the results reached with the supervised methods, indicating the spectral regions which most influenced the sugarcane discrimination. This is shown by the peaks and valleys of the curves.

Fig. 5. Loading plot of the first two discriminant factors of the partial least-squares discriminant analysis (PLS-DA) model built with the spectra of the four sugarcane varieties.

Fig. 6. Loading plot of the first two discriminant factors of the factorial discriminant analysis (FDA) model built with the spectra of the four sugarcane varieties.

Fig. 7. Loading plot of the first two discriminant factors of the stepwise forward discriminant analysis (SFDA) model built with the spectra of the four sugarcane varieties.
Discussion
The PCA scores overlapped between RB867515 and RB855453 varieties when considering the four sugarcane varieties analysed in the current study. In this case, both varieties presented negative PC1 values. However, good discrimination was observed between this group and the other two varieties, with RB928064 resulting in positive PC1 and PC2 values, while RB92579 was associated with positive PC1 and negative PC2 values. Further, no outlier samples were observed.
There was no overlapping when considering the PCA method applied for two well-discriminated varieties (RB928064 and RB92579) and one of the overlapped ones (RB867515 or RB855453). In these cases, discrimination among the varieties occurred mainly along the first principal component (PC1), which accounted for a significant portion of the total variance. According to Serranti et al. (Reference Serranti, Cesare, Marini and Bonifazi2013), this fact confirms that spectral pre-treatments were able to effectively filter out a significant part of the signal variability not associated with the variety belonging to a specific class.
Sugarcane varieties RB928064, RB92579, RB867515 and RB855453 were well discriminated during the calibration with cross-validation and external validation when using the supervised methods. The best accuracy was achieved with PLS-DA when jointly analysing the four varieties.
These results confirm that PLS-DA combines the virtues of other supervised methods with noise reduction and variable selection advantages of traditional PLS method. Conclusions of the studies by Pholpho et al. (Reference Pholpho, Pathaveerat and Sirisomboon2011) and Monakhova et al. (Reference Monakhova, Godelmann, Hermann, Kuballa, Cannet, Schäfer, Spraul and Rutledge2014) are in agreement with the results found in the present study, with PLS-DA yielding the best accuracies. Pholpho et al. (Reference Pholpho, Pathaveerat and Sirisomboon2011) studied the potential of visible spectroscopy combined with multivariate methods for classifying non-bruised and bruised longan fruits, verifying that PLS-DA showed better classification accuracy in comparison with PCA. Monakhova et al. (Reference Monakhova, Godelmann, Hermann, Kuballa, Cannet, Schäfer, Spraul and Rutledge2014) developed models to improve the prediction of grape variety, geographical origin and year of vintage of wine based on spectroscopy fused with stable isotope data and multivariate method: results demonstrated that PLS-DA performed better than FDA.
During model development, it was observed that using only one or more than two discriminant factors did not improve sugarcane variety classification when applying the three supervised methods. Large positive and negative loadings resulted from the use of PLS-DA, with discriminant factors 1 and 2 presenting similar behaviours and weights for the different wavelengths. This indicates that both discriminant factors equally contributed for classifying the sugarcane varieties. On the other hand, FDA loadings showed that discriminant factor 1 had more influence on classifying sugarcane varieties than factor 2, presenting higher peaks and lower valleys for all wavelengths. However, it cannot be considered alone, since the best discrimination between the four sugarcane varieties was achieved by a combination of factors 1 and 2 when applying this method. Observing the SFDA loadings, discriminant factors 1 and 2 equally influenced the classification of the sugarcane varieties, presenting similar weights for all wavelengths. However, factor 1 presented comparatively more evident peaks and valleys than factor 2.
Loadings of the three supervised methods showed that all wavelengths contributed for discriminating the sugarcane varieties. But the spectral region from 600 to 750 nm was more relevant, showing higher peaks and lower valleys. This spectral region is mainly affected by the various pigments of sugarcane stalk, in which chlorophyll and anthocyanin play a leading role. According to Wagih et al. (Reference Wagih, Musa and Ala2004), sugarcane stalk colour depends upon environmental variables, where red and blue anthocyanins are predominant in epidermal cells and green chlorophyll in deeper tissue. The presence of wax also affects the colour of stalks, as it adds a whitish to dark-yellowish coating on the surface of sugarcane. Another important factor is exposure to sunlight, which makes the stalks of some varieties purplish and other green-yellowish. Gitelson and Merzlyak (Reference Gitelson, Merzlyak, Stamatiadis, Lynch and Schepers2004) proved that the wavelength range from 695 to 735 nm is one of the sensitive spectral bands for detecting chlorophyll and anthocyanin in plants. The spectral range, which includes peaks and valleys with greater potential for discriminating the sugarcane varieties, is also close to the range of 560–720 nm found by Johnson et al. (Reference Johnson, Viator, Veremis, Richard and Zimba2008) as appropriate for differentiating seven sugarcane varieties (LCP85-384, HoCP96-540, L97-128, TUCCP77-042, Ho95-988, MPTH97-216 and LA-Purple) based on spectral reflectance values of the leaves.
When discriminating three sugarcane varieties, the best results were also found by using two factors for all supervised methods. As expected, when applying FDA, SFDA and PLS-DA for classifying the RB928064, RB92579 and one of the PCA overlapped varieties (RB867515 or RB855453), 100% of all the groups were correctly classified, both for calibration with cross-validation and external validation data sets.
Based on the results, spectroscopy coupled with discriminant methods showed potential to reduce analytical time and cost of traditional methods used for classifying sugarcane varieties. Future studies will comprise an expansion of the wavelength range, including middle infrared (1000–2500 nm) and the cultivation of more sugarcane varieties under field conditions to verify whether the observed results remain, considering also a larger number of sugarcane stalks for spectral measurements. Non-destructive techniques to assess sugarcane varieties may provide an opportunity to compare these results with more detailed genomic or production yield studies in real time, or target-specific crosses demonstrating desired traits.
Conclusion
Visible/near infrared spectral reflectance coupled with multivariate statistical methods (PCA, FDA, SFDA or PLS-DA) was shown to be a promising tool for non-destructive and fast sugarcane variety discrimination and can be used in the agro-food industry or directly in the field. Based on the results, the PLS-DA method showed potential to be used as a basis for the development of automatic sorting systems of sugarcane varieties, contributing for improving the pre-processing steps in the alcohol and sugar industries.
Financial support
The authors are grateful to the Foundation for Research Support of the State of Minas Gerais (FAPEMIG) in Brazil, which provided funding to acquire the spectrometer with accessories (Process Number: CAG-APQ-01715-13), as well as environmental sensors and equipment for the experimental setup (Process Number: CAG-APQ-00408-14).
Conflict of interest
None.
Ethical standards
Not applicable.