


1. INTRODUCTION
1.1. Generative design
Generative design systems are generally defined as systems aiming to support human designers and/or automate parts of the design process through computational means (Singh & Gu, Reference Singh and Gu2012), or as Shea et al. (Reference Shea, Aish and Gourtovaia2005, p. 263) state: “generative design systems are aimed at creating new design processes that produce spatially novel yet efficient and buildable designs through exploitation of current computing and manufacturing capabilities.” Often, the generative design system is linked to some sort of performance measure that drives the design generation (Oxman, Reference Oxman2006, p. 258).
Generative design systems have been studied since the 1970s. Frazer, for instance, introduced generative systems intended for architectural design in 1974 (Frazer, Reference Frazer, Bentley and Corne2002). Since then, there have been a number of approaches to generative systems, generally built around rule-based systems for creating a shape, such as shape grammars (Stiny, Reference Stiny1980), L-systems (Lindenmayer, Reference Lindenmayer1968), and cellular automata (Wolfram, Reference Wolfram2002), or parameterized models being driven by optimization methods such as genetic algorithms (Holland, Reference Holland1975). There are also several approaches where rule-based shape generation is combined with stochastic optimization algorithms. For instance, Hornby et al. developed two-dimensional locomoting robots using an approach based on generating L-systems with an evolutionary algorithm (Hornby et al., Reference Hornby, Lipson and Pollack2001). Agarwal and Cagan (Reference Agarwal and Cagan1998) and Agarwal et al. (Reference Agarwal, Cagan and Constantine1999) created a system based on shape grammars for generating coffee maker shapes, and drove the generation using a cost metric. Shea et al. (Reference Shea, Aish and Gourtovaia2005) developed a performance-driven generative design system for finding cantilever roof trusses for a stadium. Their approach was based on integrating their generative design system eifForm with the commercial software Generative Components. A similar approach, based on integrating custom and commercial software, was developed by Zboinska (Reference Zboinska2014), who used animation tools in 3ds Max, surface tools in Rhinoceros, visual programming in Grasshopper, and environmental simulation in Vasari to develop a fragment of an architectural wall. Turrin et al. (Reference Turrin, Von Buelow and Stouffs2011) show an application of parametric design and optimization using multiobjective genetic algorithms to create large roof structures. Ahlquist et al. (Reference Ahlquist, Erb and Menges2015) use evolutionary algorithms and a mesh-based topology representation to find tensile systems with optimal properties in terms of mesh density and stress distribution.
In industrial design, several early works concentrate on capturing a style. For instance, Knight (Reference Knight1980) developed a parametric shape grammar for the generation of Hepplewhite-style chair backs. Orsborn et al. (Reference Orsborn, Cagan, Pawlicki and Smith2006) used shape grammars to define automotive styles. Several works have also looked at branding. Shape grammars, for example, were used to create new products based on the Buick (McCormack et al., Reference McCormack, Cagan and Vogel2004), Harley-Davidson (Pugliese & Cagan, Reference Pugliese and Cagan2002), Coca-Cola, and Head & Shoulders (Chau et al., Reference Chau, Chen, McKay and de Pennington2004) brands. Cluzel et al. (Reference Cluzel, Yannou and Dihlmann2012) used genetic algorithms to evolve car shapes based on Fourier harmonics. In Nordin et al. (Reference Nordin, Hopf, Motte, Bjärnemo and Eckhardt2011) a generative design system based on Voronoi diagrams and genetic algorithms was developed for generation of table structures and optimization of their weight and structural stability. That system was also tested with industrial designers and consumers to evaluate different control strategies in Nordin et al. (Reference Nordin, Motte, Hopf, Bjärnemo and Eckhardt2010, Reference Nordin, Motte and Bjärnemo2013). An overview of the different approaches can be found in Singh and Gu (Reference Singh and Gu2012). A comprehensive review of design systems within the realm of evolutionary systems can be found in Bentley and Corne (Reference Bentley, Corne, Bentley and Corne2002).
1.2. Gaps in computer support for design
Despite the large number of applications of generative design, many authors have noted the lack of industrial implementation and adaptation of the design tools developed. For instance, Shea et al. (Reference Shea, Aish and Gourtovaia2005, p. 263) noted that “[t]he real challenge is to make systems that designers want to use in order to investigate the potential for performance-driven generative design to aid negotiation in multi-disciplinary design teams.” Cagan et al. (Reference Cagan, Campbell, Finger and Tomiyama2005, p. 171) reasoned that this is because “the problem is challenging, a complex balance between representation, generation, and search of a design space in pursuit of original design solutions.” Horváth (Reference Horváth, Talabă and Roche2005) argued that the industry simply does not want to invest in developing premature technology, and would rather hire another designer to help the design process. Zboinska (Reference Zboinska2014) mentions that many architects find the tools proposed by academia to be too abstract and tedious to use. Another reason for the gap between industry and academia is that the majority of the design tools are developed with academic problems in mind, rather than industrial needs, resulting in tools that might show technical prowess, but lack crucial aspects that hinder their use in an industrial setting. Blessing and Chakrabarti (Reference Blessing and Chakrabarti2009) noted that there is, within the engineering design research area, a lack of use of results in practice (pp. 7–8) and that “‘generic methods’ are developed based on the analysis of a specific problem and evaluated using the same problem. In many cases, statements are made about the use of the support, although the evaluation involved only the researcher” (p. 36). Within the related field of human–computer interaction, several authors have pointed out the gap between research and professional use, noting that research in human–computer interaction has been focused on generating theory based on experientially oriented research surrounding the consumers of the technology and not the designers themselves (Goodman et al., Reference Goodman, Stolterman and Wakkary2011; Roedl & Stolterman, Reference Roedl and Stolterman2013).
In order to successfully convince industry to use generative tools and to understand what hurdles lie in the way of their implementation, it is necessary to study the whole process of developing a generative design system for professional use, or as Simon (Reference Simon1973, p. 187) noted: “there is merit to the claim that much problem solving effort is directed at structuring problems, and only a fraction of it at solving problems once they are structured.” However, although many authors cited here note the lack of professional use of tools developed by academia, none of the studies describe the industrial implementation.
1.3. Aims of this paper
Due to the absence of industry input during ideation and development of design tools, and the lack of research on the challenges associated with industrial implementation of generative design systems, it is hard to draw any conclusions on how adaptation could be better facilitated. The use of generative design systems for new product development also adds an extra layer of complexity to the process as they are to be used to create at least part of the product that has not yet been fully defined, meaning both tool and physical product need to be developed in parallel. To this end, this paper aims to document the challenges associated with the development of generative design systems in practice and to thereby aid the elaboration of strategies for how to overcome them. To do so, this paper presents two exploratory case studies conducted while implementing generative design systems for companies involved in product development projects. The first case study focuses on an engineering design application in a company providing solutions for dispensing metal discs. The second case study focuses on an industrial design application in a company working on, among other things, surveillance cameras. These design systems were developed from the ground up based on the companies’ requirements. Using the classes of digital design from Oxman (Reference Oxman2006), the two systems presented here can be defined as performance-based generation models. In terms of the phase of the product development process (Pahl et al., Reference Pahl, Beitz, Feldhusen, Grote, Wallace and Blessing2007), these design tools are geared more toward embodiment design, rather than a conceptual design of the function structures.
This paper is organized as follows: in Section 2, the research method for identifying the challenges is presented; in Section 3, the implementation process, case histories, and collected data are described; and in Section 4, the results from the data analysis are presented.
2. RESEARCH METHOD
2.1. Method
Based on the aim of this paper, and to be able to gain detailed information on the implementation process, a qualitative approach was adopted. This study is exploratory in the sense that it is not intended to test any hypotheses established by the researcher or to refute any existing theory, but rather to collect data on which to generate theory. With these requirements and goals in mind, and based on literature such as Glaser and Strauss (Reference Glaser and Strauss1967) and Eisenhardt (Reference Eisenhardt1989), it was decided that the best method of achieving them was to perform a number of industrial case studies, during which design tools were developed together with companies. To be able to obtain in-depth firsthand information on the development process, this study is participatory; the researcher is part of the development process and responsible for developing the tools in collaboration with the designers at the companies (Merriam, Reference Merriam1998, p. 101; Blessing & Chakrabarti, Reference Blessing and Chakrabarti2009, p. 247).
To identify challenges, that is, something that requires substantial effort, the development time was analyzed to determine which activities were the most time-consuming, and all communication with the company was transcribed and coded to be able to identify which issues were discussed during the development. Time was chosen as one indicator as it is easily measured and is closely related to the development cost, which, in most cases, will be an important factor in the decision to implement a custom design tool. The time-tracking and coding processes are described in Sections 2.3–2.4 and 3.4–3.6.
2.2. Case selection
As this is an exploratory study, the cases had to be chosen so that they allowed for capturing a large variety of data on which to base conclusions. The choice of cases was thus based on theoretical sampling rather than statistical (Glaser & Strauss, Reference Glaser and Strauss1967; Eisenhardt, Reference Eisenhardt1989). It was decided to find one technology-driven and one user-driven application (as defined in Ulrich & Eppinger, Reference Ulrich and Eppinger2012, pp. 221–222), as these cases would give more insights on the challenges associated with both engineering design and industrial design. In addition, it was a requirement that the user-driven application would include both qualitative and quantitative aspects to ensure that the study captured the difficulties in combining the two. After meeting with seven companies, an agreement was reached with two of the companies regarding performing the case studies. The first company develops products that are technology driven, although a large part of the design evaluation is still based on the experience and intuition of the engineering designers. The second company is an industrial design consultancy firm that often works on projects requiring their industrial designers to collaborate with engineering designers. The product the design tool was implemented for was driven by the industrial design aspects, but still needed to satisfy technical constraints.
2.3. Data collection
The data collected during the case studies consists of transcripts of all communication with the company in form of interviews and idea generation sessions, e-mails, field notes, and time logs of the development work. The interviews were conducted to gain more information on the product and the needs of the designers, as well as getting feedback on the work-in-progress tools. The development was tracked by manually logging the time spent on each activity, as well as logging the save times of all files involved in the project, and then manually tagging each save time with a code representing the type of activity associated with it (see Table 1). The codes were based on a generic generative design process model, as described in, for instance, Frazer (Reference Frazer, Bentley and Corne2002), Cagan et al. (Reference Cagan, Campbell, Finger and Tomiyama2005), and Krish (Reference Krish2011), and shown in Figure 1.

Fig. 1. Flow of information for a generic generative design system. The user interface can include all or some of the functions.
Table 1. The categories used for tagging the development activities

2.4. Data analysis
Data analysis consisted in first building a case history detailing the events that had occurred in the two companies, drawing upon the data collected to do so. The case histories were then analyzed for decisions, requests, and opinions regarding the generative design system being developed, so as to map key events to a timeline, and to be able to get an overview of the development process. The transcribed interviews and meetings were divided into coding units, in this case, sentences or phrases. Each unit was coded based on the topic it was primarily addressing, initially based on the same codes as those used for the time tracking. In order to ensure that the codes used for the content analysis were reliable, the following steps recommended by Lombard et al. (Reference Lombard, Snyder-Duch and Campanella Bracken2002) were taken. First, an appropriate index of intercoder reliability was selected in advance, in this case Krippendorff α (Krippendorff, Reference Krippendorff1970) as it is well regarded and conservative (Lombard et al., Reference Lombard, Snyder-Duch and Campanella Bracken2002). Second, the online tool ReCal was employed to calculate the index levels (Freelon, Reference Freelon2010). Third, a minimum acceptable level for the reliability index was selected. According to Krippendorff (Reference Krippendorff2004), all codes should ideally have a level above 0.8, but a level above 0.667 is considered to be acceptable for an exploratory study. Fourth, a pilot study was performed with two coders (the author and another person familiar with generative design systems) on 50 units randomly sampled from the full data set to assess the reliability. The coding scheme then was adjusted based on the results (see Section 3.6 for more details). Fifth, a reliability sample of around 10% of the complete data set was then coded by two coders, and the reliability was once more assessed. Sixth and finally, the full data set was coded, and any disagreements in the coding were resolved by randomly selecting decisions of the different coders. The frequencies of the codes were then calculated. The data for the reliability test and frequency is presented in Section 3.6. The codes, and their frequency, served as a basis for the discussion presented in Section 4. The time logs were used to summarize the time spent on the different development activities.
2.5. Presentation of results
Due to the large amount of data collected during the two case studies, it is only possible to give a summary of the events and conclusions, supported by the quantified results from the time logging and content analysis. In-depth descriptions of the developed tools have thus been left out in order to be able to concentrate on describing the challenges. Summaries of the case histories, the codes, themes, and examples thereof, as well as a brief description of the developed design tools are given to enable the reader to put the challenges presented afterward into context.
3. CASE DESCRIPTIONS
In this section, a description is given of how the development work was carried out, and the collected data in the form of codes and development time is presented.
3.1. Structure of the development work
Both case studies were carried out using the same setup (see Fig. 2). During the initial meeting, the company was presented with examples of previous works involving generative design tools, and the general principles, benefits, and challenges were discussed. Based on the initial description, the company was then asked to suggest possible applications within its range of products. The needs of the company and the applicability to the research project were then used as criteria for selecting one product to move forward with. The company provided a preliminary brief of the design problem, for example, constraints, objectives, design space, and so forth. An initial design tool was built based on this brief, in conjunction with interviews and discussions being conducted with the designers. In both cases, the chosen projects were redesign projects, as the companies had previously worked on similar products. The company was presented with the initial design tool early on in the development process in order to better explain the capabilities and workflow of a generative design tool, as neither company had worked with them before. Based on the feedback on the first version of the tool, the second iteration tool was developed, where the majority of the development took place as the company now had a better idea of what could be done and could suggest new functionality or changes to the tool. After the second iteration of the tool had been presented, the goal of the following iterations was to fine-tune the tool until the company was satisfied with its functionality. Each iteration was concluded with a presentation of the tool and a number of product concepts generated by it.

Fig. 2. General timeline of the projects.
3.2. General structure of the tools
Both tools were based on the framework shown in Figure 1. After the product specifications had been established by the customer and the company, they were converted into constraints, objectives, loads, boundary conditions, and a design space (design parameters and intervals) by the developer. At the initialization of the design system, a point in the design space, representing a set of parameter values within the parameter intervals, is input into the geometry generation function, which translates the parameter values to a geometry ready to be sent to the evaluation function. The evaluation function calculates results to be used by the optimization algorithm to evaluate the objectives and constraints. As long as the optimization is running, the optimization algorithm will create new designs based on the evaluation and feed them to the geometry generation function. The results are monitored and evaluated by the designer and customer until a satisfactory solution has been reached.
3.3. Description of the design problem and design tool development for Company A
Company A is a provider of solutions for dispensing metal discs. Core technologies in their products are the metal disc sorting, storage, and dispensing modules. In this study, the company was interested in maximizing the metal disc storage volume and predicting structural overloading of a metal disc dispensing mechanism. The metal disc dispensing system is based on a magazine, which stores the discs, and delivers them to the dispensing mechanism, which consists in a wheel with disc-sized openings spun by a motor (see Fig. 3). The discs fall into the openings and are ejected through a slot that registers them as dispensed using a sensor. During normal operating conditions, this process is capable of dispensing around 500 discs per minute. The magazine and dispensing mechanism are normally locked and hidden away from the user of the machine, and are not meant to be regularly handled by personnel, thus limiting the need for industrial design of the system.

Fig. 3. The general layout of the disc magazine and dispensing unit.
In an effort to avoid overloading the dispensing units, the company had begun measuring the load on the mechanism, but was not quite sure of how to determine a metric that would indicate acceptable or unacceptable loading. Because many of the subprocesses were difficult to observe in real time due to the high rotational velocities, the company also recorded slow-motion video of the dispensing process so as to better understand factors that affect the flow of discs and operation of the dispensing mechanism. They had done some statistical analysis of the test data, but it was difficult to base design decisions on it, as building new prototypes with modified design features is time-consuming and somewhat expensive. Instead, their request was to investigate if simulating the interaction of the magazine and dispensing process was feasible, and to base an optimization on the results of the simulation.
The problem at hand was to develop this tool while working with the engineering design and testing department of the company, and to establish the actual constraints and objectives, which, for the most part, are not commonly found in classical product development projects. This was beneficial to the case study, as it was not possible to rely on the standard constraints, which might apply to most products, such as thermal considerations or structural requirements in terms of stresses, deformations, and so forth. Instead, the company had so far mostly relied on experience-based design rules gained by trial and error.
The development required four iterations of the design tool. The initial iteration of the tool was more of a proof of concept showing that the flow of discs could be simulated with reasonable accuracy and speed. Due to the large amount of rigid bodies, the simulation required around 40 min to execute, and was thus not interactive. As a result, the tool was more of a classical optimization tool, which searches for the best solutions independently from any interactive user input.
The final tool was controlled from Esteco modeFRONTIER (Esteco, 2015; see Fig. 4), which is a general optimization and design of experiments tool. The tool interacted with PTC Creo Parametric 2.0 (PTC, 2013), which generated the designs, and a custom evaluation function implemented using the rigid body simulation library Bullet Physics (Coumans, Reference Coumans2015; see Fig. 5). The integration with Creo was achieved using script files in the PTC Trail format. The evaluation function was a separate executable file and took as input a discretized geometry file in its directory to use as the design in the simulation. The evaluation function exported a text file with comma separated values of the different metrics over time, which modeFRONTIER then read in and postprocessed into the constraint and objective functions. The constraints and objectives were the number of discs that had been dispensed, the load on the motor, the average velocity of the discs, and the position of the topmost disc. The optimization algorithm was based on MOGA-II, a multiobjective genetic algorithm implemented in modeFRONTIER (Poles et al., Reference Poles, Rigoni and Robič2004). The settings used were a population size of 50 individuals (modeFRONTIER documentation recommends using
 $2 \; {\rm number}\_{\rm of}\_{\rm variables\; number}\_{\rm of}\_{\rm objectives} = 2 \times 7 \times 3 = 42$
individuals), maximum of 50 generations, probability of directional crossover of 0.5, probability of selection of 0.05, probability of mutation of 0.1, DNA string mutation ratio of 0.05, elitism enabled, and the constraints were treated as penalized objectives. Each optimization, consisting on average of 320 design evaluations, required around 24 h running on eight 2.4 GHz Intel Xeon E5620 cores. The final design space consisted in the position and angle of the internal planes (see Fig. 3). The formal description of the optimization problem is given by: min[f
1(x), f
2(x), f
3(x)]subject to g(x) ≤ 0 and x
lb ≤ x ≤ x
ub, with f
1(x) = –n
d, where n
d is the number of dispensed discs; f
2(x) = h
d, where h
d is the height of disc mound; f
3(x) = –v
d, where v
d is the average velocity of discs; g
1(x) = L – l
max, where L is the motor load and l
max is the maximum load specified by the company; and x
lb and x
ub are the lower and upper bounds of the design parameters, respectively.
$2 \; {\rm number}\_{\rm of}\_{\rm variables\; number}\_{\rm of}\_{\rm objectives} = 2 \times 7 \times 3 = 42$
individuals), maximum of 50 generations, probability of directional crossover of 0.5, probability of selection of 0.05, probability of mutation of 0.1, DNA string mutation ratio of 0.05, elitism enabled, and the constraints were treated as penalized objectives. Each optimization, consisting on average of 320 design evaluations, required around 24 h running on eight 2.4 GHz Intel Xeon E5620 cores. The final design space consisted in the position and angle of the internal planes (see Fig. 3). The formal description of the optimization problem is given by: min[f
1(x), f
2(x), f
3(x)]subject to g(x) ≤ 0 and x
lb ≤ x ≤ x
ub, with f
1(x) = –n
d, where n
d is the number of dispensed discs; f
2(x) = h
d, where h
d is the height of disc mound; f
3(x) = –v
d, where v
d is the average velocity of discs; g
1(x) = L – l
max, where L is the motor load and l
max is the maximum load specified by the company; and x
lb and x
ub are the lower and upper bounds of the design parameters, respectively.

Fig. 4. Workflow showing input parameters, constraints, and objectives in modeFRONTIER.

Fig. 5. Visualization of the simulation of the disc flow for three different designs.
The company had not previously been able to establish any performance metrics for the product, and as such a large part of the development was concerned with finding suitable metrics that could be simulated. In the final tool, either the designer could use modeFRONTIER to specify parameter intervals and objective functions and run an optimization or design of experiments using the built-in functionality, or he or she could access the evaluation function directly via Creo Parametric to evaluate an arbitrary geometry and set the number of discs to be simulated and the simulation duration. It also provided the designer with a three-dimensional view of the flow of discs; that is, even if no metric could have been established, the designer could have acted as the evaluation function in much the same way as the company had evaluated design concepts previously.
3.4. Description of the design problem and design tool development for Company B
Company B is an industrial design consultancy firm that employs industrial and engineering designers. Their clients are mainly companies developing consumer electronics such as cameras, cell phones, and health-care products.
The project was based on one of the reoccurring client's products, a camera, in which the heat dissipation mechanism had previously been hidden, or at least not prominently featured. The firm has had several projects in which heat dissipation was important for the function of the products. The company is often hired to design several similar variants of the same product typology, such as a small affordable version for home use, a medium version, and a high-end professional version, all requiring different thermal and case designs but keeping the same general design language. This has led the company to become interested in being able to generate designs that conform to the customer's brand or design language, while also satisfying technical constraints such as case temperature, and leaving the designer to explore several ideas without being tied down by technical analysis. As more powerful components were integrated into the camera, due to increased competition in the market, the amount of heat that needed to be dissipated had increased to a point where passive cooling was hard to achieve with elegant solutions, and fan-based cooling was ruled out by other design constraints set by the client. Instead of impairing the aesthetic of the product by placing generic heatsinks on the outside shape of the product, it would be preferable to have a custom heat dissipation design that fits with the overall product expression and company brand. However, the design firm does not have in-house expertise within thermodynamics, and has thus so far been relying on its customers’ experts to get feedback on design concepts. This has, in the firm's opinion, led to final designs that are not as innovative as they could have been had the exchange of concept ideas and feedback on them been faster. The task was thus to work with the industrial designers of Company B to develop a design tool that could take into account the thermal constraints of the product, while leaving the designer to control the industrial design aspects.
In comparison to the application for Company A, this application revolves around the qualitative aspects, and thus requires a different type of tool in which the designer is more involved with the development of the optimization algorithm and overall interface of the tool.
The tool required four iterations before satisfying the needs of the designer and the company. The initial iteration of the tool enabled the designer to change the geometry of the heatsink, change the position and values of the thermal loads, and to evaluate the temperature distribution on the body of the product using a rudimentary custom finite element-based evaluation function. The second iteration of the tool implemented several optimization algorithms from which the designer could choose. The optimization problem can formally be described by: min[f 4(x)], x lb ≤ x ≤ x ub , with f 4(x) = T, where T is the maximum temperature on the heatsink. The remaining iterations were spent on refining the optimization algorithms and improving the ease of use with which the designer could define the design space. The optimization algorithms were based on increasing the thickness of the heatsink in proportion to the temperature (proposed by the industrial designer); modulating the height of the fins based on the temperature; and basing the thickness of the heatsink to maximize the heat dissipation. In the end, the industrial designer could simply specify a three-dimensional volume as the design envelope, specify the thermal loading using two-dimensional curves and power ratings, fix certain areas of the design space to, for instance, define ribs in the heat sink (see Fig. 6), and get visual and numeric feedback of the temperature gradient (see Figs. 7 and 8). The designer could choose to manually define the heat dissipation shape, or to let the algorithm automatically define the shape based on the temperature results over a number of iterations. The tool was applied to a range of camera variants to ensure that the tool could handle different design spaces without requiring substantial modifications.

Fig. 6. (Left): The inputs to the first iteration of the tool with thermal loads in red, design space in blue, and convection area in green. (Right): The inputs to the final iteration of the tool with the design space represented by a three-dimensional volume in yellow, and the thermal loads in red.

Fig. 7. The feedback from the final iteration of the tool showing the temperature distribution and adapted shape of the heatsink.

Fig. 8. Examples of the output from three optimization algorithms. Left: maximize thermal dissipation; middle: increase thickness of heatsink in relation to the local temperature; right: user-definable heights in combination with temperature modulation of the remaining geometry.
The tool was developed for use with the computer-aided design (CAD) tool Rhinoceros 3D (Robert McNeel & Associates, 2015), using a plug-in for visual programming, Grasshopper (Robert McNeel & Associates, 2014), with custom thermal simulation code written in C# (see Fig. 9). The tool itself was interactive; the update rate of the shape generation and feedback was about 2 Hz on a four-core Intel Core i7 950 3.07-GHz processor.

Fig. 9. Workflow of the last iteration tool in Grasshopper showing the visual programming language.
3.5. Timeline of the development projects
The project with Company A was conducted over 83 days, although the development time was concentrated to a few periods of activity due to time constraints on behalf of the company. In total, the time spent on active development was 105 h. A summary of the development time is shown in Table 2. During the development, five team meetings and four one-on-one interviews, averaging 40 min in length, were conducted. The key persons involved in the project were the head of engineering design, head of quality assurance, two senior engineering designers, and one test engineer. A summary of the development timeline is shown in Figure 10.
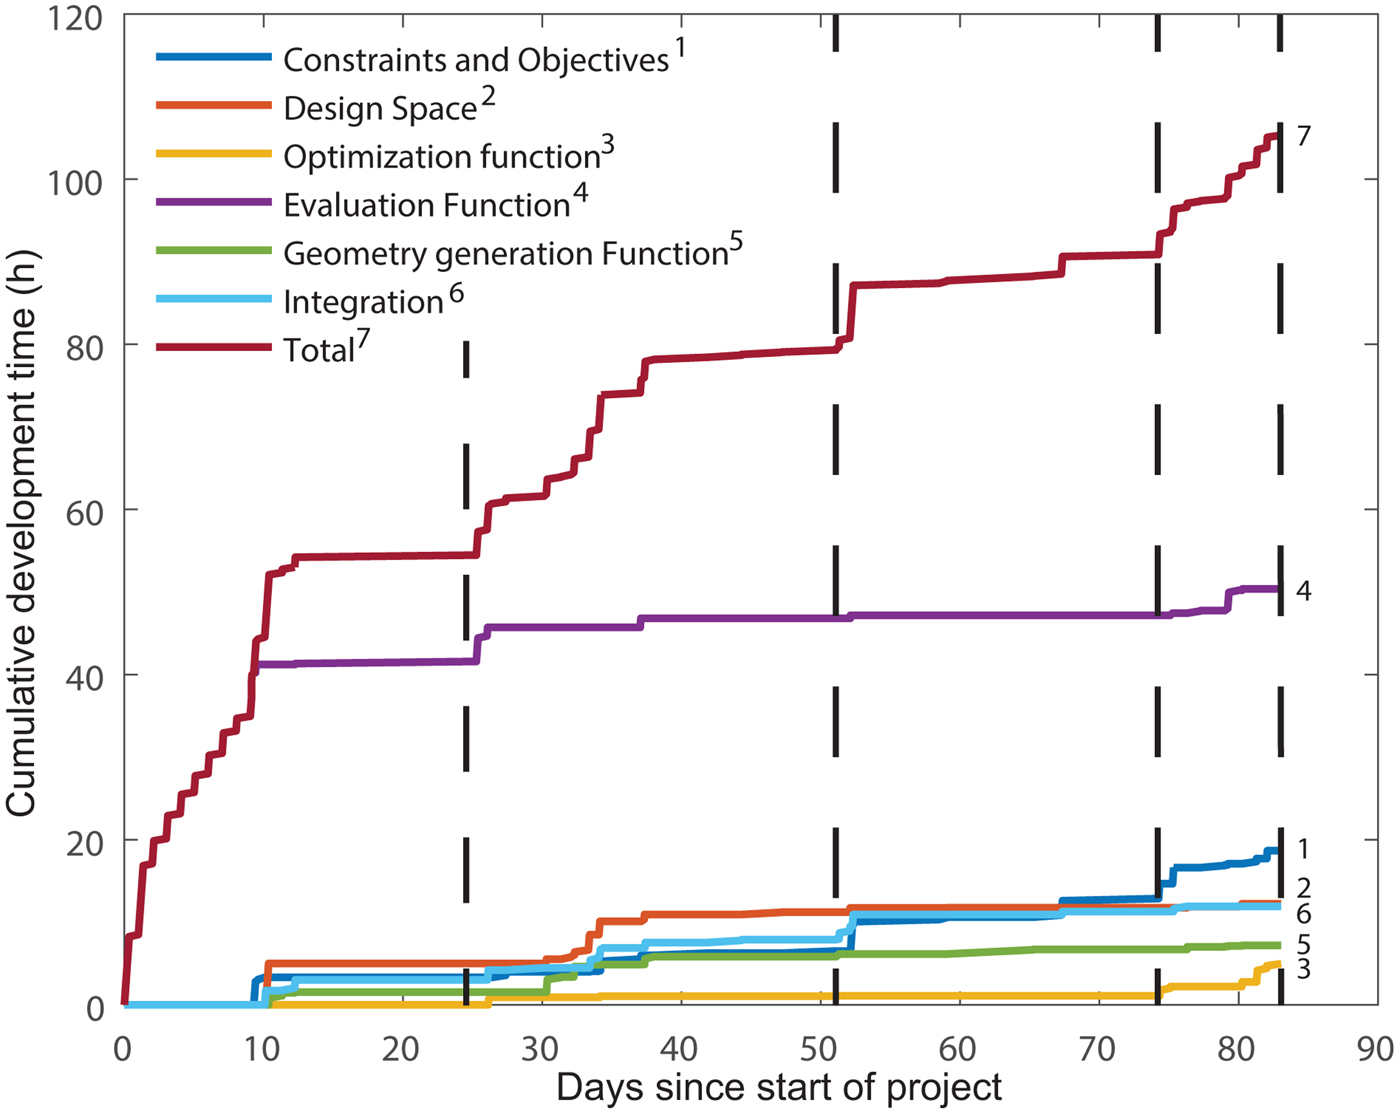
Fig. 10. Timeline of the development of the tool for Company A over 83 days. Each vertical line represents one review meeting.
Table 2. Summary of the time spent on each development activity in Company A and B

The project with Company B was conducted during 71 days. In total, the time spent on active development was 58.5 h, considerably less than the development time for Company A. A summary of the development time is shown in Table 2. During the development, three team meetings and four one-on-one interviews, averaging 60 min in length, were conducted. The key persons involved in the project were the founder and creative director of the company, a senior industrial designer, and a representative of the customer. The team meetings were attended by between 7 and 15 industrial designers and engineers. A summary of the development timeline is shown in Figure 11.

Fig. 11. Timeline of the development of the tool for Company B over 71 days. Each vertical line represents one review meeting.
To differentiate between the causes for iterations, the development time is split into two sections. The first part is up until the first iteration of the tool has been presented (the first iteration of the tool is to demonstrate what is possible based on the initial brief). The second part is until the design tool is finished, that is, the company is satisfied with it. In Company A, about 45% of the development time was spent on updating the tool based on the designer's inputs. In Company B, the time spent was 42%. In Company A, the major part of the development time was spent on developing the evaluation function, as there were no existing ways of evaluating the product. However, most of this time was spent during the initial phase of the project and did not require much input from the company. The second, third, and fourth most time-consuming activities were development and testing of constraints and objectives, the adaptation and parameterization of geometry to the evaluation system, and the integration of Creo, modeFRONTIER, and the evaluation function. The first two activities represent the constraints, objectives, and design space of the problem, which are often assumed to be given, but in actuality represent a large part of the development time, even though the product is not a new product for the company but rather a redesign. The optimization time has not been included in the data in Table 2 as it is not active development time. In Company B, the most time-consuming activity was again the development of the thermal evaluation function. The second most time-consuming activity was the development of the optimization algorithm, which updates the geometry based on the thermal results, where several different approaches were tested for how the shape of the product should respond to the results of the thermal simulation. In the case of Company B, the geometry parameterization and adaptation did not require much time. The reasons for this was, first, that the only parameter was the height map of the product shape, and second, that the company could provide sufficiently simple geometry to be used directly with the design tool.
3.6. Codes and themes from the transcribed data
As described in Section 2.4, a content analysis was done on the text-based data from interviews, meetings, and written communications. A directed content analysis (Hsieh & Shannon, Reference Hsieh and Shannon2005) was performed with an a priori coding scheme based on the same codes used for the time measurement. The codes “Purpose of the system” and “Other” were added to the scheme. The code “Purpose of the system” was used to identify discussions regarding the general application of the system, while “Other” was added to catch any data that could not be fit into the other categories. A high frequency of the “Other” code would indicate that the coding scheme needed to be revised. As described in Section 2.4, a pilot test was performed with 50 sample units to measure the reliability of the coding scheme. A level of 0.8 for Krippendorff α was preferable, and any code below 0.667 was discarded. The initial analysis showed that the codes for “Geometry generation,” “Optimization algorithm” and “Purpose of the system” were not reliable, as Krippendorff α was below the required level of 0.667. After analyzing the pilot data (see Table 3), it became clear that it had been difficult to decide how units relating to the parameterization of the designs should be coded. The parameterization relates to the geometry, choice of parameters, and the parameter intervals. A similar issue was found with the codes “Optimization algorithm” and “Constraints and objectives.” It was difficult to decide into which code a unit mainly falls under. The coding scheme was thus simplified so that any unit relating to geometry or parameters should be coded as “Geometry generation” and any unit relating to optimization or constraints and objectives should be coded as “Optimization algorithm.” The code “Purpose of the system” also performed poorly and was replaced by three codes: “Input to the system,” “Output of the system,” and “External factors.” The code “External factors” was used to code factors that affect the implementation of the generative design system but do not directly relate to any of the core functions. A larger reliability test was performed with 100 sample units, representing approximately 10% of the full data. The analysis showed that a reliability level over 0.8 was achieved for most codes. However, three codes fell below 0.8: “Output of the system” (α = 0.753), “External factors” (α = 0.778), and “Other” (α = 0.656). As the first two codes were still above the level for tentative conclusions, and the frequency of the “Other” code was low, this coding scheme was accepted. The coding of the full data set was then performed, and the frequencies were calculated and are reported in Table 4 for both companies. Example units for each code are shown in Table 5.
Table 3. Initial codes and intercoder reliability levels

Table 4. Adjusted coding scheme with intercoder reliability levels and frequencies

Table 5. Codes and example units from the content analysis of the text-based data

4. CHALLENGES ENCOUNTERED WITH COMMENTARY AND RECOMMENDATIONS FOR FUTURE PROJECTS
In this section, a number of challenges observed during the development of the two design tools are described. The challenges are based on the themes that developed from the content analysis of the transcribed data and the development time.
In the following subsections, the challenges associated with each function of the generalized generative design system shown in Figure 1 will be presented. The challenges will be illustrated through examples from the case histories and time logs; finally, the strategies adopted in the case study to deal with the challenges will be described and discussed.
4.1. Geometry generation and parameterization
In any computer-based simulation, the preprocessing of the geometry accounts for a large part of the engineering time. Decisions include what details of the geometry are important to the results and how to best discretize it if, for instance, a finite element analysis is to be performed. In addition, if designs are to be automatically generated based on the results of the simulation, there is an added layer of complexity in parameterizing the geometry.
As can be seen in the summary of the development time and the frequency of the code in the content analysis for Company A, adapting geometry to fit the design tool and evaluation function took up a considerable part of the time. They had not previously dealt with any computer-based simulation of this part of their product and, as such, had no CAD files suitable for simulation or optimization. The major difficulty in simplifying the design, especially as an outside party with no former experience of the design rationale behind the products, was to interpret which parts could be removed from the geometry, and how the design was allowed to change without interfering with other parts of the product.
The task of simplifying and parameterizing the geometry could have been left to the company; however, the problem on that end would be to understand the intricacies of design parameterization and what geometrical features are computationally expensive or unsuitable to include. In either case, it should be expected that a major part of the development time will be spent on adapting and creating geometry if the shape generation or optimization is not applied to a relatively isolated part of the product, as in the case of Company B.
4.2. Evaluation function
As is shown in both projects, the majority of the development time was spent on creating the evaluation function. The majority of the transcribed communication was also related to the evaluation function in the case of Company A, and the second most common topic in the discussions with Company B. This is not surprising, as neither evaluation function was based on existing analysis software. This meant that the simulation code needed to be written, and the factors unique to each problem needed to be determined. These factors included the material data, boundary conditions, and loads as well as the discretization of the problem. For newly developed code, there is also the need to verify and validate the results against, for instance, physical tests. However, it should be noted that both evaluation functions were based around well-understood physics and analysis methods as rigid body dynamics and the finite element method applied to a static thermal problem. Developing evaluation functions for applications where the objectives or constraints require the evaluation of phenomena for which there are no established simulation methods will obviously be much more challenging. This is, however, nothing that is unique to generative design systems, and other sources, such as Eriksson (Reference Eriksson2015) can offer more insight into the implementation problems of design analysis in product development.
4.3. Optimization algorithm, constraints, and objectives
In order for the optimization or automatic generation of a product to be possible, the objectives and constraints associated with the product must be possible to measure, either through virtual or physical tests, or through user feedback. The problem of finding suitable metrics is not unique to generative systems. The general recommendation in, for instance, Ulrich and Eppinger (Reference Ulrich and Eppinger2012) and Ullman (Reference Ullman1997) is for the product specification to be based on measurable metrics and target values. However, in practice, this might not always be strictly followed as the company may not believe the investment in determining metrics and developing methods for evaluating them is worthwhile compared to simply basing the evaluation on trial and error or the experience and intuition of the designers. Moreover, in the case of optimization algorithms, if there is an easily found way of achieving good results, the algorithm will tend toward that part of the search space, even if the solutions are obviously unfeasible to a human designer (e.g., Thompson, Reference Thompson1996). It is difficult to determine if a constraint is open to interpretation without running possibly time-consuming pilot optimizations.
The difficulty in finding suitable formulations for the constraints and objectives in the case of Company A is evident by the large part of the development time that was devoted to their implementation. The product was not subject to any substantial qualitative requirements, and as such, there was no need for user involvement. Instead, the focus was on replacing the rules-of-thumb with metrics that could be measured by means of simulation of the flow of discs. This involved two major challenges: first, the design rules themselves were not thoroughly documented, but rather existed as part of the expertise of the designers; second, the rules were often based on experience, rather than something which was measurable, and the rationale behind the rules needed to be found out. An example of a rule-of-thumb, which was discovered through interviews, was that the designer preferred to keep internal planes asymmetric. The rationale behind this was that this practice could decrease the risk of bridge building; however, they had no way of directly measuring the frequency of bridge building in their physical prototypes. Because of this, a metric needed to be formulated based on the physical characteristics of a disc bridge. The first proposed metric was based on measuring the rate of discs being dispensed, but after discussions with the designers, this metric was found to be inadequate since bridges could still form higher up in the magazine, without affecting the flow of discs further down in the stack. Another metric was formulated based on measuring the standard deviation of the mean velocity of all the discs. A high standard deviation indicated that discs tended to get stuck and suddenly drop as bridges were formed and dissolved. Examples of constraints open to interpretation encountered during the development of the design tools are unexpected regeneration errors in the CAD systems leading to undefined behavior. For instance, if the geometry of the disc magazine is corrupted in such a way that the discs can easily escape it without passing through the intended dispensing mechanism, the evaluation function will likely favor it over valid geometries, leading the optimization to focus on an area of the design space that leads to corrupted geometry. In other cases, the internal planes could obstruct the flow of discs in such a way that the metrics based on motor load and standard deviation of the disc velocity scored high, but the other metrics scored poorly. These designs nevertheless represented Pareto-optimal points, and the design space was unnecessarily examined by the algorithm.
Generally, the rules first needed to be found out through interviews. Then, a computable metric needed to be formulated based on the aspect of the product's performance the design rule was put in place to improve. The metrics then needed to be implemented in the evaluation function and fine-tuned, which is an iterative process as the output from the generative design system must be evaluated by the designers in order to determine whether or not the constraints and objectives lead to feasible designs. Furthermore, Company A had previously successfully developed similar products, indicating that they had an in-depth understanding of the constraints and objectives of the product, but expressing them in measurable metrics still proved to be challenging.
4.4. Input to the system
In the ideal case, the designer using a generative design system is also the developer. However, even in that scenario, designing an algorithm instead of an object is a challenging task, or as Knuth puts it regarding the design of a shape generation algorithm for fonts, “Meta-design is much more difficult than design; it's easier to draw something than to explain how to draw it” (Knuth, Reference Knuth1995, p. 1). As previously noted in Nordin et al. (Reference Nordin, Motte, Hopf, Bjärnemo and Eckhardt2010) regarding the balance between control and automation, a compromise in level of user control most often leads to unsatisfactory results. The study showed that the industrial designers tended to want to have as much control as possible over the shape, while still wishing that the tedious and laborious parts be automated, or toward letting the design tool completely determine the design. If the design process is rather repetitive, automating it is straightforward. However, in the case of most generative systems, the point of the tool is not only to perform repetitive tasks quickly but also to intelligently couple the shape of the product to the performance metrics set by the designer.
The time-tracking data indicates that more than half of the development time for Company B was spent on implementing and refining the optimization algorithms and the design space. Around 32% of the transcribed communication related to the geometry generation and design space, while 13% concerned how the user of the design tool would control it and input new data. In the communication with Company B, the designer would typically describe how they wished the output of the tool would look, rather than suggesting modifications to the optimization algorithm. Many questions were based on trying to understand what was possible to do, for instance, if curved surfaces would be possible to work with, or if it would somehow be possible to capture the design language of the company in the generative design system. Most of the input was regarding the design space, or how the parts generated by the design system should interact with the fixed geometry. To deal with the challenge of the designer not directly being able to input new shape generation logic, a number of methods for finding a satisfactory optimization algorithms were used. The first was based on emulating the design reasoning the designers had employed when working manually. This led to a shape that the designers were satisfied with, but it left little in terms of control over the shape. This morphology was then expanded upon by allowing the designer to lock certain aspects of the design space, in this case the heights of user-defined areas acting as ribs for a heatsink. A third option was presented that was based on the thermal performance of the heatsink rather than the aesthetics. In this case, although the thermal performance was of importance, the driving factor behind the design decisions made by the designers was the aesthetic of the shape and how well it fit the company's brand, rather than how well it dissipated heat.
Letting the designer describe the shape generation logic to the developer, in a way, moves the bottleneck from the designer interacting with the engineers, who evaluate the technical feasibility of their concepts, to interacting with a developer. However, a large part of the designer's task is to continuously evaluate the form based on a set of criteria and being able to justify their design decisions, which is conceptually not very different from defining the logic an algorithm should follow to create the form of a product. Another aspect is that the quality of the design tool will most likely be improved by including the end user in the development process. Janssen (Reference Janssen2006), for instance, notes the importance of involving the designer in the software creation process as it creates a positive feedback loop between the system and designer, that is, tools are better codeveloped with the designer with a design task at hand. However, this approach still lacks many of the benefits that generative design has to offer, where the creator of the system can experiment with different shape generation logic without the burden of manually having to construct the oftentimes complex geometry, and the serendipitous emergence of shape found in, for instance, Sims (Reference Sims1991).
4.5. Output of the design system
The data from the content analysis shows that there was considerably more communication regarding the inputs and outputs of the system in Company B compared to Company A. Developing an algorithm for doing design tasks that are almost solely based on the designer's subjective opinion can be time-consuming as the designer is refining his or her vision of the product based on the output of the algorithm. Moreover, it can be difficult to decide how detailed the output should be. Should it serve just as inspiration, such as, for instance, a simple topology optimization, or should it result in a geometry ready for production.
In the case of the heat dissipation problem in Company B it was, for instance, requested that the algorithm would more closely match the curvature of the surrounding shape, and that the resulting mesh would be automatically postprocessed into a smoothened NURBS surface. It was, however, difficult to know exactly how the designers wished that these operations should be performed, without performing several iterations of the algorithm. In terms of input to the system, it was difficult to establish which parameters were relevant to the designer and which were not.
The strategy adopted in the case of Company B was to not aim for an all-encompassing tool that automates the entire workflow, but rather a tool that acts as an inspiration and concept generator to the designer. If need be, the process of transforming the output of the generative design system to something that can be input into a computer-aided manufacturing tool can later be automated in a separate software, thereby retaining the genericity of the generative design system and reducing the development time.
4.6. Integration
Another hurdle encountered was the difficulty of integrating different software packages with each other. This issue was not discussed much with the companies as can be seen from the frequency data of the content analysis, but it also relates to the “External factors” code. In the case of Company A, the preferred CAD system was PTC Creo Parametric, which does provide APIs for custom plugins and intersoftware communication; however, unless one has considerable experience in working with these systems, there will be a large amount of time spent on something that is not a core part of the goal the company is trying to achieve. The design tool for Company A was based on communicating with the CAD tool through user-scripts, but poorly documented functionality and seemingly arbitrary limitations of the software made the export process difficult to achieve and took up over 10% of the development time. In the case of Company B, the company's preferred CAD tool was McNeal Rhinoceros, which is highly adapted to scripting and generative approaches, both through the internal scripting language and through the graphical programming plug-in Grasshopper, which is intended for generative applications within architecture and design.
If it is possible to migrate part of the design process to a CAD tool that is more suited for a generative workflow, it could save considerable development time while, in the end, resulting in a superior product. However, this is always a balance between interrupting already existing workflows and systems for design work, and simplifying the design tool implementation. Some current initiatives exist for creating an integrated software platform, such as Zboinska (Reference Zboinska2014), who examines commercial software packages and their strengths and weaknesses for generative design. Janssen (Reference Janssen2015) is also aiming for an integrated platform for design generation and optimization using the Dexen platform.
4.7. External factors
Around 10% of the transcribed data was coded as “External factors,” that is, factors that affect the implementation of the generative design system but do not directly relate to any of the core functions. The issues were mainly connected to whether generative design would be suitable for the application in mind, and whether the company's existing organization would have to change to facilitate the design tool in terms of software platform and the skills of the employees. It can be difficult for a company that has never dealt with generative design tools before to fully grasp the possibilities and utilize them in an optimal manner. Although there are many benefits with a design tool tailored to the design process, it requires a substantial investment of resources that could potentially be better spent elsewhere. It is therefore of importance that the application is selected with the unique capabilities of generative design systems in mind.
During the initial meeting with Company B, the overall attitude toward generative design was positive, and in the following idea-generation meeting, the designers were eager to suggest uses within their own projects. One issue that was discussed during the meeting related to whether the generative design system would see enough use to be worth the investment. The company had not been involved in projects where the product was customizable. However, it had been involved in several projects where a large number of product variants should be developed at the same time. Most proposed applications were either purely technical, concentrating on aspects of a product that, although crucial to the performance, were not part of the overall product expression, or purely aesthetic, concentrating on the possibility of generating complex shapes that were too time-consuming to achieve manually. For example, several applications were mentioned within the field of topology optimization and internal ribbing of plastic parts. Few suggestions included both qualitative and quantitative considerations. The reason of the lack of applications where the aesthetic and functional parts are combined is probably based in the fact that the more technical parts of a product, such as heatsinks, have traditionally been constructed by engineers purely for function and then hidden away by the industrial design team. Another aspect, which was discussed by the company, was the potential in being able to use the fact that the shape was algorithmically generated and optimized as a sales argument. Not because the product necessarily performed any better, but because the story behind the design process could be enough to make it more attractive than other offers on the market.
The strategy adopted in the case of Company B, to push them toward applications more in line with the capabilities of generative design systems, was to discuss what possibilities could arise if the technical parts become an integral part of the product expression. This is perhaps something they have tended to avoid because of the extra complexity, but by freely generating ideas, without considering the feasibility of implementing them, a number of new applications could be found, among them the application described in this paper.
5. CONCLUSION
The results of this study detail the challenges that were encountered during the development of two generative design systems intended for industrial applications. The two case studies were based on one technology-driven application in Company A and one user-driven application in Company B. The first observation regarding the differences between the two was that the changes to the design tool requested by Company A were oriented toward adding new measurements, changing the objectives of the optimization, and including more phenomena in the simulation. The requests put forward by Company B were entirely focused on the geometry generation. This might not be especially surprising, but it shows that many decisions regarding aspects less important to the company will lie in the hands of the developer. Another difference in attitude toward design tools was observed in terms of who would be the end user. Company A showed reluctance toward using the developed tools on their own; they would instead prefer to consult the developer when new designs needed to be generated. Company B was more inclined toward letting their industrial designers use the tool to generate new designs as can be seen by the frequency of discussions regarding the input to the system in the content analysis. This could be explained by the difference in emphasis on qualitative and quantitative aspects of the design. It also shows that it is important to decide who will be the user before the development starts, as very different requirements are put on an interface intended to be used by someone not familiar with the design tool. Overall, the challenges identified are not related to whether the design problems are artistic or technical in nature, but rather how to make the design process systematic.
The list of challenges found in this study is by no means exhaustive, but rather scratches the surface of the implementation issues that might be encountered when developing generative design systems. Issues relating to the integration of generative design systems into the company's organization, data management system, and development routines need to be studied before a fully mature system can be achieved. In addition, aspects relating to any commercial software need to be considered, such as how maintenance, licensing, and reliability should be handled. However, the study does offer an in-depth view into a number of hurdles that most likely will be encountered in similar projects, and since, as previously noted, there is a lack of similar studies of industrial projects, this paper also serves as a starting point for further investigation and future recommendations or methodologies for how to make the processes more efficient.
ACKNOWLEDGMENTS
Thanks to the companies involved in the case studies for their cooperation and support, to Senior Professor Robert Bjärnemo and Associate Professor Damien Motte at the Division of Product Development at Lund University, and to the reviewers for their valuable feedback on the manuscript.
Axel Nordin is an Assistant Professor in the Division of Product Development and Director of the Mechanical Engineering With Industrial Design Program at Lund University. He received a PhD and MS in mechanical engineering with industrial design from the same division. His research focuses on integrating industrial design and engineering design activities through computer-aided tools.


