


1 Introduction
Very long waves travelling upstream of ships are a recent observation in the Oslofjord, an inlet in Norway extending southward from Oslo into the Skagerrak. The phenomenon is new and the generation process is described here for the first time. The waves are formed when the new very large and relatively fast cruise ferries, which are conventional ships, travel across substantial depth changes,
 $\unicode[STIX]{x0394}h$
, where
$\unicode[STIX]{x0394}h$
, where
 $\unicode[STIX]{x0394}h$
typically is comparable to the average and relatively shallow water depth,
$\unicode[STIX]{x0394}h$
typically is comparable to the average and relatively shallow water depth,
 $h$
, at the location, i.e.
$h$
, at the location, i.e.
 $\unicode[STIX]{x0394}h/h\sim 1$
. The generation mechanism is linear. The waves running ahead of the ships propagate with the shallow water speed. The periods in the range 30–60 s are observed at the shore where shorter waves travel behind the main waves. The wavelength is 0.5–1 km, and crests extend across the 2–3 km wide fjord. The ship speed
$\unicode[STIX]{x0394}h/h\sim 1$
. The generation mechanism is linear. The waves running ahead of the ships propagate with the shallow water speed. The periods in the range 30–60 s are observed at the shore where shorter waves travel behind the main waves. The wavelength is 0.5–1 km, and crests extend across the 2–3 km wide fjord. The ship speed
 $U$
is subcritical with a depth Froude number
$U$
is subcritical with a depth Froude number
 $U/\sqrt{gh}$
in the range 0.4–0.7, where
$U/\sqrt{gh}$
in the range 0.4–0.7, where
 $g$
is the acceleration due to gravity. The Froude number based on the ship length
$g$
is the acceleration due to gravity. The Froude number based on the ship length
 $l$
is in the range
$l$
is in the range
 $Fr_{l}=U/\sqrt{gl}\sim 0.17-0.24$
.
$Fr_{l}=U/\sqrt{gl}\sim 0.17-0.24$
.
Documentation of observed wave heights, wave-induced currents and the consequence regarding erosion is provided in appendix A.1. A wave height of 1 m at specific locations along the shore is typical, and a wave height of up to 1.4 m has been measured. The wave-induced currents of up to approximately
 $1~\text{m}~\text{s}^{-1}$
, particularly the long lasting run-outs of approximately 15–30 s (half-wave period), contribute to a significant, new kind of erosion. This is according to reports from a group of landlords in the village of Flaskebekk, at the Oslofjord, where small traditional bath houses on the shore as well as piers – a cultural landscape dating back to the 1890s – are built on unconsolidated sediments with some fractions of rock. They are slowly sliding towards the sea because of the new wave phenomenon and erosion. Marinas experience damaged as well. According to the landlords the waves appeared in 2004 with the introduction of Fantasy, a cruise ferry of Color Line, which together with Magic are the world’s largest of their kind. Their displaced volume is 46 % larger than Perl Seaways of DFDS (Det Forenede Dampskibs-Selskab) which started operating in the Oslofjord in 2001 and 78 % larger than Crown Seaways of DFDS, introduced in 1994, where the ship characteristics are given in table 4 in appendix A.1. The ships of Color Line are cruising at a higher speed (up to 23 knots has been observed) compared to DFDS (16–17 knots), at the locations where the waves are generated.
$1~\text{m}~\text{s}^{-1}$
, particularly the long lasting run-outs of approximately 15–30 s (half-wave period), contribute to a significant, new kind of erosion. This is according to reports from a group of landlords in the village of Flaskebekk, at the Oslofjord, where small traditional bath houses on the shore as well as piers – a cultural landscape dating back to the 1890s – are built on unconsolidated sediments with some fractions of rock. They are slowly sliding towards the sea because of the new wave phenomenon and erosion. Marinas experience damaged as well. According to the landlords the waves appeared in 2004 with the introduction of Fantasy, a cruise ferry of Color Line, which together with Magic are the world’s largest of their kind. Their displaced volume is 46 % larger than Perl Seaways of DFDS (Det Forenede Dampskibs-Selskab) which started operating in the Oslofjord in 2001 and 78 % larger than Crown Seaways of DFDS, introduced in 1994, where the ship characteristics are given in table 4 in appendix A.1. The ships of Color Line are cruising at a higher speed (up to 23 knots has been observed) compared to DFDS (16–17 knots), at the locations where the waves are generated.
Studying a variant of the present problem, Sibul, Webster & Wehausen (Reference Sibul, Webster and Wehausen1979) performed force measurements in a towing tank of a ship moving over a rectangular box, obtaining a force response localized in time and a subsequent slowly decaying almost periodic signal. However, both the analysis and results were rather fragmented, with no firm conclusions. Other descriptions of the upstream waves we study seem not to exist. The mechanism investigated here differs fundamentally from the transcritical upstream waves due to a ship in water of constant depth where the upstream waves are caused by nonlinearity. Early experiments of the critical range by Constantine (Reference Constantine1960) showed that a quantity of fluid was continuously piled up ahead of the ship in the form of a bore. Conversely, the flow conditions in the subcritical and supercritical ranges were steady. Upstream, transcritical generation of solitons in two and three dimensions have been much explored, see e.g. (Cole Reference Cole1985; Ertekin, Webster & Wehausen Reference Ertekin, Webster and Wehausen1986; Wu Reference Wu1987 and Pedersen Reference Pedersen1988).
The downstream wave wake of fast ships with a speed in the range of 30–35 knots and Froude number based on the ship length exceeding
 $Fr_{l}>0.4$
(e.g. Torsvik Reference Torsvik, Quak and Soomere2009) has received attention in a number of publications. A set of experimental observations of an oblique solitary wave packet in the Kelvin wake of a fast ship, at sea, at
$Fr_{l}>0.4$
(e.g. Torsvik Reference Torsvik, Quak and Soomere2009) has received attention in a number of publications. A set of experimental observations of an oblique solitary wave packet in the Kelvin wake of a fast ship, at sea, at
 $Fr_{l}=0.49$
, in deep water, was analysed by Brown et al. (Reference Brown, Bucksbaum, Hall, Penhune, Schmitt, Watson and Wyatt1989). Combined with the shallow water effect, the fast ships may produce destructive waves at the shore where a wave height of up to 5 m has been reported (Hamer Reference Hamer1999). Measurements of the wave wakes of the fast ships, in the Bay of Tallinn, show three distinct groups of waves where the longest and fastest waves, of period in the range of 10–15 s and height of 1 m, dominate over the wind waves, see Soomere (Reference Soomere2005). Moreover, unusually high hydrodynamic loads in the deeper parts of the near shore are caused by the longer wake waves, see particularly § 4.4 in Soomere (Reference Soomere, Quak and Soomere2009). The dynamical similarity of the leading 200 m long diverging wave in the wave wake of a fast ship, at a water depth of 20 m, including the run-up at the beach, are compared to seismic and slide generated tsunamis in Didenkulova, Pelinovsky & Soomere (Reference Didenkulova, Pelinovsky and Soomere2011). The wave wake close to the critical depth Froude number, in a channel with a deeper trench and shallower depth at the sides, analysed by Torsvik, Pedersen & Dysthe (Reference Torsvik, Pedersen and Dysthe2009), exhibited a wave amplification due to the downstream wave packet. Their nonlinear calculations obtained upstream solitary wave generation similar to that described in the previous paragraph. The wave resistance in shallow water in subcritical and supercritical conditions shows a variation due to a varying depth (Wu & Chen Reference Wu and Chen2003).
$Fr_{l}=0.49$
, in deep water, was analysed by Brown et al. (Reference Brown, Bucksbaum, Hall, Penhune, Schmitt, Watson and Wyatt1989). Combined with the shallow water effect, the fast ships may produce destructive waves at the shore where a wave height of up to 5 m has been reported (Hamer Reference Hamer1999). Measurements of the wave wakes of the fast ships, in the Bay of Tallinn, show three distinct groups of waves where the longest and fastest waves, of period in the range of 10–15 s and height of 1 m, dominate over the wind waves, see Soomere (Reference Soomere2005). Moreover, unusually high hydrodynamic loads in the deeper parts of the near shore are caused by the longer wake waves, see particularly § 4.4 in Soomere (Reference Soomere, Quak and Soomere2009). The dynamical similarity of the leading 200 m long diverging wave in the wave wake of a fast ship, at a water depth of 20 m, including the run-up at the beach, are compared to seismic and slide generated tsunamis in Didenkulova, Pelinovsky & Soomere (Reference Didenkulova, Pelinovsky and Soomere2011). The wave wake close to the critical depth Froude number, in a channel with a deeper trench and shallower depth at the sides, analysed by Torsvik, Pedersen & Dysthe (Reference Torsvik, Pedersen and Dysthe2009), exhibited a wave amplification due to the downstream wave packet. Their nonlinear calculations obtained upstream solitary wave generation similar to that described in the previous paragraph. The wave resistance in shallow water in subcritical and supercritical conditions shows a variation due to a varying depth (Wu & Chen Reference Wu and Chen2003).
Although at a small length scale, the waves in consideration share many similarities of tsunamis caused by tectonics (e.g. Glimsdal et al. Reference Glimsdal, Pedersen, Atakan, Harbitz, Langtangen and Lovholt2006), submarine slides (e.g. Harbitz Reference Harbitz1992), underwater volcano eruptions or explosions, the latter with reported wavelengths in the range 0.1–1 km (e.g. Pelinovksy Reference Pelinovksy, Grue and Trulsen2006), the present waves are generated in a manner localized in time and space, by a mechanism of impulsive type, which is confirmed by the analysis and calculations in §§ 4 and 5 below. The long waves in the Oslofjord propagating with the shallow water speed are hard to detect in the middle of the fjord. Rather they are observed by the slow run-ups and run-downs in the bays and harbours along the shore where people have been using the term tsunami – harbour wave – which is of Japanese origin. We have found it tempting to characterize the present upstream ship generated waves as a mini-tsunami.
We provide a mathematical and numerical analysis, as well as an explanation and calculation of the new phenomenon, investigating of the upstream wave generation by the ships moving at subcritical speed across the depth changes. The paper is organized as follows. Observations are described in § 2. The mathematical formulation based on linear potential theory, integral equations and Fourier transform for the solution of the Laplace equation are given in § 3. An asymptotic analysis valid for small wavenumber and
 $\unicode[STIX]{x0394}h/h\ll 1$
is provided in § 4. Fully dispersive calculations at a positive or negative depth change with
$\unicode[STIX]{x0394}h/h\ll 1$
is provided in § 4. Fully dispersive calculations at a positive or negative depth change with
 $\unicode[STIX]{x0394}h/h\sim 1$
in a relatively narrow channel are given in § 5. Results for a wide channel are given in § 6. Conclusions are presented in § 7.
$\unicode[STIX]{x0394}h/h\sim 1$
in a relatively narrow channel are given in § 5. Results for a wide channel are given in § 6. Conclusions are presented in § 7.
Table 1. Wave periods between two consecutive inflows (in–in) and outflows (out–out) in harbours or small bays due to three different ships observed at three different positions.

2 Observations
The wave periods are observed at the shore line. Waves of shorter period succeed the main waves. The onsets of the inflows and outflows in a particular harbour in Flaskebekk, on the eastern side of the Oslofjord, were recorded by the author on 17 February 2016 using a stop watch. The wave periods due to the two ships, DFDS Pearl Seaways and Color Fantasy cruising by Flaskebekk, observation position 1, marked by an asterisk in figure 2(c), the first right after 9 a.m., at a speed of 8.6
 $\text{m}~\text{s}^{-1}$
, the second right before 9:30 a.m., at a speed of 10.3
$\text{m}~\text{s}^{-1}$
, the second right before 9:30 a.m., at a speed of 10.3
 $\text{m}~\text{s}^{-1}$
, were approximately 34 s for both ships, see table 1. A corresponding wavelength of approximately 830 m can be estimated by multiplying the period by the shallow water speed in the fjord. Note that the first inflow-to-inflow period of 26 s due the first slower and somewhat smaller ship may not be accurate, since the wave amplitude was rather small. A third wave period of 13 s due to the second, faster and larger ship was not generated by the slower one. A typical wave height of 1 m is documented in this harbour and a record height of 1.4 m has been measured by the owner, see the further documentation in appendix A.1.
$\text{m}~\text{s}^{-1}$
, were approximately 34 s for both ships, see table 1. A corresponding wavelength of approximately 830 m can be estimated by multiplying the period by the shallow water speed in the fjord. Note that the first inflow-to-inflow period of 26 s due the first slower and somewhat smaller ship may not be accurate, since the wave amplitude was rather small. A third wave period of 13 s due to the second, faster and larger ship was not generated by the slower one. A typical wave height of 1 m is documented in this harbour and a record height of 1.4 m has been measured by the owner, see the further documentation in appendix A.1.
A photograph of the outflow in the harbour due to the dominant depression wave is shown in figure 1. The ship Color Magic causing the harbour wave is seen to the right in the picture. The wave is generated at a position in the fjord located right behind Ildjernsflu lighthouse, which is seen in the picture above the pier, to the right of the white bath house. The harbour shown in figure 1 (position 1) and Ildjernsflu lighthouse are indicated on the sea chart shown in figure 2(a), available at www.oslofjorden.com/map/.

Figure 1. Outflow of tsunami in harbour at Flaskebekk, generated by the ship Color Magic seen in the picture. The generation site in the fjord is next to the lighthouse seen above the pier and to the right of the white bathhouse. The distance to the ship is approximately 1.2 km. Photo. T. H. Larsen.

Figure 2. (a) Section of sea chart of the Oslofjord at Ildjernsflu, with marked position of the Ildjernsflu lighthouse (
 $\leftarrow$
) and the harbour at Flaskebekk, imaged in figure 1 (
$\leftarrow$
) and the harbour at Flaskebekk, imaged in figure 1 (
 $\downarrow$
). The ship track is to the left of the violet dashed line. (b) Sea chart at Askholmene with position of video recording marked by
$\downarrow$
). The ship track is to the left of the violet dashed line. (b) Sea chart at Askholmene with position of video recording marked by
 $X$
. The ship track crosses over depths of 81 m, 39 m, 27 m. (c) Overview with positions of Ildjernsflu/Flaskebekk (*), Askholmene (
$X$
. The ship track crosses over depths of 81 m, 39 m, 27 m. (c) Overview with positions of Ildjernsflu/Flaskebekk (*), Askholmene (
 $\leftarrow$
) and Snarøya (
$\leftarrow$
) and Snarøya (
 $+$
) indicated. Panels (a,b) are minor sections of charts available at www.oslofjorden.com/map/. The Oslofjord is 109 km long.
$+$
) indicated. Panels (a,b) are minor sections of charts available at www.oslofjorden.com/map/. The Oslofjord is 109 km long.
The upstream ship waves extending across the 2–3 km wide fjord are observed along both shores. In a small bay at Snarøya on the north-western shore of the fjord, referred to as observation position 2, the wave periods recorded by the author were close to a minute, where the observed ship, Color Magic, was cruising at a speed of
 $7.8~\text{m}~\text{s}^{-1}$
, see table 1. The first period of
$7.8~\text{m}~\text{s}^{-1}$
, see table 1. The first period of
 $T=57$
s corresponds to a wavelength of approximately
$T=57$
s corresponds to a wavelength of approximately
 $900$
m. (On the day of observation, 7 January 2016, the Norwegian Coastal Administration performed blasting of 24 shallow rocks in the Inner Oslofjord, and the ship travelled at a reduced speed.)
$900$
m. (On the day of observation, 7 January 2016, the Norwegian Coastal Administration performed blasting of 24 shallow rocks in the Inner Oslofjord, and the ship travelled at a reduced speed.)
At Askholmene islands, located midway in the fjord north of the village of Drøbak, observation position 3, the southward track is located west of the islands, see the sea chart in figure 2(b). A video recording of the upstream waves at this position due to Color Magic is available at https://www.youtube.com/watch?v=42Ctdk9kpyg. The video shows that the very first motion in the bay is a weak outflow. This means that the leading upstream wave caused by the ship moving along a depth that is reduced is a weak wave of depression. Periods of the dominant wave train obtained from this video show
 $T=32\pm 3$
s for the leading two waves (table 1) and correspond to a wavelength of approximately 550 m.
$T=32\pm 3$
s for the leading two waves (table 1) and correspond to a wavelength of approximately 550 m.
The waves are generated when the ships travel across pronounced depth changes. Let
 $h_{A}$
denote the water depth along the ship’s track before the depth change,
$h_{A}$
denote the water depth along the ship’s track before the depth change,
 $h_{B}$
the typical depth in the shallow region and
$h_{B}$
the typical depth in the shallow region and
 $h_{C}$
depth after the shallow region. The wave generation is observed for a depth change
$h_{C}$
depth after the shallow region. The wave generation is observed for a depth change
 $\unicode[STIX]{x0394}h=h_{A}-h_{B}$
that is comparable to the average depth
$\unicode[STIX]{x0394}h=h_{A}-h_{B}$
that is comparable to the average depth
 $h=(h_{A}+h_{B})/2$
, i.e.
$h=(h_{A}+h_{B})/2$
, i.e.
 $\unicode[STIX]{x0394}h/h\simeq 1$
. The ratio
$\unicode[STIX]{x0394}h/h\simeq 1$
. The ratio
 $2(h_{C}-h_{B})/(h_{C}+h_{B})$
determines the relative depth change from shallow to deep water.
$2(h_{C}-h_{B})/(h_{C}+h_{B})$
determines the relative depth change from shallow to deep water.
The ship track at Ildjernsflu lighthouse is north/north-eastward, to the left of the violet dashed line in figure 2(a). A ridge extends south/south-westward of the lighthouse where depths in metres are marked by 11, 16 and 19 m. From the figure we estimate:
 $h_{A}\approx 46$
m and
$h_{A}\approx 46$
m and
 $h_{B}\approx 14$
m, giving
$h_{B}\approx 14$
m, giving
 $h=30$
m and
$h=30$
m and
 $\unicode[STIX]{x0394}h/h\simeq 1.067$
. Further, an extension of 700 m
$\unicode[STIX]{x0394}h/h\simeq 1.067$
. Further, an extension of 700 m
 ${\approx}23h$
of the shallow region along the ship’s track is estimated. The average depth of the fjord further north is approximately 60 m on the eastern side and approximately 25 m on the western side.
${\approx}23h$
of the shallow region along the ship’s track is estimated. The average depth of the fjord further north is approximately 60 m on the eastern side and approximately 25 m on the western side.
The south/south-eastward ship track at Askholmene, position 3, passes over the depths marked by 81, 39, 27 m in figure 2(b). Note that the depth is shallower than 20 m next to the position marked by 39 m. The water is only a few metres deep at each side of the track. The position of the video recording is marked by
 $X$
. From the figure we obtain:
$X$
. From the figure we obtain:
 $h_{A}\approx 80$
m and
$h_{A}\approx 80$
m and
 $h_{B}\approx 30$
m giving
$h_{B}\approx 30$
m giving
 $h=55$
m and
$h=55$
m and
 $\unicode[STIX]{x0394}h/h=0.909$
. The distances between observation position and generation site, and the ship’s track, are indicated in table 2. Figure 2(c) shows the positions in the Oslofjord.
$\unicode[STIX]{x0394}h/h=0.909$
. The distances between observation position and generation site, and the ship’s track, are indicated in table 2. Figure 2(c) shows the positions in the Oslofjord.
The displaced volumes of Pearl Seaways and Crown Seaways are 69 % and 55 %, respectively, of those of Color Line, see table 4 in appendix A.1 where also further descriptions of the observations are given.
Table 2. Distance (
 $D_{source}$
) between the generation site and the observation position, measured along the ship’s track, distance (
$D_{source}$
) between the generation site and the observation position, measured along the ship’s track, distance (
 $D_{track}$
) from observation position to track, depth before depth change (
$D_{track}$
) from observation position to track, depth before depth change (
 $h_{A}$
), depth of shallow region (
$h_{A}$
), depth of shallow region (
 $h_{B}$
), upstream depth (
$h_{B}$
), upstream depth (
 $h_{C}$
) and depth change ratio
$h_{C}$
) and depth change ratio
 $\unicode[STIX]{x0394}h/h=2(h_{A}-h_{B})/(h_{A}+h_{B})$
at observation positions 1–3.
$\unicode[STIX]{x0394}h/h=2(h_{A}-h_{B})/(h_{A}+h_{B})$
at observation positions 1–3.

3 Mathematical formulation
The analysis is three-dimensional. We introduce horizontal coordinates
 $\boldsymbol{x}=(x_{1},x_{2})$
, vertical coordinate
$\boldsymbol{x}=(x_{1},x_{2})$
, vertical coordinate
 $y$
, with
$y$
, with
 $y=0$
at the free surface at rest, and time
$y=0$
at the free surface at rest, and time
 $t$
. The generation by the ship is modelled by a moving pressure distribution (hovercraft) of similar length, width, draught and displacement. The surface pressure is moving with constant speed
$t$
. The generation by the ship is modelled by a moving pressure distribution (hovercraft) of similar length, width, draught and displacement. The surface pressure is moving with constant speed
 $U$
along the
$U$
along the
 $x_{1}$
-direction where a gentle ramp up of the motion is applied. The linear potential theory accounts for the effect of the bottom variation. The waves are obtained by integrating in time the linear kinematic and dynamic boundary conditions at the free surface:
$x_{1}$
-direction where a gentle ramp up of the motion is applied. The linear potential theory accounts for the effect of the bottom variation. The waves are obtained by integrating in time the linear kinematic and dynamic boundary conditions at the free surface:
 $$\begin{eqnarray}\unicode[STIX]{x2202}\unicode[STIX]{x1D702}/\unicode[STIX]{x2202}t=\unicode[STIX]{x2202}\unicode[STIX]{x1D719}/\unicode[STIX]{x2202}y,\quad \unicode[STIX]{x2202}\unicode[STIX]{x1D719}/\unicode[STIX]{x2202}t+g\unicode[STIX]{x1D702}=-p/\unicode[STIX]{x1D70C},\quad y=0,\end{eqnarray}$$
where
 $\unicode[STIX]{x1D702}$
denotes the elevation,
$\unicode[STIX]{x1D702}$
denotes the elevation,
 $\unicode[STIX]{x1D719}$
velocity potential,
$\unicode[STIX]{x1D719}$
velocity potential,
 $p$
pressure distribution and
$p$
pressure distribution and
 $\unicode[STIX]{x1D70C}$
density. The bottom variation is given by
$\unicode[STIX]{x1D70C}$
density. The bottom variation is given by
 $y_{B}=-h+\unicode[STIX]{x1D6FD}(\boldsymbol{x})$
where
$y_{B}=-h+\unicode[STIX]{x1D6FD}(\boldsymbol{x})$
where
 $h$
is an average depth and
$h$
is an average depth and
 $\unicode[STIX]{x1D6FD}$
the depth variation. We introduce
$\unicode[STIX]{x1D6FD}$
the depth variation. We introduce
 $$\begin{eqnarray}\unicode[STIX]{x1D719}_{F}(\boldsymbol{x})=\unicode[STIX]{x1D719}(\boldsymbol{x},y=0),\quad \unicode[STIX]{x1D719}_{B}(\boldsymbol{x})=\unicode[STIX]{x1D719}(\boldsymbol{x},y=y_{B}),\quad V=\unicode[STIX]{x2202}\unicode[STIX]{x1D719}/\unicode[STIX]{x2202}y|_{y=0},\end{eqnarray}$$
where
 $\unicode[STIX]{x1D719}_{F}$
denotes the potential evaluated at the free surface,
$\unicode[STIX]{x1D719}_{F}$
denotes the potential evaluated at the free surface,
 $\unicode[STIX]{x1D719}_{B}$
potential along the bottom and
$\unicode[STIX]{x1D719}_{B}$
potential along the bottom and
 $V$
the normal velocity at the free surface. The normal velocity at the bottom is zero. The functions
$V$
the normal velocity at the free surface. The normal velocity at the bottom is zero. The functions
 $\unicode[STIX]{x1D719}_{F}$
,
$\unicode[STIX]{x1D719}_{F}$
,
 $\unicode[STIX]{x1D719}_{B}$
and
$\unicode[STIX]{x1D719}_{B}$
and
 $V$
are connected through solution of the Laplace equation and are expressed in the form of a set of integral equations. The solution method is an extension of Clamond & Grue (Reference Clamond and Grue2001, § 6), Grue (Reference Grue2002, § 6), Fructus & Grue (Reference Fructus and Grue2007, § 3) and Grue (Reference Grue2015). An evaluation point on the free surface
$V$
are connected through solution of the Laplace equation and are expressed in the form of a set of integral equations. The solution method is an extension of Clamond & Grue (Reference Clamond and Grue2001, § 6), Grue (Reference Grue2002, § 6), Fructus & Grue (Reference Fructus and Grue2007, § 3) and Grue (Reference Grue2015). An evaluation point on the free surface
 $(y^{\prime }=0)$
gives
$(y^{\prime }=0)$
gives
 $$\begin{eqnarray}\int _{F}\left(\frac{1}{r}+\frac{1}{r_{1}}\right)\frac{\unicode[STIX]{x2202}\unicode[STIX]{x1D719}}{\unicode[STIX]{x2202}n}\,\text{d}S=2\unicode[STIX]{x03C0}\unicode[STIX]{x1D719}_{F}^{\prime }(\boldsymbol{x}^{\prime })+\int _{F+B}\unicode[STIX]{x1D719}\frac{\unicode[STIX]{x2202}}{\unicode[STIX]{x2202}n}\left(\frac{1}{r}+\frac{1}{r_{1}}\right)\,\text{d}S,\end{eqnarray}$$
where
 $1/r=(R^{2}+(y^{\prime }-y)^{2})^{-1/2}$
denotes a source function,
$1/r=(R^{2}+(y^{\prime }-y)^{2})^{-1/2}$
denotes a source function,
 $R=|\boldsymbol{x}^{\prime }-\boldsymbol{x}|$
horizontal distance,
$R=|\boldsymbol{x}^{\prime }-\boldsymbol{x}|$
horizontal distance,
 $1/r_{1}=(R^{2}+(y^{\prime }+y+2h)^{2})^{-1/2}$
the image with respect to
$1/r_{1}=(R^{2}+(y^{\prime }+y+2h)^{2})^{-1/2}$
the image with respect to
 $y^{\prime }=-h$
,
$y^{\prime }=-h$
,
 $F$
the free surface,
$F$
the free surface,
 $B$
bottom of the fluid layer and
$B$
bottom of the fluid layer and
 $\text{d}S$
integration element. The normal,
$\text{d}S$
integration element. The normal,
 $n$
, points out of the fluid. A prime indicates evaluation variable where
$n$
, points out of the fluid. A prime indicates evaluation variable where
 $\unicode[STIX]{x1D719}^{\prime }=\unicode[STIX]{x1D719}(\boldsymbol{x}^{\prime },y^{\prime })$
etc. For an evaluation point at the bottom (
$\unicode[STIX]{x1D719}^{\prime }=\unicode[STIX]{x1D719}(\boldsymbol{x}^{\prime },y^{\prime })$
etc. For an evaluation point at the bottom (
 $y^{\prime }=-h+\unicode[STIX]{x1D6FD}^{\prime }$
) we obtain
$y^{\prime }=-h+\unicode[STIX]{x1D6FD}^{\prime }$
) we obtain
 $$\begin{eqnarray}2\unicode[STIX]{x03C0}\unicode[STIX]{x1D719}_{B}^{\prime }(\boldsymbol{x}^{\prime })=\int _{F}\left(\frac{1}{r}+\frac{1}{r_{1B}}\right)\frac{\unicode[STIX]{x2202}\unicode[STIX]{x1D719}}{\unicode[STIX]{x2202}y}\,\text{d}S-\int _{B}\unicode[STIX]{x1D719}_{B}\frac{\unicode[STIX]{x2202}}{\unicode[STIX]{x2202}n}\left(\frac{1}{r}+\frac{1}{r_{1B}}\right)\,\text{d}S,\end{eqnarray}$$
where
 $1/r_{1B}=(R^{2}+(y^{\prime }+y)^{2})^{-1/2}$
. Solution of (3.3) and (3.4) is obtained expanding
$1/r_{1B}=(R^{2}+(y^{\prime }+y)^{2})^{-1/2}$
. Solution of (3.3) and (3.4) is obtained expanding
 $1/r$
and its images in powers of the bottom excursion
$1/r$
and its images in powers of the bottom excursion
 $\unicode[STIX]{x1D6FD}$
. Consider the integral over
$\unicode[STIX]{x1D6FD}$
. Consider the integral over
 $F$
in (3.4) where the function
$F$
in (3.4) where the function
 $1/r+1/r_{1B}$
is expressed by
$1/r+1/r_{1B}$
is expressed by
 $$\begin{eqnarray}\displaystyle \frac{1}{r}+\frac{1}{r_{1B}}=2\left(1-\unicode[STIX]{x1D6FD}^{\prime }\frac{\unicode[STIX]{x2202}}{\unicode[STIX]{x2202}h}+\frac{1}{2!}{\unicode[STIX]{x1D6FD}^{\prime }}^{2}\frac{\unicode[STIX]{x2202}^{2}}{\unicode[STIX]{x2202}h^{2}}-\frac{1}{3!}{\unicode[STIX]{x1D6FD}^{\prime }}^{3}\frac{\unicode[STIX]{x2202}^{3}}{\unicode[STIX]{x2202}h^{3}}+\cdots \,\right)\frac{1}{R_{0}},\quad R_{0}^{2}=R^{2}+h^{2}. & & \displaystyle \nonumber\\ \displaystyle & & \displaystyle\end{eqnarray}$$
Note that
 $1/R_{0}={\mathcal{F}}^{-1}[(2\unicode[STIX]{x03C0}/k)\text{e}^{-\text{i}\boldsymbol{k}\cdot \boldsymbol{x}-kh}]$
where
$1/R_{0}={\mathcal{F}}^{-1}[(2\unicode[STIX]{x03C0}/k)\text{e}^{-\text{i}\boldsymbol{k}\cdot \boldsymbol{x}-kh}]$
where
 ${\mathcal{F}}$
denotes Fourier transform,
${\mathcal{F}}$
denotes Fourier transform,
 ${\mathcal{F}}^{-1}$
inverse transform,
${\mathcal{F}}^{-1}$
inverse transform,
 $\boldsymbol{k}=(k_{1},k_{2})$
wavenumber vector in Fourier space and
$\boldsymbol{k}=(k_{1},k_{2})$
wavenumber vector in Fourier space and
 $k=|\boldsymbol{k}|$
. This gives for the integral over
$k=|\boldsymbol{k}|$
. This gives for the integral over
 $F$
in (3.4)
$F$
in (3.4)
 $$\begin{eqnarray}\displaystyle \frac{1}{2\unicode[STIX]{x03C0}}\int _{F}\left(\frac{1}{r}+\frac{1}{r_{1B}}\right)\frac{\unicode[STIX]{x2202}\unicode[STIX]{x1D719}}{\unicode[STIX]{x2202}y}\,\text{d}S & = & \displaystyle {\mathcal{F}}^{-1}\left[\frac{2\hat{V}e_{1}}{k}\right]+\frac{1}{1!}\unicode[STIX]{x1D6FD}^{\prime }{\mathcal{F}}^{-1}(2\hat{V}e_{1})+\frac{1}{2!}{\unicode[STIX]{x1D6FD}^{\prime }}^{2}{\mathcal{F}}^{-1}(2k\hat{V}e_{1})\nonumber\\ \displaystyle & & \displaystyle +\,\frac{1}{3!}{\unicode[STIX]{x1D6FD}^{\prime }}^{3}{\mathcal{F}}^{-1}(2k^{2}\hat{V}e_{1})+\cdots \,,\end{eqnarray}$$
where
 $e_{1}=\text{e}^{-kh}$
. Similarly the integrals over
$e_{1}=\text{e}^{-kh}$
. Similarly the integrals over
 $B$
in (3.4) are expressed by:
$B$
in (3.4) are expressed by:
 $$\begin{eqnarray}\displaystyle & & \displaystyle \displaystyle -\int _{B}\unicode[STIX]{x1D719}_{B}\frac{\unicode[STIX]{x2202}}{\unicode[STIX]{x2202}n}\frac{1}{r}\,\text{d}S=\int _{B}\unicode[STIX]{x1D6FB}_{1}\unicode[STIX]{x1D719}_{B}\cdot \left(\left[(\unicode[STIX]{x1D6FD}-\unicode[STIX]{x1D6FD}^{\prime })-\frac{1}{3!}(\unicode[STIX]{x1D6FD}-\unicode[STIX]{x1D6FD}^{\prime })^{3}\unicode[STIX]{x1D6FB}_{1}^{2}+\frac{1}{5!}(\unicode[STIX]{x1D6FD}-\unicode[STIX]{x1D6FD}^{\prime })^{5}\unicode[STIX]{x1D6FB}_{1}^{4}+\cdots \,\right]\right)\nonumber\\ \displaystyle & & \displaystyle \displaystyle \qquad \times \,\unicode[STIX]{x1D6FB}_{1}\frac{1}{R}\,\text{d}\boldsymbol{x},\end{eqnarray}$$
 $$\begin{eqnarray}\displaystyle & & \displaystyle \displaystyle -\int _{B}\unicode[STIX]{x1D719}_{B}\frac{\unicode[STIX]{x2202}}{\unicode[STIX]{x2202}n}\frac{1}{r_{1B}}\,\text{d}S=-\int _{B}\unicode[STIX]{x1D719}_{B}\frac{\unicode[STIX]{x2202}}{\unicode[STIX]{x2202}(2h)}\frac{1}{R_{1}}\,\text{d}\boldsymbol{x}\nonumber\\ \displaystyle & & \displaystyle \qquad +\,\int _{B}\unicode[STIX]{x1D6FB}_{1}\unicode[STIX]{x1D719}_{B}\cdot \left(\frac{1}{1!}(\unicode[STIX]{x1D6FD}+\unicode[STIX]{x1D6FD}^{\prime })-\frac{1}{2!}(\unicode[STIX]{x1D6FD}+\unicode[STIX]{x1D6FD}^{\prime })^{2}\frac{\unicode[STIX]{x2202}}{\unicode[STIX]{x2202}(2h)}+\frac{1}{3!}(\unicode[STIX]{x1D6FD}+\unicode[STIX]{x1D6FD}^{\prime })^{3}\frac{\unicode[STIX]{x2202}^{2}}{\unicode[STIX]{x2202}(2h)^{2}}-\,\cdots \right)\nonumber\\ \displaystyle & & \displaystyle \displaystyle \qquad \times \,\unicode[STIX]{x1D6FB}_{1}\frac{1}{R_{1}}\,\text{d}\boldsymbol{x},\end{eqnarray}$$
where in the latter
 $R_{1}^{2}=R^{2}+4h^{2}$
and
$R_{1}^{2}=R^{2}+4h^{2}$
and
 $\unicode[STIX]{x1D6FB}_{1}^{\prime }=(\unicode[STIX]{x2202}/\unicode[STIX]{x2202}x_{1}^{\prime },\unicode[STIX]{x2202}/\unicode[STIX]{x2202}x_{2}^{\prime })$
denotes the horizontal gradient. Using that
$\unicode[STIX]{x1D6FB}_{1}^{\prime }=(\unicode[STIX]{x2202}/\unicode[STIX]{x2202}x_{1}^{\prime },\unicode[STIX]{x2202}/\unicode[STIX]{x2202}x_{2}^{\prime })$
denotes the horizontal gradient. Using that
 $1/R={\mathcal{F}}^{-1}[(2\unicode[STIX]{x03C0}/k)\text{e}^{-\text{i}\boldsymbol{k}\cdot \boldsymbol{x}}]$
and
$1/R={\mathcal{F}}^{-1}[(2\unicode[STIX]{x03C0}/k)\text{e}^{-\text{i}\boldsymbol{k}\cdot \boldsymbol{x}}]$
and
 $1/R_{1}={\mathcal{F}}^{-1}[(2\unicode[STIX]{x03C0}/k)\text{e}^{-\text{i}\boldsymbol{k}\cdot \boldsymbol{x}-2kh}]$
the resulting set of equations for
$1/R_{1}={\mathcal{F}}^{-1}[(2\unicode[STIX]{x03C0}/k)\text{e}^{-\text{i}\boldsymbol{k}\cdot \boldsymbol{x}-2kh}]$
the resulting set of equations for
 $\unicode[STIX]{x1D719}_{B}$
is obtained by (A 4), (A 5) in appendix A.3. By similar procedures, the integral over
$\unicode[STIX]{x1D719}_{B}$
is obtained by (A 4), (A 5) in appendix A.3. By similar procedures, the integral over
 $B$
in the last term in (3.3) becomes
$B$
in the last term in (3.3) becomes
 $$\begin{eqnarray}\frac{1}{2\unicode[STIX]{x03C0}}{\mathcal{F}}\left(\int _{B}\frac{\unicode[STIX]{x2202}}{\unicode[STIX]{x2202}n}\left(\frac{1}{r}+\frac{1}{r_{1}}\right)\unicode[STIX]{x1D719}_{B}\,\text{d}S\right)=\frac{2\text{e}^{-kh}\text{i}\boldsymbol{k}}{k}\cdot \left[{\mathcal{F}}(\unicode[STIX]{x1D6FD}\unicode[STIX]{x1D6FB}_{1}\unicode[STIX]{x1D719}_{B})+\frac{k^{2}}{3!}{\mathcal{F}}(\unicode[STIX]{x1D6FD}^{3}\unicode[STIX]{x1D6FB}_{1}\unicode[STIX]{x1D719}_{B})+\cdots \,\right],\end{eqnarray}$$
while the surface integrals on the left-hand side and right-hand side of (3.3) become
 $2\unicode[STIX]{x03C0}\hat{V}(1+e_{1}^{2})/k$
and
$2\unicode[STIX]{x03C0}\hat{V}(1+e_{1}^{2})/k$
and
 $-2\unicode[STIX]{x03C0}\hat{\unicode[STIX]{x1D719}}_{F}e_{1}^{2}$
, respectively, giving
$-2\unicode[STIX]{x03C0}\hat{\unicode[STIX]{x1D719}}_{F}e_{1}^{2}$
, respectively, giving
 $$\begin{eqnarray}\hat{V}=kT_{1}\hat{\unicode[STIX]{x1D719}}_{F}+\left(\frac{1}{1!}\hat{A}_{1}+\frac{k^{2}}{3!}\hat{A}_{3}+\cdots \,\right)\frac{1}{C_{1}},\end{eqnarray}$$
where
 $T_{1}=\tanh kh$
,
$T_{1}=\tanh kh$
,
 $C_{1}=\cosh kh$
and
$C_{1}=\cosh kh$
and
 $\hat{A}_{n}=\text{i}\boldsymbol{k}\boldsymbol{\cdot }{\mathcal{F}}(\unicode[STIX]{x1D6FD}^{n}\unicode[STIX]{x1D6FB}_{1}\unicode[STIX]{x1D719}_{B})$
. The resulting set of equations expresses
$\hat{A}_{n}=\text{i}\boldsymbol{k}\boldsymbol{\cdot }{\mathcal{F}}(\unicode[STIX]{x1D6FD}^{n}\unicode[STIX]{x1D6FB}_{1}\unicode[STIX]{x1D719}_{B})$
. The resulting set of equations expresses
 $(V,\unicode[STIX]{x1D719}_{B})$
in terms of the surface potential
$(V,\unicode[STIX]{x1D719}_{B})$
in terms of the surface potential
 $\unicode[STIX]{x1D719}_{F}$
and expansions of the bottom variation ordered according to
$\unicode[STIX]{x1D719}_{F}$
and expansions of the bottom variation ordered according to
 $\unicode[STIX]{x1D6FD}^{n}$
(
$\unicode[STIX]{x1D6FD}^{n}$
(
 $n=0,1,2,\ldots$
) where the smallness parameter is
$n=0,1,2,\ldots$
) where the smallness parameter is
 $\text{max}(\unicode[STIX]{x1D6FD}/h)=O((\unicode[STIX]{x0394}h/h)/2)$
. The set of variables of the leading two orders become
$\text{max}(\unicode[STIX]{x1D6FD}/h)=O((\unicode[STIX]{x0394}h/h)/2)$
. The set of variables of the leading two orders become
 $$\begin{eqnarray}(k\hat{\unicode[STIX]{x1D719}}_{B}^{(0)},\hat{V}^{(0)})=(k\hat{\unicode[STIX]{x1D719}}_{F}/C_{1},kT_{1}\hat{\unicode[STIX]{x1D719}}_{F}),\quad (k\hat{\unicode[STIX]{x1D719}}_{B}^{(1)},\hat{V}^{(1)})=(-T_{1}\hat{A}_{1},\hat{A}_{1}/C_{1}).\end{eqnarray}$$
Regarding the vertical velocity we obtain that
 $\hat{V}^{(2)}=0$
and
$\hat{V}^{(2)}=0$
and
 $\hat{V}^{(3)}=k^{2}\hat{A}_{3}/(6C_{1})$
where
$\hat{V}^{(3)}=k^{2}\hat{A}_{3}/(6C_{1})$
where
 $T_{1},C_{1},\hat{A}_{n}$
are defined below (3.10). The representations
$T_{1},C_{1},\hat{A}_{n}$
are defined below (3.10). The representations
 $\unicode[STIX]{x1D719}_{B}^{(0)}+\unicode[STIX]{x1D719}_{B}^{(1)}+\unicode[STIX]{x1D719}_{B}^{(2)}+\unicode[STIX]{x1D719}_{B}^{(3)}$
and
$\unicode[STIX]{x1D719}_{B}^{(0)}+\unicode[STIX]{x1D719}_{B}^{(1)}+\unicode[STIX]{x1D719}_{B}^{(2)}+\unicode[STIX]{x1D719}_{B}^{(3)}$
and
 $\hat{V}^{(0)}+\hat{V}^{(1)}+\hat{V}^{(3)}$
are obtained iteratively from (3.11) and (A 4)–(A 5) in appendix A.3. We define the truncation level of the approximations of
$\hat{V}^{(0)}+\hat{V}^{(1)}+\hat{V}^{(3)}$
are obtained iteratively from (3.11) and (A 4)–(A 5) in appendix A.3. We define the truncation level of the approximations of
 $(\unicode[STIX]{x1D719}_{B},V)$
by
$(\unicode[STIX]{x1D719}_{B},V)$
by
 $$\begin{eqnarray}\displaystyle & \displaystyle s^{(1)}=(\unicode[STIX]{x1D719}_{B}^{(0)}+\unicode[STIX]{x1D719}_{B}^{(1)},V^{(0)}+V^{(1)}), & \displaystyle\end{eqnarray}$$
 $$\begin{eqnarray}\displaystyle & \displaystyle s^{(2)}=(\unicode[STIX]{x1D719}_{B}^{(0)}+\unicode[STIX]{x1D719}_{B}^{(1)}+\unicode[STIX]{x1D719}_{B}^{(2)},V^{(0)}+V^{(1)}), & \displaystyle\end{eqnarray}$$
 $$\begin{eqnarray}\displaystyle & \displaystyle s^{(3)}=(\unicode[STIX]{x1D719}_{B}^{(0)}+\unicode[STIX]{x1D719}_{B}^{(1)}+\unicode[STIX]{x1D719}_{B}^{(2)}+\unicode[STIX]{x1D719}_{B}^{(3)},V^{(0)}+V^{(1)}+V^{(3)}), & \displaystyle\end{eqnarray}$$
where convergence of the computations is illustrated using the approximations
 $s^{(2)}$
and
$s^{(2)}$
and
 $s^{(3)}$
, see § 5 below. The approximation
$s^{(3)}$
, see § 5 below. The approximation
 $s^{(2)}$
is computationally less expensive than
$s^{(2)}$
is computationally less expensive than
 $s^{(3)}$
.
$s^{(3)}$
.
The resulting equation system for the free surface variables
 $\unicode[STIX]{x1D702}$
and
$\unicode[STIX]{x1D702}$
and
 $\unicode[STIX]{x1D719}_{F}$
is expressed by Fourier transform
$\unicode[STIX]{x1D719}_{F}$
is expressed by Fourier transform
 $$\begin{eqnarray}\frac{\unicode[STIX]{x2202}\hat{\unicode[STIX]{x1D702}}}{\unicode[STIX]{x2202}t}=kT_{1}\hat{\unicode[STIX]{x1D719}}_{F}+{\hat{h}}_{1},\quad \frac{\unicode[STIX]{x2202}\hat{\unicode[STIX]{x1D719}}_{F}}{\unicode[STIX]{x2202}t}+g\hat{\unicode[STIX]{x1D702}}={\hat{h}}_{2},\end{eqnarray}$$
where
 ${\hat{h}}_{1}=\hat{A}_{1}/C_{1}+k^{2}\hat{A}_{3}/(6C_{1})+\cdots \,$
is obtained from (3.10) and
${\hat{h}}_{1}=\hat{A}_{1}/C_{1}+k^{2}\hat{A}_{3}/(6C_{1})+\cdots \,$
is obtained from (3.10) and
 ${\hat{h}}_{2}=-\hat{p}/\unicode[STIX]{x1D70C}$
is given by the moving pressure distribution. Time integration of (3.15) is expressed in matrix form:
${\hat{h}}_{2}=-\hat{p}/\unicode[STIX]{x1D70C}$
is given by the moving pressure distribution. Time integration of (3.15) is expressed in matrix form:
 ${\hat{Y}}_{t}+\unicode[STIX]{x1D63C}{\hat{Y}}={\hat{H}}$
where
${\hat{Y}}_{t}+\unicode[STIX]{x1D63C}{\hat{Y}}={\hat{H}}$
where
 ${\hat{Y}}=[\hat{\unicode[STIX]{x1D702}},(\unicode[STIX]{x1D714}/g)\hat{\unicode[STIX]{x1D719}}_{F}]^{T}$
,
${\hat{Y}}=[\hat{\unicode[STIX]{x1D702}},(\unicode[STIX]{x1D714}/g)\hat{\unicode[STIX]{x1D719}}_{F}]^{T}$
,
 ${\hat{H}}=[{\hat{h}}_{1},\unicode[STIX]{x1D714}{\hat{h}}_{2}/g]^{T}$
,
${\hat{H}}=[{\hat{h}}_{1},\unicode[STIX]{x1D714}{\hat{h}}_{2}/g]^{T}$
,
 $\unicode[STIX]{x1D714}^{2}=gk\tanh kh$
and
$\unicode[STIX]{x1D714}^{2}=gk\tanh kh$
and
 $[\,]^{T}$
denotes transpose. The matrix
$[\,]^{T}$
denotes transpose. The matrix
 $\unicode[STIX]{x1D63C}$
and its variant
$\unicode[STIX]{x1D63C}$
and its variant
 $\text{e}^{As}$
are obtained by
$\text{e}^{As}$
are obtained by
 $$\begin{eqnarray}\unicode[STIX]{x1D63C}=\left[\begin{array}{@{}cc@{}}0 & -\unicode[STIX]{x1D714}\\ \unicode[STIX]{x1D714} & 0\end{array}\right],\quad \text{e}^{As}=\left[\begin{array}{@{}cc@{}}\cos \unicode[STIX]{x1D714}s & -\sin \,\unicode[STIX]{x1D714}s\\ \sin \unicode[STIX]{x1D714}s & \cos \unicode[STIX]{x1D714}s\end{array}\right].\end{eqnarray}$$
Time integration of
 $(\text{e}^{At}{\hat{Y}})_{t}=\text{e}^{At}{\hat{H}}$
gives
$(\text{e}^{At}{\hat{Y}})_{t}=\text{e}^{At}{\hat{H}}$
gives
 ${\hat{Y}}=\int _{t_{0}}^{t}\text{e}^{A(s-t)}{\hat{H}}\,\text{d}s$
where no elevation, motion or pressure impulse for
${\hat{Y}}=\int _{t_{0}}^{t}\text{e}^{A(s-t)}{\hat{H}}\,\text{d}s$
where no elevation, motion or pressure impulse for
 $t_{0}<0$
are assumed. The elevation is obtained by
$t_{0}<0$
are assumed. The elevation is obtained by
 $$\begin{eqnarray}\hat{\unicode[STIX]{x1D702}}=\int _{t_{0}}^{t}\cos \unicode[STIX]{x1D714}(s-t)\,{\hat{h}}_{1}(s)\,\text{d}s+\int _{t_{0}}^{t}\sin \unicode[STIX]{x1D714}(s-t)\,\frac{\unicode[STIX]{x1D714}\,\hat{p}}{\unicode[STIX]{x1D70C}g}\,\text{d}s,\end{eqnarray}$$
where the first term accounts for the effect of the bottom variation and the second term the effect of the pressure distribution moving along a fluid layer of constant water depth
 $h$
. Equation (3.17) is used in the asymptotic analysis in § 4.
$h$
. Equation (3.17) is used in the asymptotic analysis in § 4.
4 Asymptotic analysis for long waves
The very long upstream ship waves motivate an asymptotic analysis valid for
 $kh\ll 1$
. The long wave analysis is complemented by fully dispersive calculations in § 5 below. Wave generation due to a depth change at
$kh\ll 1$
. The long wave analysis is complemented by fully dispersive calculations in § 5 below. Wave generation due to a depth change at
 $x_{1}=0$
is considered, where the water depth is assumed to be
$x_{1}=0$
is considered, where the water depth is assumed to be
 $h$
for
$h$
for
 $x_{1}<0$
and
$x_{1}<0$
and
 $h-\unicode[STIX]{x0394}h$
for
$h-\unicode[STIX]{x0394}h$
for
 $x_{1}>0$
, with
$x_{1}>0$
, with
 $\unicode[STIX]{x0394}h/h\ll 1$
. This means that
$\unicode[STIX]{x0394}h/h\ll 1$
. This means that
 $\unicode[STIX]{x1D6FD}=0$
for
$\unicode[STIX]{x1D6FD}=0$
for
 $x_{1}<0$
and
$x_{1}<0$
and
 $\unicode[STIX]{x1D6FD}=\unicode[STIX]{x0394}h$
for
$\unicode[STIX]{x1D6FD}=\unicode[STIX]{x0394}h$
for
 $x_{1}>0$
. For small
$x_{1}>0$
. For small
 $kh$
we have from (3.11)
$kh$
we have from (3.11)
 $\hat{\unicode[STIX]{x1D719}}_{B}\simeq \hat{\unicode[STIX]{x1D719}}_{B}^{(0)}\simeq \hat{\unicode[STIX]{x1D719}}_{F}$
where
$\hat{\unicode[STIX]{x1D719}}_{B}\simeq \hat{\unicode[STIX]{x1D719}}_{B}^{(0)}\simeq \hat{\unicode[STIX]{x1D719}}_{F}$
where
 $\cosh kh\simeq 1$
is used. Evaluating the Fourier transform we obtain for
$\cosh kh\simeq 1$
is used. Evaluating the Fourier transform we obtain for
 ${\hat{h}}_{1}$
:
${\hat{h}}_{1}$
:
 $$\begin{eqnarray}{\hat{h}}_{1}\simeq \text{i}k_{1}\unicode[STIX]{x0394}h\int _{0}^{\infty }\int _{-\infty }^{\infty }\frac{\unicode[STIX]{x2202}\unicode[STIX]{x1D719}_{F}}{\unicode[STIX]{x2202}x_{1}}\text{e}^{-\text{i}\boldsymbol{k}\cdot \boldsymbol{x}}\,\text{d}\boldsymbol{x}+O(k^{2})\simeq -\text{i}k_{1}\unicode[STIX]{x0394}h\int _{-\infty }^{\infty }\unicode[STIX]{x1D719}_{F}(x_{1}=0)\,\text{d}x_{2}+O(k^{2}),\end{eqnarray}$$
where partial integration in the
 $x_{1}$
-direction has been used. This obtains the leading contribution to the long wave formation by the wave potential integrated laterally along the step. The result (4.1) may alternatively be obtained directly from the integral equation formulation, see (A 3) in A.2. Time derivative of (4.1) gives:
$x_{1}$
-direction has been used. This obtains the leading contribution to the long wave formation by the wave potential integrated laterally along the step. The result (4.1) may alternatively be obtained directly from the integral equation formulation, see (A 3) in A.2. Time derivative of (4.1) gives:
 $$\begin{eqnarray}\frac{\unicode[STIX]{x2202}{\hat{h}}_{1}}{\unicode[STIX]{x2202}t}\simeq -\text{i}k_{1}\unicode[STIX]{x0394}h\int _{-\infty }^{\infty }\frac{\unicode[STIX]{x2202}\unicode[STIX]{x1D719}_{F}(x_{1}=0)}{\unicode[STIX]{x2202}t}\,\text{d}x_{2}\simeq \frac{\text{i}k_{1}\unicode[STIX]{x0394}h}{\unicode[STIX]{x1D70C}}\int _{-\infty }^{\infty }p(x_{1}=0)\,\text{d}x_{2},\end{eqnarray}$$
where the dynamic boundary condition at the free surface is used. By partial integration in time the first term in (3.17), which we denote by
 $\hat{\unicode[STIX]{x1D702}}_{0}$
, becomes,
$\hat{\unicode[STIX]{x1D702}}_{0}$
, becomes,
 $$\begin{eqnarray}\hat{\unicode[STIX]{x1D702}}_{0}=-\int _{t_{0}}^{t}\frac{\sin \unicode[STIX]{x1D714}(s-t)}{\unicode[STIX]{x1D714}}\frac{\unicode[STIX]{x2202}{\hat{h}}_{1}}{\unicode[STIX]{x2202}s}\,\text{d}s\simeq -\frac{\text{i}k_{1}\unicode[STIX]{x0394}h}{\unicode[STIX]{x1D70C}}\int _{t_{0}}^{t}\frac{\sin \unicode[STIX]{x1D714}(s-t)}{\unicode[STIX]{x1D714}}\int _{-\infty }^{\infty }p(x_{1}=0)\,\text{d}x_{2}\,\text{d}s,\end{eqnarray}$$
where (4.2) has been used. Equation (4.3) expresses
 $\hat{\unicode[STIX]{x1D702}}_{0}$
in terms of a pressure impulse acting at the depth change caused by the moving pressure distribution. By assuming that the pressure, moving with constant speed
$\hat{\unicode[STIX]{x1D702}}_{0}$
in terms of a pressure impulse acting at the depth change caused by the moving pressure distribution. By assuming that the pressure, moving with constant speed
 $U$
along the
$U$
along the
 $x_{1}$
-direction, is modelled by the Dirac delta function in the two horizontal directions, i.e.
$x_{1}$
-direction, is modelled by the Dirac delta function in the two horizontal directions, i.e.
 $p(x_{1}-Ut,x_{2},t)=\unicode[STIX]{x1D70C}gV_{0}\unicode[STIX]{x1D6FF}(x_{1}-Ut)\unicode[STIX]{x1D6FF}(x_{2})$
, we obtain
$p(x_{1}-Ut,x_{2},t)=\unicode[STIX]{x1D70C}gV_{0}\unicode[STIX]{x1D6FF}(x_{1}-Ut)\unicode[STIX]{x1D6FF}(x_{2})$
, we obtain
 $$\begin{eqnarray}\hat{\unicode[STIX]{x1D702}}_{0}=\frac{\text{i}k_{1}\unicode[STIX]{x0394}h\,V_{0}}{U\unicode[STIX]{x1D714}/g}\sin \unicode[STIX]{x1D714}t,\end{eqnarray}$$
where
 $V_{0}$
is the volume of the pressure distribution. For a distributed pressure, symmetrical in
$V_{0}$
is the volume of the pressure distribution. For a distributed pressure, symmetrical in
 $x_{1}$
and
$x_{1}$
and
 $x_{2}$
, the result (4.4) is multiplied by a function
$x_{2}$
, the result (4.4) is multiplied by a function
 $f(\unicode[STIX]{x1D705})=\int _{-l_{0}/2}^{l_{0}/2}\,\text{d}s^{\ast }\cos (\unicode[STIX]{x1D714}s^{\ast }/U)\times \int _{-w(x_{1})/2}^{-w(x_{1})/2}\,\text{d}x_{2}\tilde{d}(-s^{\ast },x_{2})$
where
$f(\unicode[STIX]{x1D705})=\int _{-l_{0}/2}^{l_{0}/2}\,\text{d}s^{\ast }\cos (\unicode[STIX]{x1D714}s^{\ast }/U)\times \int _{-w(x_{1})/2}^{-w(x_{1})/2}\,\text{d}x_{2}\tilde{d}(-s^{\ast },x_{2})$
where
 $\unicode[STIX]{x1D705}=\unicode[STIX]{x1D714}l_{0}/(2U)$
,
$\unicode[STIX]{x1D705}=\unicode[STIX]{x1D714}l_{0}/(2U)$
,
 $l_{0}$
is the length,
$l_{0}$
is the length,
 $w(x_{1})$
local width and
$w(x_{1})$
local width and
 $\tilde{d}$
the shape function of the pressure. Assuming, e.g.
$\tilde{d}$
the shape function of the pressure. Assuming, e.g.
 $\tilde{d}=d_{0}(1-(2x_{1}/l_{0})^{2}-(2x_{2}/w_{0})^{2})$
we obtain
$\tilde{d}=d_{0}(1-(2x_{1}/l_{0})^{2}-(2x_{2}/w_{0})^{2})$
we obtain
 $f(\unicode[STIX]{x1D705})=f_{0}(\unicode[STIX]{x1D705})=8J_{2}(\unicode[STIX]{x1D705})/\unicode[STIX]{x1D705}^{2}$
where
$f(\unicode[STIX]{x1D705})=f_{0}(\unicode[STIX]{x1D705})=8J_{2}(\unicode[STIX]{x1D705})/\unicode[STIX]{x1D705}^{2}$
where
 $J_{2}$
denotes the Bessel function of the first kind of order two, and is used for illustrative purposes in figure 3.
$J_{2}$
denotes the Bessel function of the first kind of order two, and is used for illustrative purposes in figure 3.

Figure 3. Asymptotic upstream wave train due to a delta function moving over a bottom step with
 $\unicode[STIX]{x0394}h>0$
for
$\unicode[STIX]{x0394}h>0$
for
 $Fr=0.5$
and
$Fr=0.5$
and
 $t^{\ast }=t\sqrt{g/h}=30,90$
. (a,b) Two-dimensional case obtained by (4.6) (——), leading part of elevation obtained by (4.7) (– – –), (4.6) multiplied by
$t^{\ast }=t\sqrt{g/h}=30,90$
. (a,b) Two-dimensional case obtained by (4.6) (——), leading part of elevation obtained by (4.7) (– – –), (4.6) multiplied by
 $f_{0}(\unicode[STIX]{x1D705}_{0})=8J_{2}(\unicode[STIX]{x1D705}_{0})/\unicode[STIX]{x1D705}_{0}^{2}$
,
$f_{0}(\unicode[STIX]{x1D705}_{0})=8J_{2}(\unicode[STIX]{x1D705}_{0})/\unicode[STIX]{x1D705}_{0}^{2}$
,
 $\unicode[STIX]{x1D705}_{0}=\unicode[STIX]{x1D714}_{0}l_{0}/(2U)$
,
$\unicode[STIX]{x1D705}_{0}=\unicode[STIX]{x1D714}_{0}l_{0}/(2U)$
,
 $l_{0}/h=3.82$
, for
$l_{0}/h=3.82$
, for
 $Fr=0.5$
(
$Fr=0.5$
(
 $\boldsymbol{\cdot }\boldsymbol{\cdot }\boldsymbol{\cdot }\,\boldsymbol{\cdot }$
) and
$\boldsymbol{\cdot }\boldsymbol{\cdot }\boldsymbol{\cdot }\,\boldsymbol{\cdot }$
) and
 $Fr=0.4$
(— ⋅ —). (c,d) Three-dimensional case. Cut along the
$Fr=0.4$
(— ⋅ —). (c,d) Three-dimensional case. Cut along the
 $x_{1}$
-axis with (4.11) (——) and (4.12) (– – –).
$x_{1}$
-axis with (4.11) (——) and (4.12) (– – –).
We first investigate the motion along a narrow channel where the far field motion can be considered as two-dimensional. (The two-dimensional analysis involves Fourier transform in the
 $x_{1}$
-direction only, however, the result (4.4) is unchanged. The volume
$x_{1}$
-direction only, however, the result (4.4) is unchanged. The volume
 $V_{0}$
is two-dimensional.) Inverse transform of (4.4) gives
$V_{0}$
is two-dimensional.) Inverse transform of (4.4) gives
 $$\begin{eqnarray}\displaystyle \unicode[STIX]{x1D702}_{0}(x_{1},t) & = & \displaystyle -\frac{\unicode[STIX]{x0394}h\,V_{0}}{2\unicode[STIX]{x03C0}\,U/g}\int _{0}^{\infty }\frac{k_{1}}{\unicode[STIX]{x1D714}}\cos (k_{1}x_{1}-\unicode[STIX]{x1D714}t)\,\text{d}k_{1}\nonumber\\ \displaystyle & & \displaystyle +\,\frac{\unicode[STIX]{x0394}h\,V_{0}}{2\unicode[STIX]{x03C0}\,U/g}\int _{0}^{\infty }\frac{k_{1}}{\unicode[STIX]{x1D714}}\cos (k_{1}x_{1}+\unicode[STIX]{x1D714}t)\,\text{d}k_{1}.\end{eqnarray}$$
The upstream waves are obtained by the method of stationary phase for
 $t\rightarrow \infty$
, giving,
$t\rightarrow \infty$
, giving,
 $$\begin{eqnarray}\unicode[STIX]{x1D702}_{0}(x_{1},t)=-\frac{k_{1,0}\unicode[STIX]{x0394}h\,V_{0}}{(U\unicode[STIX]{x1D714}_{0}/g)(2\unicode[STIX]{x03C0}|\unicode[STIX]{x1D714}^{\prime \prime }|t)^{1/2}}\cos \left(k_{1,0}x_{1}-\unicode[STIX]{x1D714}_{0}t+\frac{\unicode[STIX]{x03C0}}{4}\right)+O(t^{-1}).\end{eqnarray}$$
Here,
 $k_{1,0}$
is determined by
$k_{1,0}$
is determined by
 $\unicode[STIX]{x2202}\unicode[STIX]{x1D714}/\unicode[STIX]{x2202}k_{1}=x_{1}/t<\sqrt{gh}=c_{0}$
,
$\unicode[STIX]{x2202}\unicode[STIX]{x1D714}/\unicode[STIX]{x2202}k_{1}=x_{1}/t<\sqrt{gh}=c_{0}$
,
 $\unicode[STIX]{x1D714}_{0}=\unicode[STIX]{x1D714}(k_{1,0})$
and a double prime means double derivative. For
$\unicode[STIX]{x1D714}_{0}=\unicode[STIX]{x1D714}(k_{1,0})$
and a double prime means double derivative. For
 $x_{1}/t\rightarrow \sqrt{gh}$
both
$x_{1}/t\rightarrow \sqrt{gh}$
both
 $k_{1,0}\rightarrow 0$
and
$k_{1,0}\rightarrow 0$
and
 $\unicode[STIX]{x1D714}_{0}^{\prime \prime }\rightarrow 0$
, and the asymptotic expression (4.6) diverges. For
$\unicode[STIX]{x1D714}_{0}^{\prime \prime }\rightarrow 0$
, and the asymptotic expression (4.6) diverges. For
 $x_{1}/t>\sim \sqrt{gh}$
the first term in (4.5) is then expressed in terms of the Airy integral where the phase function for small
$x_{1}/t>\sim \sqrt{gh}$
the first term in (4.5) is then expressed in terms of the Airy integral where the phase function for small
 $k_{1}$
is expanded by
$k_{1}$
is expanded by
 $k_{1}x_{1}-\unicode[STIX]{x1D714}t\simeq k_{1}(x-c_{0}t)-c_{0}h^{2}k_{1}^{3}t/6+\cdots \,.$
Introducing the variables
$k_{1}x_{1}-\unicode[STIX]{x1D714}t\simeq k_{1}(x-c_{0}t)-c_{0}h^{2}k_{1}^{3}t/6+\cdots \,.$
Introducing the variables
 $Z=[2(x_{1}-c_{0}t)^{3}/c_{0}h^{2}t]^{1/3}$
and
$Z=[2(x_{1}-c_{0}t)^{3}/c_{0}h^{2}t]^{1/3}$
and
 $k_{1}(x_{1}-c_{0}t)=Z\unicode[STIX]{x1D6FC}$
, following Mei (Reference Mei1989), we obtain
$k_{1}(x_{1}-c_{0}t)=Z\unicode[STIX]{x1D6FC}$
, following Mei (Reference Mei1989), we obtain
 $$\begin{eqnarray}\unicode[STIX]{x1D702}_{0}(x_{1},t)\sim -\frac{\unicode[STIX]{x0394}h\,V_{0}}{(Uc_{0}/g)(4c_{0}h^{2}t)^{1/3}}\,\text{Ai}(Z),\end{eqnarray}$$
where
 $\text{Ai}(Z)$
denotes the Airy function.
$\text{Ai}(Z)$
denotes the Airy function.
Inverse transform of (4.4) in the three-dimensional case gives:
 $$\begin{eqnarray}\unicode[STIX]{x1D702}_{0}(x_{1},x_{2},t)=\frac{\unicode[STIX]{x0394}h\,V_{0}}{4\unicode[STIX]{x03C0}^{2}\,U/g}\frac{\unicode[STIX]{x2202}}{\unicode[STIX]{x2202}x_{1}}\int _{0}^{\infty }\int _{0}^{2\unicode[STIX]{x03C0}}\text{e}^{\text{i}kR\cos (\unicode[STIX]{x1D6FC}-\unicode[STIX]{x1D6FE})}\frac{\sin \unicode[STIX]{x1D714}t}{\unicode[STIX]{x1D714}}k\,\text{d}\unicode[STIX]{x1D6FC}\,\text{d}k,\end{eqnarray}$$
where
 $(x_{1},x_{2})=R(\cos \unicode[STIX]{x1D6FE},\sin \unicode[STIX]{x1D6FE})$
and
$(x_{1},x_{2})=R(\cos \unicode[STIX]{x1D6FE},\sin \unicode[STIX]{x1D6FE})$
and
 $(k_{1},k_{2})=k(\cos \unicode[STIX]{x1D6FC},\sin \unicode[STIX]{x1D6FC})$
are introduced. The inner integral in (4.8) is
$(k_{1},k_{2})=k(\cos \unicode[STIX]{x1D6FC},\sin \unicode[STIX]{x1D6FC})$
are introduced. The inner integral in (4.8) is
 $J_{0}(kR)$
, the Bessel function of the first kind of order zero, giving
$J_{0}(kR)$
, the Bessel function of the first kind of order zero, giving
 $$\begin{eqnarray}\unicode[STIX]{x1D702}_{0}(x_{1},x_{2},t)=\frac{\unicode[STIX]{x0394}h\,V_{0}}{2\unicode[STIX]{x03C0}\,U/g}\frac{\unicode[STIX]{x2202}}{\unicode[STIX]{x2202}x_{1}}\int _{0}^{\infty }\frac{\sin \unicode[STIX]{x1D714}t}{\unicode[STIX]{x1D714}}J_{0}(kR)k\,\text{d}k.\end{eqnarray}$$
Investigating the contribution for large
 $kR$
where asymptotically
$kR$
where asymptotically
 $J_{0}(kR)\sim (2/(\unicode[STIX]{x03C0}kR))^{1/2}\times \cos (kR-\unicode[STIX]{x03C0}/4)$
, we obtain
$J_{0}(kR)\sim (2/(\unicode[STIX]{x03C0}kR))^{1/2}\times \cos (kR-\unicode[STIX]{x03C0}/4)$
, we obtain
 $$\begin{eqnarray}\displaystyle \unicode[STIX]{x1D702}_{0}(R,t) & {\sim} & \displaystyle \frac{\unicode[STIX]{x0394}h\,V_{0}}{4\unicode[STIX]{x03C0}\,U/g}\frac{\unicode[STIX]{x2202}}{\unicode[STIX]{x2202}x_{1}}\int _{0}^{\infty }\frac{k}{\unicode[STIX]{x1D714}}\left(\frac{2}{\unicode[STIX]{x03C0}kR}\right)^{1/2}\left(-\sin \left(kR-\unicode[STIX]{x1D714}t-\frac{\unicode[STIX]{x03C0}}{4}\right)\right.\nonumber\\ \displaystyle & & \displaystyle \left.+\,\sin \left(kR+\unicode[STIX]{x1D714}t-\frac{\unicode[STIX]{x03C0}}{4}\right)\right)\,\text{d}k.\end{eqnarray}$$
The asymptotic elevation, obtained by the method of stationary phase for large
 $R$
and
$R$
and
 $t$
, becomes
$t$
, becomes
 $$\begin{eqnarray}\unicode[STIX]{x1D702}_{0}(R,t)\sim -\frac{\unicode[STIX]{x0394}h\,V_{0}k_{0}}{2\unicode[STIX]{x03C0}\,U\unicode[STIX]{x1D714}_{0}/g}\,\frac{\unicode[STIX]{x2202}}{\unicode[STIX]{x2202}x_{1}}\,\frac{\sin (k_{0}R-\unicode[STIX]{x1D714}_{0}t)}{(k_{0}R|\unicode[STIX]{x1D714}_{0}^{\prime \prime }|t)^{1/2}},\end{eqnarray}$$
where
 $k_{0}$
is determined by
$k_{0}$
is determined by
 $R/t=\unicode[STIX]{x2202}\unicode[STIX]{x1D714}/\unicode[STIX]{x2202}k<\sqrt{gh}$
,
$R/t=\unicode[STIX]{x2202}\unicode[STIX]{x1D714}/\unicode[STIX]{x2202}k<\sqrt{gh}$
,
 $\unicode[STIX]{x1D714}_{0}=\unicode[STIX]{x1D714}(k_{0})$
and a double prime means double derivative.
$\unicode[STIX]{x1D714}_{0}=\unicode[STIX]{x1D714}(k_{0})$
and a double prime means double derivative.
Equation (4.11) is not valid ahead of the wave front. Clarisse, Newman & Ursell (Reference Clarisse, Newman and Ursell1995, equation (6.15)) have developed a second-order asymptotic expression for the integral
 $\int _{0}^{\infty }(1/\unicode[STIX]{x1D714})\sin \unicode[STIX]{x1D714}tJ_{0}(kR)k\,\text{d}k$
in (4.9) valid for
$\int _{0}^{\infty }(1/\unicode[STIX]{x1D714})\sin \unicode[STIX]{x1D714}tJ_{0}(kR)k\,\text{d}k$
in (4.9) valid for
 $R/t\sim \sqrt{gh}$
, giving for the present wave field
$R/t\sim \sqrt{gh}$
, giving for the present wave field
 $$\begin{eqnarray}\displaystyle \unicode[STIX]{x1D702}_{0}(x_{1},x_{2},t)\sim \frac{\unicode[STIX]{x0394}h\,V_{0}/h^{2}}{2\unicode[STIX]{x03C0}\,U/\sqrt{gh}}\frac{\unicode[STIX]{x2202}}{\unicode[STIX]{x2202}x_{1}}\frac{2^{1/3}\unicode[STIX]{x03C0}}{(R^{\ast }/t^{\ast })^{1/2}t^{\ast 2/3}}[E_{0}\text{Ai}^{2}-t^{\ast -2/3}C_{0}{\text{Ai}^{\prime }}^{2}+2t^{\ast -4/3}A_{1}\text{Ai}\text{Ai}^{\prime }]. & & \displaystyle \nonumber\\ \displaystyle & & \displaystyle\end{eqnarray}$$
The argument of the Airy function
 $\text{Ai}$
and its derivative
$\text{Ai}$
and its derivative
 $\text{Ai}^{\prime }$
is specified below (Clarisse et al.
Reference Clarisse, Newman and Ursell1995, equation (6.15)) and
$\text{Ai}^{\prime }$
is specified below (Clarisse et al.
Reference Clarisse, Newman and Ursell1995, equation (6.15)) and
 $R^{\ast }=R/h$
and
$R^{\ast }=R/h$
and
 $t^{\ast }=t\sqrt{g/h}$
. The functions
$t^{\ast }=t\sqrt{g/h}$
. The functions
 $E_{0}$
and
$E_{0}$
and
 $C_{0}$
are obtained from saddle points 1 and 2 of the phase function of their asymptotic integral, see Clarisse et al. (Reference Clarisse, Newman and Ursell1995, equation (5.4)), and are evaluated here.
$C_{0}$
are obtained from saddle points 1 and 2 of the phase function of their asymptotic integral, see Clarisse et al. (Reference Clarisse, Newman and Ursell1995, equation (5.4)), and are evaluated here.
The asymptotic analysis provides in mathematical terms a qualitative explanation of the upstream wave generation which by (4.3) is expressed in terms of a pressure impulse acting at the bottom step. The leading waves propagate with the shallow water speed
 $c_{0}=\sqrt{gh}$
where the wave amplitude is proportional to the depth change
$c_{0}=\sqrt{gh}$
where the wave amplitude is proportional to the depth change
 $\unicode[STIX]{x0394}h$
times the volume
$\unicode[STIX]{x0394}h$
times the volume
 $V_{0}$
of the ship. In the three-dimensional case, the wave crests are circular. The amplitude is multiplied by the cosine of the wave angle defined from direction of motion of the pressure and appears because of the derivative
$V_{0}$
of the ship. In the three-dimensional case, the wave crests are circular. The amplitude is multiplied by the cosine of the wave angle defined from direction of motion of the pressure and appears because of the derivative
 $\unicode[STIX]{x2202}/\unicode[STIX]{x2202}x_{1}$
in (4.11). For a positive
$\unicode[STIX]{x2202}/\unicode[STIX]{x2202}x_{1}$
in (4.11). For a positive
 $\unicode[STIX]{x0394}h$
, where the depth is reduced from
$\unicode[STIX]{x0394}h$
, where the depth is reduced from
 $h$
to
$h$
to
 $h-\unicode[STIX]{x0394}h$
, the leading upstream wave is a depression, while the downstream waves have a positive leading elevation, both in two and three dimensions. A leading upstream wave of depression at a depth change from deep to shallow water is in accordance with the video recording at the observation position 3 at Askholmene (https://www.youtube.com/watch?v=42Ctdk9kpyg). The conclusion is opposite for a negative step with
$h-\unicode[STIX]{x0394}h$
, the leading upstream wave is a depression, while the downstream waves have a positive leading elevation, both in two and three dimensions. A leading upstream wave of depression at a depth change from deep to shallow water is in accordance with the video recording at the observation position 3 at Askholmene (https://www.youtube.com/watch?v=42Ctdk9kpyg). The conclusion is opposite for a negative step with
 $\unicode[STIX]{x0394}h<0$
. Upstream wave trains obtained by the asymptotics in two and three dimensions are visualized in figure 3 (
$\unicode[STIX]{x0394}h<0$
. Upstream wave trains obtained by the asymptotics in two and three dimensions are visualized in figure 3 (
 $\unicode[STIX]{x0394}h>0$
).
$\unicode[STIX]{x0394}h>0$
).
While (4.4) and the subsequent derivations are based on a localized effect of the pressure impulse in the form of a delta function, a distributed pressure modifies the far field waves. Results multiplying the two-dimensional wave amplitude in (4.6) by the function
 $f_{0}(\unicode[STIX]{x1D705}_{0})=8J_{2}(\unicode[STIX]{x1D705}_{0})/\unicode[STIX]{x1D705}_{0}^{2}$
, with
$f_{0}(\unicode[STIX]{x1D705}_{0})=8J_{2}(\unicode[STIX]{x1D705}_{0})/\unicode[STIX]{x1D705}_{0}^{2}$
, with
 $\unicode[STIX]{x1D705}_{0}=\unicode[STIX]{x1D714}_{0}l_{0}/(2U)$
, as obtained below (4.4), with
$\unicode[STIX]{x1D705}_{0}=\unicode[STIX]{x1D714}_{0}l_{0}/(2U)$
, as obtained below (4.4), with
 $l_{0}/h=3.82$
, a length ratio fitting with the conditions discussed in § 5, are included in figure 3(a,b), for
$l_{0}/h=3.82$
, a length ratio fitting with the conditions discussed in § 5, are included in figure 3(a,b), for
 $Fr=0.4$
and 0.5. Apart from the leading trough, the amplitude of the modified far field waves exhibit a weak increase with the Froude number.
$Fr=0.4$
and 0.5. Apart from the leading trough, the amplitude of the modified far field waves exhibit a weak increase with the Froude number.
5 Fully dispersive calculations
Calculations of fully dispersive wave fields complement the asymptotic analysis in § 4 and are connected to the observations in § 2. The equation system
 $(\text{e}^{At}{\hat{Y}})_{t}=\text{e}^{At}{\hat{H}}$
defined in the text above and below (3.16a,b
) is integrated forward in time using a fourth-order Runge–Kutta scheme (RK4) (with time step
$(\text{e}^{At}{\hat{Y}})_{t}=\text{e}^{At}{\hat{H}}$
defined in the text above and below (3.16a,b
) is integrated forward in time using a fourth-order Runge–Kutta scheme (RK4) (with time step
 $\unicode[STIX]{x0394}t\sqrt{g/h}=0.025$
) where the moving pressure distribution
$\unicode[STIX]{x0394}t\sqrt{g/h}=0.025$
) where the moving pressure distribution
 $p(x_{1}-x_{1,0}(t),x_{2})$
is specified below. The coordinate
$p(x_{1}-x_{1,0}(t),x_{2})$
is specified below. The coordinate
 $x_{1,0}(t)$
gives the forward motion where
$x_{1,0}(t)$
gives the forward motion where
 $U={\dot{x}}_{1,0}(t)$
. The numerical discretization is obtained over horizontal rectangles of length and width of
$U={\dot{x}}_{1,0}(t)$
. The numerical discretization is obtained over horizontal rectangles of length and width of
 $L_{1}$
and
$L_{1}$
and
 $L_{2}$
, respectively, with
$L_{2}$
, respectively, with
 $N_{1}$
by
$N_{1}$
by
 $N_{2}$
computational points in each respective direction and a resolution of
$N_{2}$
computational points in each respective direction and a resolution of
 $(\unicode[STIX]{x0394}x_{1},\unicode[STIX]{x0394}x_{2})=(L_{1}/N_{1},L_{2}/N_{2})$
. Use of Fourier transform implies that the computational domain is periodic in both directions, where length
$(\unicode[STIX]{x0394}x_{1},\unicode[STIX]{x0394}x_{2})=(L_{1}/N_{1},L_{2}/N_{2})$
. Use of Fourier transform implies that the computational domain is periodic in both directions, where length
 $L_{1}$
much greater than the width
$L_{1}$
much greater than the width
 $L_{2}$
in practice models a long channel with straight walls. The finite length
$L_{2}$
in practice models a long channel with straight walls. The finite length
 $L_{1}$
puts limits on the length of the time simulation where the calculations are stopped before the motion interacts with itself. The wavenumber vectors in spectral space read
$L_{1}$
puts limits on the length of the time simulation where the calculations are stopped before the motion interacts with itself. The wavenumber vectors in spectral space read
 $(0,\unicode[STIX]{x0394}k_{1},2\unicode[STIX]{x0394}k_{1},\ldots ,(N_{1}/2-1)\unicode[STIX]{x0394}k_{1},-(N_{1}/2)\unicode[STIX]{x0394}k_{1},\ldots ,-\unicode[STIX]{x0394}k_{1})$
and
$(0,\unicode[STIX]{x0394}k_{1},2\unicode[STIX]{x0394}k_{1},\ldots ,(N_{1}/2-1)\unicode[STIX]{x0394}k_{1},-(N_{1}/2)\unicode[STIX]{x0394}k_{1},\ldots ,-\unicode[STIX]{x0394}k_{1})$
and
 $(0,\unicode[STIX]{x0394}k_{2},2\unicode[STIX]{x0394}k_{2},\ldots ,(N_{2}/2-1)\unicode[STIX]{x0394}k_{2})$
where symmetry in the
$(0,\unicode[STIX]{x0394}k_{2},2\unicode[STIX]{x0394}k_{2},\ldots ,(N_{2}/2-1)\unicode[STIX]{x0394}k_{2})$
where symmetry in the
 $k_{2}$
-direction is assumed. The number of operations of the method is governed by the fast Fourier transform (FFT) operations which is
$k_{2}$
-direction is assumed. The number of operations of the method is governed by the fast Fourier transform (FFT) operations which is
 $O(N_{0}\log N_{0})$
, where
$O(N_{0}\log N_{0})$
, where
 $N_{0}=N_{1}\cdot N_{2}$
, the number of calculation nodes, and is up to
$N_{0}=N_{1}\cdot N_{2}$
, the number of calculation nodes, and is up to
 $N_{0}=720\times 720\simeq 0.5\times 10^{6}$
using a Lenovo T430 thinkpad.
$N_{0}=720\times 720\simeq 0.5\times 10^{6}$
using a Lenovo T430 thinkpad.
5.1 Bottom step in a moderately narrow channel
The bottom profile along the
 $x_{1}$
-direction is assumed to be given by the function
$x_{1}$
-direction is assumed to be given by the function
 $$\begin{eqnarray}\unicode[STIX]{x1D6FD}=-\frac{1}{2}\unicode[STIX]{x0394}h+\frac{1}{2}\unicode[STIX]{x0394}h[\tanh (\unicode[STIX]{x1D6FC}_{0}(x_{1}-x_{1,a}))-\tanh (\unicode[STIX]{x1D6FC}_{0}(x_{1}-x_{1,b}))],\end{eqnarray}$$
where
 $x_{1,a}$
denotes the centre position of the depth change,
$x_{1,a}$
denotes the centre position of the depth change,
 $x_{1,b}$
the similar position where the water becomes deep again and
$x_{1,b}$
the similar position where the water becomes deep again and
 $\unicode[STIX]{x1D6FC}_{0}$
is either
$\unicode[STIX]{x1D6FC}_{0}$
is either
 $0.7$
or
$0.7$
or
 $2.0$
, see figure 4. A uniform depth in the lateral direction is assumed. The applied surface pressure, given here by
$2.0$
, see figure 4. A uniform depth in the lateral direction is assumed. The applied surface pressure, given here by
 $p(x_{1},x_{2})=p_{0}\exp (-(2x_{1}/l_{0})^{6}-(2x_{2}/w_{0})^{6})$
, where
$p(x_{1},x_{2})=p_{0}\exp (-(2x_{1}/l_{0})^{6}-(2x_{2}/w_{0})^{6})$
, where
 $l_{0}$
and
$l_{0}$
and
 $w_{0}$
denote length and width, respectively, is connected to the ship volume
$w_{0}$
denote length and width, respectively, is connected to the ship volume
 $V_{0}$
by
$V_{0}$
by
 $\int \int p\,\text{d}x_{1}\,\text{d}x_{2}=\unicode[STIX]{x1D70C}gV_{0}$
. The velocity
$\int \int p\,\text{d}x_{1}\,\text{d}x_{2}=\unicode[STIX]{x1D70C}gV_{0}$
. The velocity
 ${\dot{x}}_{1,0}(t)$
of the moving pressure has a gentle ramp up phase generating minimal upstream waves (
${\dot{x}}_{1,0}(t)$
of the moving pressure has a gentle ramp up phase generating minimal upstream waves (
 ${\dot{x}}_{1,0}(t)=U\sin (t/T_{0}),T_{0}\sqrt{g/h}=150$
,
${\dot{x}}_{1,0}(t)=U\sin (t/T_{0}),T_{0}\sqrt{g/h}=150$
,
 $x_{1,0}(t=0)=6h$
).
$x_{1,0}(t=0)=6h$
).

Figure 4. Bottom geometries, section at
 $x_{2}=\text{const}.$
With reference to the conditions at the observation position 3 (table 2) a reference depth of
 $h=55$
m and depth change ratio of
$h=55$
m and depth change ratio of
 $\unicode[STIX]{x0394}h/h=0.909$
are used. The non-dimensional volume and length of the largest among the ships in table 4 in appendix A.1 become
$\unicode[STIX]{x0394}h/h=0.909$
are used. The non-dimensional volume and length of the largest among the ships in table 4 in appendix A.1 become
 $V_{0}^{\prime }=V_{0}/h^{3}\simeq 0.216$
and
$V_{0}^{\prime }=V_{0}/h^{3}\simeq 0.216$
and
 $l_{0}/h\simeq 3.82$
, respectively. Two different computational rectangles are used, the first, for
$l_{0}/h\simeq 3.82$
, respectively. Two different computational rectangles are used, the first, for
 $\unicode[STIX]{x0394}h>0$
:
$\unicode[STIX]{x0394}h>0$
:
 $(L_{1},L_{2})=(200h,13h)$
,
$(L_{1},L_{2})=(200h,13h)$
,
 $(N_{1},N_{2})=(1400,200)$
,
$(N_{1},N_{2})=(1400,200)$
,
 $x_{1,a}=60$
,
$x_{1,a}=60$
,
 $x_{1,b}=180$
and the second, for
$x_{1,b}=180$
and the second, for
 $\unicode[STIX]{x0394}h<0$
:
$\unicode[STIX]{x0394}h<0$
:
 $(L_{1},L_{2})=(320h,13h)$
,
$(L_{1},L_{2})=(320h,13h)$
,
 $(N_{1},N_{2})=(1800,200)$
,
$(N_{1},N_{2})=(1800,200)$
,
 $x_{1,a}=80$
,
$x_{1,a}=80$
,
 $x_{1,b}=300$
. Note that the width of the numerical channel of
$x_{1,b}=300$
. Note that the width of the numerical channel of
 $L_{2}=13h$
corresponds to twice the distance between the observation position 3 and the ship’s track.
$L_{2}=13h$
corresponds to twice the distance between the observation position 3 and the ship’s track.
A typical ship speed of
 ${\dot{x}}_{1,0}=U=10~\text{m}~\text{s}^{-1}$
gives
${\dot{x}}_{1,0}=U=10~\text{m}~\text{s}^{-1}$
gives
 $Fr=U/\sqrt{gh}\simeq 0.43$
where simulations are carried out for
$Fr=U/\sqrt{gh}\simeq 0.43$
where simulations are carried out for
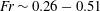 $Fr\sim 0.26-0.51$
. The elevation ahead of the ship, comparing the two approximations
$Fr\sim 0.26-0.51$
. The elevation ahead of the ship, comparing the two approximations
 $s^{(2)}$
and
$s^{(2)}$
and
 $s^{(3)}$
given in (3.13) and (3.14), is obtained for
$s^{(3)}$
given in (3.13) and (3.14), is obtained for
 $\unicode[STIX]{x0394}h>0,Fr=0.43$
and
$\unicode[STIX]{x0394}h>0,Fr=0.43$
and
 $t^{\ast }=281$
in figure 5(a). Results for the case with
$t^{\ast }=281$
in figure 5(a). Results for the case with
 $\unicode[STIX]{x0394}h<0$
are shown for
$\unicode[STIX]{x0394}h<0$
are shown for
 $Fr=0.51$
,
$Fr=0.51$
,
 $t^{\ast }=260$
in figure 5(b). Both sets of results are obtained with a bottom slope of
$t^{\ast }=260$
in figure 5(b). Both sets of results are obtained with a bottom slope of
 $\unicode[STIX]{x1D6FC}_{0}=0.7$
, where the very small difference between the two approximations illustrates the convergence of the method. Note that the approximations
$\unicode[STIX]{x1D6FC}_{0}=0.7$
, where the very small difference between the two approximations illustrates the convergence of the method. Note that the approximations
 $s^{(2)}$
and
$s^{(2)}$
and
 $s^{(3)}$
model short wave effects differently, e.g. the bow wave of the pressure distribution, see figure 5(c,d). The entire computational domain is shown in figure 5(e) for
$s^{(3)}$
model short wave effects differently, e.g. the bow wave of the pressure distribution, see figure 5(c,d). The entire computational domain is shown in figure 5(e) for
 $\unicode[STIX]{x0394}h<0$
,
$\unicode[STIX]{x0394}h<0$
,
 $t^{\ast }=293$
. The upstream wave due to a slope factor of
$t^{\ast }=293$
. The upstream wave due to a slope factor of
 $\unicode[STIX]{x1D6FC}_{0}=2.0$
, obtained for
$\unicode[STIX]{x1D6FC}_{0}=2.0$
, obtained for
 $Fr=0.43,t^{\ast }=281$
, is somewhat ahead of the wave produced with a slope factor of
$Fr=0.43,t^{\ast }=281$
, is somewhat ahead of the wave produced with a slope factor of
 $\unicode[STIX]{x1D6FC}_{0}=0.7$
. The wave is also somewhat higher (figure 5
a). Otherwise differences are minor compared to the bottom profile with
$\unicode[STIX]{x1D6FC}_{0}=0.7$
. The wave is also somewhat higher (figure 5
a). Otherwise differences are minor compared to the bottom profile with
 $\unicode[STIX]{x1D6FC}_{0}=0.7$
.
$\unicode[STIX]{x1D6FC}_{0}=0.7$
.

Figure 5. Elevation
 $\unicode[STIX]{x1D702}$
obtained by approximations
$\unicode[STIX]{x1D702}$
obtained by approximations
 $s^{(2)}$
and
$s^{(2)}$
and
 $s^{(3)}$
for
$s^{(3)}$
for
 $\unicode[STIX]{x0394}h/h=0.909$
and
$\unicode[STIX]{x0394}h/h=0.909$
and
 $h=55$
m.
$h=55$
m.
 $V_{0}/h^{3}=0.216$
. (a)
$V_{0}/h^{3}=0.216$
. (a)
 $\unicode[STIX]{x0394}h>0$
.
$\unicode[STIX]{x0394}h>0$
.
 $\unicode[STIX]{x1D702}$
in the middle of the channel, as a function of
$\unicode[STIX]{x1D702}$
in the middle of the channel, as a function of
 $x_{1}-x_{1,0}$
, for
$x_{1}-x_{1,0}$
, for
 $t^{\ast }=281$
with
$t^{\ast }=281$
with
 $s^{(2)}$
(– ⋅ – ⋅ –),
$s^{(2)}$
(– ⋅ – ⋅ –),
 $s^{(3)}$
(——) and
$s^{(3)}$
(——) and
 $\unicode[STIX]{x1D6FC}_{0}=0.7$
in both cases, and
$\unicode[STIX]{x1D6FC}_{0}=0.7$
in both cases, and
 $s^{(2)}$
with
$s^{(2)}$
with
 $\unicode[STIX]{x1D6FC}_{0}=2.0$
(
$\unicode[STIX]{x1D6FC}_{0}=2.0$
(
 $\cdots \cdots$
). (b)
$\cdots \cdots$
). (b)
 $\unicode[STIX]{x0394}h<0$
.
$\unicode[STIX]{x0394}h<0$
.
 $\unicode[STIX]{x1D702}$
in the middle of the channel, as a function of
$\unicode[STIX]{x1D702}$
in the middle of the channel, as a function of
 $x_{1}-x_{1,0}$
, for
$x_{1}-x_{1,0}$
, for
 $t^{\ast }=260$
with
$t^{\ast }=260$
with
 $s^{(2)}$
(– ⋅ – ⋅ –),
$s^{(2)}$
(– ⋅ – ⋅ –),
 $s^{(3)}$
(——) and
$s^{(3)}$
(——) and
 $\unicode[STIX]{x1D6FC}_{0}=0.7$
. (c)
$\unicode[STIX]{x1D6FC}_{0}=0.7$
. (c)
 $\unicode[STIX]{x0394}h>0$
.
$\unicode[STIX]{x0394}h>0$
.
 $\unicode[STIX]{x1D702}$
for
$\unicode[STIX]{x1D702}$
for
 $t^{\ast }=281$
by
$t^{\ast }=281$
by
 $s^{(3)}$
. (d) Same as (c) but
$s^{(3)}$
. (d) Same as (c) but
 $s^{(2)}$
. (e)
$s^{(2)}$
. (e)
 $\unicode[STIX]{x0394}h<0$
. Entire computational domain for
$\unicode[STIX]{x0394}h<0$
. Entire computational domain for
 $t^{\ast }=293$
.
$t^{\ast }=293$
.
The generation during the interaction with the depth change at
 $x_{1,a}=60h$
is visualized for
$x_{1,a}=60h$
is visualized for
 $Fr=0.43$
in figure 6 at times
$Fr=0.43$
in figure 6 at times
 $t^{\ast }=211,223,246$
and in figure 5(c,d) for
$t^{\ast }=211,223,246$
and in figure 5(c,d) for
 $t^{\ast }=281$
. The main wave quickly extends laterally across the channel. It is basically characterized as a one-dimensional hump in straight forward motion. The propagation speed is
$t^{\ast }=281$
. The main wave quickly extends laterally across the channel. It is basically characterized as a one-dimensional hump in straight forward motion. The propagation speed is
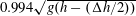 $0.994\sqrt{g(h-(\unicode[STIX]{x0394}h/2))}$
, between
$0.994\sqrt{g(h-(\unicode[STIX]{x0394}h/2))}$
, between
 $t^{\ast }=246$
and
$t^{\ast }=246$
and
 $281$
. Succeeding shorter waves along the channel walls are observed (figure 5
c,d). When the depth changes from shallow to deep water, the similar wave is a depression. The speed is
$281$
. Succeeding shorter waves along the channel walls are observed (figure 5
c,d). When the depth changes from shallow to deep water, the similar wave is a depression. The speed is
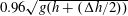 $0.96\sqrt{g(h+(\unicode[STIX]{x0394}h/2))}$
, right ahead of the ship, between
$0.96\sqrt{g(h+(\unicode[STIX]{x0394}h/2))}$
, right ahead of the ship, between
 $t^{\ast }=281$
and
$t^{\ast }=281$
and
 $293$
, where the negative elevation (
$293$
, where the negative elevation (
 $-\unicode[STIX]{x1D702}$
) is plotted in figure 7 for times
$-\unicode[STIX]{x1D702}$
) is plotted in figure 7 for times
 $t^{\ast }$
between 251 and 293.
$t^{\ast }$
between 251 and 293.

Figure 6. Elevation
 $\unicode[STIX]{x1D702}$
obtained by
$\unicode[STIX]{x1D702}$
obtained by
 $s^{(3)}$
in grey scale. Ship moving from deep to shallow water.
$s^{(3)}$
in grey scale. Ship moving from deep to shallow water.
 $Fr=0.43$
. (a)
$Fr=0.43$
. (a)
 $t^{\ast }=211$
, (b) 223, (c) 246. Centre position of depth change at
$t^{\ast }=211$
, (b) 223, (c) 246. Centre position of depth change at
 $x_{1}-x_{1,a}=0$
.
$x_{1}-x_{1,a}=0$
.
 $\unicode[STIX]{x0394}h/h=0.909$
.
$\unicode[STIX]{x0394}h/h=0.909$
.

Figure 7. The negative elevation
 $-\unicode[STIX]{x1D702}$
obtained by
$-\unicode[STIX]{x1D702}$
obtained by
 $s^{(2)}$
in grey scale.
$s^{(2)}$
in grey scale.
 $Fr=0.43$
. Ship moving from shallow to deep water. Times: (a)
$Fr=0.43$
. Ship moving from shallow to deep water. Times: (a)
 $t^{\ast }=251$
, (b) 265, (c) 281, (d) 293. Depth change at
$t^{\ast }=251$
, (b) 265, (c) 281, (d) 293. Depth change at
 $x_{1}-x_{1,a}=0$
.
$x_{1}-x_{1,a}=0$
.
 $\unicode[STIX]{x0394}h/h=0.909$
.
$\unicode[STIX]{x0394}h/h=0.909$
.
The main wave is always succeeded by a train of shorter waves of small amplitude. A leading upstream elevation of small distinct amplitude precedes the main depression wave in the case when the depth changes from shallow to deep water (
 $\unicode[STIX]{x0394}h<0$
) (figure 8
c). This is in accordance with the asymptotics derived in § 4. However, for positive
$\unicode[STIX]{x0394}h<0$
) (figure 8
c). This is in accordance with the asymptotics derived in § 4. However, for positive
 $\unicode[STIX]{x0394}h>0$
, a corresponding leading depression is very small, where the computed surface for time
$\unicode[STIX]{x0394}h>0$
, a corresponding leading depression is very small, where the computed surface for time
 $t^{\ast }=281$
in figure 8(a) is only slightly below the level at the earlier times
$t^{\ast }=281$
in figure 8(a) is only slightly below the level at the earlier times
 $t^{\ast }=223,246$
.
$t^{\ast }=223,246$
.

Figure 8. Upstream elevation
 $\unicode[STIX]{x1D702}L_{2}/(\unicode[STIX]{x0394}hV_{0}/h^{2})$
ahead of ship.
$\unicode[STIX]{x1D702}L_{2}/(\unicode[STIX]{x0394}hV_{0}/h^{2})$
ahead of ship.
 $\unicode[STIX]{x0394}h/h=0.909$
. (a) Deep to shallow water;
$\unicode[STIX]{x0394}h/h=0.909$
. (a) Deep to shallow water;
 $Fr=0.43$
,
$Fr=0.43$
,
 $t^{\ast }=223,246,281$
calculated by
$t^{\ast }=223,246,281$
calculated by
 $s^{(3)}$
. (b)
$s^{(3)}$
. (b)
 $Fr=0.43$
at
$Fr=0.43$
at
 $t^{\ast }=281$
and
$t^{\ast }=281$
and
 $0.51$
at
$0.51$
at
 $t^{\ast }=280$
by
$t^{\ast }=280$
by
 $s^{(3)}$
(solid lines);
$s^{(3)}$
(solid lines);
 $Fr=0.26$
at
$Fr=0.26$
at
 $t^{\ast }=340$
,
$t^{\ast }=340$
,
 $0.34$
at
$0.34$
at
 $t^{\ast }=320$
by
$t^{\ast }=320$
by
 $s^{(2)}$
(dashed lines). (c) Ship moving from shallow to deep water.
$s^{(2)}$
(dashed lines). (c) Ship moving from shallow to deep water.
 $Fr=0.34,0.385,0.43,0.47,0.51$
. Calculations by
$Fr=0.34,0.385,0.43,0.47,0.51$
. Calculations by
 $s^{(2)}$
.
$s^{(2)}$
.
The main upstream elevation or depression clearly depend on the forward speed (figure 8
b,c). The maximum elevation,
 $\unicode[STIX]{x1D702}_{max}$
, for
$\unicode[STIX]{x1D702}_{max}$
, for
 $\unicode[STIX]{x0394}h>0$
, and the minimum elevation,
$\unicode[STIX]{x0394}h>0$
, and the minimum elevation,
 $\unicode[STIX]{x1D702}_{min}$
, for
$\unicode[STIX]{x1D702}_{min}$
, for
 $\unicode[STIX]{x0394}h<0$
, both grow according to
$\unicode[STIX]{x0394}h<0$
, both grow according to
 $Fr^{n}$
, with
$Fr^{n}$
, with
 $n\simeq 3.2$
for
$n\simeq 3.2$
for
 $\unicode[STIX]{x1D702}_{max}$
and
$\unicode[STIX]{x1D702}_{max}$
and
 $n\simeq 4$
for
$n\simeq 4$
for
 $\unicode[STIX]{x1D702}_{min}$
(figure 9
a). We define the wave width at half-crest height, at
$\unicode[STIX]{x1D702}_{min}$
(figure 9
a). We define the wave width at half-crest height, at
 $y=(1/2)\unicode[STIX]{x1D702}_{max}$
, by
$y=(1/2)\unicode[STIX]{x1D702}_{max}$
, by
 $\unicode[STIX]{x1D706}_{1/2}^{cr}$
, when the bottom changes from deep to shallow water, and similarly, the wave width at half-trough height, at
$\unicode[STIX]{x1D706}_{1/2}^{cr}$
, when the bottom changes from deep to shallow water, and similarly, the wave width at half-trough height, at
 $y=(1/2)\unicode[STIX]{x1D702}_{min}$
, by
$y=(1/2)\unicode[STIX]{x1D702}_{min}$
, by
 $\unicode[STIX]{x1D706}_{1/2}^{tr}$
, when the bottom changes from shallow to deep water. The wave widths in the range of
$\unicode[STIX]{x1D706}_{1/2}^{tr}$
, when the bottom changes from shallow to deep water. The wave widths in the range of
 $6.5h{-}12h$
decay with increasing
$6.5h{-}12h$
decay with increasing
 $Fr$
(figure 9
b). The symmetry between the dominant upstream wave for positive and negative
$Fr$
(figure 9
b). The symmetry between the dominant upstream wave for positive and negative
 $\unicode[STIX]{x0394}h$
is illustrated by forming the products
$\unicode[STIX]{x0394}h$
is illustrated by forming the products
 $\unicode[STIX]{x1D702}_{max}\unicode[STIX]{x1D706}_{1/2}^{cr}$
and
$\unicode[STIX]{x1D702}_{max}\unicode[STIX]{x1D706}_{1/2}^{cr}$
and
 $-\unicode[STIX]{x1D702}_{min}\unicode[STIX]{x1D706}_{1/2}^{tr}$
. These become approximately equal and exhibit a common algebraic growth in the Froude number, in these calculations (figure 9
c).
$-\unicode[STIX]{x1D702}_{min}\unicode[STIX]{x1D706}_{1/2}^{tr}$
. These become approximately equal and exhibit a common algebraic growth in the Froude number, in these calculations (figure 9
c).
The calculations are compared to the observations at position 3. A period of approximately 32 s of the leading two main waves can be estimated from the video recording of the flow in the bay at Askholmene. Multiplying by the shallow water speed, this gives a wavelength of approximately 550 m corresponding to
 ${\sim}10h$
. The calculated wavelength for
${\sim}10h$
. The calculated wavelength for
 $Fr\sim 0.43$
at
$Fr\sim 0.43$
at
 $t^{\ast }=281$
in figure 8(a) corresponds fairly well to the observation. Calculated maximal non-dimensional wave elevations of
$t^{\ast }=281$
in figure 8(a) corresponds fairly well to the observation. Calculated maximal non-dimensional wave elevations of
 ${\sim}0.0013h$
(
${\sim}0.0013h$
(
 $Fr=0.43$
) and
$Fr=0.43$
) and
 ${\sim}0.0021h$
(
${\sim}0.0021h$
(
 $Fr=0.49$
) in figure 8(a) correspond to amplitudes of 7 cm and 12 cm in the fjord, respectively, of the main wave ahead of the larger among the ships, of displaced volume of
$Fr=0.49$
) in figure 8(a) correspond to amplitudes of 7 cm and 12 cm in the fjord, respectively, of the main wave ahead of the larger among the ships, of displaced volume of
 $36\,000~\text{m}^{3}$
. The small elevations generate run-ups and run-downs of the order of 1 m along the shores, as evidenced from the movie. The calculations show one dominant elevation and succeeding minor shorter waves along the channel wall, comparing rather well to the short wave train which is typical for the observations at position 3.
$36\,000~\text{m}^{3}$
. The small elevations generate run-ups and run-downs of the order of 1 m along the shores, as evidenced from the movie. The calculations show one dominant elevation and succeeding minor shorter waves along the channel wall, comparing rather well to the short wave train which is typical for the observations at position 3.
The elevation ratio
 $\unicode[STIX]{x1D702}^{\prime }=\unicode[STIX]{x1D702}L_{2}/(\unicode[STIX]{x0394}hV_{0}/h^{2})$
and wave width
$\unicode[STIX]{x1D702}^{\prime }=\unicode[STIX]{x1D702}L_{2}/(\unicode[STIX]{x0394}hV_{0}/h^{2})$
and wave width
 $\unicode[STIX]{x1D706}^{1/2}$
are compared to the asymptotics in § 4. The dispersive calculation in figure 8(b) for
$\unicode[STIX]{x1D706}^{1/2}$
are compared to the asymptotics in § 4. The dispersive calculation in figure 8(b) for
 $Fr=0.51,t^{\ast }=280$
corresponds to a time
$Fr=0.51,t^{\ast }=280$
corresponds to a time
 $t^{\ast }-t_{a}^{\ast }\simeq 88.5$
upstream of the bottom transition at
$t^{\ast }-t_{a}^{\ast }\simeq 88.5$
upstream of the bottom transition at
 $x_{1,a}$
. Similarly, the calculation in figure 8(c) for
$x_{1,a}$
. Similarly, the calculation in figure 8(c) for
 $Fr=0.51,t^{\ast }=260$
corresponds to a time
$Fr=0.51,t^{\ast }=260$
corresponds to a time
 $t^{\ast }-t_{a}^{\ast }\simeq 29.3$
upstream of
$t^{\ast }-t_{a}^{\ast }\simeq 29.3$
upstream of
 $x_{1,a}$
. Table 3 compares the wave height
$x_{1,a}$
. Table 3 compares the wave height
 $\unicode[STIX]{x1D702}_{max}^{\prime }-\unicode[STIX]{x1D702}_{min}^{\prime }$
, measured as the height from the first elevation to the second trough, for
$\unicode[STIX]{x1D702}_{max}^{\prime }-\unicode[STIX]{x1D702}_{min}^{\prime }$
, measured as the height from the first elevation to the second trough, for
 $\unicode[STIX]{x0394}h>0$
, and the height from the first trough to the second crest, for
$\unicode[STIX]{x0394}h>0$
, and the height from the first trough to the second crest, for
 $\unicode[STIX]{x0394}h<0$
. The table also compares
$\unicode[STIX]{x0394}h<0$
. The table also compares
 $\unicode[STIX]{x1D706}^{1/2}$
of the leading main wave in figure 8(b,c) to those obtained by the asymptotics in the two-dimensional case, in figure 3(a,b), where the latter is measured at
$\unicode[STIX]{x1D706}^{1/2}$
of the leading main wave in figure 8(b,c) to those obtained by the asymptotics in the two-dimensional case, in figure 3(a,b), where the latter is measured at
 $y=0$
. Apart from some differences in the wavelength for
$y=0$
. Apart from some differences in the wavelength for
 $\unicode[STIX]{x0394}h<0$
, the comparison is rather good. Both the crest, trough and wave height increase with
$\unicode[STIX]{x0394}h<0$
, the comparison is rather good. Both the crest, trough and wave height increase with
 $Fr$
, where the growth is weak for
$Fr$
, where the growth is weak for
 $\unicode[STIX]{x0394}h/h\ll 1$
(the asymptotics), and very strong for
$\unicode[STIX]{x0394}h/h\ll 1$
(the asymptotics), and very strong for
 $\unicode[STIX]{x0394}h/h\simeq 1$
. The leading trough (crest) for
$\unicode[STIX]{x0394}h/h\simeq 1$
. The leading trough (crest) for
 $\unicode[STIX]{x0394}h>0$
(
$\unicode[STIX]{x0394}h>0$
(
 $\unicode[STIX]{x0394}h<0$
), pronounced for
$\unicode[STIX]{x0394}h<0$
), pronounced for
 $\unicode[STIX]{x0394}h/h\ll 1$
but either weak or almost absent for
$\unicode[STIX]{x0394}h/h\ll 1$
but either weak or almost absent for
 $\unicode[STIX]{x0394}h/h\simeq 1$
, is another difference.
$\unicode[STIX]{x0394}h/h\simeq 1$
, is another difference.
Table 3. Wave height
 $\unicode[STIX]{x1D702}_{max}^{\prime }-\unicode[STIX]{x1D702}_{min}^{\prime }$
, where
$\unicode[STIX]{x1D702}_{max}^{\prime }-\unicode[STIX]{x1D702}_{min}^{\prime }$
, where
 $\unicode[STIX]{x1D702}^{\prime }=\unicode[STIX]{x1D702}L_{2}/(\unicode[STIX]{x0394}hV_{0}/h^{2})$
, and wavelength at half-height
$\unicode[STIX]{x1D702}^{\prime }=\unicode[STIX]{x1D702}L_{2}/(\unicode[STIX]{x0394}hV_{0}/h^{2})$
, and wavelength at half-height
 $\unicode[STIX]{x1D706}^{1/2}$
, of the first main wave, obtained by asymptotic model (in two dimensions)
$\unicode[STIX]{x1D706}^{1/2}$
, of the first main wave, obtained by asymptotic model (in two dimensions)
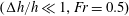 $(\unicode[STIX]{x0394}h/h\ll 1,Fr=0.5)$
and dispersive calculation (
$(\unicode[STIX]{x0394}h/h\ll 1,Fr=0.5)$
and dispersive calculation (
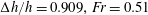 $\unicode[STIX]{x0394}h/h=0.909,Fr=0.51$
). Time
$\unicode[STIX]{x0394}h/h=0.909,Fr=0.51$
). Time
 $t^{\ast }-t_{a}^{\ast }$
after passage of the depth change at
$t^{\ast }-t_{a}^{\ast }$
after passage of the depth change at
 $x_{1,a}$
.
$x_{1,a}$
.


Figure 9. (a) Maximum upstream elevation
 $\unicode[STIX]{x1D702}_{max}$
(●) for ship moving from deep to shallow water, and maximum upstream depression
$\unicode[STIX]{x1D702}_{max}$
(●) for ship moving from deep to shallow water, and maximum upstream depression
 $\unicode[STIX]{x1D702}_{min}$
(▫) for ship moving from shallow to deep water versus
$\unicode[STIX]{x1D702}_{min}$
(▫) for ship moving from shallow to deep water versus
 $Fr$
.
$Fr$
.
 $\unicode[STIX]{x0394}h/h=0.909$
. Fitted curves: dotted and dashed lines. (b)
$\unicode[STIX]{x0394}h/h=0.909$
. Fitted curves: dotted and dashed lines. (b)
 $\unicode[STIX]{x1D706}_{1/2}^{cr,tr}/h$
versus
$\unicode[STIX]{x1D706}_{1/2}^{cr,tr}/h$
versus
 $Fr$
. (c)
$Fr$
. (c)
 $\unicode[STIX]{x1D702}_{max}L_{2}\unicode[STIX]{x1D706}_{1/2}^{cr}/V_{0}$
(●) and
$\unicode[STIX]{x1D702}_{max}L_{2}\unicode[STIX]{x1D706}_{1/2}^{cr}/V_{0}$
(●) and
 $-\unicode[STIX]{x1D702}_{min}L_{2}\unicode[STIX]{x1D706}_{1/2}^{tr}/V_{0}$
(▫) versus
$-\unicode[STIX]{x1D702}_{min}L_{2}\unicode[STIX]{x1D706}_{1/2}^{tr}/V_{0}$
(▫) versus
 $Fr$
. Fitted curve (dotted line).
$Fr$
. Fitted curve (dotted line).
6 Upstream waves in a wide channel
A channel of width of 2.4 km corresponds to twice the distance from the observation position 1 to the ship’s track. The depth changes from moderately deep to shallow to moderately deep water, with
 $h=(h_{A}+h_{B})/2=30$
m and
$h=(h_{A}+h_{B})/2=30$
m and
 $\unicode[STIX]{x0394}h/h=1.067$
, where the depth just north of the shallow region is
$\unicode[STIX]{x0394}h/h=1.067$
, where the depth just north of the shallow region is
 $h+\unicode[STIX]{x0394}h/2$
, while still further north average depths of the fjord are given in table 1. The shallow region extends approximately
$h+\unicode[STIX]{x0394}h/2$
, while still further north average depths of the fjord are given in table 1. The shallow region extends approximately
 $23h$
along the track. The positions
$23h$
along the track. The positions
 $x_{1,a}=60h$
and
$x_{1,a}=60h$
and
 $x_{1,b}=83h$
define its extension in the numerical calculations. The computational domain is
$x_{1,b}=83h$
define its extension in the numerical calculations. The computational domain is
 $(L_{1},L_{2})=(300h,80h)$
with
$(L_{1},L_{2})=(300h,80h)$
with
 $(N_{1},N_{2})=(1200,432)$
computational points. A ship speed of
$(N_{1},N_{2})=(1200,432)$
computational points. A ship speed of
 $10~\text{m}~\text{s}^{-1}$
corresponds to
$10~\text{m}~\text{s}^{-1}$
corresponds to
 $Fr=0.58$
where the range
$Fr=0.58$
where the range
 $Fr\sim 0.3{-}0.7$
is explored. Note that
$Fr\sim 0.3{-}0.7$
is explored. Note that
 $U/\sqrt{g(h-\unicode[STIX]{x0394}h/2)}$
becomes critical in the shallow region for the largest speed (
$U/\sqrt{g(h-\unicode[STIX]{x0394}h/2)}$
becomes critical in the shallow region for the largest speed (
 $Fr=0.7$
). However, nonlinear effects, known to propagate laterally in the wide channel (Pedersen Reference Pedersen1988), are assumed to be small over the relatively short extension of the shallow region (of length
$Fr=0.7$
). However, nonlinear effects, known to propagate laterally in the wide channel (Pedersen Reference Pedersen1988), are assumed to be small over the relatively short extension of the shallow region (of length
 $23h$
).
$23h$
).
The ship volume
 $V_{0}=36\,000~\text{m}^{3}$
is made dimensionless by the reference depth
$V_{0}=36\,000~\text{m}^{3}$
is made dimensionless by the reference depth
 $h=30$
m, giving
$h=30$
m, giving
 $V_{0}/h^{3}=1.33$
. This is used in the calculations shown in figures 10 and 11. Note that this non-dimensional ship volume is approximately 6 times larger than the non-dimensional ship volume at Askholmene, where the reference depth is
$V_{0}/h^{3}=1.33$
. This is used in the calculations shown in figures 10 and 11. Note that this non-dimensional ship volume is approximately 6 times larger than the non-dimensional ship volume at Askholmene, where the reference depth is
 $h=55$
m. The upstream waves calculated using the approximation
$h=55$
m. The upstream waves calculated using the approximation
 $s^{(2)}$
in (3.13) exhibit a curved pattern where the dominant feature is a leading, large wave trough, preceded and succeeded by less dominant crests. A train of shorter waves of smaller amplitude follows behind the leading wave motion. The leading waves ahead of the ship in the wide channel are similar to the upstream waves generated at the depth change from shallow to deep water. More precisely, the calculated elevation in the narrow channel is in the range
$s^{(2)}$
in (3.13) exhibit a curved pattern where the dominant feature is a leading, large wave trough, preceded and succeeded by less dominant crests. A train of shorter waves of smaller amplitude follows behind the leading wave motion. The leading waves ahead of the ship in the wide channel are similar to the upstream waves generated at the depth change from shallow to deep water. More precisely, the calculated elevation in the narrow channel is in the range
 $-0.13<\unicode[STIX]{x1D702}L_{2}/(\unicode[STIX]{x0394}hV_{0}/h^{2})<0.04$
, see figure 8(c). The latter corresponds to a wave height ahead of the ship of
$-0.13<\unicode[STIX]{x1D702}L_{2}/(\unicode[STIX]{x0394}hV_{0}/h^{2})<0.04$
, see figure 8(c). The latter corresponds to a wave height ahead of the ship of
 $H/h\simeq 0.003$
in the wide channel. A simple doubling gives
$H/h\simeq 0.003$
in the wide channel. A simple doubling gives
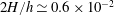 $2H/h\simeq 0.6\times 10^{-2}$
, fitting fairly well with the results in figure 11(b), for the ship passing over the two depth changes in the wide channel, for the similar
$2H/h\simeq 0.6\times 10^{-2}$
, fitting fairly well with the results in figure 11(b), for the ship passing over the two depth changes in the wide channel, for the similar
 $Fr=0.51$
.
$Fr=0.51$
.

Figure 10. Upstream elevation pattern obtained by
 $s^{(2)}$
for times (a)
$s^{(2)}$
for times (a)
 $t^{\ast }=261.7$
, (b)
$t^{\ast }=261.7$
, (b)
 $275.5$
, (c)
$275.5$
, (c)
 $311.4$
. Ship with
$311.4$
. Ship with
 $Fr=0.58$
passing from deep to shallow to deep water with
$Fr=0.58$
passing from deep to shallow to deep water with
 $x_{1,a}=60h$
,
$x_{1,a}=60h$
,
 $x_{1,b}=83h$
and
$x_{1,b}=83h$
and
 $\unicode[STIX]{x0394}h/h=1.067$
. Horizontal coordinate
$\unicode[STIX]{x0394}h/h=1.067$
. Horizontal coordinate
 $(x_{1}-x_{1,b})/h$
with end of topography located in
$(x_{1}-x_{1,b})/h$
with end of topography located in
 $x_{1}-x_{1,b}=0$
.
$x_{1}-x_{1,b}=0$
.
 $L_{1}=300h,L_{2}=80h,N_{1}=1200,N_{2}=432$
. Depth
$L_{1}=300h,L_{2}=80h,N_{1}=1200,N_{2}=432$
. Depth
 $h=30$
m.
$h=30$
m.

Figure 11. (a) Upstream wave elevation along channel wall obtained by
 $s^{(2)}$
as function of
$s^{(2)}$
as function of
 $(x_{1}-x_{1,b})/h$
for
$(x_{1}-x_{1,b})/h$
for
 $Fr=0.7$
,
$Fr=0.7$
,
 $t^{\ast }=252.8$
(– ⋅ – ⋅ –),
$t^{\ast }=252.8$
(– ⋅ – ⋅ –),
 $Fr=0.58$
,
$Fr=0.58$
,
 $t^{\ast }=287.4$
(——) and
$t^{\ast }=287.4$
(——) and
 $Fr=0.46$
,
$Fr=0.46$
,
 $t^{\ast }=311$
(– – –). (b) Maximum wave height at channel wall at
$t^{\ast }=311$
(– – –). (b) Maximum wave height at channel wall at
 $x_{2}=0$
,
$x_{2}=0$
,
 $x_{1}-x_{1,b}=50h$
(●) and ahead of ship at
$x_{1}-x_{1,b}=50h$
(●) and ahead of ship at
 $x_{2}=40h$
,
$x_{2}=40h$
,
 $x_{1}-x_{1,b}\sim 60h$
(♢). Fitted curves (dotted and dashed lines).
$x_{1}-x_{1,b}\sim 60h$
(♢). Fitted curves (dotted and dashed lines).
 $\unicode[STIX]{x0394}h/h=1.067$
,
$\unicode[STIX]{x0394}h/h=1.067$
,
 $h=30$
m. Same discretization as in figure 10.
$h=30$
m. Same discretization as in figure 10.
Wave reflections at the side walls, where the propagation speed is enhanced (results not shown), produce a complex wave pattern in the channel. The leading curved crests eventually straighten up. Note that the wave interaction with the channel walls is not related to the Mach reflection, since the waves in consideration are linear. Snapshots of the wave elevation at the side wall illustrate further the dominant trough and preceding and succeeding crests (figure 11
a). The dominant wave trough corresponds to the strong outflow observed in the harbour at observation position 1, see figure 1. The observation position 1 is located
 $50h$
upstream of the generation site (
$50h$
upstream of the generation site (
 $x_{1,b}$
) where the maximum wave height
$x_{1,b}$
) where the maximum wave height
 $H$
grows according to
$H$
grows according to
 $Fr^{n}$
where
$Fr^{n}$
where
 $n\simeq 3.7$
at the channel wall and
$n\simeq 3.7$
at the channel wall and
 $n\simeq 3.5$
ahead of the ship. The height is approximately 45 %–55 % higher at the walls than ahead of the ship, at the similar
$n\simeq 3.5$
ahead of the ship. The height is approximately 45 %–55 % higher at the walls than ahead of the ship, at the similar
 $x_{1}$
-position (figure 11
b). We obtain
$x_{1}$
-position (figure 11
b). We obtain
 $H/h\simeq 0.025$
at the channel wall, for
$H/h\simeq 0.025$
at the channel wall, for
 $Fr=0.7$
, giving
$Fr=0.7$
, giving
 $H\simeq 0.75$
m (with
$H\simeq 0.75$
m (with
 $h=30$
m) and is in the range of the observations in the harbour.
$h=30$
m) and is in the range of the observations in the harbour.
The calculated leading trough-to-trough period at
 $x_{1}-x_{1,b}=50h$
becomes
$x_{1}-x_{1,b}=50h$
becomes
 $T=21.8\sqrt{h/g}\simeq 38$
s for
$T=21.8\sqrt{h/g}\simeq 38$
s for
 $Fr=0.58$
, and
$Fr=0.58$
, and
 $T=24.2\sqrt{h/g}\simeq 41$
s for the smaller
$T=24.2\sqrt{h/g}\simeq 41$
s for the smaller
 $Fr=0.52$
. A calculated third crest to crest period becomes 15 s for
$Fr=0.52$
. A calculated third crest to crest period becomes 15 s for
 $Fr=0.58$
. The periods of the idealized calculations are rather close to the observed periods at position 1, see table 2. Similar calculations at the channel wall at an upstream position of
$Fr=0.58$
. The periods of the idealized calculations are rather close to the observed periods at position 1, see table 2. Similar calculations at the channel wall at an upstream position of
 $x_{1}-x_{1,b}=83h$
for the still smaller
$x_{1}-x_{1,b}=83h$
for the still smaller
 $Fr=0.46$
give a wave period of
$Fr=0.46$
give a wave period of
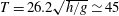 $T=26.2\sqrt{h/g}\simeq 45$
s. This upstream position corresponds to observation position 2 in table 2, where the numerical period is somewhat smaller compared to the observed period of 57 s, for the similar ship speed, where, however, the fjord is much shallower (
$T=26.2\sqrt{h/g}\simeq 45$
s. This upstream position corresponds to observation position 2 in table 2, where the numerical period is somewhat smaller compared to the observed period of 57 s, for the similar ship speed, where, however, the fjord is much shallower (
 ${\sim}25$
m) than in the calculation. In summary, despite the rather ideal conditions of the numerical channel, with a constant water depth of 46 m outside the shallow region, the calculated wave height and periods agree fairly well to the observations at positions 1 and 2 in the Oslofjord. Note that effects due to local bathymetry, bottom slope or shape of the shoreline, not accounted for in the computations, contribute to the actual run-ups, run-downs as well as the wave period.
${\sim}25$
m) than in the calculation. In summary, despite the rather ideal conditions of the numerical channel, with a constant water depth of 46 m outside the shallow region, the calculated wave height and periods agree fairly well to the observations at positions 1 and 2 in the Oslofjord. Note that effects due to local bathymetry, bottom slope or shape of the shoreline, not accounted for in the computations, contribute to the actual run-ups, run-downs as well as the wave period.
The results in figure 11(b) are used to calculate the wave height produced by the two different ships at position 1, cruising with speeds of
 $8.6~\text{m}~\text{s}^{-1}$
and
$8.6~\text{m}~\text{s}^{-1}$
and
 $10.3~\text{m}~\text{s}^{-1}$
, respectively, see table 1. The corresponding wave heights become
$10.3~\text{m}~\text{s}^{-1}$
, respectively, see table 1. The corresponding wave heights become
 $H/h\simeq 0.70\times 10^{-2}$
and
$H/h\simeq 0.70\times 10^{-2}$
and
 $1.36\times 10^{-2}$
. Multiplying the former by the volume of Pearl Seaways, which is 69 % of Magic/Fantasy (table 4), we obtain that the faster and larger ship makes a wave height of approximately three times higher compared to the slower and smaller ship. The wave height ratio becomes four times, for a sailing speed of
$1.36\times 10^{-2}$
. Multiplying the former by the volume of Pearl Seaways, which is 69 % of Magic/Fantasy (table 4), we obtain that the faster and larger ship makes a wave height of approximately three times higher compared to the slower and smaller ship. The wave height ratio becomes four times, for a sailing speed of
 $11.5~\text{m}~\text{s}^{-1}$
of Fantasy/Magic which has been observed by the people living in Flaskebekk.
$11.5~\text{m}~\text{s}^{-1}$
of Fantasy/Magic which has been observed by the people living in Flaskebekk.
7 Conclusions
Ship generated very long upstream waves of appreciable amplitude is a new phenomenon and have been recently observed in the Oslofjord in Norway. The waves are generated locally in time and space, at positions where the water depth along the ship’s track changes by an appreciable amount
 $\unicode[STIX]{x0394}h$
that is comparable to a relatively shallow average depth
$\unicode[STIX]{x0394}h$
that is comparable to a relatively shallow average depth
 $h$
at the position, which means that
$h$
at the position, which means that
 $\unicode[STIX]{x0394}h/h\simeq 1$
. The change
$\unicode[STIX]{x0394}h/h\simeq 1$
. The change
 $\unicode[STIX]{x0394}h$
may be positive or negative. The waves, propagating with a speed close to the shallow water speed, ahead of the ships, observed as slow run-ups and run-downs in harbours and bays along the shore with periods in the range 30–60 s, bear many similarities with tsunamis, although at a smaller length scale. We have found it tempting to denote the waves as a mini-tsunami. The waves, 0.5–1 km long, are generated by conventional ships moving with a depth Froude number in the range
$\unicode[STIX]{x0394}h$
may be positive or negative. The waves, propagating with a speed close to the shallow water speed, ahead of the ships, observed as slow run-ups and run-downs in harbours and bays along the shore with periods in the range 30–60 s, bear many similarities with tsunamis, although at a smaller length scale. We have found it tempting to denote the waves as a mini-tsunami. The waves, 0.5–1 km long, are generated by conventional ships moving with a depth Froude number in the range
 $Fr=U/\sqrt{gh}\sim 0.4{-}0.7$
and a Froude number based on the ship length
$Fr=U/\sqrt{gh}\sim 0.4{-}0.7$
and a Froude number based on the ship length
 $l$
of
$l$
of
 $Fr_{l}=U/\sqrt{gl}\sim 0.17{-}0.24$
.
$Fr_{l}=U/\sqrt{gl}\sim 0.17{-}0.24$
.

Figure 12. (a) Maximum and (b) minimum elevation in harbour at Flaskebekk. Photo. T. H. Larsen.
The linear generation mechanism is mathematically explored by an asymptotic analysis valid for small
 $\unicode[STIX]{x0394}h/h$
and long waves. This shows that the pressure due to the moving ship acts as an impulsive force at the depth change and provides a qualitative explanation of the phenomenon, see (4.3). The analysis gives a leading upstream wave of depression when the water depth reduces, in accordance with observations. Conversely, an upstream leading wave of elevation is formed when the depth increases. A train of shorter and slower waves is subsequently formed.
$\unicode[STIX]{x0394}h/h$
and long waves. This shows that the pressure due to the moving ship acts as an impulsive force at the depth change and provides a qualitative explanation of the phenomenon, see (4.3). The analysis gives a leading upstream wave of depression when the water depth reduces, in accordance with observations. Conversely, an upstream leading wave of elevation is formed when the depth increases. A train of shorter and slower waves is subsequently formed.
A fully dispersive linear analysis valid for
 $\unicode[STIX]{x0394}h/h\simeq 1$
complements the asymptotics where the depth variation is similar to the conditions in the observations. Computations in a moderately narrow channel show that one dominant upstream wave of elevation is generated when the depth undergoes a reduction. A leading depression, which, however, is very tiny in the numerical computations, may be observed ahead of the dominant wave. A train of shorter waves of small amplitude travels behind the main elevation. In the case when the depth increases, a dominant upstream wave of depression is generated. This is preceded by a long wave of elevation, of small, however, distinct amplitude. A train of short waves of small amplitude is succeeding. The wave generation shows minor sensitivity to the bottom slope at the depth change. The symmetry for positive and negative
$\unicode[STIX]{x0394}h/h\simeq 1$
complements the asymptotics where the depth variation is similar to the conditions in the observations. Computations in a moderately narrow channel show that one dominant upstream wave of elevation is generated when the depth undergoes a reduction. A leading depression, which, however, is very tiny in the numerical computations, may be observed ahead of the dominant wave. A train of shorter waves of small amplitude travels behind the main elevation. In the case when the depth increases, a dominant upstream wave of depression is generated. This is preceded by a long wave of elevation, of small, however, distinct amplitude. A train of short waves of small amplitude is succeeding. The wave generation shows minor sensitivity to the bottom slope at the depth change. The symmetry for positive and negative
 $\unicode[STIX]{x0394}h$
is pointed out.
$\unicode[STIX]{x0394}h$
is pointed out.
Computations for a wide channel show curved crests. Reflections at the channel walls enhance the elevation as well as the propagation speed, straightening up the curved crests. Computed and observed wave periods fit fairly well. The leading wavelength is in the range
 $10h{-}25h$
.
$10h{-}25h$
.
The forward speed has a pronounced effect on the wave height, for a large depth change of
 $\unicode[STIX]{x0394}h/h\sim 1$
, where
$\unicode[STIX]{x0394}h/h\sim 1$
, where
 $H/h$
grows according to
$H/h$
grows according to
 $Fr^{n}$
with
$Fr^{n}$
with
 $n$
in the range 3–4. This growth with
$n$
in the range 3–4. This growth with
 $Fr$
is only very weak when
$Fr$
is only very weak when
 $\unicode[STIX]{x0394}h/h\ll 1$
(the asymptotics). A computed wave height of up to 0.75 m (
$\unicode[STIX]{x0394}h/h\ll 1$
(the asymptotics). A computed wave height of up to 0.75 m (
 $Fr=0.7$
) compares to a measured wave height of 1 m (figure 12).
$Fr=0.7$
) compares to a measured wave height of 1 m (figure 12).
Acknowledgements
A preliminary version of this material was presented at the 31st International Workshop on Water Waves and Floating Bodies, Plymouth, Michigan, USA, 3–6 April 2016. Because of the present analysis, Color Line have reduced the speed and modified the track of their ships, strongly reducing the waves at Flaskebekk. The author is grateful to the comments and suggestions by three anonymous referees.
Appendix A.
A.1 Further elaboration of the observations
Flaskebekk. A wave height of 1.4 m was measured in the harbour at Flaskebekk by the owner, E. Staff, using a folding rule. The harbour appears on the photographs in figures 1 and 12. A wave height of approximately 1 m is documented in figure 12 as the difference between the maximum and minimum elevation, corresponding to approximately 6 steps, each 17 cm high, of the staircase shown in the figure. The photos in figures 1 and 12 are in the same sequence, taken on the same day.
Table 4. Ship characteristics and history. Tonnage (GT), displaced volume
 $V_{0}$
(m
$V_{0}$
(m
 $^{3}$
), total length (
$^{3}$
), total length (
 $l$
), width (
$l$
), width (
 $w_{0}$
), draught (
$w_{0}$
), draught (
 $d_{0}$
), maximum speed (
$d_{0}$
), maximum speed (
 $U$
), year in service (Year).
$U$
), year in service (Year).

Regarding erosion, the chain of bath houses and piers along the shore line at Flaskebekk are built on unconsolidated sediments with some fractions of rock. Particularly the long run-outs lasting for approximately 15–20 s (half-wave period) contribute to a seaward transport of the sediments, an erosion that started with the introduction of the large cruise ferries of Color Line in 2004, where the ship characteristics are given in table 4. This information is according to a group of landlords at Flaskebekk (J. Bjerke, T. H. Larsen, T. Scavenius, E. Staff). The group has told the author how they each year have to supply a significant volume of stones to the sea bottom ahead of their own bath houses to compensate for the erosion caused by the new wave environment. Those owners not making such measures experience their bath houses steadily tilting towards the sea. The group of landlords report that the long periodic wave run-up/run-down contribute much more to the erosion compared to the shorter wash waves of the ship wake. The pier shown in figures 1, 12 is in a steady, slow seaward motion due to the erosion. The owner of Kavringen Nesodden Marina south of Flaskebekk, P. Støp, has reported to the author that the long waves contribute to a slow oscillating current in the shallow marina where the entire system of floating docks and moored boats are exposed to large excursions. This has become a new wear and tear, where the particular damage is caused by the long-lasting run-out. Wave heights in the marina have not been measured.
Askholmene. In the bay at Askholmene, estimates of the wave periods, run-up and run-down are obtained from the amateur video available at https://www.youtube.com/watch?v=42Ctdk9kpyg, where the waves caused by Color Magic are recorded. The usual ship speed at the position is 20 knots. The run-up/run-down elevation is approximately
 $\pm 0.75$
m. The horizontal current velocity in the bay estimated from the video is up to
$\pm 0.75$
m. The horizontal current velocity in the bay estimated from the video is up to
 $1~\text{m s}^{-1}$
. The author visited the position on 19 June 2013, at the time of the day when Color Magic was cruising by. No elevation measurements were taken.
$1~\text{m s}^{-1}$
. The author visited the position on 19 June 2013, at the time of the day when Color Magic was cruising by. No elevation measurements were taken.
Characteristics of the five largest cruise ferries and starting year of operation in the Oslofjord are listed in table 4. The information is acquired from what is available on the internet/Wikipedia. The displaced volume,
 $V_{0}$
, column three in the table, is calculated using an estimated ship length between perpendiculars (
$V_{0}$
, column three in the table, is calculated using an estimated ship length between perpendiculars (
 $l_{0}$
), width, draught and a block coefficient of
$l_{0}$
), width, draught and a block coefficient of
 $C_{B}=0.7$
(see e.g. Newman Reference Newman1977, p. 350), obtaining
$C_{B}=0.7$
(see e.g. Newman Reference Newman1977, p. 350), obtaining
 $V_{0}=l_{0}\cdot w\cdot d\cdot 0.7$
, where
$V_{0}=l_{0}\cdot w\cdot d\cdot 0.7$
, where
 $l_{0}$
is put to 94 % of the total length
$l_{0}$
is put to 94 % of the total length
 $l$
.
$l$
.
A.2 Integral equation for a small bottom step
We consider the integral equation (3.3) in the special case when the bottom has a small step of height
 $\unicode[STIX]{x0394}h\ll h$
at
$\unicode[STIX]{x0394}h\ll h$
at
 $x_{1}=0$
such that
$x_{1}=0$
such that
 $y_{B}=-h$
for
$y_{B}=-h$
for
 $x_{1}<0$
and
$x_{1}<0$
and
 $y_{B}=-h+\unicode[STIX]{x0394}h$
for
$y_{B}=-h+\unicode[STIX]{x0394}h$
for
 $x_{1}>0$
. Then
$x_{1}>0$
. Then
 $\unicode[STIX]{x2202}/\unicode[STIX]{x2202}n^{\prime }=\unicode[STIX]{x2202}/\unicode[STIX]{x2202}x_{1}^{\prime }$
at the step and
$\unicode[STIX]{x2202}/\unicode[STIX]{x2202}n^{\prime }=\unicode[STIX]{x2202}/\unicode[STIX]{x2202}x_{1}^{\prime }$
at the step and
 $\unicode[STIX]{x2202}/\unicode[STIX]{x2202}n^{\prime }=-\unicode[STIX]{x2202}/\unicode[STIX]{x2202}y^{\prime }$
otherwise along the bottom. Using that
$\unicode[STIX]{x2202}/\unicode[STIX]{x2202}n^{\prime }=-\unicode[STIX]{x2202}/\unicode[STIX]{x2202}y^{\prime }$
otherwise along the bottom. Using that
 $\unicode[STIX]{x2202}\unicode[STIX]{x1D719}/\unicode[STIX]{x2202}n=0$
along the bottom, the integral equation (3.3) becomes
$\unicode[STIX]{x2202}\unicode[STIX]{x1D719}/\unicode[STIX]{x2202}n=0$
along the bottom, the integral equation (3.3) becomes
 $$\begin{eqnarray}\displaystyle & & \displaystyle \displaystyle \int \int \left(\frac{1}{R}+\frac{1}{(R^{2}+(2h)^{2})^{1/2}}\right)V^{\prime }\,\text{d}\boldsymbol{x}^{\prime }=2\unicode[STIX]{x03C0}\unicode[STIX]{x1D719}_{F}(\boldsymbol{x})+\int \int \unicode[STIX]{x1D719}_{F}^{\prime }\frac{\unicode[STIX]{x2202}}{\unicode[STIX]{x2202}(2h)}\frac{1}{(R^{2}+(2h)^{2})^{1/2}}\,\text{d}\boldsymbol{x}^{\prime }\nonumber\\ \displaystyle & & \displaystyle \displaystyle \quad +\int _{0}^{\unicode[STIX]{x0394}h}\int _{-\infty }^{\infty }\unicode[STIX]{x1D719}_{B}^{\prime }|_{x_{1}=0}\frac{\unicode[STIX]{x2202}}{\unicode[STIX]{x2202}x_{1}^{\prime }}\left(\frac{1}{(R^{2}+(h-y^{\prime })^{2})^{1/2}}+\frac{1}{(R^{2}+(h+y^{\prime })^{2})^{1/2}}\right)\,\text{d}x_{2}^{\prime }\,\text{d}y^{\prime }\nonumber\\ \displaystyle & & \displaystyle \displaystyle \quad +\int _{0}^{\infty }\int _{-\infty }^{\infty }\unicode[STIX]{x1D719}_{B}^{\prime }\frac{\unicode[STIX]{x2202}}{\unicode[STIX]{x2202}h}\left(\frac{1}{(R^{2}+(h+\unicode[STIX]{x0394}h)^{2})^{1/2}}-\frac{1}{(R^{2}+(h-\unicode[STIX]{x0394}h)^{2})^{1/2}}\right)\,\text{d}x_{1}^{\prime }\,\text{d}x_{2}^{\prime },\end{eqnarray}$$
where the two former integrals are integrated over the horizontal plane. Symbols are defined in the text above and below equation (3.3). We obtain the Fourier transform of (A 1), giving
 $$\begin{eqnarray}\displaystyle \left(1+\text{e}^{-2kh}\right)\frac{\hat{V}}{k} & = & \displaystyle \left(1-\text{e}^{-2kh}\right)\hat{\unicode[STIX]{x1D719}}_{F}-\frac{2\text{i}k_{1}\text{e}^{-kh}}{k}\int _{0}^{\unicode[STIX]{x0394}h}\int _{-\infty }^{\infty }\unicode[STIX]{x1D719}_{B}|_{x_{1}=0}\cosh (ky^{\prime })\text{e}^{-\text{i}k_{2}x_{2}^{\prime }}\,\text{d}x_{2}^{\prime }\,\text{d}y^{\prime }\nonumber\\ \displaystyle & & \displaystyle -\,2\sinh (k\unicode[STIX]{x0394}h)\text{e}^{-kh}\int _{0}^{\infty }\int _{-\infty }^{\infty }\unicode[STIX]{x1D719}_{B}^{\prime }\,\text{e}^{-\text{i}\boldsymbol{k}\cdot \boldsymbol{x}^{\prime }}\,\text{d}x_{2}^{\prime }\,\text{d}x_{1}^{\prime }.\end{eqnarray}$$
In the long wave regime (
 $kh\ll 1$
) the leading-order contribution to (A 2), due to the bottom, becomes
$kh\ll 1$
) the leading-order contribution to (A 2), due to the bottom, becomes
 $$\begin{eqnarray}\hat{V}-k\tanh (kh)\hat{\unicode[STIX]{x1D719}}_{F}=-\text{i}k_{1}\unicode[STIX]{x0394}h\int _{-\infty }^{\infty }\unicode[STIX]{x1D719}_{B}(x_{1}=0,x_{2})\,\text{d}x_{2}+O(k^{2}),\end{eqnarray}$$
where
 $\hat{\unicode[STIX]{x1D719}}_{B}$
may be replaced by
$\hat{\unicode[STIX]{x1D719}}_{B}$
may be replaced by
 $\hat{\unicode[STIX]{x1D719}}_{F}$
for
$\hat{\unicode[STIX]{x1D719}}_{F}$
for
 $kh\ll 1$
. Equation (A 3) expresses the dominant contribution to the vertical velocity at the free surface, for long waves, in terms of the bottom potential at the step. If the bottom transition has a finite slope the contributions from the normal derivative of the Green function become, at the slope,
$kh\ll 1$
. Equation (A 3) expresses the dominant contribution to the vertical velocity at the free surface, for long waves, in terms of the bottom potential at the step. If the bottom transition has a finite slope the contributions from the normal derivative of the Green function become, at the slope,
 $\unicode[STIX]{x0394}S(\unicode[STIX]{x2202}/\unicode[STIX]{x2202}n^{\prime })(1/r+1/r_{1})=\unicode[STIX]{x0394}h(\unicode[STIX]{x2202}/\unicode[STIX]{x2202}x^{\prime })(1/r+1/r_{1})-\sqrt{(\unicode[STIX]{x0394}S)^{2}-(\unicode[STIX]{x0394}h)^{2}}(\unicode[STIX]{x2202}/\unicode[STIX]{x2202}y^{\prime })(1/r+1/r_{1}),$
giving (A 3) as the result still.
$\unicode[STIX]{x0394}S(\unicode[STIX]{x2202}/\unicode[STIX]{x2202}n^{\prime })(1/r+1/r_{1})=\unicode[STIX]{x0394}h(\unicode[STIX]{x2202}/\unicode[STIX]{x2202}x^{\prime })(1/r+1/r_{1})-\sqrt{(\unicode[STIX]{x0394}S)^{2}-(\unicode[STIX]{x0394}h)^{2}}(\unicode[STIX]{x2202}/\unicode[STIX]{x2202}y^{\prime })(1/r+1/r_{1}),$
giving (A 3) as the result still.
A.3 Calculation of
 $\unicode[STIX]{x1D719}_{B}$

The potential
 $\unicode[STIX]{x1D719}_{B}$
along the bottom is obtained from (3.4–3.8) giving
$\unicode[STIX]{x1D719}_{B}$
along the bottom is obtained from (3.4–3.8) giving
 $$\begin{eqnarray}\displaystyle & & \displaystyle \displaystyle 0=\hat{\unicode[STIX]{x1D6F9}}+{\mathcal{F}}(\unicode[STIX]{x1D6FD}{\mathcal{F}}^{-1}(k\hat{\unicode[STIX]{x1D6F9}}+\hat{A_{1}}+{\textstyle \frac{1}{2}}(1-e_{1}^{2})k\hat{A_{2}}))+{\textstyle \frac{1}{2}}{\mathcal{F}}(\unicode[STIX]{x1D6FD}^{2}{\mathcal{F}}^{-1}(k^{2}\hat{\unicode[STIX]{x1D6F9}}+k^{2}\hat{\unicode[STIX]{x1D719}_{B}}))-{\textstyle \frac{1}{2}}e_{1}^{2}\hat{A}_{2}\nonumber\\ \displaystyle & & \displaystyle \displaystyle \qquad +{\textstyle \frac{1}{6}}{\mathcal{F}}(\unicode[STIX]{x1D6FD}^{3}{\mathcal{F}}^{-1}(k^{3}\hat{\unicode[STIX]{x1D6F9}}+k^{2}(1+e_{1}^{2})\hat{A}_{1}))+\cdots \,,\end{eqnarray}$$
where the variable
 $\unicode[STIX]{x1D6F9}$
is defined by
$\unicode[STIX]{x1D6F9}$
is defined by
 $$\begin{eqnarray}k\hat{\unicode[STIX]{x1D6F9}}=-k\hat{\unicode[STIX]{x1D719}_{B}}+2\hat{V}e_{1}-(1+e_{1}^{2})\hat{A_{1}}-{\textstyle \frac{1}{6}}(1+e_{1}^{2})k^{2}\hat{A_{3}},\end{eqnarray}$$
and where
 $T_{1}$
,
$T_{1}$
,
 $C_{1}$
and
$C_{1}$
and
 $\hat{A}_{n}$
are defined below (3.10), and
$\hat{A}_{n}$
are defined below (3.10), and
 $e_{1}=\text{e}^{-kh}$
. Note that the leading two approximands of
$e_{1}=\text{e}^{-kh}$
. Note that the leading two approximands of
 $\unicode[STIX]{x1D6F9}$
in (A 5) are zero, i.e.
$\unicode[STIX]{x1D6F9}$
in (A 5) are zero, i.e.
 $\hat{\unicode[STIX]{x1D6F9}}^{(0)}=\hat{\unicode[STIX]{x1D6F9}}^{(1)}=0$
where the order
$\hat{\unicode[STIX]{x1D6F9}}^{(0)}=\hat{\unicode[STIX]{x1D6F9}}^{(1)}=0$
where the order
 $n$
refers to terms proportional to
$n$
refers to terms proportional to
 $\unicode[STIX]{x1D6FD}^{n}$
. The functions
$\unicode[STIX]{x1D6FD}^{n}$
. The functions
 $\hat{\unicode[STIX]{x1D6F9}}^{(2)}$
and
$\hat{\unicode[STIX]{x1D6F9}}^{(2)}$
and
 $\hat{\unicode[STIX]{x1D719}}_{B}^{(2)}$
are obtained iteratively from (A 4) to (A 5) keeping terms proportional
$\hat{\unicode[STIX]{x1D719}}_{B}^{(2)}$
are obtained iteratively from (A 4) to (A 5) keeping terms proportional
 $\unicode[STIX]{x1D6FD}^{2}$
, while
$\unicode[STIX]{x1D6FD}^{2}$
, while
 $\hat{\unicode[STIX]{x1D6F9}}^{(2)}+\hat{\unicode[STIX]{x1D6F9}}^{(3)}$
and
$\hat{\unicode[STIX]{x1D6F9}}^{(2)}+\hat{\unicode[STIX]{x1D6F9}}^{(3)}$
and
 $\hat{\unicode[STIX]{x1D719}}_{B}^{(2)}+\hat{\unicode[STIX]{x1D719}}_{B}^{(3)}$
are obtained iteratively from (A 4) to (A 5) keeping terms proportional to both
$\hat{\unicode[STIX]{x1D719}}_{B}^{(2)}+\hat{\unicode[STIX]{x1D719}}_{B}^{(3)}$
are obtained iteratively from (A 4) to (A 5) keeping terms proportional to both
 $\unicode[STIX]{x1D6FD}^{2}$
and
$\unicode[STIX]{x1D6FD}^{2}$
and
 $\unicode[STIX]{x1D6FD}^{3}$
.
$\unicode[STIX]{x1D6FD}^{3}$
.


