Coastal lagoons are areas of relatively shallow water, partly isolated from the sea by sandy or shingly barriers (Kjerfve Reference Kjerfve1994; Bird Reference Bird2008). Their evolution depends on the tectonic and geomorphological conditions prevailing in the adjacent area and the relative sea level changes. Lagoons are amongst the most threatened aquatic ecosystems, being under constant global change pressures such as sea level rise, storm and river flooding, as well as human activities (Kjerfve Reference Kjerfve1994; Bird Reference Bird2008). Many detrimental impacts have been observed as a result of intensive agriculture, aquaculture, industry, overexploitation of the water resources, pollution due to human activities and urbanisation, intense pasturing and overfishing. Human and engineering activities and their impacts on coastal lagoons are reviewed in detail by Duck & Silva (Reference Duck and Silva2012), presenting case studies of human intervention in the hydromorphology and physical processes in lagoons.
In Greece there are 24 lagoons, with a total surface of 24,500 ha, of which 10% are natural, 85 % partially natural and 5 % man made (Greek Coastal Zone Management Report 2006). Lagoon sedimentological environments are highly dynamic and, due to their location between the land and sea as marginal environments, they present both marine and continental characteristics. Coastal lagoons often receive water run-off from agricultural arable lands that is enriched in nutrients, thus causing eutrophication. Moreover, bottom sediments reload the water column with nutrients via decomposition of the organic matter (Golterman Reference Golterman2004) and thus their grain size and geochemical characteristics are an important geological and environmental factor in the research of aquatic ecosystems. Subsequently, the above- mentioned special features of lagoonal environments and the annual fluctuation of these abiotic factors have a significant effect on the organisms that inhabit these environments, and thus considerably affect the ecosystems and their respective biological assemblages.
Lagoon sediments are considered to receive anthropogenic input of pollutants in urban and suburban areas (Reimann & Caritat Reference Reimann and de Caritat2005; Bellucci et al. Reference Bellucci, Giuliani, Mugnai, Frignani, Paolucci, Albertazzi and Ruiz Fernandez2010). In order to assess sediment quality, metal enrichment factors and pollution indices have been introduced (Salomons & Förstner Reference Salomons and Förstner1984; Müller Reference Müller1979; Hakanson 1980).
This paper presents the spatial distribution of sedimentological characteristics of bottom lagoon sediments from Gialova Lagoon (southwestern Peloponnese, Greece), such as grain size and moment measures, together with geochemical environmental indices such as the enrichment factor, the contamination factor and the index of geo-accumulation (Abrahim & Parker Reference Abrahim and Parker2008); in order to delineate concentration enrichments or depletions of various metals. Moreover, micro (ostracods, foraminifera, charophytes) and macro (molluscs) subfossil assemblages were used to identify the effect of human activities on the faunal communities and their respective environments.
1. Regional setting
1.1. Geographical and geological setting
The Gialova Lagoon is located in the southwestern end of Peloponnese, and particularly on the northern coast of Navarino Bay (Fig. 1). It is one of the most important ecological areas in Greece and has international significance, as it is listed in the Natura 2000 European Community Network (code GR2550003) as a Special Protected Area (SPA) and Site of Community Importance (SCI) (European Union Council Directive 92/43/EEC on the conservation of natural habitats and of wild fauna and flora). It is a very shallow lagoon with maximum and mean depths of 1.0 m and 0.5 m respectively, whereas the greatest depths occur in the central parts of the lagoon.
Figure 1 Location map of the study lagoon (inset) and geological map of the area around the Gialova Lagoon, showing locations of the grab and gravity corer samples.
According to the Institute of Geology and Mineral Exploration of Greece (I.G.M.E. 1980) and based on geological mapping, the area belongs to the Gavrovo geotectonic zone (Aubouin Reference Aubouin1959). The catchment area and the surrounding land area of the Gialova Lagoon consists of Holocene alluvial deposits and sand dunes, Plio–Pleistocene deposits of conglomerates, marls and fine grained sandstones, and Eocene to Oligocene flysch deposits; whilst the basement of the catchment area consist of Upper Cretaceous to Eocene limestone (Fig. 1). According to the Institute of Geology and Mineral Exploration of Greece (I.G.M.E. 1980) and based on geological mapping, the area belongs to the Gavrovo geotectonic zone.
1.2. Recent evolution of the lagoon
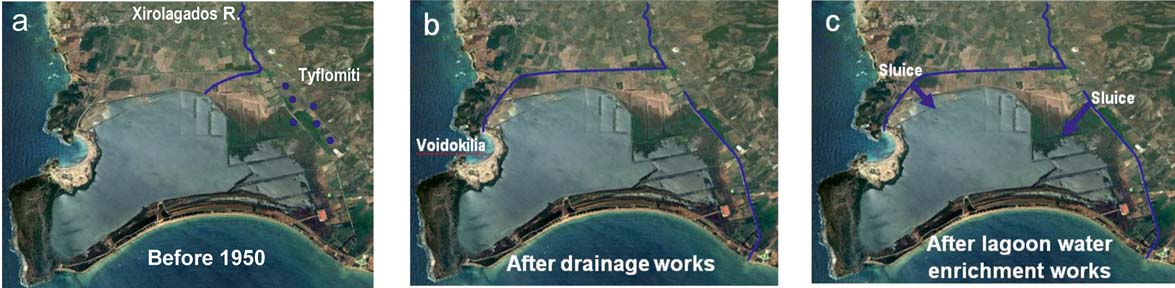
Attempts to drain the lagoon were made in the 1950s. Before 1950, the Xirolagados River flowed into the northern lagoon margin (Fig. 2a). The river fed the lagoon with fine sediments, such as fine sand, silt and clay. The source area of these sediments was the Plio–Pleistocene deposits from the mountainous course of the Xirolagados River and the Holocene sediments from the river lowland area. The Tiflomity springs, which rose in the eastern lagoon margin, poured fresh water into the lagoon and the marshes of the Gianouzagas River to the east (Fig. 2a).

Figure 2 Changes in the lagoon hydromorphology during the last 70 years: (a) before 1950; (b) after attempts at lagoon drainage; (c) after the 1998 water enrichment works. The Tyflomiti springs are shown by blue dots and artificial sluices by blue arrows. (Personal communication with Hellenic Ornithological Society.)
During the 1950s, the Xirolagados River was diverted to Voidokilia Bay, located at the northwest side of the lagoon, and the flow of the Tiflomity spring waters was also diverted through an artificial canal in Navarino Bay (Fig. 2b). These works reduced the lagoon area from 7.5 km2 to 2.5 km2 as water level decreased, reclaiming dry land for farming. In the middle 1980s, an artificial inlet was constructed in the lagoon barrier and, via this inlet, the lagoon was linked with Navarino Bay. Moreover, in the internal part of the lagoon levees were constructed, in order to isolate the fresh and saline waters. The consequences of the drainage works, as well as of the artificial interventions, were the environmental degradation of the lagoon and the initiation of several oxygen depletion and dystrophic events (Koutsoubas et al. Reference Koutsoubas, Dounas, Arvanitidis, Kornilos, Petihakis, Triantafyllou and Eleftheriou2000a). In October 1993, the local ecosystem suffered the impact from an oil spill in the Gulf of Navarino, causing short term, but reversible deterioration (Koutsoubas et al. Reference Koutsoubas, Dounas, Arvanitidis, Kornilos, Petihakis, Triantafyllou and Eleftheriou2000a). A funded ecological study started in the Gialova Lagoon in order to identify the repercussions of the oil spill in the lagoonal environment. The study took place during the years 1995–1996 on a seasonal basis, and provided the first coherent data on the macrobenthic (Koutsoubas et al. Reference Koutsoubas, Dounas, Arvanitidis, Kornilos, Petihakis, Triantafyllou and Eleftheriou2000a) and meiofaunal (McArthur et al. Reference McArthur, Koutsoubas, Lambadariou and Dounas2000) communities of the lagoon, the molluscan (Koutsoubas et al. Reference Koutsoubas, Arvanitidis, Dounas and Drummond2000b) and the annelid (Arvanitidis et al. Reference Arvanitidis, Koutsoubas, Dounas and Eleftheriou1999) fauna, as well as on the annual cycles of the nutrients and the phytoplankton in the lagoon (Petihakis et al. Reference Petihakis, Triantafyllou, Koutsoubas, Allen and Dounas1999).
Following the suggestions of the management plan of that study, and in order to solve the problem of extreme disturbance due to dystrophic conditions that occurred every autumn in the lagoon, causing significant stress to the ecosystem (Koutsoubas et al. Reference Koutsoubas, Dounas, Arvanitidis, Kornilos, Petihakis, Triantafyllou and Eleftheriou2000a), two canals were opened after 1998, bringing fresh water from the Tiflomity springs and Xirolagados River into the lagoon (Fig. 2c), improving its environmental and ecological status (Chatzigeorgiou et al. Reference Chatzigeorgiou, Reizopoulou, Maidanou, Naletaki, Orneraki, Apostolaki and Arvanitidis2011). However, a second ecological study that followed during 1998–1999 showed changes in the composition of the macrobethic communities caused by dystrophic events that had continued to occur, possibly also caused by the inflow of fresh water, leading to their degradation (Chatzigeorgiou et al. Reference Chatzigeorgiou, Reizopoulou, Maidanou, Naletaki, Orneraki, Apostolaki and Arvanitidis2011).
2. Material and methods
2.1. Sediment collection and grain size analysis
In order to estimate the spatial distribution of sediment characteristics, 27 surficial samples were collected from the bottom of the lagoon, using a grab; in addition, 23 samples were collected from six locations with the use of a gravity corer (Fig. 1). The grab sampler enables the top 10 cm of sediments to be sampled, whereas with the gravity corer, sediments from a maximum depth of 45 cm can be sampled. Positioning was achieved with a hand-held GPS (accuracy 3 m). All samples were analysed for their grain size distribution. Material coarser than 4 Φ was dry sieved, whilst fine grained material >4 Φ was analysed using the pipette method, and finally grain size distribution was calculated. Grain size statistical parameters such as mean, sorting, skewness and kurtosis were calculated and sediment classification was made according to Folk (Reference Folk1974) nomenclature. Colours were identified using a Minolta CM-2002 hand-held spectrophotometer based on the Munsell colour chart.
The spatial distribution of sediment characteristics is presented using contour maps which were calculated by Surfer 9 software. The interpretation was based on the kriging technique, which is a statistical method that has been used in studies of geology and marine geology to estimate the distribution of variables in patches of marine sediments.
2.2. Micro- and macrofossil assemblages
Twenty three samples of approximately 15 g of dried sediment were collected from the six cores, namely G1–G6, for macro- and microfossil analysis. Four samples were collected from each core at 0 cm, 10 cm, 25 cm and 38–44 cm, except from core G4 where the fourth sample was not collected as the core was shorter than 30 cm. The specimens were washed through 0.5 mm and 0.063 mm mesh sieves using tap water. Macrofaunal specimens were mainly collected from the coarser sediments, whereas molluscs, ostracods and foraminifera were collected from the finer sediments. The collected specimens were sorted and determined, when possible, to species level, and taxonomic information was checked and updated following the World Register of Marine Species (WoRMS; Appeltans et al. Reference Appeltans, Bouchet, Boxshall, De Broyer, de Voogd, Gordon, Hoeksema, Horton, Kennedy, Mees, Poore, Read, Stöhr, Walter and Costello2012). The abundances of the determined taxa per sample were normalised to percentages, and the respective dataset was statistically analysed using correspondence analysis. Cluster analysis based on the Jaccard similarity index (absence–presence) (Jaccard Reference Jaccard1912) was also applied to the respective data in order to identify possible sample groups.
2.3. Geochemistry
Approximately 1g±0.1mg of dried sample was digested with 2.35 mL of 65 % HNO3 and 7 mL of HCl (aqua regia) in a microwave digestion system (Berghof speedwave MWS-3+). The temperature digestion protocol was as follows: at 145°C for five minutes; at 170°C for ten minutes; and at 170°C for 15 minutes. The resulting solutions were cooled for 30 minutes and diluted to 10 mL with distilled water. The clear solutions were analysed on a Thermo Scientific iCAP 6000 ICP-OES. The operating conditions were as follows: nebuliser gas flow rates – 0.5 l/min; auxiliary gas flow – 0.5 l/min; plasma gas flow – 15 l/min; pPump rate – 45 rpm; ICP RF power – 1100 W. Aliquots of an ICP multi-element standard solution (100 mg/L Merck) containing the analysed elements, was used in the preparation of calibration solutions. Working standard solutions were prepared by dilution of the stock standard solutions to the desired concentration in 1% HNO3. The ranges of the calibration curves (six points) were selected to match the expected concentrations for all the elements of the samples analysed by ICP-OES. The correlation coefficient R2 obtained for all cases was 0.9999. The detection limits (LOD) were calculated as the concentrations of an element given by the standard deviation of a series of ten consecutive measurements of blank solutions. Soil samples from BIPEA's proficiency testing scheme A15 were used to ascertain the accuracy of the measurements. The total organic carbon (TOC) content was determined by the titration method (Gaudette et al. Reference Gaudette, Flight, Toner and Folger1974).
In order to assess background enrichments or depletions of metals in the Gialova Lagoon sediments, we employed three geochemical indices:
i. The enrichment factor, EF, (Reimann & de Caritat Reference Reimann and de Caritat2005),
 $$EF = (C_{sample} / C_{Al}) / (C_{standard} / C_{AL standard})$$
where Csample is the concentration of the element and CAl sample is the concentration of Al in the sample. The Al normalisation is utilised because concentrations of most elements show correlation with Al2O3. The selected reference sample is usually an average crust or a local background sample (Blaser et al. Reference Blaser, Zimmermann, Luster and Shotyk2000; Liu et al. Reference Liu, Zhao, Ouyang, Söderlund and Liu2005). Average shale values are used as the standard in our study (Turekian & Wedepohl Reference Turekian and Wedepohl1961).
ii. The contamination factor, Cif, (Håkanson Reference Håkanson1980; Abrahim & Parker Reference Abrahim and Parker2008),
 $$C^i_f=\overline {C^i_{0-1}}/C^i_n$$
Where  $\overline {C^i_{0-1}}$ is the mean content of the substance i from at least five sample sites and Cin is the pre-industrial reference level for the substance. The pre-industrial reference level determined from various European and American lakes is given by Håkanson (Reference Håkanson1980).
iii. The index of geo-accumulation, Igeo, (Müller Reference Müller1979; Abrahim & Parker Reference Abrahim and Parker2008).
 $$I_{geo}=log_2 [C_n / (1.5 B_n)]$$
, where Cn is the measured concentration in the sediment for the metal n, Bn is the background value for the metal n and the factor 1.5 is used because of possible variations of the background data due to lithological variations. However, several researchers (Subramanian & Mohanachandran Reference Subramanian and Mohanachandran1990; Sahu & Bhosale Reference Sahu and Bhosale1991) have used the previous expression using regional backgrounds and on the less than 63–65 μm sediment fraction. In this study, Igeo has been calculated using global average shale data from Turekian & Wedepohl (Reference Turekian and Wedepohl1961) (Rubio et. al. Reference Rubio, Nombela and Vilas2000; Harikumar & Jisha Reference Harikumar and Jisha2010), because they refer to the bulk concentrations and are naturally very rich in fine grain sizes.
In addition, we did establish a local baseline value because metals concentrations are depleted towards the recent sediments. Since pollution effects may extend to a considerable variation in depth, the selection of the low concentration samples for baseline averaging is best done by inspection of the metal trends in the lower core.
3. Results
3.1. Lagoon surficial grain size distribution
Based on the grain size analyses of the 27 bottom sediment samples, the mean size (Mz) ranged from 2.15 Φ to 7.48 Φ, with an average value of 5.45 Φ, indicating that the lagoon's sediments are composed mainly of sandy mud and few samples of muddy sand (Fig. 3; Table 1). The spatial distribution of mean size indicates that the finest material is observed at the southeastern lagoon margin (Mz>7Φ), whilst coarser clastic sediments are observed near the artificial inlet very close to the barrier island (Figs 3, 4).
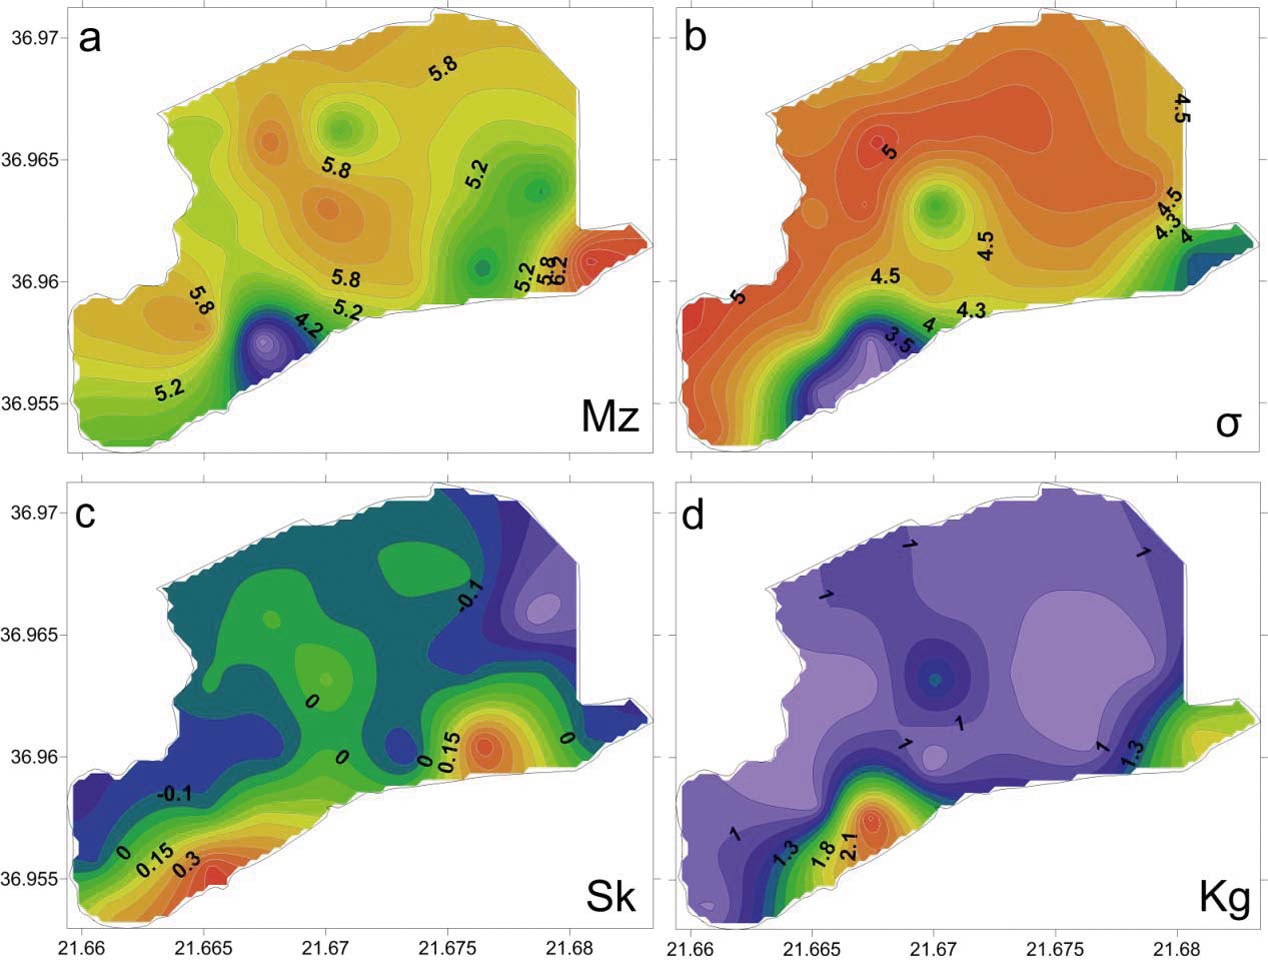
Figure 3 Distributions of the moment measures: (a) mean size (Mz); (b) sorting (σ); (c) skewness (Sk); (d) kurtosis (Kg).
Table 1 Surface sediment coordinates, grain size analysis results, total organic carbon (TOC) content and moment measures (Mz, σ, Sk and KG).

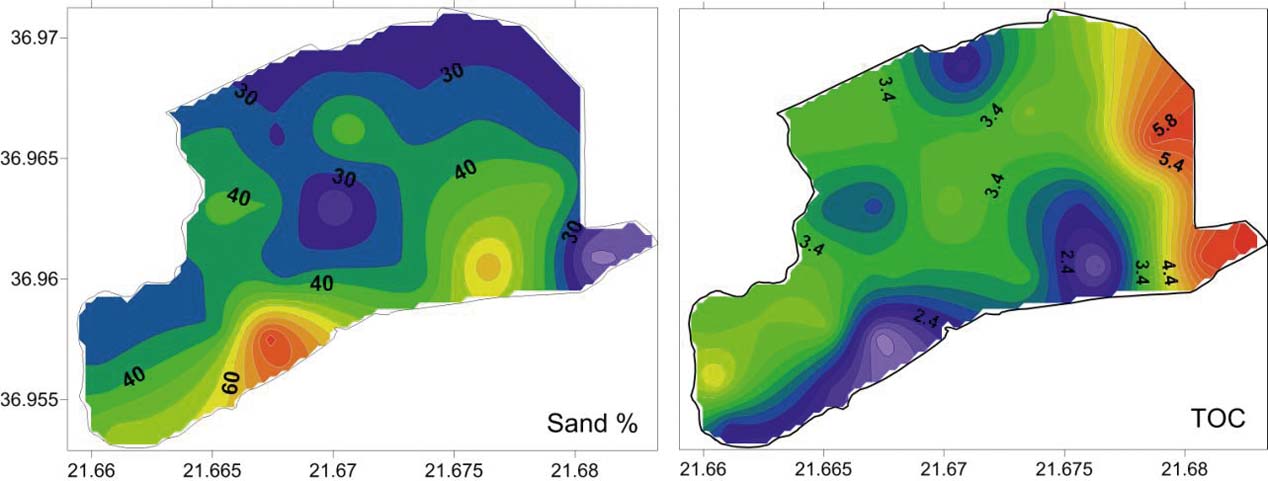
Figure 4 (a) Spatial distribution of sand in the Gialova Lagoon. (b) total organic carbon (TOC).
The analysis of the moment measures showed that the sediments are characterised by a very poor to an extremely poor sorting (σ), and range from 3.05 Φ to 5.16 Φ, with an average value of 4.59 Φ (Fig. 3b; Table 1). The skewness of the analysed sediments ranged from strongly coarse skewed to strongly fine skewed (Sk=–0.34 Φ to 0.47 Φ), with an average value of –0.02 Φ (Fig. 3c; Table 1). In total, 50 % of the samples have near symmetrical skewness, 30 % are fine-skewed, 4 % are strongly fine-skewed and 8 % are strongly coarse-skewed. The calculation of kurtosis displays a fluctuation from very platykurtic to very leptokurtic values (KG=0.61–2.56 Φ), with an average value of 1.07 Φ (Fig. 3d; Table 1). In total, 37 % of the samples show platykurtic values, 45 % mesokurtic values, 8 % leptokurtic values and 11 % very leptokurtic values. The mesokurtic curves were observed only in the northern part of the lagoon, whilst on the basis of its spatial distribution, a variety of kurtosis values were observed.
The vertical grain size distribution of the 22 samples, collected from the six gravity cores, indicate similar characteristics in the sediments from all the cores and thus all the sediments can be classified as sandy mud (Table 2) (Folk Reference Folk1974). The presented gravel portion in the gravity corer samples is of biogenic origin, consisting of shells and shell fragments, and for this reason was not included in the sediments' grain size characteristics.
Table 2 Result of major (wt. %) and trace elements (ppm), total organic carbon, grain size analysis of the gravity cores samples G1-6 and their colors according to Munsell color chart.
1. UCC: Upper Continental Crust values by Taylor and McClennan (Reference Taylor and McLennan1985).
2. Shales: Values reported after Turekian and Wedepohl (Reference Turekian and Wedepohl1961). The Al2O3, CaO, Fe2O3 , K2O, MgO, MnO, Na2O and P2O5 concentrations calculated using the appropriate molar ratio.
a: Calculated after the results given by Taylor and McLennan, (Reference Taylor and McLennan1985) for Fe 3.50%.
b: Calculated after the results given by Taylor and McLennan, (Reference Taylor and McLennan1985) for Mn 600 ppm.
3.2. Micro- and macrofossil assemblages
The study of the macro- and microfossil remains provided taxa that belong to six different phyla (charophytes, molluscs, arthropods, foraminifera, bryozoans and echinoderms). More specifically, two bivalve, five gastropod, four ostracod, ten foraminifera and one charophyte species were determined (Table 3). In all cores, the dominant taxa were Cyprideis torosa forma litoralis, Hydrobia acuta and Ammonia cf tepida. The vertical distribution of all taxa is described in detail per gravity core.
Table 3 Abundances of the determined macro- and micro- faunal taxa in percentages extracted from the 23 samples that were collected from the six cores.
3.2.1. Gravity Corer G1
The dominant taxon in core G1 is Cyprideis torosa forma litoralis, accompanied in considerable percentages by Hydrobia acuta and Ammonia cf tepida (Fig. 5; Table 3). At the lowermost part of the core, C. torosa is the most abundant taxon, followed by H. acuta and A. cf. tepida. Cerastoderma glaucum and Abra segmentum are also present in fair numbers. Two inner shelf taxa, Elphidium and Bulimina, as well as the marine lagoonal and brackish taxon Loxoconha elliptica (Zaibi et al. Reference Zaïbi, Carbonel, Kamoun, Fontugne, Azri, Jedoui and Montacer2012), were also identified. The assemblage at 25 cm depth is almost the same, with the exception that H. acuta, L. elliptica and A. cf. tepida numbers increase, although the numbers of C. glaucum and A. segmentum become reduced and the inner shelf taxa disappear, showing less influence from the sea. At 10 cm depth, the taxa composition changes, characterised by a drop in C. torosa and an increase of H. acuta, L. elliptica and A. cf. tepida and C. glaucum and A. segmentum; in addition, inner shelf benthic foraminifera (such as Bolivina) appear again in very low numbers, accompanied by the presence of a charophyte gyrogonite. At the top of the core, the numbers of the more resistant C. torosa rise significantly (78 %), whilst H. acuta, L. elliptica and A. cf tepida and C. glaucum and A. segmentum numbers drop. A few Potamides conicus and Vermetes triquetrus shells, and charophyte gyrogonites, are also present.

Figure 5 Macro- and micro-faunal abundance plots from gravity cores: (a) G1; (b) G2; (c) G3. Based on Table 3 and the boundaries of the different environmental facies.
3.2.2. Gravity Corer G2
In this core, the overall distribution of the main determined taxa is similar to core G1 (Fig. 5; Table 3). The dominant taxon is also C. torosa forma litoralis, accompanied in significant numbers by H. acuta and A. cf tepida (which are more abundant in the middle part of the core). C. glaucum and A. segmentum are also present, being more abundant towards the lower part of the core. Conversely, L. elliptica has a significant presence in the middle of the core, but its numbers decrease at the lower part of the core. Inner shelf foraminifera and the gastropod V. triquetrus are only found at the uppermost part of the core. Notably, a single Globigerinoides sp. test has been found at 10 cm. Finally, charophyte gyrogonites were found at the top and at the lowermost part of the core.
3.2.3. Gravity Corer G3
Despite the dominance of C. torosa forma litoralis and the contribution of L. elliptica and A. cf tepida, the composition of the recorded assemblages in core G3 presents a slightly different distribution as compared with cores G1 and G2 (Fig. 5; Table 3). Notably, although the assemblage at the lower part of the core consists of almost all the common taxa except H. acuta, the numbers of specimens of the respective taxa are relatively low. The total number of specimens that were collected from the whole processed sample is 72 and the few bivalve valves (C. glaucum and A. segmentum) were small, whereas the C. torosa valves were also small-sized, representing mainly juvenile individuals. Valvata shells and charophyte gyrogonites have also been recovered. At 25 cm, C. glaucum and A. segmentum are significantly abundant, being 23 % and 31 % respectively of the total assemblage. The 10 cm depth is characterised by the significant drop in C. glaucum and A. segmentum numbers and the marked presence of V. triquetrus. At the top of the core, inner shelf foraminifera, the gastropods V. triquetrus and P. conicus, and the presence of charophyte gyrogonites change the composition of the assemblage.
3.2.4. Gravity Corer G4
Once again, C. torosa forma litoralis dominates this short core. H. acuta and A. segmentum are major components of the assemblages and L. elliptica has a significant contribution (Fig. 6; Table 3). Ammonia cf tepida is present in low numbers all over the core, whereas charophyte gyrogonites increase gradually towards the top of the core, suggesting fresh water influence. At the top of the core, inner shelf foraminifera and significant numbers of the gastropod P. conicus are present.
Figure 6 Macro- and micro-faunal abundance plots from gravity cores: (a) G4; (b) G5; (c) G6. Based on Table 3 and the boundaries of the different environmental facies.
3.2.5. Gravity Corer G5
C. torosa forma litoralis is the dominant taxon, followed by H. acuta and Ammonia cf tepida (Fig. 6; Table 3). The numbers of the collected specimens of these three taxa are relatively stable along the core. C. glaucum and A. segmentum numbers are considerably higher at the lower part of the core, being main components of the assemblage, whilst they are reduced towards the top and their contribution then becomes minor. L. elliptica numbers are low at the bottom of the core, but they gradually increase, getting to their highest numbers at the top. Inner shelf foraminifera, and the gastropods P. conicus and V. triquetrus, are found at the uppermost part of the core sequence in very low numbers. Charophyte gyrogonites have a marked presence along the core, with their highest numbers at the 10 cm depth.
3.2.6. Gravity Corer G6
Core G6 is characterised by the dominance of C. torosa forma litoralis and the distinct presence of H. acuta, particularly in the middle of the core. C. glaucum, A. segmentum and A. cf tepida are present throughout the core, with stable numbers (Fig. 6; Table 3). The total absence of L. elliptica from this core can be clearly noted. Once again, inner shelf foraminifera, and the gastropods P. conicus and V. triquetrus, are found only at the uppermost part of the core. Charophyte gyrogonites in low numbers are found along the core, with their highest values at the top of the core sequence, whereas Valvata shells are present at its lowermost part.
3.3. Sediment geochemistry
Table 2 presents the results of major and trace elements, the total organic carbon (TOC) and the grain size characteristics of the gravity core samples, the concentrations of the elements in the Upper Continental Crust (UCC) (Taylor & McClennan Reference Taylor and McLennan1985) and the average shale composition (Turekian & Wedepohl Reference Turekian and Wedepohl1961).
According to the comparison of the mean composition in our study and the average values reported by Turekian & Wedepohl (Reference Turekian and Wedepohl1961) for shales, we distinguish Cd, Cr, Cu, Ni, Pb, Zn, MnO, MgO and Na2O as having mean values been higher than the average shale values. The elements with lower concentrations than average include Al2O3, K2O and V. The Fe2O3 and P2O5 concentration is similar to that reported for the average shales. Furthermore, CaO, Fe2O3, MnO, MgO, Cu, Pb, Ni, and Cr mean values are enriched compared to the concentrations of the Upper Continental Crust (UCC) reported by Taylor & McClennan (Reference Taylor and McLennan1985). By contrast, Al2O3, K2O and Cd are depleted compared to the UCC values. The Na2O, Zn and V mean values are about the same as the UCC values. TOC profiles of the sediments analysed show variation ranging from 1.56 % to 4.60 % (Table 2).
With respect to the geo-accumulation index, the Igeo values are calculated as ≤0 for the majority of the samples analysed, showing unpolluted features for the Gialova Lagoon sediments. Only the Igeo values for Cd, Ni and Pb are indicative of the class 1 (Muller 1979), (0<Igeo≤1), showing unpolluted to moderately polluted features (Table 4). The most affected samples are from the G1, G2, G4, G5 and G6 sampling sites.
Table 4 The calculated enrichment factors (EF) and Index of geo-accumulation (Igeo) for the analyzed samples.

The enrichment factor for elements other than V is well above 1 (Table 4). This is indicative of the source input of fine-grained materials from the surrounding catchment area. In this case, the EF>1 could be interpreted as enrichments caused by anthropogenic activities (Acquavita et al. Reference Acquavita, Predonzani, Mattassi, Rossin, Tamberlich, Falomo and Valic2010).
The contamination factors of Cd, Cr, Cu, Pb and Zn, calculated for the surface horizon (0.00 cm) and the deep sediment layer (0.40 cm), are below 1 (Fig. 7) indicating a low contamination (Håkanson Reference Håkanson1980). In the deep sediment horizon, only Cr and Cu reach values 1≤Cif<3, showing moderate contamination for these samples.
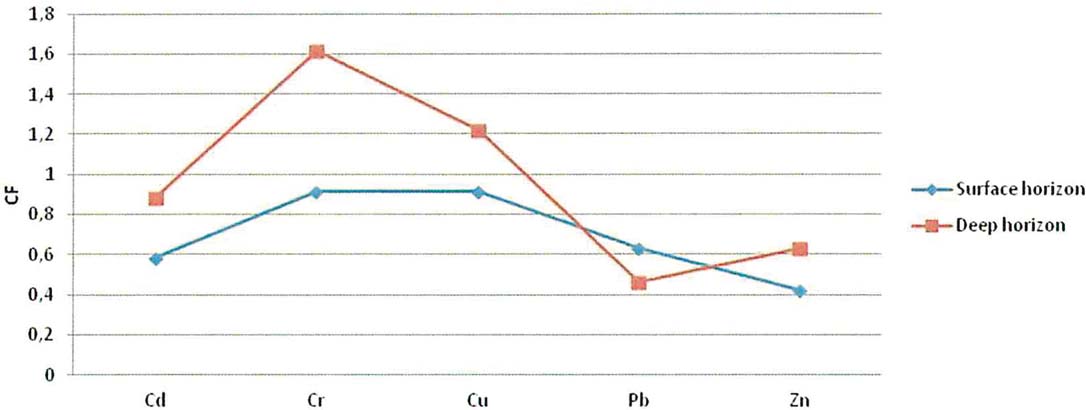
Figure 7 Contamination factor (CF) of various metals for the surface and deep horizon gravity cores samples.
4. Discussion
The hydrology, morphology and sediment characteristics of the Gialova Lagoon are similar to other shallow coastal lagoons of western Greece and are a typical representative example of a Greek lagoon wetland (Avramidis et al. Reference Avramidis, Bouzos, Antoniou and Kontopoulos2008, Reference Avramidis, Bekiari, Kontopoulos and Kokidis2013; Papatheodorou et al. Reference Papatheodorou, Avramidis, Fakiris, Christodoulou and Kontopoulos2012). The sediment characteristics and the subfossil assemblages, as well as the sediment geochemistry and the pollution indices, are influenced by the drainage works that have taken place during the last 70 years in the lagoon (Fig. 2). The attempts at lagoon drainage were started in the 1950s, with the diversion of the Xirolagados River to Voidokilia Bay and the Tiflomity springs, via an artificial channel, to Navarino Bay (Fig. 2b). After 1998, two canals (sluices) were opened, bringing fresh water from both the Xirolagados River and the Tiflomity springs (Fig. 2c).
4.1. Sedimentology – grain size spatial distribution
Based on grain size characteristics, the Gialova Lagoon can be divided into three parts: (i) the northern part, influenced by the Xirolagados River and Tyflomyti springs; (ii) the southern part, adjacent to the sandy barrier and the lagoon inlet; and (iii) the central part, with relatively calm conditions.
The spatial distribution of sand indicates a relatively higher portion (>50 % sand) in a strip area of the lagoon just north of the sandy lagoon barrier and near the inlet (Fig. 4). This high percentage of sand in this area of the lagoon can be related to the littoral sandy material of Navarino Bay, which came into the lagoon via the old inlets, and to the sandy sediments of the barrier, which are transported by the wind into the lagoon. The sorting of the bottom lagoon sediments is relatively constant over the much wider range of mean grain size, as previously mentioned. This evidence suggests a calm condition of a ‘quiet water’ environment for the lagoon bottom (Buller & MacManus Reference Buller and MacManus1972). In the northern part of the lagoon, the grain size cumulative curves are nearly symmetrical and mesokurtic. These evidence a single source area for the sediments of this part of the lagoon, which is the inflow into the lagoon of the Xirolagados River (Folk Reference Folk1974). After the diversion of the river mouth, the lagoon has ceased to accept further sediments and the sediments of the northern part can be characterised as ‘relict’, maintaining their grain size distributions. These ‘relict’ sediments are extremely poorly sorted, as a result of the flood events of the Xirolagados River. The alternating zones of the Mz values in the northern and northeastern margin of the lagoon suggest the shifting of the Xirolagados River mouth. The spatial distribution of skewness shows the presence of a zone with coarse-skewed values parallel to the long axis of the lagoon. These values are the result of the winnowing process, which causes the removal of the fine-grained tail of distribution (Valia & Cameron Reference Valia and Cameron1977; Martins Reference Martins2003). The winnowing process is caused by re-suspension, with the help of the wind action in the very shallow Gialova Lagoon. The removed fine-grained fraction is deposited again in the area behind the barrier island, which is characterised by a high proportion of sand (Fig. 4). Thus, sediments with fine-skewed values are produced. In this zone, the increased sand content comes from the old inlets and via the winds from the sandy barrier and, to a lesser extent, from the artificial inlet because, currently, a lock-gate in this inlet prevents the entry of sand. The presence of the coarse-skewed values represents a non-depositional or erosional area, whilst the fine-skewed zone is an area dominated by the deposition of fine sediments (Fig. 3c). North of the coarse-skewed zone, the bottom sediments indicate near-symmetrical curves. This suggests the absence of the continuous action of the winnowing process (Duane Reference Duane1964; Valia & Cameron Reference Valia and Cameron1977). In fact, during the summer a large part of the zone with nearly symmetrical values could have been equally dry as today, or it could have been shallower. These conditions prevented the winnowing process and this zone is an area in a state of flux (Martins Reference Martins2003). It is obvious that the energy in the Gialova Lagoon environment increases gradually from the northern margin to the barrier island.
The increased presence of organic carbon in the eastern part of the lagoon, compared to the western part, is the result of its adjacency with the marshes of the Gianouzagas River. The organic material is transported and deposited in the eastern part, whilst a fast burial prevents the oxidation. The fast burial may be related to flooding events of the Xirolagados River.
4.2. Subfossil assemblages
The temporal and spatial distribution of macro and micro subfossil remains collected from the six cores from the Gialova Lagoon provides information on the evolution of this marginal marine ecosystem. Spatially, the six cores can be separated into three groups: Cores G1 and G2 represent the western part of the lagoon, behind the inlet that connects the lagoon with the Navarino Gulf, hence they are influenced significantly by the marine realm; cores G4, G5 and G6 are located at the northeastern perimeter of the lagoon, and thus they are influenced by the fresh water input in the lagoon; whereas G3 is found in the middle of the lagoon, depicting a more complicated state (Fig. 1). This segregation is similar to the two zones proposed by McArthur et al. (Reference McArthur, Koutsoubas, Lambadariou and Dounas2000) and Koutsoubas et al. (Reference Koutsoubas, Dounas, Arvanitidis, Kornilos, Petihakis, Triantafyllou and Eleftheriou2000a), one close to the inlet and one in the inner lagoon.
The 23 samples that were collected from the six cores are characterised mainly by six taxa found almost in every assemblage. These taxa comprise of three mollusc, C. glaucum, A. segmentum and H. acuta, two ostracod, C. torosa forma litoralis and L. elliptica, and one foraminifera species, A. cf tepida, with C. torosa forma litoralis being clearly the dominant taxon everywhere. All of them are typical shallow brackish lagoonal taxa, tolerant also of a wide range of fluctuations in salinity, temperature and oxygen levels, and thus can be characterised as euryhaline and eurythetmal taxa with a preference to muddy bottoms (Britton Reference Britton1985; Pascual & Carbonel Reference Pascual and Carbonel1992; Debenay & Guillou Reference Debenay and Guillou2002; Murray Reference Murray2006; Kevrekidis et al. Reference Kevrekidis, Kasapis and Kalpia2009; Zaibi et al. Reference Zaïbi, Carbonel, Kamoun, Fontugne, Azri, Jedoui and Montacer2012). More specifically, in the Gialova Lagoon such fluctuations occur seasonally, with lower salinities (polysaline) and temperatures in the spring during the end of the wet season (fresh water influxes), and higher salinities (metasaline) and temperatures in the autumn during the end of the dry season (McArthur et al. Reference McArthur, Koutsoubas, Lambadariou and Dounas2000). Consequently, only a small number of tolerant, eurytopic organisms such as the aforementioned ones could survive such harsh conditions in the long term. Furthermore, a number of other taxa were also found in the assemblages in low numbers. Nevertheless, despite their minor contribution in the assemblages, these taxa provide a depiction of the factors that affected temporally the respective lagoon environments. The dominance of C. torosa forma litoralis in the assemblages indicates that generally low energy environments prevailed in the lagoon (Zaibi et al. Reference Zaïbi, Carbonel, Kamoun, Fontugne, Azri, Jedoui and Montacer2012).
The top ten centimetres in all six cores are characterised by the presence of inner shelf foraminifera (Peneroplis, Cibicides, Quinqueloculina, etc.) and the gastropod V. triquetrus, usually located in shallow sublittoral/subtidal marine environments, as well as by the presence of the gastropod P. conicus, indicating a less confined lagoon system with fresh water influx (Kowalke Reference Kowalke2005). The presence of charophyte gyrogonites (Chara sp.) provides further evidence for the influence of fresh water. In addition, the presence of Vermetes triquetrus, especially in G2, G3 and G6, is indicative of shallow protected areas with a marine influence. Consequently, the upper 10cm of all the cores suggest the prevalence of brackish lagoonal conditions in the lagoon; although communication with the Navarino Gulf through the inlet allowed the influx of marine water and, at the same time, inflows of fresh water were discharged into the lagoon through channels from the Xirolagados River and Tyflomity springs. Consequently, these samples can be attributed to the first facies, as they are clearly separated in the correspondence analysis scatter diagram, and from the dendrogram produced from this analysis (Figs 8, 9). Thus, the depicted lagoonal environment refers to conditions established in the lagoon after the human interventions in the 1980s, when the inlet was constructed and fresh water was allowed again to flow in.
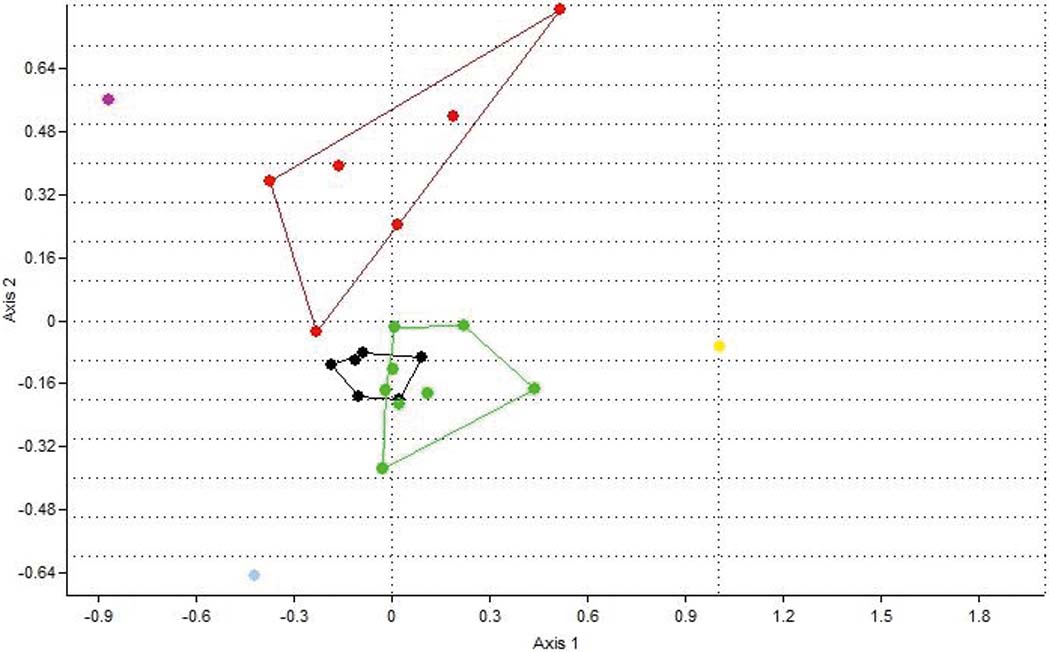
Figure 8 Correspondence analysis plot (axis 1–2) showing the distribution of the 23 samples based on their faunal contents. Red dots=facies 1; black dots=facies 2; green dots=facies 3; grey dot=facies 4; purple dot=sample at 10cm from G3; yellow dot=sample at 25cm from G3.
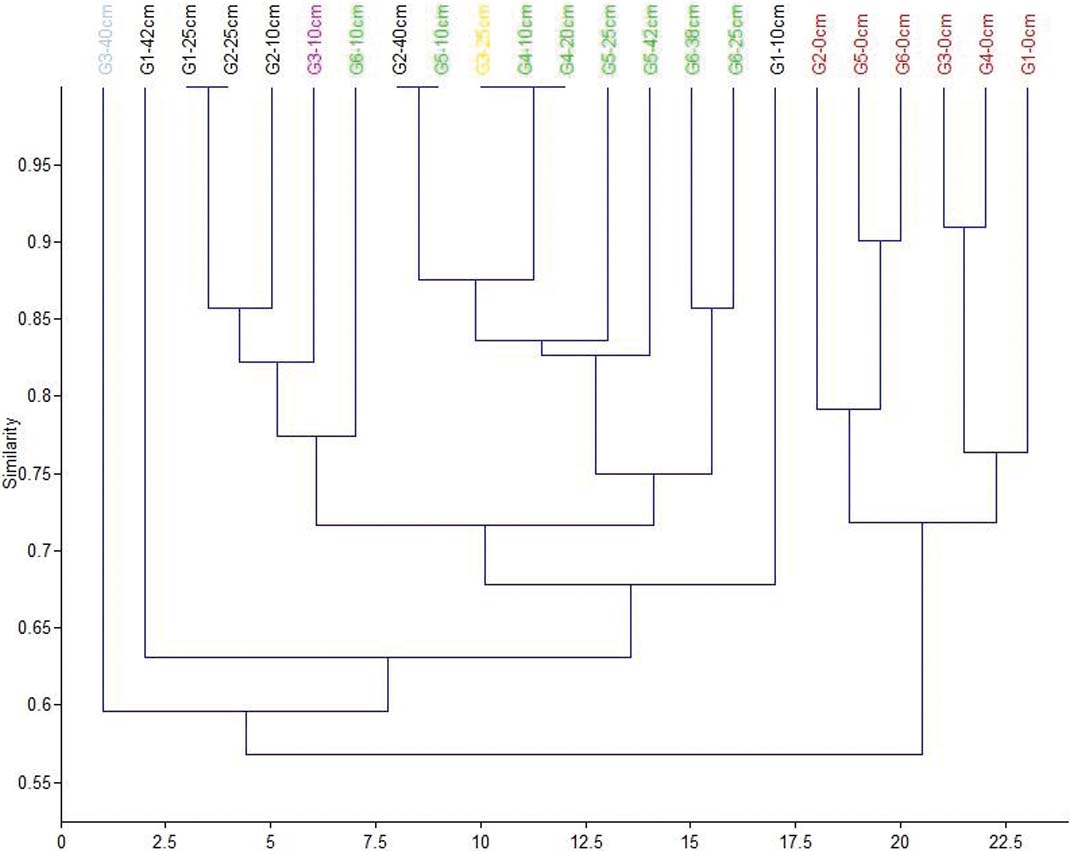
Figure 9 Cluster analysis dendrogram showing the grouping of the 23 samples based on their faunal contents. Red=facies 1; black=facies 2; green=facies 3; grey=facies 4; purple=sample at 10cm from G3; yellow=sample at 25cm from G3.
The presence of a Globigerinoides sp. test at the top of G2 most likely indicates a random storm event that carried the test in the lagoon.
The middle and lower parts of the six cores present differences which correspond to the three spatial groups. The assemblages in the middle part of cores G1 and G2 (Group 1) consist only of the six main tolerant brackish taxa, indicating brackish, confined lagoonal environments, with significant seasonal fluctuations in salinity and possible dystrophic conditions. The assemblages from the lower part of the two cores also present brackish lagoonal environments; however, the presence of Chara sp. gyrogonites suggests the influx of fresh water, at least seasonally. Subsequently, these assemblages characterise the second facies (Figs 8, 9).
Cores from Group 3 (G4, G5 and G6) present almost the same distribution of the six main taxa in the lower and middle levels, with only one exception. Interestingly, charophyte gyrogonites have been found in all the assemblages and particularly in core G5, indicating a constant influx (influence) of fresh water in the lagoon. In addition, a few charophyte gyrogonites have been recorded from the lower part of Core G6. Therefore, a brackish lagoonal environment with seasonal influx of fresh water can be inferred for the three cores, representing facies three (Figs 8, 9). L. elliptica numbers drop in the middle and the lower part of the G5 core whereas, in core G6, L. elliptica valves are absent from all samples. Most likely, the impoverishment in L. elliptica shows very low energy conditions and no sea water influence, limiting the provision of nutrients (Pascual & Carbonel Reference Pascual and Carbonel1992; Marriner et al. Reference Marriner, Morhange and Doumet-Serhal2006; Zaibi et al. Reference Zaïbi, Carbonel, Kamoun, Fontugne, Azri, Jedoui and Montacer2012).
Finally, core G3, which belongs to the second group, is located in approximately the centre of the lagoon. In the middle of the core, a significant increase in C. glaucum and A. segmentum has been recorded, suggesting favourable conditions for these lagoonal bivalves, which can be correlated with facies two (Figs 8, 9). Nevertheless, at the lower part of the core, the faunal composition changes dramatically; perhaps related to the occasional prevalence of anoxic and/or dystrophic conditions. In particular, the assemblage is clearly impoverished, as only 72 specimens were collected. The majority of the collected material belongs to juvenile individuals, with C. torosa forma litoralis as the dominant component and with the absence of even common tolerant taxa; we assume that only the easily transported juvenile shells and tests have been recovered from this assemblage. However, a good number of Valvata shells (seven individuals), which indicate fresh water influx, have been discovered. Subsequently, brackish anoxic and/or dystrophic conditions characterise the lower part of G3, where fresh water influxes enabled the transportation of lighter shells. This sample characterises the fourth facies, which is clearly separated in the correspondence analysis scatter diagram, and the resultant dendrogram (Figs 8, 9).
In addition to the distribution of the determined taxa from the six cores which represent the different environmental conditions in the lagoon, the correspondence analysis (Fig. 8) and employed cluster analysis (Fig. 9) showed at least four main groups of samples (assemblages) that correspond to four different environmental facies (Figs 5, 6):
1. Brackish lagoonal with shallow marine and fresh water influence;
2. Brackish lagoonal where more confined conditions occur;
3. Brackish lagoonal with fresh water influence;
4. Brackish lagoonal with anoxic and dystrophic conditions.
These observations provide a temporal archive for correlations with previous recent studies on the extant benthic communities of Gialova Lagoon, and particularly on organisms with shells that can be preserved in the sediments (McArthur et al. Reference McArthur, Koutsoubas, Lambadariou and Dounas2000; Koutsoubas et al. Reference Koutsoubas, Dounas, Arvanitidis, Kornilos, Petihakis, Triantafyllou and Eleftheriou2000a, Reference Koutsoubas, Arvanitidis, Dounas and Drummondb; Chatzigeorgiou et al. Reference Chatzigeorgiou, Reizopoulou, Maidanou, Naletaki, Orneraki, Apostolaki and Arvanitidis2011). The number of collected valved molluscs taxa from the six cores is clearly reduced, with six gastropod and two bivalve species, compared to the 15 gastropod and five bivalve species from the extant assemblages (Koutsoubas et al. Reference Koutsoubas, Dounas, Arvanitidis, Kornilos, Petihakis, Triantafyllou and Eleftheriou2000a). Nevertheless, three bivalve and seven gastropod species were collected from stations next to the communication channel and thus the marine effect was certainly higher. Despite the smaller number of collected taxa in this study, two of them were not described by Koutsoubas et al. (Reference Koutsoubas, Arvanitidis, Dounas and Drummond2000b) – the fresh water Valvata sp. and the marine V. triquetrus – which were traced on the surficial layer (0 cm) and, notably, the latter has been found in all six cores. Another interesting observation is the presence of P. conicus only in the surface samples of all cores, and its total absence from all the other deeper ones. This trend matches with the observations of Chatzigeorgiou et al. (Reference Chatzigeorgiou, Reizopoulou, Maidanou, Naletaki, Orneraki, Apostolaki and Arvanitidis2011) from their 1998 samplings after the opening of two canals that brought fresh water to the lagoon. In addition, they also reported the significant population reduction of H. acuta, which is present in considerable populations in almost all core samples and in the previous sampling (Koutsoubas et al. Reference Koutsoubas, Arvanitidis, Dounas and Drummond2000b). Conversely, except for P. conicus, all the other typical brackish lagoon taxa (C. glaucum, A. segmentum and H. acuta) are found in all core samples. Also, the spatial distribution of foraminifera from the core samples is in agreement with the observations of McArthur et al. (Reference McArthur, Koutsoubas, Lambadariou and Dounas2000), where increased numbers of foraminifera are found close to the stations and cores found closer to the communication channel and their numbers decrease in the inner lagoon.
Generally, two trends in the temporal and spatial evolution of the environmental facies can be observed. The first trend is observed in the cores close to the inlet (G1 and G2), where the brackish lagoonal facies with more confined conditions changes at the top of the sequence to brackish lagoonal facies with shallow marine and fresh water influence. The second trend, as has been observed in the inner lagoon, indicates a change from a brackish lagoonal facies with fresh water influence to a brackish lagoonal facies with shallow marine and fresh water influence. Obviously, human interventions caused these changes. In addition, evidence for an intense dystrophic and/or hypoxic event that affected the lagoon is found at the lower part of core G3, and this can be correlated with similar studies on recent assemblages (Koutsoubas et al. Reference Koutsoubas, Dounas, Arvanitidis, Kornilos, Petihakis, Triantafyllou and Eleftheriou2000a; Chatzigeorgiou et al. Reference Chatzigeorgiou, Reizopoulou, Maidanou, Naletaki, Orneraki, Apostolaki and Arvanitidis2011), indicating that such events did occur in the past (Fig. 5c, facies 4).
4.3. Geochemistry – environmental pollution
Pearson's correlation was employed in order to access the association between the elements analyzed. Based on this analysis we distinguish two different geochemical groups regarding the inter-element strong positive loadings and significant correlations (Table 5):
• The Al2O3, Fe2O3, K2O, Cd, Cr, Cu, Ni, V, Zn group as representative of the clay fraction of the sediments. These elements are closely related to corresponding changes in the concentrations of clays, showing positive loadings with the mud content in the samples analysed, and can thus be considered to represent the aluminosilicate fraction (Koinig et al. Reference Koinig, Shotyk, Lotter, Ohlendorf and Sturm2003). In addition, Cd, Cr, Cu, Ni, V and Zn distribution is considered to be affected by anthropogenic inputs in lakes and lagoons (Bellucci et al. Reference Bellucci, Giuliani, Mugnai, Frignani, Paolucci, Albertazzi and Ruiz Fernandez2010), such as the notably high Ni content in the analysed samples.
• The TOC, Na2O, MgO, MnO, P2O5 and Pb group. TOC represents the organic fraction in the sediment and can be used as an indicator of the organic matter production (Calvert & Pedersen Reference Calvert and Pedersen1993; Meyers & Ishiwatari Reference Meyers and Ishiwatari1993), whilst Na is related to salinity and authigenic input (Parker et al. Reference Parker, Goudie, Stokes, White, Hodson, Manning and Kennet2006). The significant positive correlation between organic matter Mn and Pb indicates that TOC is a good carrier for both elements in the analysed sediments samples.
Table 5 Pearson's correlation coefficients with the significance level of intercorrelation (Sig.= 0.000 indicates p<0.001) for the major and trace elements.
In order to better evaluate the pollution level in the Gialova Lagoon sediments, an attempt was made to compare our data with the data reported for Greek lagoons by other researchers. We also include for comparison data presented for the Navarino Bay surface sediments (Varnavas et. al. Reference Varnavas, Panagos and Laios1987) because they are influenced by the same surrounding environmental conditions. In respect to other data obtained for Greek lagoon sediments, the Gialova mean Cu value (57.51 ppm) is in the same order of magnitude as the value reported by Varnavas et al. (Reference Varnavas, Panagos and Laios1987) for the upper sediments in Navarino Bay (66.00 ppm). By contrast, Christophoridis et al. (Reference Christophoridis, Stamatis and Orfanidis2007) reported an average value of 25.86 ppm for the Cu in the Agiasma Lagoon, station A sediments. The Ni values in our study are about the same as the Ni concentrations reported by Varnavas et al. (Reference Varnavas, Panagos and Laios1987) and Karageorgis (Reference Karageorgis2007). The Christophoridis et al. (Reference Christophoridis, Stamatis and Orfanidis2007) Ni values are about four times lower than the Ni values in our study (Table 6).
Table 6 Mean values of heavy metals concentrations in the Gialova Lagoon as compared to other Greek aquatic systems, Upper Continental Crust (UCC), average Shale's compositions and sediment quality guidelines for metals.

* Calculated concentrations using the appropriate molar ratio
However, the Zn mean concentration in the Gialova Lagoon sediments (98.47 ppm) is well below that of the 352.00 ppm reported for the upper sediments in Navarino Bay (Varnavas et al. Reference Varnavas, Panagos and Laios1987). The relationship of Cu, Ni and Zn with the clay content of the samples in our study is well documented by their positive loadings with Al2O3. This is in agreement with the findings of Varnavas et. al. (Reference Varnavas, Panagos and Laios1987), who reported the same geochemical association for Cu, Ni, Zn and Al2O3 in the Navarino sediments. In addition, the well-above-1 enrichment factors calculated for the Gialova Lagoon samples (Table 6) indicate an additional contribution to the total distribution of Cd, Cr, Cu, Ni, Pb and Zn in the sediments.
Furthermore, the enrichment for Ni can be related to the weathering of the bauxite deposits from the surrounding environment. This finding is consistent with the high Ni/Al ratios reported by Varnavas et. al. (Reference Varnavas, Panagos and Laios1987) for the Navarino sediments. Moreover, the Zn value (49.54 ppm) in the Agiasma Lagoon sediments are about 50 % lower than the zinc concentration for the Gialova Lagoon sediments (Table 6). In addition, the average values reported in our study for Fe2O3, MnO, Zn, Cu, Pb and Ni in the Gialova Lagoon sediments are above those reported by Panagiotaras et. al. (Reference Panagiotaras, Papoulis, Kontopoulos and Avramidis2012) for the Alikes Lagoon sediments (Table 6). This trend is opposite for the elements V and Cr, where the Alikes Lagoon sediments are enriched compared to those of the Gialova Lagoon (Table 6).
Based on concentrations of total organic carbon (TOC) and total extractable heavy metals of the six gravity cores, and using the pollution indices, the Gialova Lagoon seems to be unpolluted with moderate contamination. In all the gravity cores, a down-core increase of the total metals was observed, indicating a recent environmental improvement of the lagoon status. An exception to these general trends is Pb, which indicates a slight enrichment of the surface sediments (Fig. 7), whilst it shows high positive loading with TOC and thus this can be attributed to the urban anthropogenic activities (Christophoridis et al. Reference Christophoridis, Stamatis and Orfanidis2007). Comparing the mean values of heavy metals concentrations of the Gialova Lagoon with sediment quality guidelines for metals (Burton Reference Burton2002), it seems that metal concentrations of Cr, Cu and Ni in the lagoon sediments exceed the threshold effect level (Table 6). According to spatial distribution of heavy metals, it seems that the most unaffected station is G3, which is located in the central part of the lagoon, whilst the peripheral sampling sites are more affected. The concentrations of trace metals in the sediments of the Gialova Lagoon, although higher than other Greek coastal lagoons (Table 6), still suggest that the lagoon appears to be unaffected by human activity. The contamination factors for Cd, Cr, Cu, Pb and Zn presented here are comparable with those reported for the Messolonghi Lagoon (Karageorgis et al. Reference Karageorgis, Sioulas, Krasakopoulou, Anagnostou, Hatiris, Kyriakidou and Vasilopoulos2012), the Rodia, Tsoukalio, Logarou and Tsopeli lagoons (Karageorgis Reference Karageorgis2007), the Aetoliko Lagoon (Dasenakis et al. 1994), the Klisova Lagoon (Papatheodorou et al. Reference Papatheodorou, Hotos, Geraga, Avramidou and Vorinakis2002) and the Koumoundourou Lake (Karageorgis et al. Reference Karageorgis, Katsanevakis and Kaberi2009).
Using the sediment quality guidelines for metals reported by Burton (Reference Burton2002) and MacDonald et al. (Reference MacDonald, Ingersoll and Berger2000), we consider that the most affected surface sediments for Cd are from the G1, G2 and G6 sampling sites. Using the same criterion for Cr, all the sampling sites exceed the threshold effect level (37.3 ppm, Table 6). The same features are obvious for Cu and Ni. By contrast, Zn shows values below the threshold effect level (123 ppm) for all the analysed sediment samples. The G1, G2, G5 and G6 sampling sites show Pb values for the surface sediments that are above the threshold effect level (35 ppm). The G4 sampling site is considered unaffected for Pb, using the sediment quality guidelines for metals reported by Burton (Reference Burton2002) and MacDonald et al. (Reference MacDonald, Ingersoll and Berger2000).
5. Conclusions
During the last 70 years, the Gialova Lagoon has suffered from different human interventions which have influenced the sediment dispersal mechanism, the subfossil assemblages and the environmental status of the lagoon. During the last 20 years, efforts to restore the hydrological regime, and the removal of constructions for drainage of the lagoon, have improved the ecosystem status. The lagoon has the characteristics of a typical shallow coastal Mediterranean lagoon and it is protected by international conventions; therefore it can be considered an important case study concerning how inter-temporal human interventions and restoration efforts are reflected in the depositional environments, palaeoecology and sediment geochemistry. The present study indicates the influence of the hydrologic changes on spatial sediment characteristics. The vertical examination of subfossil taxa in gravity cores shows different depositional environments and environmental facies of a shallow brackish lagoon, dominated by periods of marine influence and fresh water inflow and by hypoxic and dystrophic conditions. Generally, it has been clear that in the past the Gialova Lagoon was partitioned into two zones, one around the inlet (cores G1 and G2), where rather confined brackish lagoonal conditions prevailed with an influence from the shallow marine shelf, and another one at the internal perimeter of the lagoon (cores G4, G5 and G6), where the brackish lagoonal environment was affected by fresh water influx. Nevertheless, the bottom surface sediments present evidence indicating that, recently, conditions in the lagoon have become more homogenous, characterised by shallow shelf and fresh water influence.
Moreover, the vertical distribution of the lagoon's metal concentrations and contamination indices indicates the gradual improvement in the lagoon's environmental conditions. The above spatiotemporal sedimentological, geochemical and palaeoecological data constitute a useful tool and an environmental baseline for the decision makers to develop procedures, according to European Union Directives, to control and limit the environmental risk of the protected and threatened Gialova Lagoon ecosystem.