


Sudden cardiac arrest is one of the leading causes of death among children in the United States of America.Reference Meyer, Stubbs and Fahrenbruch1 CHD and chromosomal abnormalities account for approximately 20% of sudden deaths among neonates and infants (≤1 year old) and for nearly 5% among older children (1–18 years of age).Reference Brooten, Youngblut and Caicedo2 Epidemiologic studies have also indicated that cardiac arrest is associated with lower survival rates in neonates and infants than in children and adolescents, with rates of survival to hospital discharge less than 15% in several studies.Reference Atkins, Everson-Stewart and Sears3–Reference Schindler, Bohn and Cox6 Cases of in-hospital arrest have a three-fold higher chance of survival than out-of-hospital cases (24 versus 8.4%).Reference Meert, Donaldson and Nadkarni7,Reference Tress, Kochanek and Saladino8 The enhanced survival of in-hospital cases demonstrates the importance of timely medical interventions by the in-hospital caregivers. The ability for clinicians to reliably identify patients with increased risk of cardiac arrest could be augmented by supplementing their clinical training, expertise, and experience with continuously generated, validated risk scores for impending cardiac arrest using physiologic monitoring data from bedside monitors. Neonates and infants with cardiac disease are at risk of sudden cardiac arrest, yet models for early identification of impending cardiac arrest in such children have neither been derived nor validated to date.
Several prognostic scores for mortality or severe morbidity in critically ill children have been introduced in recent years (e.g., PRISM-3,Reference Pollack, Patel and Ruttimann9,Reference Pollack, Holubkov and Funai10 PIM-2,Reference Czaja, Scanlon and Kuhn11 C-CHEWS,Reference McLellan, Gauvreau and Connor12,Reference McLellan and Connor13 PICSIMReference Jeffries, Soto-Campos and Katch14), some of which have demonstrated reliability specifically in those with cardiac disease; however, these scores are non-specific for the cause of mortality, and hence a pre-emptive approach for risk-stratified intervention using these scores has not been realised. Furthermore, children with CHD who have undergone cardiothoracic surgery represent unique challenges regarding early warning systems, given a broad spectrum of cardiac structural abnormalities and physiologies. For this reason, the STAT Mortality categorisation has been specifically validated and used in critically ill children with CHD undergoing cardiac surgery,Reference O’brien, Clarke and Jacobs15 but again, is limited in regard to identifying actionable aetiologies for morality risk.
In contrast to platforms like Bedmaster™ and Etiometry® (the latter of which provides, e.g., a validated early-warning tool for shockReference Rogers, Ray and Johnson16), none of the aforementioned prognostic scores for mortality in critically ill children provides real-time analytics using continuously acquired physiologic monitoring data (e.g., minute-to-minute or higher frequency vital sign measures and/or waveforms). Neither Bedmaster™ nor Etiometry® offers a validated early-warning tool for impending cardiac arrest.
Accordingly, the objective of this study was to derive a statistical model using continuous physiological monitoring data for early identification of impending cardiac arrest in neonates and infants with cardiac disease hospitalised in the paediatric cardiovascular ICU.
Materials and methods
Study design, patients, and clinical data collection
We conducted a retrospective cohort study of neonates and infants hospitalised in the paediatric cardiovascular ICU at Johns Hopkins All Children’s Hospital (JHACH, St. Petersburg, FL) between 1 November 2013 and 16 September 2015. The study was approved by the Johns Hopkins All Children’s Hospital Institutional Review Board (IRB), and waiver of informed consent was granted. Physiologic monitoring data, including minute-to-minute sampled vital signs and waveform data, were collected from bedside monitors and stored into a Philips Research Data Export server in an automated manner. Collection of data was followed by patient de-identification with the help of the Philips Research Data Export Toolkit. De-identified physiologic monitoring data were then linked with corresponding de-identified administrative encounter data obtained from the hospital enterprise data warehouse. Finally, the integrated data were locally stored into Microsoft SQL and PostgreSQL database tables on the Integration server. Patient demographic information was collected from electronic health records. Cases of cardiac arrest were identified among the study population via a query of corresponding International Classification of Diseases discharge diagnostic codes performed by the Johns Hopkins All Children’s Hospital Health Informatics core, utilising the institution’s electronic health record-derived enterprise data warehouse. Cardiac arrest cases were validated by expert clinician (J.P.J.) review of electronic health records. J.P.J manually adjudicated all cases of cardiac arrest to confirm that these cases were consistent with the following definition of cardiac arrest used by The Society of Thoracic Surgeons Congenital Heart Surgery Database: “A cardiac arrest is the cessation of effective cardiac mechanical function”.
Physiological monitoring data collection and preprocessing
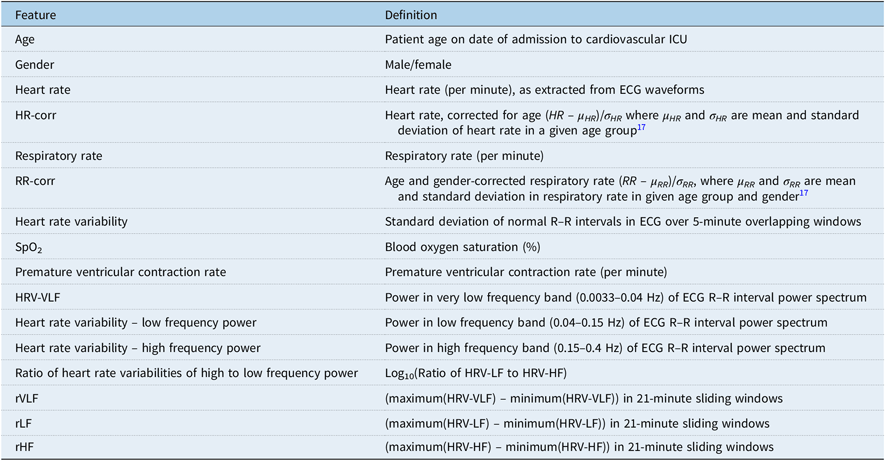
Minute-to-minute physiological monitoring data on heart rate, respiratory rate, blood pressure, and oxygen saturation, as well as waveform data from dual-lead electrocardiograms, were recorded via Philips bedside monitors and transmitted and stored onto a secure server. The most commonly available physiological monitor-derived variables across the entire data set were utilised in the study; these included heart rate, respiratory rate, oxygen saturation (SpO2), and premature ventricular contraction rate per minute. The full list of variables evaluated in the model, including heart rate variability – low frequency power, heart rate variability –high frequency power, ratio of heart rate variabilities of high to low frequency power, etc., and their definitions and calculations are shown in Table 1. Of note, respiratory rate data were corrected for age and gender based on established age- and gender-dependent normative valuesReference Siberry and Iannone17 (RR-corr). Heart rate was normalised with respect to ageReference Siberry and Iannone17 (HR-corr). All numeric data were checked for missing values. Only four patients with cardiac arrest and four control patients had more than 20 minutes of missing data from the training and test data. Missing values of physiological variables were replaced using nearest neighbour interpolation for all patients in the training and test data. To ensure that interpolation did not contribute bias to study results, sensitivity analyses examined models with listwise deletion as well as interpolation for missing data less than 10 minutes. This sensitivity analysis included comparison of sensitivity, specificity, and accuracy with respect to two other models which included listwise deletion of all missing data and interpolation of missing data less than 10 minutes. Outliers were identified in minute-to-minute heart rate as measurements that exceeded three standard deviations from the mean computed over a centred 30-minute window. Runs of consecutive outlier data points rarely lasted more than 3 minutes. We substituted outlier values by linear interpolation for all occurrences less than 3 minutes. Sustained occurrences of data exceeding the three standard deviations threshold were not considered outliers and left unchanged. All preprocessing steps involving outlier removal, feature vector computation, statistical modelling, and analysis were performed using MATLAB R2016a.18
Table 1. List of all model features and their definition.
Waveform data (i.e., high-frequency data acquired at 125 Hz) from two-lead electrocardiograms (ECG) were also available for use in the study. R waves were annotated in the waveform of the electrocardiogram using a modified version of an algorithm based on morphological digital filtering – the highest scoring heart beat detection algorithm by Pangerc and colleaguesReference Pangerc and Jager19 of the 2014 Physionet challenge.Reference Pangerc and Jager19,Reference Moody, Moody and Silva20 In order to perform robust estimation of heart rate and heart rate variability, the algorithm was modified to detect and eliminate pacer spikes and to localise peaks of the R wave from either one or two electrocardiogram (ECG) leads (details in Appendix A). ECG R–R intervals were calculated from the lead signals, and the power spectral density of the ECG R–R intervals was then computed in different frequency bands to generate frequency-domain heart rate variability measures.
Statistical risk model
A generalized linear modelReference Blough, Madden and Hornbrook21–Reference McCullagh24 for a Bernoulli distribution was used to estimate the probability of cardiac arrest at each time point. Assumptions and formulae underlying the generalized linear model are provided in Appendix B. Our data set consisted of 22 cardiac arrest and 206 control patients who were less than 1 year old and, therefore, the pre-test probability of cardiac arrest in our data set was 9.6%. Lack of sufficient data recorded prior to a cardiac arrest event led to exclusion of 6 of the 22 cardiac arrest patients below 1 year old. The model was trained and evaluated on 16 cardiac arrest cases and 48 gender- and age-matched controls (1:3), with 11 cardiac arrest cases and 33 controls in the training set and 5 cardiac arrest cases and 15 controls in the test set. In order to estimate the standard error and confidence intervals for the estimated model, we bootstrapped (60 iterations) across a random selection of patients from both groups. An equal number of time points were used from each patient in the training and test sets for performance analysis. Initial analysis was performed on a 1:1 case to control ratio of age and gender-matched patients; but, due to an imbalance in the available amount of cardiac arrest versus non-cardiac arrest patients and to reduce the false positive detection rate, our final analysis was performed on 1:3 case to controls ratio (16 cardiac arrest and 48 non-cardiac arrest patients), yielding a significant improvement in specificity and overall accuracy.
Model features were evaluated from physiological measurements or other derived terms as described and defined in Table 1. The magnitude of each model weight was used to indicate the relative impact of that feature on the risk score. A particular feature is correlated to increased risk of cardiac arrest if the sign of its model weight is positive. Training performance was tested for window sizes varying from 1 to 7 hours prior to a cardiac arrest event (Fig 1). In the training set, we selected the time window that had highest classification accuracy as the optimal training window length. Since the model must learn to distinguish between the two types of patients during the training stage, the training time points for cardiac arrest patients during periods of low risk made it harder to distinguish them from non-cardiac arrest patients. As expected, Figure 1 shows that the training accuracy decreased monotonically with increasing length of training time window. In order to overcome model over-fitting errors posed by a 1-hour training window, our optimal training window was chosen to be 2 hours. Receiver operating characteristics (ROC) curves were plotted for each iteration on the training set, and the corresponding optimal threshold value of risk score was obtained as the point on the receiver operating characteristics curve closest to the point where false positive rate is zero and the true positive rate is one.Reference Gallop, Crits-Christoph and Muenz25–Reference Greiner, Pfeiffer and Smith27

Figure 1. Area under the receiver operating characteristics curve for training data sets using training time window durations between 1 and 7 hours. Coloured boxes represent 25th to 75th percentiles, the solid line inside each box is median, dashed whiskers represent the minimum and maximum excluding the red “+” outliers.
The optimal threshold obtained from each iteration on the training set was used to analyse the results on the corresponding test set. Specifically, one model trained in each bootstrap iteration was used to estimate the time-varying probability of cardiac arrest for each iteration; and then, the optimal threshold obtained from the receiver operating characteristics curve was used to evaluate the performance in each iteration. Figure B1 in Appendix B provides an example of time-varying risk score in which the patient transitions to a state of high risk of cardiac arrest when the risk score exceeds the optimal threshold. The performance of these bootstrapped models was evaluated by comparing various statistical performance metrics: sensitivity, specificity, accuracy, likelihood ratios, and change from pre-test to post-test probability of arrest derived from the confusion matrixReference Fawcett26,Reference Greiner, Pfeiffer and Smith27 for both training and test data sets (definitions in Appendix C). Finally, the probability of cardiac arrest was computed across all patient data in the test set for every bootstrap iteration over 2-hour contiguous time windows. Additionally, risk scores were then computed on the remaining non-cardiac arrest patients who were not included in either training or test sets, in order to ensure overall performance on the entire data set.
Results
All models studied in the sensitivity analysis to study robustness of the model to interpolation of missing data demonstrated results with similar levels of sensitivity, specificity, and accuracy. These additional models demonstrate assurance that interpolation methods employed herein were appropriate and did not have a significant impact on the model parameters (Table 2).
Table 2. Sensitivity analysis of model with respect to missing data interpolation.

Figure 1 demonstrates that the classification accuracy of the training sets decreased with increasing training time window length. Model features identified with the highest weights and consistently low p-values (<0.05) with regard to associated cardiac arrest are shown in Figure 2. These model features were comprised of heart rate, HR-corr, respiratory rate, RR-corr, SpO2, premature ventricular contraction rate, age, gender, heart rate variability – low frequency power, heart rate variability – high frequency power, ratio of heart rate variabilities of high to low frequency power, and rLF. The feature with greatest weight in the model (i.e., strongest association with risk of arrest) was heart rate variability – low frequency power, with reduced heart rate variability indicating increasing risk.

Figure 2. (a) Estimated normalised risk model feature weights (b) p-value of the estimated model weights corresponding to each of the model features and “Constant” term. Solid boxes represent the 25th to 75th percentiles, and the lines extending from these boxes represent minimum and maximum excluding the red “o” outliers. Dotted black line in (b) indicates 0.05 significance level.
With regard to model performance, Figure 3 shows the receiver operating characteristics curves for the training and test data sets. Area under the ROC curve (AUC) (C-index) was 0.91 in the training set and 0.75 in the test set. In the test set, sensitivity, specificity, and overall classification accuracy were 60.6, 74.1, and 70.8%, respectively. The entire data set (excluding patients with less than 2 hours of available data) included a larger number of non-cardiac arrest patients, as all of the cardiac arrest patients were already included in training or test sets. Evaluation of our method’s performance on the entire data set resulted in an overall specificity of 80.2% and accuracy of 75.4%, with no change in sensitivity. In addition, mean positive and negative likelihood ratios were 2.6 and 0.53. Given this mean positive likelihood ratio, and a pre-test probability (overall prevalence in the original cohort) of cardiac arrest of 9.6%, the mean post-test probability of cardiac arrest using the model is 21.2%. Furthermore, given the aforementioned mean negative likelihood ratio and pre-test probability of 90.4% of no cardiac arrest, the post-test probability of remaining arrest-free using the model is 94.7%.

Figure 3. Mean and 95% confidence intervals of receiver operating characteristics curves for training and test set.
The average time from observed high risk scores above threshold to a recorded event of cardiac arrest was 17 hours with standard deviation of 7.5 hours across all the 16 cardiac arrest patients. Figure 4 shows the time-evolving risk scores over a 24-hour period prior to time of reported cardiac arrest for two patients who experienced cardiac arrest. The red lines in these plots represent the respective threshold for detecting transition to high risk of cardiac arrest.

Figure 4. Time-evolving risk scores on a 24-hour period before reported cardiac arrest for two cardiac arrest (CA) patients: (a) CA-sub1 (b) CA-sub2. Red lines in the above plots represent the respective threshold for detecting transition to high risk of cardiac arrest.
Discussion
The model reported here demonstrates the ability to predict whether a neonate or infant with CHD hospitalised in the paediatric cardiovascular ICU has transitioned to a state of high risk for impending cardiac arrest using minute by minute physiological time series data. Our derived model achieved a mean sensitivity of 60.6%, specificity of 80.2%, and accuracy of 75.4% on the entire data set comprising all patients with at least 2 hours of available data. The likelihood ratio was 2.6 for a positive test and the positive post-test probability was 21.2%, while the prevalence of cardiac arrest among patients < 1 year old admitted to the paediatric cardiovascular ICU is 9.6% in our data set.
We observed that the amount of time that a patient is in a high-risk state can vary widely across patients (compare Fig 4a and b). Figure 4a shows an example of a cardiac arrest patient whose risk score was elevated almost 20 hours prior to the time of cardiac arrest, whereas the cardiac arrest patient in Figure 4b entered high-risk state only approximately 5 hours prior to arrest. Meanwhile, a few cardiac arrest patients did not exhibit a monotonically increasing risk score with time, and risk scores for these patients sometimes exhibited a brief period of reduced risk, with risk then increasing before the event. Understanding the nature of and factors associated with patient-specific periods of inflection in risk score is a priority for future prospective work.
Several significant features identified in our model as markers of high risk of impending cardiac arrest (Fig 2) have also been identified in previous studies. Higher values of age and gender normalised respiratory rate and lower values of SpO2 have been shown to be important markers of critical illness and mortality from sudden cardiac arrest in previous studies.Reference Hodgetts, Kenward and Vlachonikolis28,Reference Fieselmann, Hendryx and Helms29 These findings agree with our data documenting that the median normalised weights for the features RESP-corr and SpO2 are 12.5 and −13.4, respectively (Fig 2). Time domain heart rate variability measures derived from standard deviation of normal electrocardiogram R–R intervals have been observed to have a negative correlation with probability of poor outcome from cardiac arrest.Reference Ghuran, Reid and La Rovere30–Reference Singer, Martin and Magid36 While this finding is also evident in our analysis, time domain heart rate variability was found to have less predictive power than frequency domain heart rate variability features. Our model identifies higher values of heart rate variability – high frequency power, ratio of heart rate variabilities of high to low frequency power, and lower values of heart rate variability – low frequency power as the most discriminative factors for identifying increased risk of cardiac arrest, and similar observations were drawn for the low frequency and high frequency power-based heart rate variability by several prior investigations.Reference Galinier, Pathak and Fourcade37,Reference Lahiri, Kannankeril and Goldberger38
In this study, we have not made any direct comparisons within our data set to existing early warning score models such as Paediatric Early Warning Score, Modified early Warning Score, or Paediatric Risk of Mortality Score (PRISM-3) because the objective of these early warning score methods is to predict mortality or general adverse events in children as opposed to providing early identification of impending cardiac arrest in neonates and infants with CHD in the paediatric cardiovascular ICU.
Our results in this study are supported by prior findings by Kennedy and colleagues,Reference Kennedy, Aoki and Mariscalco39,Reference Kennedy and Turley40 who derived a predictive model of cardiac arrest in the paediatric ICU, including children of all ages and not focused on those with underlying cardiac disease. In that work, linear regression and decision trees attained an accuracy of 69% and 88%, respectively, for cardiac arrest in pediatric ICU patients; this accuracy is comparable to our model’s overall accuracy of 75.4% for impending cardiac arrest among neonates and infants with cardiac disease hospitalised in the pediatric cardiovascular ICU. A direct comparison of the model proposed by Kennedy and colleagues cannot be performed on our data set, however, as it requires physiological features which are not present in our data set. Future prospective work should include collection of all relevant physiologic data by which to compare our risk score for impending cardiac arrest with other scores like CCHEWSReference McLellan and Connor13 and PICSIMReference Jeffries, Soto-Campos and Katch14 that are designed to predict a more broadly defined set of adverse events in pediatric cardiovascular ICUs. These prospective validation studies should also seek to enhance the model’s performance characteristics, if possible, via the addition of informative clinical and/or laboratory variables.
Given the desire to further enhance accuracy of the model, an iterative process of model optimisation should first be undertaken as part of the prospective validation phase. If validated in multicentre prospective studies, the optimised model of impending cardiac arrest in infants with CHD should then be applied in clinical trials designed to test net clinical benefit, using real-time bedside monitoring devices which would provide instantaneous, minute-to-minute risk scores and risk-threshold-based alarms in the pediatric cardiovascular ICU. Such efforts should include the development of a real-time visual analytics tool based on the prospectively validated model, constructed with the aid of streaming middleware architecture capable of handling data-intensive applications. For example, this solution would employ a messaging system (e.g., Apache Kafka), a stream processing engine (e.g., Apache Spark) capable of fast computation of features and respective risk scores, and a real-time web-based application (e.g., Socket.IO) suitable for bi-directional communication between client(s) and server(s), by which to push the risk score from the stream engine to an informative user interface.
Limitations
There are several limitations to this work. It is possible, for example, that the reliability of the features used in our model could be susceptible to some inaccuracies in physiologic measurements captured by the bedside monitors. As noted above, our model is also restricted to a specific set of physiological features and, for example, does not account for therapeutic interventions that may have occurred; a future prospective study design will facilitate reliable capture and analysis of such treatment-related data. Furthermore, the age- and gender-specific normative values employed in our study for heart rate and respiratory rate were based upon the 15th edition of the Harriet Lane Handbook; future studies involving larger sample sizes should include sensitivity analyses across various different sources of evidence-based normative values for these physiological variables in infants. In addition, the number of cardiac arrest cases limited the power of the study, although this was partially overcome via the use of a 1:3 case:control ratio; nevertheless, a larger sample size should be sought for the prospective validation study. Apart from its retrospective and single-institutional design, perhaps the most important limitation of our study is its generalisability (i.e., external validity); our model was specifically derived in (and therefore is appropriately applicable to) infants with cardiac disease hospitalised in the paediatric cardiovascular ICU. Additionally, since our model is based on a very specific patient cohort, using the same set of model weights will likely not yield the best prediction on a different set of patients, and hence a future prospective multi-institutional study could help generalise the model over a more diverse patient population. Nevertheless, the methods described here are well-suited toward investigation and derivation of time-dependent risk models and early warning systems in other patient populations.
Conclusion
The ability to use real-time analytics and streaming physiologic data from bedside monitors to predict adverse events can lead to strategies of personalised precision medicine and improvements in the delivery of critical care. In this study, we used physiologic monitoring data in neonates and infants admitted to the cardiovascular ICU to derive a predictive model of impending cardiac arrest that has favourable performance characteristics. Our current results demonstrate that statistical methods can be used to develop models that can help identify impending cardiac arrest 17 hours (on average) before the actual clinical event and clinical recognition among neonates and infants hospitalised in a cardiovascular ICU. Challenges may be expected in translating retrospective cardiac arrest decision support models into useful clinical tools. Therefore, further research that includes the performance of a clinical trial and model validation using an independent multi-institutional prospective cohort would be necessary to help measure the clinical utility of statistical models for early recognition of cardiac arrest in neonates and infants.
Acknowledgements
The authors thank Eric Helfenbein of Philips Healthcare for his assistance in setting up Philips RDE at Johns Hopkins All Children’s Hospital for data acquisition and storage.
Financial Support
Funding for this work was provided by an Institutional Research Grant to Drs Jacobs, Stock, and Goldenberg from the Johns Hopkins All Children’s Foundation.
Conflicts of Interest
None.
Appendix A: Heart rate extraction
ECG waveform data captured at 125 Hz was used to detect R waves in ECG, and the subsequent R–R intervals were used for computing instantaneous heart rate, time domain heart rate variability, and frequency domain heart rate variability measures. The R wave detection was performed using an adapted version of the 2014 Physionet challenge highest scoring algorithm by Pangerc et al.Reference Pangerc and Jager19 The 2014 Physionet challengeReference Moody, Moody and Silva20 was primarily geared towards robust multimodal heart beat detection but did not account for removal of pacer spikes. Pacer spikes often appear like R-wave spikes in the ECG before the ventricles depolarise. These pacer spikes manifest in different forms based on the particular mode of cardiac pacing. We modified the method proposed by Pangerc et al to remove erroneously detected R waves, which are actually pacer spikes.
In the presence of pacer spikes, the histogram of inter-beat intervals is expected to show more than one peak in their distribution accounting for pacer spikes. If the pacer spikes are roughly equidistant from the R waves, the inter-beat interval histogram is more likely to be clearly bimodal with two peaks of similar magnitudes and therefore, peaks corresponding to the smaller inter-beat interval are marked as pacer spikes. In the absence of two distinct peaks in the inter-beat interval histogram, histogram of the amplitudes of detected peaks is computed. If the amplitude histogram is bimodal and the histogram peaks are of similar magnitudes, the peaks with larger amplitude are marked as pacer spikes. Figure A1 presents a flow chart of the pipeline for extraction of instantaneous heart rate from single channel ECG.

Figure A1. Flow chart for instantaneous heart rate detection from ECG waveform. Here, diff() is absolute difference between consecutive elements of an array.
Appendix B: Generalized linear model
Generalized linear modelReference McCullagh and Nelder41,Reference Nelder and Baker42 is a generalized version of multivariate regression that models a dependent variable as a random variable with mean as a function of linear combination of the predictor variables and with some random error, where the dependent variable can assume any distribution from the exponential family.
Our algorithm assumes the outcome of whether a patient undergoes cardiac arrest or not as a Bernoulli random variable at each time point, denoted by y(t) = 1 when a certain patient is known to have a cardiac arrest at any time after t. Furthermore, the formula X = [x (1) x (2) … x (n )]T was used to describe a matrix of size n × m containing a set of feature vectors at discrete time points 1, 2, …, n, where the feature vector at time t is denoted as x (t ) = [x 1(t) x 2(t) … x m(t)] consisting of m features that determine the state of the patient at time t. The set of linear weights ŵ = [w 1w 2 … w m]T (see equation B.1) for each time t were constructed by maximising the log-likelihood of observing each y(t) for t = t 1 t 2, …, t n given
 $p\left( t \right) = {1 \over {1 + {e^{ - x\left( t \right)w}}}}$
using an iterative least squares method.Reference McCullagh and Nelder43
$p\left( t \right) = {1 \over {1 + {e^{ - x\left( t \right)w}}}}$
using an iterative least squares method.Reference McCullagh and Nelder43
 $$\eqalign{ & \hat w = \arg \mathop {\max }\limits_w \log \{ Pr(y({t_1}),y({t_2}), \ldots ,y({t_n})|p({t_i};X,w)\} \cr & = {1 \over {1 + {e^{ - x({t_i})w}}}},i = 1,2, \ldots ,n)\} \cr} $$
 $$\displaylines{ \hat w = \arg {\max _w}\sum\nolimits_{i = 1}^n {(y({t_i})\log (p({t_i};X,w))} \cr + (1 - y({t_i}))\log (1 - ({t_i};X,w))) \cr} $$
(B.1)
$$\displaylines{ \hat w = \arg {\max _w}\sum\nolimits_{i = 1}^n {(y({t_i})\log (p({t_i};X,w))} \cr + (1 - y({t_i}))\log (1 - ({t_i};X,w))) \cr} $$
(B.1)
Patients with cardiac arrest are expected to show high risk scores prior to an event of cardiac arrest. An illustration of the time-varying risk scores is shown in Figure B1.

Figure B1. Example of time-varying risk scores in a patient transitioning to high risk of cardiac arrest.
Appendix C: Performance metrics
The performance metrics used in our analysis are sensitivity, specificity, accuracy, likelihood ratio, pre-test and post-test probability of positive and negative tests. The confusion matrix shows the distribution of data points classified correctly or incorrectly for both the positive and negative classes in a binary classification test (see Fig C1). Sensitivity is the same as true positive rate and (1-specificity) is also called false positive rate. A plot of the false positive rate versus true positive rate for different values of threshold is defined as the receiver operating characteristics curve.Reference Fawcett26 The area under receiver operating characteristics curve, known as AUC is frequently used as a vital metric of classification accuracy. Likelihood ratioReference Deeks and Altman44 for positive test is defined as the ratio of sensitivity to (1 − specificity). Positive post-test oddsReference Akobeng45 are calculated by multiplying positive likelihood ratio and the ratio of pre-test probability to (1 − pre-test probability). Positive post-test probabilityReference Akobeng45 is the ratio of positive post-test odds to (1 + positive post-test odds). Post-test probability for the positive test as compared to prevalence of the disease/predicted condition in a population shows a quantitative measure of the probability of correctly detecting a particular condition using the proposed test.

Figure C1. Confusion matrix for the proposed method where the positive class (label = 1) represents time from cardiac arrest patients and negative class comprises of time points from non-cardiac arrest patients.


