


The Caledonides of Britain and Ireland have inspired numerous studies, many of fundamental importance, seeking to understand orogenic processes. Central to this aim is providing a robust geochronological framework to test prospective tectonothermal models. There is a large geochronological database for the Grampian Event of the Caledonian Orogeny (referred to as the Grampian Event from now) based on the ages of metamorphic minerals (in situ and detrital) and syn- and post-orogenic intrusions (Friedrich et al. Reference Duretz, Gerva and May1999; Oliver Reference Morgan, Mark, Imlach, Barfod and Dymock2001; Baxter et al. Reference Baxter, Ague and Depaulo2002; Dewey Reference Dewey, Mange, Macniocaill and Ryan2005; Oliver et al. Reference Noble, Condon, Carney, Wilby, Pharaoh and Ford2008; Viete et al. Reference Spray and Dunning2013). Despite this considerable geochronological framework, which is accompanied by detailed field, geochemical and isotopic studies that have spawned a plethora of plate tectonic models, the causes of the rapid, synchronous, Grampian orogenic peak remain enigmatic (Ague & Baxter Reference Ague and Baxter2007; Chew & Strachan Reference Chew, Daly, Magna, Page, Kirkland, Whitehouse and Lam2013). Here, we present a multi-chronometer study of an Ordovician sub-volcanic intrusion at Souter Head near Aberdeen, which is emplaced within the high-grade Barrovian core of the Grampian Orogen. The Souter Head sub-volcanic complex (SHSC) was emplaced immediately following main-stage deformation and provides a unique opportunity to test cause-and-effect processes/relationships at the termination of the Grampian Event.
The multi-chronometer (argon/argon (40Ar/39Ar), uranium-238–lead-206 (238U–206Pb), rhenium–osmium (Re–Os)) approach facilitates the construction of a detailed temporal framework for the SHSC. The data yield insights into structural changes associated with the termination of the Grampian Event and through comparison with numerical simulations and modern-day subduction zones, highlight that shallow slab break-off (50–100 km) explains the synchroneity of events occurring across the subduction zone in Ireland and Scotland.
1. Geological background
Neoproterozoic–Cambrian Dalradian sediments were deposited on the passive margin of the Laurentian continent and deformed and metamorphosed during the Grampian Event following a continent-arc collision (Chew & Strachan Reference Chew, Daly, Magna, Page, Kirkland, Whitehouse and Lam2013 and references therein). In the following, we summarise the sequences of events in terms of the onset of orogenesis, the timing of deformation and the termination of the event.
1.1. Onset of the Grampian Event
The rocks of the Grampian Terrane are continuous between NE Scotland and Connemara, western Ireland (Fig. 1), and are likely the telescoped end-result of contraction of a passive margin. A maximum age for the start of the Grampian Event was suggested using the age (ca.478 Ma) of the youngest deformed Dalradian sedimentary rocks (assuming the Dalradian extends into the Ordovician; Tanner Reference Soper, Ryan and Dewey2014 and references therein). A minimum pre-early Silurian age is demonstrated in Connemara, where Upper Llandovery strata rest unconformably on Dalradian sediments (McKerrow & Campbell Reference Mark, Renne, Dymock, Smith, Simon, Morgan, Staff and Ellis1960; Soper et al. Reference Spray and Dunning1999). The ca.478 Ma age of Tanner (Reference Soper, Ryan and Dewey2014) may well be correct but this constraint does not preclude deformation having been initiated further outboard in the subduction zone significantly earlier.
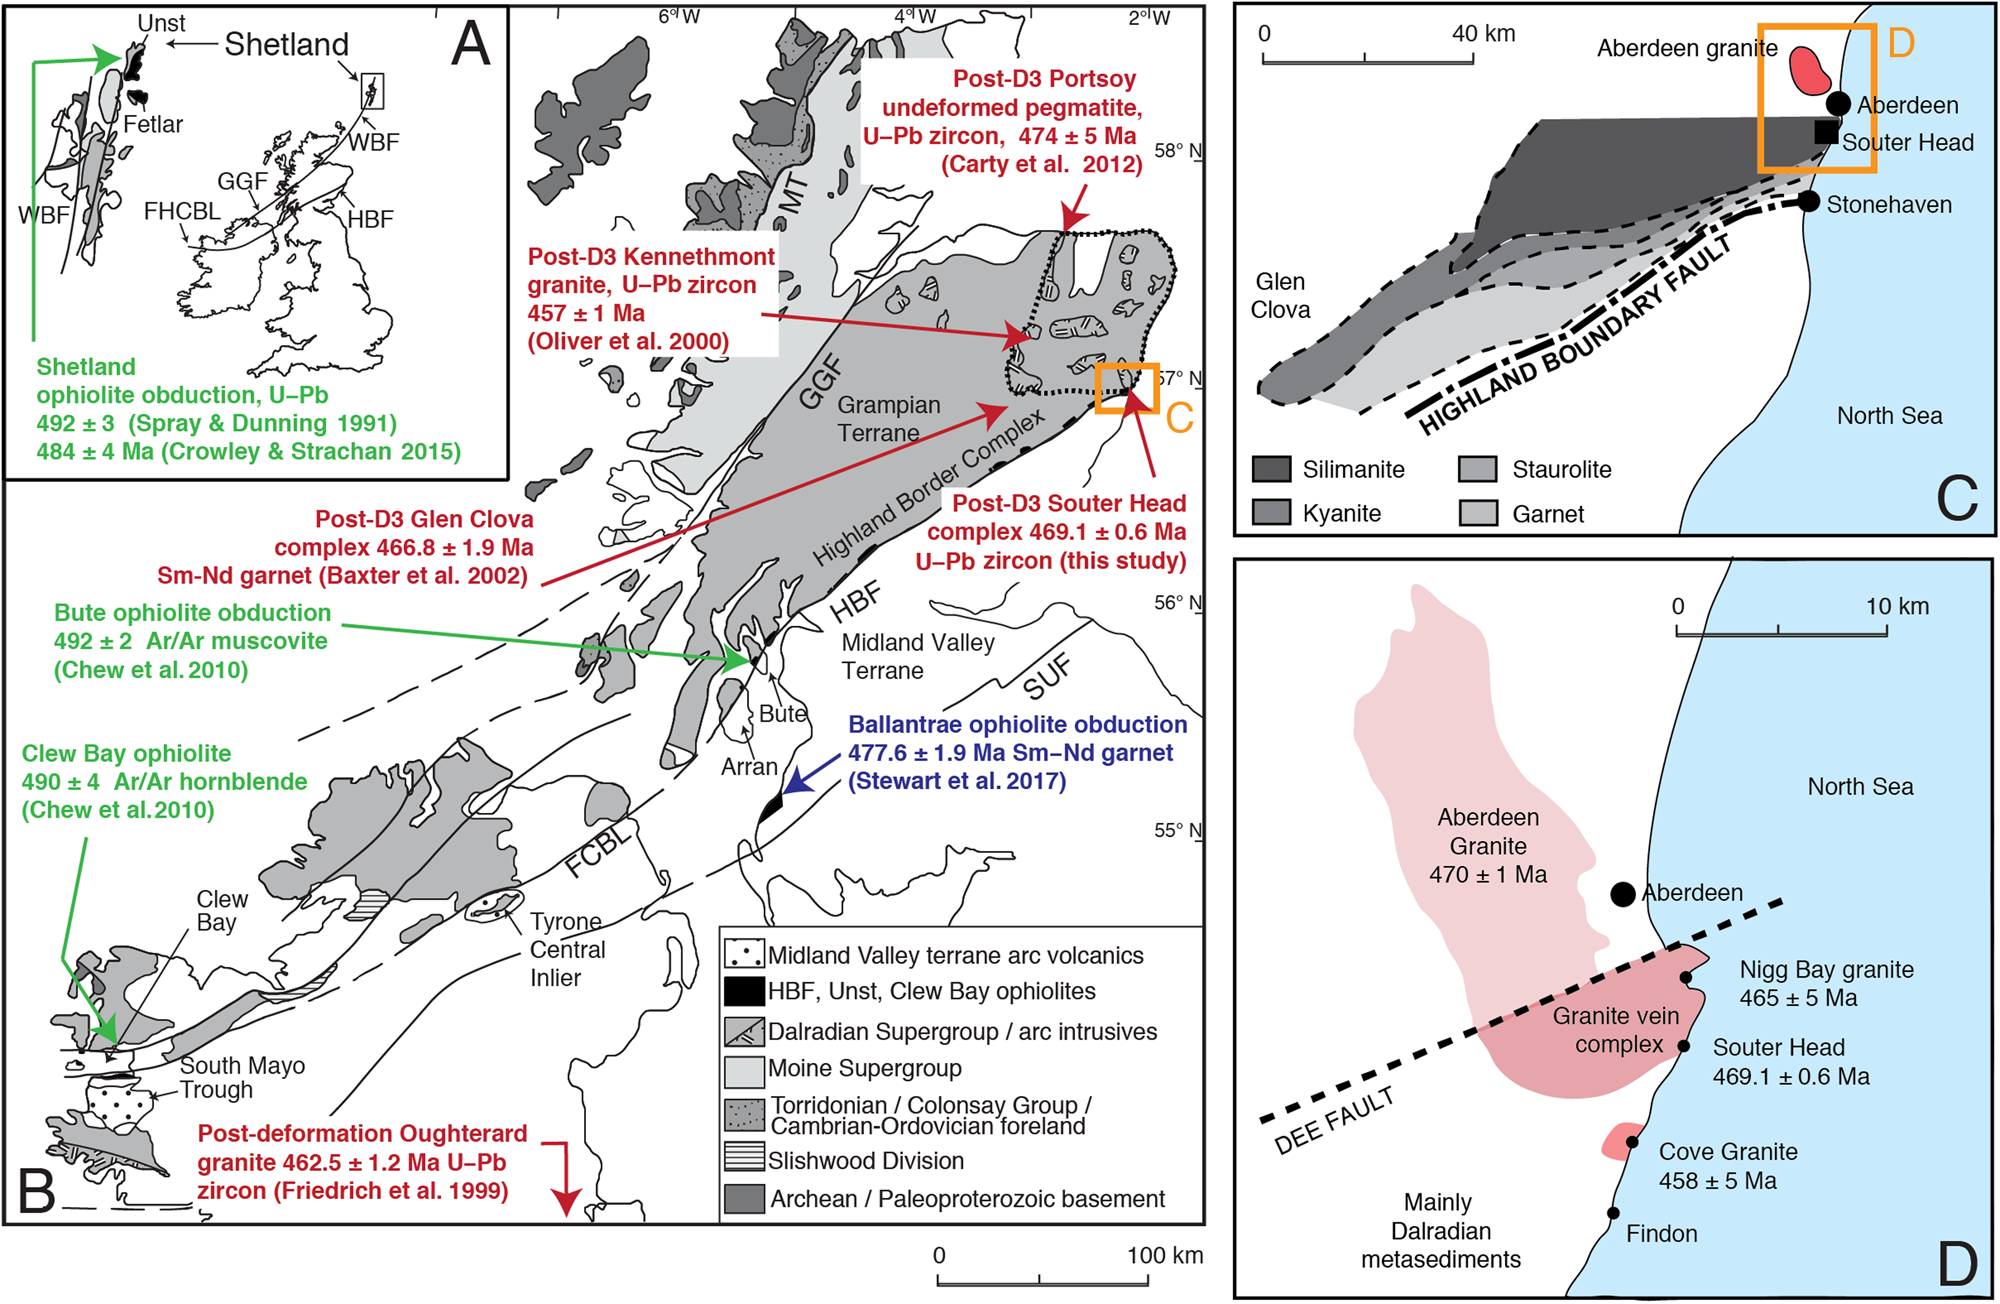
Figure 1 (A) Map of the UK showing constraints from ophiolite obduction on Shetland for the onset of Grampian orogenesis: 492 ± 3 and 484 ± 4 Ma (Spray & Dunning Reference Spray and Dunning1991; Crowley & Strachan Reference Creaser, Papanastassiou and Wasserburg2015, respectively). (B) Figure showing the timing of onset (green) and termination (red) of Grampian orogenesis in Scotland and Ireland: Unst ophiolite obduction, 492 ± 3 Ma (Spray & Dunning Reference Spray and Dunning1991) and 484 ± 4 Ma (Crowley & Strachan Reference Creaser, Papanastassiou and Wasserburg2015); Clew Bay ophiolite obduction 490 ± 4 Ma (Chew et al. Reference Chen, Bina and Okal2010); Bute ophiolite obduction, 492 ± 2 (Chew et al. Reference Chen, Bina and Okal2010). The blue box shows Ballantrae ophiolite obduction 477.6 ± 1.9 Ma (Stewart et al. Reference Seedorff, Dilles, Proffett, Einaudi, Zurche, Stavast, Johnson and Barton2017); however, this event may not be related to the Grampian Event (see discussion). Figure modified from Chew et al. Reference Chen, Bina and Okal2010. (C) Location of Souter Head in relation to the Barrovian metamorphic zones (modified from fig. 1 of Baxter et al. Reference Baxter, Ague and Depaulo2002) and the Aberdeen Granite. (D) The location and ages of granites located close to Aberdeen.
Ophiolites (dismembered and ophiolites sensu stricto), located at Unst, Bute, Tyrone and Clew Bay (Spray & Dunning Reference Spray and Dunning1991; Chew et al. Reference Chen, Bina and Okal2010; Crowley & Strachan Reference Creaser, Papanastassiou and Wasserburg2015) (Fig. 1a, b) are slices of oceanic-type lithosphere that formed in supra-subduction zone arc-forearc environments prior to orogenesis, and were subsequently obducted onto a colliding passive margin. As such, they record the initial stages in the closure of the Iapetus Ocean (e.g., Chew et al. Reference Chen, Bina and Okal2010), and the determination of accurate (cooling)-ages for these ophiolites would provide additional constraints on the timing of onset of deformation. In comparison to Tanner (Reference Soper, Ryan and Dewey2014), these ages should pre-date ca.478 Ma. Ages obtained from the metamorphic soles of these ophiolites suggest that obduction was initiated at 490 ± 4 (Clew Bay; Chew et al. Reference Chen, Bina and Okal2010), 492 ± 1 Ma (Bute; Chew et al. Reference Chen, Bina and Okal2010), 484 ± 4 Ma (Unst; Crowley & Strachan Reference Creaser, Papanastassiou and Wasserburg2015) and 492 ± 3 Ma (Unst; Spray & Dunning Reference Spray and Dunning1991). There is also an age constraint (477.6 ± 1.9 Ma, samarium–neodymium (Sm–Nd) garnet) for the ophiolite at Ballantrae (Stewart et al. Reference Seedorff, Dilles, Proffett, Einaudi, Zurche, Stavast, Johnson and Barton2017). However, this site (Fig. 1b), which is located on the opposite side of the Midland Valley Arc to the other ophiolite complexes, potentially relates to a different and younger phase of the collision event and, thus, the data are not considered further. Recently, Johnson et al. (Reference Ickert, Mundil, Magee and Mulcahy2017) proposed the existence of an island arc that may be temporally associated with ophiolite obduction. However, the large age uncertainties reported by Johnson et al. (Reference Ickert, Mundil, Magee and Mulcahy2017) (±8–9 Ma) and scatter in the data mean the relationship, if any, of this island arc to the onset of the Grampian Event is unclear.
Although, locally, the onset of the Grampian Event (and any orogenic collision) was likely to have been diachronous, large age uncertainties (e.g., in excess of 2 Ma) mean that we currently lack the temporal resolution to dissect the evolution of the orogenesis. Therefore, the best age for the onset of the Grampian Event is calculated by taking the weighted average of the ophiolite age constraints (Clew Bay, Bute, Unst) and accounting for the scatter in the data by reporting the age with an uncertainty that is multiplied by the square-root of the mean square weighted deviates (MSWD, or reduced chi-squared). This approach suggests that Grampian Event deformation commenced at 491 ± 2 Ma.
1.2. Grampian deformation and magmatism
Four phases of deformation are commonly recognised in NE Scotland (D1 to D4), of which the first three include the main compressional and nappe-building phases (Chew & Strachan Reference Chew, Daly, Magna, Page, Kirkland, Whitehouse and Lam2013). Multiple phases of deformation are found in the various Dalradian inliers in Ireland but these cannot be correlated accurately with NE Scotland. Barrovian-style metamorphism is found throughout this sector. Buchan-style metamorphism is restricted to the Buchan block in NE Scotland and southern Connemara, in conjunction with syn- and post-orogenic intrusions (granites and voluminous basic intrusions) (Chew & Strachan Reference Chew, Daly, Magna, Page, Kirkland, Whitehouse and Lam2013). Amongst these intrusions are foliated gabbros and granites (e.g., Insch and Strichen), which attest to emplacement pre- or syn-deformation. The intrusions yield similar U–Pb and Ar/Ar radioisotopic ages for peak regional metamorphism and deformation at ca.475–470 Ma (Kneller & Aftalion Reference Kneller, Trewin, Kneller and Gillen1987; Friedrich et al. Reference Duretz, Gerva and May1999; Dempster et al. Reference Crowley and Strachan2002; Oliver et al. Reference Noble, Condon, Carney, Wilby, Pharaoh and Ford2008). High-grade pelites also yield Ar/Ar and U–Pb ages for peak metamorphism in this range (Viete et al. Reference Spray and Dunning2013; Vorhies et al. Reference Suzuki2013).
In the Glen Clova area of Scotland (Fig. 1c), younger radioisotopic (e.g., Sm–Nd garnet) ages suggest continued metamorphism and deformation to 464.8 ± 2.7 Ma (2-sigma, analytical precision) (Baxter et al. Reference Baxter, Ague and Depaulo2002; Viete et al. Reference Spray and Dunning2013; Vorhies et al. Reference Suzuki2013). However, this datum (Baxter et al. Reference Baxter, Ague and Depaulo2002) is the rim age of one garnet derived from the weighted subtraction of an ‘inferred’ garnet core age from a measured bulk garnet age. This model date likely reflects mixing and requires an unlikely assumption of constant Nd concentration across the duration of garnet growth (ca.8 Ma) and, as such, we do not consider this age constraint further. Baxter et al. (Reference Baxter, Ague and Depaulo2002) reported a bulk garnet age of 466.8 ± 1.9 Ma (2-sigma, analytical precision). This age with associated decay-constant uncertainty incorporated to allow for inter-chronometer comparison is 466.8 ± 3.2 Ma, and we contend this is the most accurate minimum age constraint for syn- to slightly post-D3 deformation at Glen Clova (based on the textural analyses of McLellan Reference Mckenzie and Bickle1985, Reference Mckerrow and Campbell1989).
1.3. Termination of the Grampian Orogeny
The ages of unfoliated intrusions (post-deformation) currently provide the best constraints for the termination of orogenesis, including the Oughterard granite in western Ireland (463 ± 3 Ma; Friedrich et al. Reference Duretz, Gerva and May1999), the Kennethmont granite in NE Scotland (457 ± 1 Ma; Oliver et al. Reference Munro2000) and an undeformed quartzo-feldspathic pegmatite (474 ± 5 Ma) at Portsoy, also in NE Scotland (Carty et al. Reference Cahill and Isacks2012) (Fig. 1b). The non-foliated Cove granite (458 ± 5 Ma) and the Nigg Bay granite (465 ± 5 Ma) are also located in NE Scotland (Appleby et al. Reference Appleby, Gillespie, Graham, Hinton, Oliver and Kelly2010).
2. The SHSC
The SHSC is emplaced in metasedimentary rocks of the Dalradian Aberdeen Formation (Southern Highland Group) on the coast between Aberdeen and Findon (Fig. 1b, d), 10 km S of the foliated Aberdeen Granite (470 ± 2 Ma; Kneller & Aftalion Reference Kneller, Trewin, Kneller and Gillen1987). The formation is well exposed along this stretch of coastline, whereas, inland, exposure is generally poor (Munro Reference Mclellan1986). The SHSC is also on the southern edge of a granite vein complex occupying a large area S of the Dee fault (Fig. 1d). This fault separates the complex from the foliated Aberdeen Granite (Kneller & Aftalion Reference Kneller, Trewin, Kneller and Gillen1987).
Much of the granite in the complex is migmatitic and typically occurs as lenses and sheets at the cm- to 10 m-scale. Larger bodies do occur and the weakly foliated (magmatic foliation) granite at Nigg Bay (Fig. 1d) has been dated at 465 ± 5 Ma (Appleby et al. Reference Appleby, Gillespie, Graham, Hinton, Oliver and Kelly2010). The unfoliated Cove granite to the S of the complex is dated at 458 ± 5 Ma (Fig. 1d) (Appleby et al. Reference Appleby, Gillespie, Graham, Hinton, Oliver and Kelly2010). Kneller & Aftalion (Reference Kneller, Trewin, Kneller and Gillen1987) distinguished granite veins in the complex ranging in structural age from pre D3 or syn D3 to post D3, and concluded that (1) the foliated Aberdeen granite is ‘broadly’ syn D3, and (2) that the veins and larger bodies of granite represent a period of intrusion that overlapped D3. Unfoliated granites in the complex are, therefore, post D3. The geochronological age of the SHSC at ca.469 Ma is discussed in this structural and magmatic context.
The SHSC lies in the sillimanite zone of Barrovian metamorphism (Fig. 1c) (Kneller & Gillen Reference Kneller and Aftalion1987). The metamorphic grade increases systematically from the Highland Boundary Fault (HBF) northwards. Peak metamorphism (sillimanite grade) is reached at Findon, 4 km S of the SHSC (Harte et al. Reference Harte, Booth, Dempster, Fettes, Mendum and Watts1987), and Munro (Reference Mclellan1986) records sillimanite as being widespread in the Aberdeen Formation. Sillimanite is reported also in the syn D3 Aberdeen granite (Mackie Reference Lee, Marti, Severinghaus, Kawamura, Yoo, Lee and Kim1926). Thus, we conclude that the SHSC host rocks are within the sillimanite zone.
Exposure of the SHSC reveals a multistage history of repeated intrusion, breccia formation, hydrothermal activity, mineralisation and faulting (Rice & Mark Reference Paterson, Vernon and Tobisch2019). Two-mica granites and intrusive breccia are the dominant rock types, with minor pegmatite, quartz porphyry, felsite and dolerite. There is an inner sequence (described by Porteous Reference Oliver, Chen, Buchwaldt and Hegner1973) separated by faults from two previously undescribed outer granites (Burnbanks and Bunstane; Fig. 2). In addition, there is widespread quartz veining, associated hydrothermal alteration and localised molybdenite mineralisation. The SHSC has been interpreted as sub-volcanic and, in the absence of a significant foliation, temporally linked to the Silurian–Devonian Newer Granites (Porteous Reference Oliver, Chen, Buchwaldt and Hegner1973; Kneller & Gillen Reference Kneller and Aftalion1987) that span the period of late Caledonian orogenic convergence and uplift (Strachan et al. Reference Selby, Creaser and Feely2002; Oliver et al. Reference Noble, Condon, Carney, Wilby, Pharaoh and Ford2008).

Figure 2 Simplified geological map of the Souter Head complex and the sample localities (1–4). Also see Rice & Mark (Reference Paterson, Vernon and Tobisch2019) for further information. Sample location (1) zircon and muscovite from the inner non-xenolithic granite; sample location (2) K-feldspar and muscovite from pegmatite cutting the non-xenolithic granite; sample location (3) intergrown and coeval muscovite and molybdenite from the late quartz–molybdenite vein; sample location (4) muscovite from the outer Burnbanks granite.
The relative timing of crystallisation for the members of the inner sequence of the SHSC can be established from intrusive relationships to be, from oldest to youngest, (1) intrusive breccia, (2) two mica granites, (3) pegmatite, (4) quartz porphyry and (5) most quartz veins. Felsite dykes are coeval with the SHSC and dolerite is younger, but these intrusive rocks occur regionally and are not genetically linked to the SHSC.
Intrusive breccia occurs as three main masses separated by granite (Fig. 2). Rare original contacts show that granite intrudes the breccia. Breccia clasts are mainly angular semi-pelite with rare rounded granite. Maximum clast dimensions are typically 10–20 cm, but can range up to 30 m. The northern granite mass contains xenoliths of semi-pelite and rare amphibolite, and exhibits a weak and patchy foliation defined by the alignment of biotite grains. The foliation is interpreted as magmatic since the biotite is enclosed by non-aligned minerals with an igneous texture (Paterson et al. Reference Oliver1989). In contrast, the southern mass is non-xenolithic and lacks any foliation (as do all other units in the inner sequence), indicating emplacement post-D3 deformation. The xenolithic granite is interpreted as the marginal facies of the non-xenolithic granite, which likely explains the foliation.
Pegmatites cut the two granites and breccias, and are composed of quartz, K-feldspar, muscovite and biotite. They occur mainly as linear veins that extend up to 70 m along strike. With the exception of the dolerite, quartz veins cut all of the intrusive rocks. The quartz veins are generally straight-sided, massive and can be traced for up to 130 m. They mostly strike N–S and are either vertical or dip easterly at a shallow angle. One of these veins that extends for over 50 m and cuts the breccia, non-xenolithic granite and quartz porphyry contains thin margin-parallel bands and clusters of intergrown muscovite and molybdenite (Fig. 3).

Figure 3 Field photograph showing the targeted quartz–molybdenite vein hosted by intrusive breccia (sample point 3 in Fig. 2). Non-xenolithic granite can be observed in the background. Black arrows show molybdenite- and muscovite-rich grey streaks through the vein.
2.1. Structural age of the SHSC
The structural age of the SHSC cannot be obtained by examination of the contacts between the metasediments and the outer granites or the inner sequence due to lack of exposure or accessible exposure (Rice & Mark Reference Paterson, Vernon and Tobisch2019). However, constraints can be placed upon it by (1) assuming that N–S-striking quartz veins cutting metasediments N of Souter Head are the same age as similarly orientated veins in the SHSC, (2) examining truncated structures in clasts and xenoliths in the SHSC and (3) comparing the structures in the SHSC with those in better exposed areas (Appendix DM1).
2.1.1. Quartz veins
N–S-striking quartz veins cut the metasediments in the Altens Haven area and are demonstrably post D1. Since they lack significant deformation, they were emplaced late in the structural sequence and are probably post D3. If these veins are related to the late N–S-striking veins in the SHSC, the latter are also likely post D3.
2.1.2. Clasts and xenoliths in the SHSC
The structural age of the SHSC must be younger than any structures seen in clasts and xenoliths that are truncated at the margins. Most clasts and xenoliths are semi-pelites like the country rocks and possess a fabric identical in character to the country rocks (Appendix DM1). In keeping with the general lack of folding in the host rocks, the fabric is planar, even in the 30 m rafts. There is rare cm-scale folding of this fabric, placing the SHSC as post D2 or D3.
2.1.3. Comparison with other areas
The absence of a tectonic foliation suggests the SHSC is of a comparable structural age (post D3) to the late unfoliated granite veins elsewhere in the granite vein complex, which cut D3 structures (Kneller & Aftalion Reference Kneller, Trewin, Kneller and Gillen1987). The other evidence presented above is consistent with this conclusion.
3. Samples
40Ar/39Ar, 238U–206Pb and Re–Os dating were used to construct a chronological framework for the inner sequence and an outer granite of the SHSC (Fig. 2), together with a late molybdenite-bearing quartz vein (Fig. 3). The chronology for the inner sequence, which lacks a tectonic foliation, provides a chronological marker for the termination of peak metamorphism and deformation in the Grampian Event in NE Scotland (Rice & Mark Reference Paterson, Vernon and Tobisch2019). Further, the chronology, integrated with the structural setting and metamorphic grade, permits interrogation of subduction zone response (i.e., topographical change, exhumation) during the termination of the Grampian Event. Such investigations are possible due to the excellent field relations exposed in the Souter Head coastal transect, which provide a robust petrogenetic framework and a wide variety of dating targets. Specifically, we targeted muscovite from the outer Burnbanks granite (sample location 4, Fig. 2), zircon and muscovite from the inner non-xenolithic granite (sample location 1, Fig. 2), K-feldspar and muscovite from pegmatite cutting the non-xenolithic granite (sample location 2, Fig. 2) and, finally, intergrown and demonstrably coeval muscovite and molybdenite from the late quartz–molybdenite vein (sample location 3, Figs 2, 3).
3.1. Petrography of the late muscovite–molybdenite-bearing quartz vein
The dominant mineral is quartz, of which three types can be distinguished in cathodoluminescence (CL) (Fig. 4). The most common and earliest is medium grey in CL. This has recrystallised to grains in the size range 0.1–5.0 mm. In places, primary oscillatory zoning is preserved (Fig. 4a). A network of dark quartz, which follows the grain boundaries and fills fractures, postdates this quartz (Fig. 4a, b). The third and latest is margin-parallel bright-quartz veinlets. These, and fracture-controlled inclusion trails, both crosscut the network (Fig. 4).

Figure 4 (A) SEM-CL: typical fracture network of dark quartz in quartz vein partly following the boundaries of recrystallised quartz crystals (medium grey). Clusters of molybdenite and muscovite (white arrows) are located in the network of dark quartz, the white mineral in the clusters is powellite. Note, in SEM-CL the molybdenite and muscovite are not visible, but are shown in Back Scattered Electron Microscope (BSEM) (Figs 3d, 4c, d). Finer lines corresponding to fluid inclusion trails are arrowed (black) and an area of primary oscillatory zoning in quartz is marked (OZ). (B) SEM-CL: medium-grey quartz with network of dark quartz and margin-parallel (running E–W) veinlet (MPV) containing muscovite and molybdenite (opaque) and powellite (white). Fine lines corresponding to fluid inclusion trails (black arrow) and quartz veinlet (BQ) cut the network. (C) BSEM: margin-parallel veinlet in quartz (dark grey) composed of muscovite (medium grey), molybdenite (black arrows) and powellite (white arrows). Small clusters of molybdenite and muscovite and isolated crystals of these two minerals are also present. (D) BSEM: molybdenite–muscovite cluster. Molybdenite (black arrows) is located between muscovite (medium grey) crystals and cleavages and also cross-cutting muscovite crystals and cleavages. Fine veinlets of powellite (white arrows) are present, cutting muscovite.
Molybdenite shows a close spatial and temporal relationship with muscovite. The two minerals are mainly found in clusters with muscovite and molybdenite crystals up to 2 mm and 0.4 mm, respectively. In the clusters, molybdenite occurs between muscovite crystals, but also crosscutting crystals and along muscovite cleavages (Fig. 4d). The siting of the clusters is closely linked to the dark quartz network (Fig. 4a). Lesser amounts of molybdenite and muscovite are found in margin-parallel veinlets (Fig. 4b, c) and dispersed in the dark-quartz network. In these last two locations, the molybdenite and muscovite are finer grained (typically up to 150 μm). The close spatial association of molybdenite with muscovite within the dark quartz network suggests all three minerals are broadly coeval.
4. Methods
4.1. 40Ar/39Ar dating
Samples for 40Ar/39Ar dating were prepared using the methodologies outlined in Mark et al. (Reference Mark, Renne, Dymock, Smith, Simon, Morgan, Staff and Ellis2011). Briefly, samples were crushed and subjected to magnetic separation. The sericite-bearing fraction was run down a shaking table and relatively pure muscovite splits collected. K-feldspar samples were purified using heavy liquids and cleaned by leaching in 5% Hydrofluoric acid (HF) for 2 min. Subsequently, clean grains (no visible inclusions) were hand-picked under a binocular microscope with all samples (wafers and separates) further cleaned in ethanol and deionised water.
Samples were parcelled in high-purity aluminium discs for irradiation. Standards Fish Canyon sanidine (FCs-EK; Morgan et al. Reference Mclellan2014) (28.294 ± 0.036 Ma; Renne et al. Reference Oliver, Wilde and Wan2011), GA1550 biotite (99.738 ± 0.104 Ma; Renne et al. Reference Oliver, Wilde and Wan2011) and Hb3gr (1081.0 ± 1.2 Ma, Renne et al. Reference Oliver, Wilde and Wan2011) hornblende were loaded adjacent to the samples to permit accurate characterisation of the neutron flux (J-parameter). Samples were irradiated for 2700 min in the Cadmium-lined facility of the CLICIT Facility at the Oregon State University TRIGA reactor. Standards were analysed on a MAP 215-50 system (described below briefly and in more detail by Mark et al. Reference Mark, Renne, Dymock, Smith, Simon, Morgan, Staff and Ellis2011) – FCs was analysed by carbon dioxide (CO2) laser total fusion as single crystals (n = 20), GA1550 (n = 5) and Hb3gr (n = 5) were step-heated using a CO2 scanning laser (e.g., Barfod et al. Reference Barfod, Mark, Tait, Dymoch and Imlach2014). Using GA1550, the J-parameter was determined to a precision ca.0.1% uncertainty. Using the J-parameter measurements from GA1550, ages were determined for FCs and Hb3gr. The ages overlapped at the 68% confidence (1-sigma) with the ages reported by Renne et al. (Reference Oliver, Wilde and Wan2011), showing the J-parameters determined from GA1550 to be accurate.
The samples were step-heated using a CO2 laser (approximately 500–1500 °C, optical pyrometer measurements). Extracted gases were subjected to 300 s of purification by exposure to two SAES GP50 getters (one maintained at room temperature, the other held at ca.450 °C). A cold finger was maintained at −95.5 °C using a mixture of dry ice (CO2[S]) and acetone. Ion beam intensities (i.e., Ar isotope intensities and, hence, ratios) were measured using a GVI ARGUS V noble gas mass spectrometer in ‘true’ multicollection mode (Mark et al. Reference Mark, Parnell, Kelley, Lee, Sherlock and Carr2009). Faraday cups (1011 ohm 40Ar, 1012 ohm 39–36Ar) were used to make measurements. The system had a measured sensitivity of 7.40 × 10⁻¹⁴ moles Volt−1. The extraction and clean-up, as well as mass spectrometer inlet and measurement protocols and data acquisition, were automated. Backgrounds (full extraction line and mass spectrometer) were made following every two analyses of unknowns. The average background ± standard deviation (n = 162) from the entire run sequence was used to correct raw isotope measurements from unknowns and air pipettes. Mass discrimination was monitored by analysis of air pipette aliquots after every five analyses of unknowns (n = 63, 7.32 × 10⁻¹⁴ moles 40Ar, 40Ar/36Ar = 299.81 ± 0.19).
All Ar isotope data were corrected for backgrounds, mass discrimination and reactor-produced nuclides, and processed using standard data reduction protocols (e.g., Mark et al. Reference Mackie2005) and reported according to the criteria of Renne et al. (Reference Renne, Mundil, Balco, Min and Ludwig2009). The atmospheric argon isotope ratios of Lee et al. (Reference Lawley and Selby2006), which have been independently verified by Mark et al. (Reference Mark, Renne, Dymock, Smith, Simon, Morgan, Staff and Ellis2011), were employed. The ages were calculated using the optimisation model approach of Renne et al. (Reference Renne, Balco, Ludwig, Mundil and Min2010) using the parameters of Renne et al. (Reference Oliver, Wilde and Wan2011). The 40Ar/39Ar ages are reported as X ± Y/Z, where Y is the analytical uncertainty and Z is the full external precision, including uncertainties from the decay constant. All ages are reported at the 2-sigma confidence interval.
4.2. Isotope dilution thermal ionisation mass spectrometry (ID-TIMS) U–Pb geochronology
Zircons were hand-picked after separation using conventional techniques. Analyses were performed at the NERC Isotope Geosciences Laboratory (NIGL) at the British Geological Survey, Keyworth, UK, following established protocols (e.g., Noble et al. Reference Menant, Sternai, Jolivet, Guillou-Frottier and Gerya2014). This includes a chemical abrasion procedure (Mattinson Reference Mark, Barfod, Stuart and Imlach2005) and U/Pb determinations calibrated using the EARTHTIME (ET535) tracer solution (Condon et al. Reference Clift, Dewey, Draut, Chew, Mange and Ryan2015; CA-ID-TIMS). For data reduction and uncertainty propagation, we followed the strategy of Bowring & McLean (Reference Brown, Ryan, Afonso, Boutelier, Burg, Byrne, Calvert, Cook, DeBari, Dewey, Gerya, Harris, Herrington, Konstantinovskaya, Reston, Zagorevski, Brown and Ryan2011) and McLean et al. (Reference Mattinson2011).
As we are not dealing with geologically ‘young’ rocks and, thus, our data will not be precise enough to concern ourselves with ‘over-interpretation’ of the zircon U–Pb age data (i.e., youngest zircon versus weighted mean age; Ickert et al. Reference Hole, Millett, Rogers and Jolley2015; Mark et al. Reference Mark, Parnell, Kelley and Sherlock2017), we used a weighted mean of the youngest population of each sample. Each youngest population contained three or more ages that give an MSWD that is acceptable for a single population (Wendt & Carl Reference Tanner, Corfu, Gasser and Chew1991). The 206Pb/238U ages presented in this paper are corrected for initial Thorium (Th) disequilibrium and uncertainties are quoted at the 2-sigma confidence level, unless stated otherwise. Uncertainties are listed as ± X/Y/Z, where X is the analytical uncertainty, with Y and Z including the propagated uncertainties for tracer calibration, and, respectively, tracer calibration and the 238U decay constant.
4.3. Re–Os dating
Three molybdenite separates were obtained. Two independent mineral separates were isolated using traditional mineral separation protocols – for example, crushing, magnetic Frantz separation, heavy liquids, water floatation and hand picking (Selby & Creaser Reference Rice and Mark2004). The mineral separates of samples SH23A and SH23B were achieved utilising the HF isolation approach (Lawley & Selby Reference Kneller, Gillen, Trewin, Kneller and Gillen2012). The latter uses concentrated HF at room temperature to aid in liberating the molybdenite from the silicate matrix.
The Re–Os analytical protocol follows that described by Selby & Creaser (Reference Renne, Balco, Ludwig, Mundil and Min2001), with a slight modification to the isolation protocol of Re. An aliquot of molybdenite doped with a known amount of tracer solution comprising 185Re and normal Os isotope composition was loaded into a Carius tube with a 1:3 mL mix of concentrated hydrogen chloride (HCl) and nitric acid (HNO3). The tube was sealed and then heated to 220 °C for 24 h. The Os was isolated from the acid solution using solvent extraction with chloroform and further purified using micro-distillation. The Re was isolated using solvent extraction by sodium hydroxide and acetone, and then further purified using anion HNO3:HCl chromatography.
The isotope compositions of the Re and Os fractions were determined using Negative Thermal Ionisation Mass Spectrometry (Creaser et al. Reference Cooper, Crowley, Hollis, Noble, Roberts, Chew, Earls, Herrington and Merriman1991; Volkenning et al. Reference Strachan, Smith, Harris, Fettes and Trewin1991) using a Thermo Electron TRITON mass spectrometer at the University of Durham. Measurements were made statically using the Faraday Cups for both Re and Os. The measured Re and Os isotopic ratios were oxide-corrected offline. The data were corrected for fractionation. Analytical uncertainties are propagated and incorporate uncertainties related to Re and Os mass spectrometer measurements, blank abundances and isotopic compositions, spike calibrations and reproducibility of standard Re and Os isotope values. Procedural blanks conducted during the period of the molybdenite analysis are negligible relative to the Re and Os abundances measured in the samples (Re 2.1 ± 0.2 ppt, Os 0.1 ± 0.2 ppt, 187Os/188Os = 0.22 ± 0.05; n = 2). In-house reference solutions run during the analysis (Re std = 0.5983 ± 0.0011; DROsS = 0.16089 ± 0.0001; n = 2) are similar to long-term reproducibility data reported by Lawley & Selby (Reference Kneller, Gillen, Trewin, Kneller and Gillen2012) (and references therein). The Re–Os ages are presented as model ages from the simplified isotope equation [t = ln(187Os/187Re + 1) / λ] (where t = model age and λ = 187Re decay constant), and assumes no initial radiogenic Os. The inclusion of decay-constant uncertainty and reporting of data with 2-sigma uncertainty allows for direct comparison of the Re–Os ages with the 206Pb/238U and 40Ar/39Ar ages. The Re–Os ages are provided as X ± Y/Z, with Y and Z with and without the decay-constant uncertainty, respectively.
Appendix DM2 contains raw age data. Note, all age data throughout are reported at the 2-sigma confidence level. Also, all published data have been recalculated (where relevant) to the latest decay constants and monitor ages/spike calibrations.
5. Results
5.1. Inter-chronometer comparison
It is important to note that when considering the relative timing of different units using a single chronometer, only the analytical uncertainty is required, as mineral standard age uncertainties, tracer calibration and decay-constant uncertainties are all systematic, and have a predictable and similar effect on each sample. The age standard, tracer and decay-constant uncertainties, combined, yield the ‘total’ uncertainty and this is used when comparing data from different chronometers. All inter-chronometer comparisons throughout this contribution are made at the 2-sigma (95.4%) confidence interval and incorporate systematic uncertainties.
The weighted means (single zircon ID-TIMS) for the 207Pb/206Pb and 206Pb/238U ages are 469.4 ± 0.8/0.8/4.6 Ma (analytical precision/tracer calibration/decay-constant uncertainties) and 469.1 ± 0.1/0.2/0.6 Ma, respectively (Fig. 5). We interpret the 206Pb/238U age to constrain crystallisation of the unfoliated non-xenolithic granite.

Figure 5 (A) Zircon U–Pb Concordia plot. (B) Zircon U–Pb weighted average ages. (C) 40Ar/39Ar step-heating spectra showing ages for all targeted samples.
All 40Ar/39Ar age spectra (Fig. 5) show, to varying degrees, a ca.405 Ma disturbance of the low-temperature steps. With the exception of the K-feldspar from the pegmatite, all age spectra step-up to define robust plateau ages. The outer Burnbanks Granite (muscovite) is 468.7 ± 0.3/0.4 Ma (analytical precision/decay-constant uncertainties), the inner unfoliated non-xenolithic granite (muscovite) is 468.4 ± 0.3/0.4 Ma, the pegmatite (muscovite) is 468.6 ± 0.7/0.7 Ma and the late vein (muscovite) that the cuts granite, breccia and porphyry rocks is 468.3 ± 0.6/0.7 Ma. The K-feldspar data step-up also from ca.405 Ma to define a mini-plateau age (468.2 ± 0.3/0.4 Ma) that is indistinguishable from the age of the muscovite from the same rock. All 40Ar/39Ar ages are indistinguishable from each other and the 206Pb/238U zircon age. The close temporal association between the U–Pb zircon and the 40Ar/39Ar muscovite ages shows that the SHSC, including late hydrothermal activity, was emplaced and cooled very quickly, within 0.5 ± 0.9 Ma (possibly due to rapid uplift, see discussion below). The reproducible ages (ca.469–468 Ma) for the outer Burnbanks granite and the SHSC, together with petrographic similarities and the symmetrical position of the outer granites on the northern and southern sides of the complex (Fig. 2), strongly suggest that they are part of the SHSC.
A molybdenite sample from the late quartz–molybdenite vein that presents as coeval with the muscovite (Fig. 4; Table 1) defines a model age of 440.2 ± 3.1/3.4 Ma (analytical precision and tracer calibration/decay-constant uncertainties). Although there is excellent agreement between the 40Ar/39Ar and U–Pb systems (Figs 5, 6), the Re–Os age is surprisingly not concordant with the other chronometers (Table 1). We do not consider the Re–Os age to be geologically robust with respect to an emplacement age (see discussion below), owing to the later alteration of the molybdenite to powellite, a mineral found in the oxidation zones of molybdenite-bearing hydrothermal deposits (Anthony et al. Reference Anthony, Bideaux, Bladh and Nichols2003).

Figure 6 Summary of multi-chronometer geochronology (all data shown at 2-sigma including all sources of uncertainties). 1: 206Pb/238U age for zircon from the unfoliated non-xenolithic granite. 2: 40Ar/39Ar age for the Burnbanks granite. 3: 40Ar/39Ar age for inner unfoliated non-xenolithic granite. 4: 40Ar/39Ar age for the pegmatite (muscovite). 5: 40Ar/39Ar age (mini-plateau) for K-feldspar from pegmatite. 6: 40Ar/39Ar age for the late vein. 7: Re–Os age for molybdenite from late vein. 8: 40Ar/39Ar reset age range recorded by all 40Ar/39Ar samples.
Table 1 Re–Os raw data and ages ± analytical precision/full external uncertainties (lambda). The data define a weighted average age of 438.6 ± 1.5/1.9 Ma.

6. Discussion
6.1. Re–Os chronology
The young Re–Os age (Table 1; Fig. 6) was unexpected given the relatively high closure temperature (>500 °C, certainly higher than 40Ar/39Ar muscovite) associated with the Re–Os molybdenite system – suggesting either the molybdenite age is ‘reset’ or the molybdenite was emplaced significantly later than the SHSC. Temperatures required to thermal reset the molybdenite would have completely reset the 40Ar/39Ar geochronometer and, as such, we would not have recovered ages for the vein muscovite equivalent to the U/Pb age of the granites. The textural evidence indicates that the molybdenite and muscovite have a close spatial association and are coeval (see Fig. 4 and discussion above). Therefore, a younger molybdenite emplacement event would require the muscovite formed coevally with the molybdenite to be younger than the granites, but the muscovite fraction dated (grainsize 50 to 100s μm) is not temporally resolvable from the age of the granites. In an attempt to resolve this conundrum, we re-examined the samples by scanning electron microscopy (SEM), which revealed the presence of powellite.
Powellite (calcium molybdate) in our samples is closely associated with molybdenite, and is best developed in the clusters and, to a lesser extent, in the margin-parallel veinlets (Fig. 7). There is evidence that powellite was formed during a separate and later event to molybdenite. Thus, ragged molybdenite crystals occur floating in powellite, which also penetrates along molybdenite cleavages supporting a replacive relationship (Fig. 7b, c). Commonly, molybdenite crystals or terminations of crystals enclosed by quartz are not coated by powellite (Fig. 7a), which is consistent with quartz protecting molybdenite from alteration by later fluids. Powellite is present by itself in fracture fills in muscovite (Fig. 7d). Further petrographic evidence for a later tectono-hydrothermal event, possibly linked to powellite deposition, are margin-parallel bright-quartz veinlets and fracture-controlled inclusion trails cutting the dark-quartz network (Fig. 4b).

Figure 7 (A) BSEM: molybdenite (white), minor muscovite (dark grey) and powellite (medium grey) in quartz (dark grey). Note that powellite encloses molybdenite in the cluster but not where molybdenite terminations are protected in quartz (white arrows). (B) BSEM: molybdenite (white) and powellite (medium grey) in quartz (dark grey) with minor muscovite. Powellite enclosing molybdenite crystals of varying size and ragged appearance. Note powellite penetrating along molybdenite cleavages (white arrow). (C) BSEM: powellite (medium grey) is enclosing ragged molybdenite crystals. (D) BSEM: powellite filling fine fractures in muscovite.
Therefore, we propose an alternate scenario, which suggests caution must be employed if using the Re–Os molybdenite-dating tool (model ages) in isolation of other chronometers in settings that have experienced multiple magmatic and hydrothermal events. The alteration of molybdenite to powellite has resulted in (owing to bulk dissolution/sampling approaches) a two-component hybrid age that has no geological significance. This is supported by the 40Ar/39Ar step-heating data recording an alteration/fluid flushing event at ca.405 Ma (Figs 5, 6), which is likely linked to the emplacement of the nearby Mt Battock granite of equivalent age (Oliver et al. Reference Noble, Condon, Carney, Wilby, Pharaoh and Ford2008). Hydrothermally driven fluid flushing events (e.g., Mark et al. Reference Mark, Parnell, Kelley, Lee, Sherlock and Carr2007) likely formed the powellite whilst also disturbing the Ar-systematics of the low closure temperature minerals (e.g., feldspar), producing the 405 Ma overprint. The primary molybdenite age (ca.468 Ma) mixed in the correct portions with a younger powellite age (ca.405 Ma), would yield a 438–441 Ma hybrid age. Note, there is no known thermal event that is coincident with the ca.440 Ma model Re–Os age in the area of study.
Although powellite has been found in other systems, a disturbance of the Re–Os ages has not been reported, which is likely because the powellite formed soon after molybdenite deposition; thus, the molybdenite age uncertainties would mask any disturbances to the Re–Os system (the delta-time between the molybdenite and powellite is small, whereas, at Souter Head, the delta-time between the molybdenite formation and subsequent powellite formation is large). The powellite at Souter Head formed much later than the molybdenite, beyond the uncertainties of the molybdenite Re–Os age as suggested by the young (ca.405 Ma) 40Ar/39Ar age. Several studies have conducted experiments to establish the effect of such alteration on the Re–Os chronometer (e.g., Suzuki et al. Reference Selby and Creaser2000), with much discussion and debate (e.g., Selby et al. Reference Renne, Mundil, Balco, Min and Ludwig2004; Suzuki Reference Selby and Creaser2004). Suzuki et al.. (Reference Selby and Creaser2000) showed experimentally that the Re–Os system in molybdenite can behave as an open-system in the presence of aggressive advecting fluids.
6.2. The age of the SHSC
The ages obtained for the SHSC show that it belongs to the Ordovician late tectonic granites (ca.475–457 Ma) of the NE Grampian Terrane (Strachan et al. Reference Selby, Creaser and Feely2002; Oliver et al. Reference Noble, Condon, Carney, Wilby, Pharaoh and Ford2008) rather than the Silurian–Devonian newer granites (Fig. 8). The former are mostly S-type two-mica granites, garnet-bearing and commonly foliated with strontium-87 (87Sr)/86Sr ratios consistent with the melting of sedimentary protoliths (Chappell & White Reference Cassel, Smith and Jicha1974; Harmon Reference Gerya, Yuen and Maresch1983). Infracrustal sources may also be involved (Appleby et al. Reference Appleby, Gillespie, Graham, Hinton, Oliver and Kelly2010).

Figure 8 Timescale showing the age of key metamorphic (meta.) minerals, basic rocks, unfoliated granites, foliated granites and ophiolite obduction in NE Scotland and western Ireland in relation to Dalradian sedimentation, peak orogenesis (oro.) and exhumation (exh.). Data from Baxter et al. (Reference Baxter, Ague and Depaulo2002), Carty et al. (Reference Cahill and Isacks2012), Chew et al. (Reference Chen, Bina and Okal2010), Dempster et al. (Reference Crowley and Strachan2002), Friedrich et al. (Reference Duretz, Gerva and May1999), Kneller & Aftalion (Reference Kneller, Trewin, Kneller and Gillen1987), Oliver et al. (Reference Munro2000), Stewart et al. (Reference Seedorff, Dilles, Proffett, Einaudi, Zurche, Stavast, Johnson and Barton2017) and Viete et al. (Reference Spray and Dunning2013). The various times of deformation (D1–D4 are also shown).
Stages of deformation associated with the Grampian Event in NE Scotland are D1–D3 and, locally, D4 (Harte et al. Reference Harmon, Atherton and Gribble1984; Kneller Reference Johnson, Kirkland, Viete, Fischer, Reddy, Evans and Mcdonald1987; Strachan et al. Reference Selby, Creaser and Feely2002). The SHSC intrudes the Barrovian metamorphic core (sillimanite zone) in this area (Fig. 1c) where peak metamorphism is closely associated with D3 (Harte et al. Reference Harmon, Atherton and Gribble1984; McClellan Reference Mckerrow and Campbell1989). The nearby-foliated Aberdeen granite is broadly D3 and has been dated at 470 ± 2 Ma (Kneller & Aftalion Reference Kneller, Trewin, Kneller and Gillen1987) (Fig. 1d). The SHSC is similar in terms of mineralogy to these granites but, critically, lacks a tectonic foliation. The geochronology, absence of a tectonic foliation and widespread evidence of brittle rather than ductile deformation in the SHSC, as well as the absence of high-grade indicator minerals and significant recrystallisation, shows the SHSC immediately post-dates and, thus, constrains the end of main (D1–D3) Grampian deformation and metamorphism in the NE Grampian terrane to 469.1 ± 0.6 Ma.
6.3. Termination and duration of the Grampian Event
The post-deformation SHSC age is indistinguishable from garnet Sm–Nd ages that place the end of D3 at Glen Clova at 466.8 ± 3.2 Ma (2-sigma, full external uncertainties; Baxter et al. Reference Baxter, Ague and Depaulo2002) (Fig. 1b). Similarly, the SHSC age is coincident with the termination of deformation to the N at Portsoy, as constrained by an undeformed pegmatite at 474 ± 5 Ma (Carty et al. Reference Cahill and Isacks2012).
Given that the ages for the SHSC, Glen Clova and Portsoy are indistinguishable at the 2-sigma confidence interval, we have calculated a weighted average of the termination of D3 deformation and peak metamorphism in NE Scotland of 469.2 ± 1.3 Ma. Thus, the duration of the Grampian Event at best can be confined to 22.8 ± 2.4 Ma, from the onset of collision (i.e., ophiolite obduction) to the termination of Grampian Event D3 deformation. A later phase of deformation D4 is developed locally N of the HBF, but the age of this event is currently unconstrained. It has been linked to late-stage uplift of the orogen (Harte et al. Reference Harmon, Atherton and Gribble1984).
6.4. Termination and rapid uplift
There is direct evidence that rapid uplift was temporally associated with the termination of the orogenic peak in NE Scotland. The SHSC was emplaced in sillimanite zone rocks in the upper crust (above ca.10 km) as demonstrated by the presence of porphyritic rocks and widespread evidence of brittle fracture – that is, intrusive breccias with angular clasts and parallel-sided quartz and pegmatite veins (Seedorf et al. Reference Renne, Cassata and Morgan2005).
A further estimate of depth was obtained using the normative quartz and albite plus orthoclase barometers (Yang Reference Viete, Oliver, Fraser, Forster and Lister2017). We applied this method to four granitic members of the Souter Head suite to constrain the depth (Appendix DM3). Three of them were at the extreme limits of the calibration of the method and the results should be treated with caution. However, a quartz–feldspar porphyry falls well within the range of the calibration method and yields a depth estimate of 13–15 km. Overall, an emplacement depth in the range 10–15 km for the SHSC is indicated.
However, 0.9 ± 2 Ma prior to emplacement of the SHSC, as evidenced by the nearby foliated (syn-D3) Aberdeen Granite (470 ± 2 Ma), the host rocks of the SHSC were in the lower crust at ca.20 km depth (Vorhies & Ague Reference Suzuki, Feely and O'reilly2011), experiencing high-grade metamorphism under ductile conditions. Within a short time period, these rocks thus underwent a 5–10 km change in their structural level – requiring an exhumation rate of 5–10 km Ma−1, comparable to rates found in modern arc–continent collision zones (Brown et al. Reference Bowring and Mclean2011).
By ca.469 Ma, much of the metamorphic cover was removed, which is consistent with high-grade orogenic debris arriving in the South Mayo Trough, Connemara and Midland Valley Basin (Kirkland Conglomerate) at 465 ± 3 Ma and with the oldest mica (Dalradian and detrital) cooling ages (Oliver et al. Reference Munro2000; Oliver Reference Morgan, Mark, Imlach, Barfod and Dymock2001; Clift et al. Reference Chew, Strachan, Corfu, Gasser and Chew2004; Dewey Reference Dewey, Mange, Macniocaill and Ryan2005). The lag time for sediment transport to the Midland Valley basin was exceptionally short, potentially 0.1 Ma, allowing for the large uncertainty associated with the lower (ca.465 Ma) bound for the Kirkland Conglomerate. These data support our age for exhumation of the metamorphic core.
6.5. Slab break-off and timing of events during the metamorphic peak
The Grampian orogenic peak is defined by temporally overlapping D2/D3 deformation and peak metamorphism, basic magmatism and rapid uplift all within ca.5 Ma, which points towards a critical and abrupt change in the subduction zone (Fig. 9). Through comparison with numerical simulations (see below), this is best explained by slab break-off, which likely occurred soon after buoyant material (a spreading ridge or the Midland Valley Arc) entered the trench and stalled subduction (Oliver et al. Reference Noble, Condon, Carney, Wilby, Pharaoh and Ford2008; Tanner Reference Soper, Ryan and Dewey2014). Although slab roll-back, slab tearing or slab-parallel asthenospheric melting are other potential explanations, numerical simulations suggest none of these mechanisms are congruent with an abrupt event that results in a structural change of 5–10 km within the crust within 0.9 ± 2 Ma (Menant et al. Reference Mclean, Bowring and Bowring2016; Cassel et al. Reference Carty, Connelly, Hudson and Gale2018 and references within).

Figure 9 Cross-section of the Grampian Orogen in NE Scotland during and immediately after slab break-off ca.471 Ma (Portsoy). The orogen is undergoing rapid uplift and exhumation. Crustal thinning through erosion and detachment faulting (not shown, see text) as the orogen collapses promotes decompressional melting to produce mafic and felsic melts. The figure is influenced by Oliver et al. (Reference Noble, Condon, Carney, Wilby, Pharaoh and Ford2008) and Tanner (Reference Soper, Ryan and Dewey2014). Abbreviations: AF = Alluvial fan; BO = Ballantrae ophiolite; HBO = Highland Border ophiolite; MVB = Midland Valley basin; MVM = Midland Valley microcontinent.
When slab break-off occurs, part of a subducted lithospheric plate detaches abruptly and sinks into the asthenosphere, inducing upwelling. The dynamics of slab break-off have been investigated extensively, and it has been shown that the strength of the subducting lithosphere, in part influenced by the oceanic slab age, convergence velocity, continental crustal and lithospheric thicknesses, and the mechanism of detachment, all exert control on the depth of break-off (Gerya et al. Reference Friedrich and Hodges2004; Andrews & Billen Reference Andrews and Billen2009; Duretz et al. Reference Dewey2011). Numerical models have shown a wide range in this depth, from 40 to over 500 km (Baumann et al. Reference Baumann, Gerya and Connolly2010; Duretz et al. Reference Dewey2011), but few numerical modelling studies have quantitatively examined the topographic response (rate and amount of uplift) to slab detachment. For example, Buiter et al. (Reference Brown, Ryan, Afonso, Boutelier, Burg, Byrne, Calvert, Cook, DeBari, Dewey, Gerya, Harris, Herrington, Konstantinovskaya, Reston, Zagorevski, Brown and Ryan2002) predicted topography uplift in the range of 2–6 km using an elastic model, whereas Gerya et al. (Reference Friedrich and Hodges2004) predicted lower uplift values (<2 km) using a visco-plastic model. Analysis of ancient orogenic belts – for example, the Grampian Event – provides a time-integrated picture of topographic evolution (as opposed to modern-day measurements in active subduction zones) that allows for connection between model and real-world data.
Some 5–10 km of uplift as recorded by the SHSC over ca.1 Ma would suggest a slab break-off depth of either less than 100 km (Buiter et al. Reference Brown, Ryan, Afonso, Boutelier, Burg, Byrne, Calvert, Cook, DeBari, Dewey, Gerya, Harris, Herrington, Konstantinovskaya, Reston, Zagorevski, Brown and Ryan2002) or less than 50 km (Duretz et al. Reference Dewey2011). Slab break-off at ca.50 km depth would be directly under the collision zone. We suggest that the ensuing rapid uplift caused crustal thinning and decompressional melting of the subcrustal mantle (McKenzie & Bickle Reference Mark, Stuart and De PODESTA1989; Hole et al. Reference Harte, Booth, Fettes, Trewin, Kneller and Gillen2015). This depth is consistent with the shallow sourcing of basic melts to power Buchan metamorphism in NE Scotland (and Ireland, see below) (Viete et al. Reference Spray and Dunning2013, Reference Stewart, Baxter and Ague2017; Johnson et al. Reference Ickert, Mundil, Magee and Mulcahy2017). Crustal thinning could be achieved by erosion and gravity-driven detachment faulting, as suggested for Connemara where the uplift rate is similar (Clift et al. Reference Chew, Strachan, Corfu, Gasser and Chew2004). Melting of the lower crust may also have occurred by decompression/invasion by basic magma to produce the syn- and post-D3 granites observed throughout the region (e.g., the Aberdeen granite and the SHSC).
The precise age of slab break-off during the Grampian Event is uncertain but can be constrained by the age of basic magmatism. The oldest known and precisely dated synorogenic basic rock in NE Scotland is 471.3 ± 1.7 Ma (Carty et al. Reference Cahill and Isacks2012) and, in Connemara, ca.474.5 ± 1 Ma (Friedrich et al. Reference Duretz, Gerva and May1999). Rapid uplift likely began no later than 470 Ma and may have occurred along regional shear zones such as the Portsoy Shear Zone, which also controlled magma emplacement (Ashcroft et al. Reference Ashcroft, Kneller, Leslie and Munro1984; Carty et al. Reference Cahill and Isacks2012; Viete et al. Reference Spray and Dunning2013). Meanwhile, orogenic detritus accumulated in adjacent sedimentary basins (Dewey & Mange Reference Dempster, Rogers, Tanner, Bluck, Redwood, Ireland and Paterson1999; Oliver Reference Morgan, Mark, Imlach, Barfod and Dymock2001).
These observations suggest that a switch from compressional to extensional tectonics in the orogen occurred in the period 474–471 Ma and overlaps with peak Barrovian and Buchan metamorphism and D2/D3 deformation. While we agree with Viete et al. (Reference Spray and Dunning2013) that regional extension was the likely tectonic setting for peak metamorphism and deformation, we consider that slab break-off (Oliver et al. Reference Noble, Condon, Carney, Wilby, Pharaoh and Ford2008; Tanner Reference Soper, Ryan and Dewey2014) provides a better model to explain the extensional processes involved in this very short event.
6.6. Scotland and Connemara
There are marked similarities in the timings and rates of specific events in NE Scotland with Connemara in western Ireland: peak metamorphism and deformation terminated at ca.470–468 Ma (Friedrich et al. Reference Duretz, Gerva and May1999); uplift rates at the termination of the orogeny in Connemara were ca.7 km Ma−1 (Friedrich & Hodges Reference Friedrich, Hodges, Bowring and Martin2016); and these events are essentially coincident with intrusion of basic syn-D3 plutons (e.g., Cashel-Lough Wheelaun gabbro, 470.1 ± 1.4 Ma; Friedrich et al. Reference Duretz, Gerva and May1999). Such data suggest that shallow slab detachment occurred synchronously in NE Scotland and Connemara. Along-strike heterogeneity in subduction zones is well known (e.g., Nazca Plate; Chen et al. Reference Chappell and White2001; Brown et al. Reference Bowring and Mclean2011 and references therein) and it is likely that slab detachment did not occur in the intervening portion of the subduction zone where Barrovian metamorphism only is found. Here, slab dips were mainly shallow and, consequently, with the exception of the Tyrone Igneous Complex, arc-related igneous activity was essentially absent (Fig. 1b) (Cahill & Isacks Reference Buiter, Govers and Wortel1992; Chen et al. Reference Chappell and White2001; Cooper et al. Reference Condon, Schoene and Mclean2011).
7. Conclusions
The SHSC (Aberdeenshire, Scotland) intruded the high-grade metamorphic core of the Grampian Orogen at 469.1 ± 0.6 Ma (238U–206Pb zircon). Temporally coincident U–Pb and 40Ar/39Ar data show the SHSC cooled quickly. Intrusion followed closely peak metamorphism and D2/D3 deformation at ca.470 Ma and marks the end of the Grampian Event in NE Scotland. Younger Re–Os ages are due to post-emplacement alteration of molybdenite to powellite and highlight the importance of careful petrographic characterisation of materials prior to determination of model Re–Os ages from molybdenite.
D2/D3 Grampian deformation (the age of D1 remains uncertain), peak metamorphism (Barrovian and Buchan style) and basic magmatism in NE Scotland were synchronous at ca.470 Ma and associated with rapid uplift (5–10 km Ma−1) of the orogen, which largely removed the metamorphic cover by ca.469 Ma. We suggest that shallow slab break-off (50–100 km) can explain the rapid uplift and the synchroneity of these events, and that decompression led to melting and generation of mafic and felsic melts. This interpretation implies that peak metamorphism and D2/D3 ductile deformation were associated with extension, as previously suggested. Close similarities between the geological histories of NE Scotland and Connemara suggest that shallow slab break-off occurred in both areas. Our proposed model explains the presence of both Buchan and Barrovian metamorphism in certain sectors.
8. Supplementary material
Supplementary material is available online at https://doi.org/10.1017/S1755691020000043.
9. Acknowledgements
Scottish Universities Environmental Research Centre (SUERC) would like to thank NERC for continued funding of the NERC Argon Isotope Facility. We would like to thank the following: Joyce Neilson/Natalie Farrell, John Still, Jenny Johnston/Jamie Bowie and the Lyon Bequest (University of Aberdeen) for discussion of CL data, assistance with the SEM, preparing figures and funding the work, respectively. Ross Dymock and Jim Imlach (SUERC) are thanked for their assistance with sample preparation. Martin Lee at the School of Geographical and Earth Sciences at the University of Glasgow for use of the SEM/CL equipment and Peter Chung for technical assistance. David Selby at the University of Durham for the Re–Os analyses and discussion of the data.


