


Introduction
Pre-diabetes includes hyperglycaemia in the fasting state (impaired fasting glucose/IFG) and/or hyperglycaemia after feeding/postprandial state (impaired glucose tolerance/IGT). Current diagnosis of pre-diabetes is based on family history of diabetes, overweight/obesity and glucose testing, either as an oral glucose tolerance test (OGTT), Reference Bergman, Abdul-Ghani and DeFronzo1 or HbA1c measurement (ADA clinical practice). The prevalence of pre-diabetes is increasing globally, and undetected pre-diabetes is high risk for the development of future type 2 diabetes (T2D) and cardiovascular diseases. Screening tools involving biochemical and/or molecular biomarkers may improve pre-diabetes prediction and help in early risk stratification of individuals for lifestyle intervention. Reference Bell, Shaw and Maple-Brown2,Reference Campbell, Sathish and Zimmet3
In 1993, a birth cohort was set up in rural Pune, India, with the aim of understanding in utero determinants of fetal growth and life-course evolution of the phenotype for diabetes and related disorders. This unique cohort, referred to as the Pune Maternal Nutrition Study (PMNS), has plasma samples and clinical information from around 700 families over three generations (F0, F1, F2) with anthropometric and biochemical measurements in parents and offspring. Reference Rao, Yajnik and Kanade4 We observed that 20% of F1 daughters born to F0 mothers developed pre-diabetes at 18 years of age. Reference Yajnik, Bandopadhyay and Bhalerao5 The serial database and biorepository of samples from PMNS provided a unique opportunity to test the predictive value of early life (6,12 and 17 years) circulating microRNAs in the development of pre-diabetes at a young age.
MicroRNAs are 18-22 nucleotide, regulatory non-coding RNAs that can bind to protein-coding gene transcripts (mostly at the 3’UTR) and either degrade or render these mRNA transcripts translationally inactive. Reference Wong, Sorensen, Joglekar, Hardikar and Dalgaard6 The regulatory and mechanistic role of microRNAs in physiological and pathological processes associated with diabetes remains to be discovered. Circulating microRNAs offer the potential to serve as minimally invasive biomarkers of diabetes-associated pathophysiological features, Reference Guay and Regazzi7 enabling the prediction of disease at an earlier stage.
Considering the importance of early detection of pre-diabetes as well as the need for additional biomarkers to improve the accuracy of pre-diabetes prediction, we aimed to study microRNAs in the PMNS cohort. We profiled all known/validated (N = 754) microRNAs in F1 daughters at 6, 12 and 17 years of age to identify differentially expressed microRNAs associated with the clinical diagnosis of pre-diabetes at 18 years of age. Our data identify microRNAs associated with and potentially predictive of future pre-diabetes and provide the first report of longitudinal changes in circulating microRNAs, as biomarkers of metabolic disease in later life.
Methods
Cohort description
The PMNS birth cohort was set up in six villages near Pune, India. Reference Rao, Yajnik and Kanade4 A total of 797 pregnant women (F0) were enrolled along with their spouses and studied three times during the pregnancy. F1 children were assessed at birth, 6, 12, 17 and 18 years of age for anthropometric, biochemical and blood glucose measurements. Details including dietary intake, physical activity and socio-economic status were also noted. The study was approved by the King Edward Memorial (KEM) Hospital Research Centre, Pune and followed the Indian Council for Medical Research (ICMR), Government of India guidelines for the ethical conduct of the study. All study participants signed informed consent at 18 years of follow-up; at 6, 12 and 17 years, parents signed informed consent, and at 12 and 17-years, children also signed an assent.
Glucose measurements
An OGTT (1.75 g/kg of anhydrous glucose) was performed at 6-years and a 75 g OGTT at 18 years of age. Fasting, 30-min, 120-min blood samples were collected during the OGTT. At 12 years, only a fasting blood sample and at 17 years a random blood sample was collected. Plasma was separated by centrifugation at 1000 × g for 10 min and stored at −80°C. Blood glucose was measured by the glucose oxidase/peroxidase method. The PMNS protocol envisaged every 6 yearly follow-up of parents and children (6, 12 and 18 years) for measurement of a range of cardiometabolic risk factors. Due to limited funding at the 12-year follow-up, we could only collect a fasting sample for that time point. The 17-year time point was not included in the original PMNS follow-up, but random blood samples were collected at 17 years of age in the same individuals as part of another (PRIYA: Pune Rural Intervention in Young Adults) trial. We have used this time point in the present study to understand microRNA biomarkers that are associated with pre-diabetes one year prior to the assessment of the outcome (glucose intolerance at 18 years). Including the 17-year time point offered a 1-year horizon to discover microRNAs associated with pre-diabetes, along with the 6- and 12-year horizons offered through the PMNS study design.
Diagnosis of pre-diabetes
At 18 years of age glucose tolerance was classified by ADA criteria (www.diabetes.org), as normal glucose tolerant (NGT) if FPG < 100 mg/dL and 2-h plasma glucose (PG) < 140 mg/dL; or as impaired fasting glucose (IFG) if FPG 100–125 mg/dL and 2 h PG < 140 mg/dL, as impaired glucose tolerant (IGT) if FPG < 100 mg/dL and 2 h PG 140–199 mg/dL. Pre-diabetes includes IFG and IGT. For this study, we selected female participants with pre-diabetes (N = 8) and NGT (N = 10).
RNA isolation
Stored plasma samples (100-200 µL) from all participants and at all three time points (6, 12 and 17 years of age) were used for RNA isolation as detailed earlier. Reference Taylor, Satoor, Ranjan, Pereira e Cotta and Joglekar8,Reference Joglekar, Wong and Ema9 The automation involved isolation of total RNA using the QIAcube-HT platform (Qiagen, Hilden, Germany) as described. Reference Joglekar, Wong and Ema9 Briefly, 500 µL of TRIzol reagent (ThermoFisher Scientific, USA) and 10 ng of glycogen (Sigma-Aldrich, Hamburg, Germany) were added to each sample. The aqueous phase was then separated following centrifugation and then used for RNA purification using the RNeasy-HT Kit (Qiagen, Hilden, Germany) on an automated platform. Manual steps involved isopropanol addition for RNA precipitation followed by washing with freshly prepared 75% ethanol. RNA was dissolved in nuclease-free water and stored at −80°C until further analysis. RNA concentration/purity was assessed using a NanoDrop™ spectrophotometer (ThermoFisher Scientific, USA) before proceeding for microRNA qPCR.
MicroRNA measurement using OpenArray PCR
RNA was converted to cDNA using Megaplex Human RT Primers (pool A and pool B) and TaqMan® microRNA RT Kit (both from ThermoFisher Scientific, USA). A 10 ng input RNA was used with the manufacturer’s “low sample input (LSI)” protocol for reverse transcription, pre-amplification and real-time qPCR. Pre-amplification was performed on the entire cDNA product using Megaplex™ PreAmp Primers and TaqMan PreAmp Master Mix (both from ThermoFisher Scientific, USA) for 16 cycles. The pre-amplified product was diluted 1:20 in 0.1 × TE buffer (pH 8.0) and then mixed with TaqMan™ OpenArray® PCR master mix before loading onto TaqMan OpenArray® Human microRNA inventoried panels using AccuFill™ robotic system (Life Technologies, Foster City, CA, USA). The discovery set of 754 microRNAs was measured in samples from all women (N = 10 NGT and N = 8 pre-diabetes × 3 time points) using TaqMan-based RT-qPCR with OpenArray® platform on QuantStudio 12K Flex System (Life Technologies, Foster City, CA, USA) as described earlier. Reference Farr, Januszewski and Joglekar10 Data were imported to ThermoConnect software and normalised using a built-in global normalisation method Reference Mestdagh, Van Vlierberghe and De Weer11 after removing any undetectable microRNAs (presenting amplification score <1.24 and cycle value (Cq) confidence interval <0.6). Normalised Ct-values were exported to a CSV format for analysis. MicroRNAs considered undetected/not expressed were assigned a Ct-value of 39, which corresponds to the limit of detection for the TaqMan™ qPCR system in our hands. Reference Hardikar, Farr and Joglekar12,Reference Shihana, Joglekar and Raubenheimer13 Results are calculated using the ΔCt method (difference in normalised Ct-values between pre-diabetes progressors and non-progressors (i.e. NGT)).
Data analysis and statistics
To reliably measure a twofold change in the levels of microRNAs relative to NGTs (the equivalent of one Ct-value difference by qPCR) and assuming a standard deviation (SD) of 30% of the mean (effect size = 1.667) Reference Olejnik and Algina14 with α = 0.05, power = 87%, we would need eight individuals per group. With samples from 8 pre-diabetes and 10 NGT participants at all three time points, the observed SDs were much smaller (<13% of mean; all time points) than the expected 30%, thereby offering the desired statistical power for these analyses. Data were checked for normal distribution before selecting a parametric or non-parametric test. Demographic characteristics of the study participants are represented as z-scores, and significance was calculated by t-test. Z-score standardisation for each variable in pre-diabetes was calculated relative to NGT as per the formula: (mean(pre-diabetes[i]) − mean(NGT[i]))/SD(NGT[i]), where i = clinical characteristic. MicroRNAs that were undetected (Ct-value >39) across all samples in both groups were removed from the analysis. Penalised logistic regression using least absolute shrinkage and selection operator (LASSO) and bootstrapping was employed to identify microRNAs associated with pre-diabetes at 18 years. Two different R-scripts were used by separate investigators on deidentified datasets. Through these approaches, microRNAs that had a non-zero β-coefficient and a non-zero frequency were selected for receiver operating characteristic (ROC) curve analysis. Fasting blood glucose was also considered as another variable in the ROC curve analysis, which was performed using leave-one-out cross-validation (LOOCV) approach with an in-house R pipeline and trainControl (Caret, version 6.0). Prediction performance was assessed by calculating sensitivity, specificity, positive predictive value, negative predictive value and accuracy from confusion matrix. Area under the curve (AUC) was calculated using pROC (v1.16.2) function as described earlier Reference Joglekar, Wong and Ema9 with R software ver. 3.6.2 (R Foundation for Statistical Computing, Vienna, Austria). A categorical bubble plot was generated using the R packages ggplot2 (3.3.2) and ggpubr (0.4.0) as described earlier. Reference Wong, Joglekar and Saini15 Forcats package (0.5.1) was included to arrange variables (presented on y-axis) in order.
Pathway analysis
Kyoto Encyclopaedia of Genes and Genomes (KEGG) pathway analysis was carried out using a web tool (miRSystem, ver. 20160513; http://mirsystem.cgm.ntu.edu.tw/) for each set of important microRNAs identified at 6, 12 and 17 years, associated with pre-diabetes at 18-years of age, using methodologies described earlier. Reference Joglekar, Wong and Ema9,Reference Wong, Joglekar and Saini15 Significant raw p-values (≤0.05) of the KEGG pathways are considered.
Results
Clinical characteristics of PMNS participants
Of the total 267 women, 213 (80%) were NGT women and 54 (20%) had pre-diabetes at 18 years of age. We selected 10 NGT and age-matched 8 women with pre-diabetes for this study. Figure 1A presents their clinical and biochemical characteristics at all ages. There was no significant difference in the BMI of the two groups at 18, 17, 12 and 6 years of age. By definition, at 18 years, women with pre-diabetes had higher glucose concentrations during the OGTT and lower insulin secretion with lower insulin sensitivity. In this small subset of PMNS participants, there was no significant difference in fasting plasma glucose (FPG) compared to NGT (P > 0.05) at 6 and 12 years. Other measurements including fasting insulin, HOMA indices, as well as skinfold thickness were also similar between the participants at earlier (6, 12, 17 years) ages (Fig. 1A).
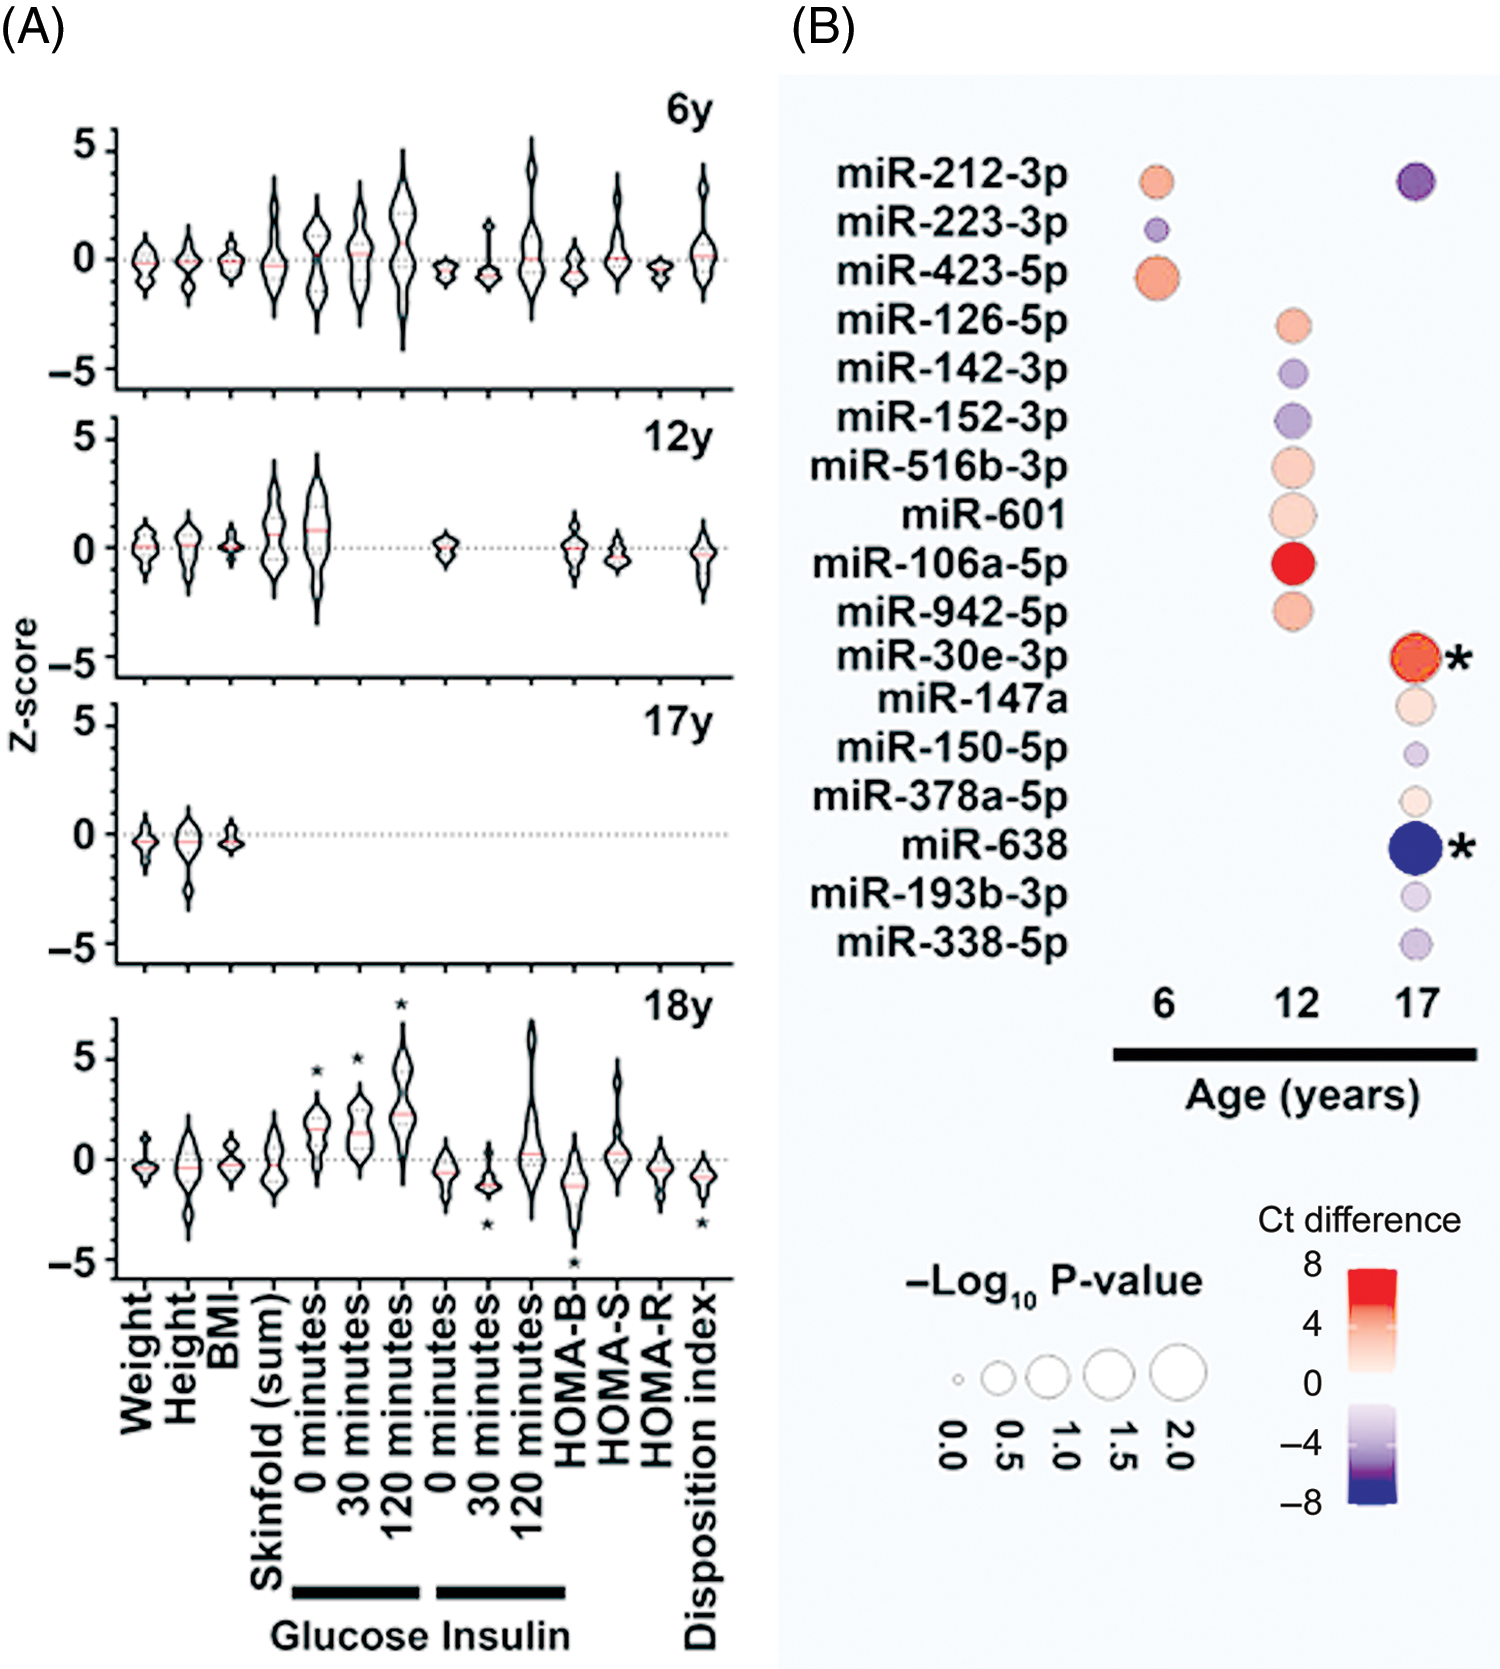
Fig. 1. Clinical characteristics and dysregulated microRNAs in PMNS study samples. (A) Data presented as z-score for the respective clinical measure presented on the X-axis. The Z-score is calculated for the participants with pre-diabetes at 18 years (N = 8) relative to the mean of NGT (N = 10) group at each time point. Violin plots display the median (red line) within each polygon violin and each polygon represents the density of the data and extends to min/max values. Significance is calculated using a t-test and *p < 0.05. (B) Categorical bubble plot displaying the average Ct-value difference of the important microRNAs (identified via penalized logistic regression with bootstrap for NGT vs pre-diabetes analysis; listed on Y-axis) across age (presented on X-axis). The average Ct-value difference was calculated as (Ct-value of NGT – Ct-value of pre-diabetes) and presented in colours ranging from red to blue. Red indicates lower average microRNA abundance; while blue indicates higher average microRNA abundance in NGT compared to pre-diabetes group. The p-value is presented by the size of the bubble, with larger circles presenting higher significance. The microRNAs demonstrating significant differences (p < 0.05) are marked with (*) next to their bubble. The p-values were calculated with Mann-Whitney test.
Profiling of microRNAs at earlier ages identified important biomarkers of pre-diabetes
Discovery profiling of microRNAs in women with pre-diabetes or NGT identified up to 161 microRNAs that were detectable in at least one of the study samples at any given age. This is in accordance with our previous studies Reference Joglekar, Wong and Ema9,Reference Shihana, Joglekar and Raubenheimer13 where we have observed a smaller number of microRNAs in circulation compared to those within cellular compartments. Bootstrapping approach offered minimising sampling bias and ranked microRNAs on their importance (bootstrap frequency) for each of the time points assessed. A total of 17 different microRNAs with non-zero β-coefficient and a non-zero frequency in penalised logistic regression using LASSO and bootstrapping were identified in 6-, 12-, and 17-year samples. Three microRNAs at 6 years, seven at 12 years and eight at 17 years associated with future pre-diabetes (Fig. 1B); miR-212-3p was common amongst the microRNAs identified at 6 and 17 years for their association with pre-diabetes at 18 years (Fig. 1B).
MicroRNAs offered better risk stratification for future pre-diabetes than blood glucose
Fasting glucose is an important clinical predictor of future pre-diabetes. Reference Feizi, Meamar and Eslamian16 We, therefore, performed ROC curve analyses to assess if microRNAs offered any predictive advantage over fasting glucose concentrations at 6 and 12 years, in stratifying NGT and pre-diabetes at 18 years of age. At 6 years of age, three of the microRNAs (miR-212-3p, -223-3p and -423-5p) together offered a higher prediction accuracy (accuracy: 88%, AUC: 0.82) than individual microRNAs (accuracy: 66%–72%, AUC: 0.37–0.51) or fasting glucose alone (accuracy: 38%, AUC: 0.0) (Table 1). Fasting glucose alone at 6 years could not identify the true progressors. Similarly, at 12 years, seven different microRNAs together performed better (accuracy: 77%, AUC = 0.89) than individual microRNAs (accuracy: 55%–72%, AUC: 0.34–0.63) and fasting glucose alone (accuracy: 55%, AUC = 0.5) (Table 1). At each age group, combined models using all selected/important microRNAs offered better risk stratification (higher ROC AUC) than glucose alone (Table 1). Pathway analysis using the important microRNAs indicated TGF-β signalling as a common targeted pathway at all age groups (Fig S1).
Table 1. ROC curve analysis

ROC curve analysis was performed using Leave-One-Out Cross Validation (LOOCV) approach. Variables include the important microRNAs identified (in NGT vs pre-diabetes analysis) at each age (6- and 12-years) along with fasting blood glucose. Specificity, sensitivity, AUC, positive predictive value, negative predictive value, accuracy with 95% confidence interval (CI) for each microRNA alone, fasting glucose alone and their combinations is shown.
Discussion
This novel and preliminary report presents a longitudinal analysis of microRNA expression in women with or without pre-diabetes at 18 years. In this small subset of randomly selected PMNS women, we identified important microRNAs at 6, 12 and 17 years of age in women with pre-diabetes (vs NGT), although clinical features, including plasma glucose concentrations, were similar. The identification of microRNAs that are associated with and potentially predictive of pre-diabetes in later life could help in efficient risk stratification and better management of individuals at risk of diabetes.
Several candidates such as proteins, metabolites and microbiota have been tested for their prognostic/diagnostic capacity to predict pre-diabetes. Reference Bergman, Abdul-Ghani and DeFronzo1,Reference Vaishya, Sarwade and Seshadri17,Reference Zhou, Sailani and Contrepois18 Systematic review and meta-analyses indicate that circulating concentrations of metabolites, including hexoses, amino acids, phospholipids and triglycerides, are associated with pre-diabetes. Reference Guasch-Ferre, Hruby and Toledo19
MicroRNAs are an interesting class of biomarkers as they also present the capacity to be regulators of underlying pathophysiological mechanisms leading to pre-diabetes. In a recent, large cross-sectional study, miR-30e-3p and miR-126-3p were found to be highly abundant and consistently associated with pre-diabetes. Reference Weale, Matshazi and Davids20 Another study reported differentially expressed microRNAs (including miR-223-3p) at baseline in pre-diabetes individuals who later progressed to T2D. Reference Parrizas, Mundet and Castano21 In samples from the ORIGINS trial, multiple microRNAs including miR-126, miR-150 and miR-223 were found to be significantly dysregulated in pre-diabetes and T2D. Reference Nunez Lopez, Garufi and Seyhan22 MicroRNA-192 and -193b are reported to be significantly higher in pre-diabetes stage and return to lower levels following exercise. Reference Parrizas, Brugnara and Esteban23 The majority of microRNAs reported to be dysregulated in pre-diabetes through these studies Reference Weale, Matshazi and Davids20-Reference Parrizas, Brugnara and Esteban23 are also seen to be differentially expressed in our analysis (including miR-30e, miR-223, miR-126, miR-150 and miR-193b) (Fig. 1B).
TGFβ pathway ligands play an important role in endocrine pancreas function, Reference Lee, Lee and Rane24 and the expression/abundance of TGFβ has been shown to increase following exposure to a high-fat diet Reference Hong, Kang, Lee and Yu25 in the fruit fly and also increased in circulation in clinically observed pre-diabetes. Reference Herder, Zierer and Koenig26 The increase in microRNAs targeting TGFβ pathways, observed at 6-, 12- and 17 years of age in this study, could be a potential protective response through inhibitory microRNAs that target the TGFβ pathway. However, the interaction between these microRNAs and TGFβ pathway needs to be confirmed using luciferase reporter assays as well as microRNA knockdown/overexpression studies.
To the best of our knowledge, we are the first to report potential predictive microRNA candidates of pre-diabetes from early childhood, adolescence to adulthood in south Asian women. We observed that microRNA profiles tend to be different at early ages; however, the anthropometric and other clinical/biochemical characteristics at those time points were similar in the study participants. Samples are obtained from a well-characterized multigenerational birth cohort. We used real-time PCR-based microRNA profiling for all known and validated microRNAs instead of selecting candidate microRNAs from previous publications. Such a discovery approach was important for unprejudiced identification of key microRNAs in our cohort as microRNAs may differ with ethnicity, age and sex. Reference Ameling, Kacprowski and Chilukoti27 We used unbiased machine learning analytical methods to remove sampling bias and obtained a set of 17 microRNAs associated with pre-diabetes at 18 years of age. Even though the majority of these microRNAs are not statistically significant (Fig. 1B) in the current set of samples (n = 18), bootstrapping procedures (1000 iterations) identified them as important microRNAs for pre-diabetes risk stratification. Further validation of these microRNAs in the remaining samples will clarify their association with future pre-diabetes risk. In the absence of such machine-learning-based methodologies (LASSO and bootstrapping), we would have missed the majority of these microRNAs that are potential biomarker candidates. It was also interesting to observe variable patterns of microRNA expression at different ages. Almost all of the microRNAs identified to be important at 6 years of age were different than those at 12 years and at 17 years of age. Since microRNA expression is highly dynamic and changes with underlying pathophysiologies and the environment, it is anticipated that their profiles may be very different based on the time points assessed. This, however, remains to be confirmed by profiling remaining PMNS samples.
Fasting glucose alone had low AUCs (0 at 6 years and 0.5 at 12 years) in ROC curve analysis (Table 1). Even though not significant in these smaller sample sets, FPG at 6 and 12 years is known to be a strong predictor of pre-diabetes at 18 years in the PMNS. Reference Yajnik, Bandopadhyay and Bhalerao5 Overall, we think that the microRNAs identified in this preliminary report, along with clinical measurements, will further enhance the prediction for onset of pre-diabetes in this cohort. The small sample size is a limitation, although this was adequately powered to detect the desired effect and addressed by selecting appropriate (LOOCV) techniques for cross-validation. Validation in all remaining individuals (males; 221 NGT and 131 pre-diabetes and females; 203 NGT and 46 pre-diabetes) is planned. This preliminary study also opens future research opportunities to test the potential of microRNAs in determining intergenerational (as well as trans-generational) traits and predisposition to pre-diabetes/T2D in later life.
Supplementary materials
For supplementary material for this article, please visit https://doi.org/10.1017/S2040174422000137
Acknowledgements
We acknowledge participants and their families for supporting this study. Staff at Diabetes Unit for recruitment, patient follow-up and sample collection are greatly appreciated. Infrastructure support from KEM Hospital, D. Y. Patil University, University of Sydney, Western Sydney University and The Rebecca L. Cooper Medical Research Foundation is acknowledged.
Author contributions
Experimental work: MVJ, SNS, RRP, MSK, AAH; data analysis: MVJ, PSK, WKMW; sample collection: DB, CSY; writing: MVJ, PSK, WKMW, CSY, AAH; conceptualisation and funding: CSY, CF, AAH.
Financial support
Fellowship support from Australian Diabetes Society (Skip Martin Award, 2016) and AISRF EMCR fellowship 2018-19 (Australian Academy of Science) to MVJ is acknowledged. AAH is supported by grants from Juvenile Diabetes Research Foundation (JDRF) Australia T1D Clinical Research Network (JDRF/4-CDA2016-228-MB) and Visiting Professorships (2016-18 and 2019-22) from the Danish Diabetes Academy, funded by the Novo Nordisk Foundation, grant number NNF17SA0031406. WKMW is supported through the Leona M. and Harry B. Helmsley Charitable Trust (Grant 2018PG-T1D009) in collaboration with the JDRF Australian Type 1 Diabetes Clinical Research Network funding (Grant 3-SRA-2019-694-M-B to AAH). PMNS was funded by the Wellcome Trust, UK (038128/Z/93, 059609/Z/99, 079877/Z/06/Z, 098575/B/12/Z and 083460/Z/07/Z), MRC, UK (MR/J000094/1) and Department of Biotechnology, GoI (BT/PR-6870/PID/20/268/2005). Between these grants, the study was funded intramurally (KEMHRC). CSY and AAH were visiting professors to the Danish Diabetes Academy (funded by the Novo Nordisk Foundation) when these measurements were made.
Conflicts of interest
None.
Ethical standards
The study was approved by village leaders and the KEM Hospital Research Centre Ethics Committee. Parents gave written consent, children under 18 years of age gave written assent and written consent after reaching 18 years.


