1 Introduction
An analysis of the quasi-linear absorption of the lower hybrid wave (LHW) (mainly in tokamak reactors) is developed starting from a simplified quasi-analytical model to elucidate some features of the absorption that are found in a complete two-dimensional (2-D) approach. The 2-D numerical approach is essentially based on the simultaneous solution of the ray tracing (two-dimensional in space) and the Fokker–Planck equation for the electron species (two dimensions in velocity space). One of the characteristics of the quasi-linear absorption is the main role played by the wave spectrum coupled to the plasma at the edge, which in some conditions can lead to a more efficient penetration of the LH wave in the plasma core (on the outer half-radius) with respect to the less optimistic expectation based on the linear absorption of the wave in tokamak hot plasma reactors (electron Landau damping) (Cardinali et al. Reference Cardinali, Cesario, Panaccione, Santini, Amicucci, Castaldo, Ceccuzzi, Mirizzi and Tuccillo2015, Reference Cardinali, Castaldo, Cesario, Santini, Amicucci, Ceccuzzi, Galli, Mirizzi, Napoli and Panaccione2017; Amicucci et al. Reference Amicucci, Cardinali, Castaldo, Cesario, Galli, Panaccione, Paoletti, Schettini, Spigler and Tuccillo2016).
For many years, starting with Fisch (Fisch Reference Fisch1978, Reference Fisch1979), the LH wave has represented the best manner to induce the non-inductive current drive in a tokamak plasma both in the full current drive approach (replacement of the inductive current of the transformer with the current generated by the LH wave) and in current profile control (off axis), in order to improve the bootstrap localization, suppress the tearing mode and change the
![]() $q$
(safety factor) profile in the so called advanced tokamak operation (in this context see for example the paper by Bonoli et al. (Reference Bonoli, Parker, Porkolab, Ramos, Wukitch, Takase, Bernabei, Hosea, Schilling and Wilson2000)). In a tokamak reactor this last point seems to be unavoidable to control the stability of the plasma and to allow operations in steady state conditions. In a reactor, moreover, the problem that concerns the physics of the radio frequency (RF)-plasma interaction is different with respect to the laboratory tokamak. Until now the interaction between the LHW and the plasma was characterized by the difficulty of justifying the experimental results in the frame of the linear or quasi-linear theory. The increase of the parallel wavenumber via the multi-pass approach (Bonoli & Englade Reference Bonoli and Englade1986) or some nonlinear interaction between the wave and the plasma at the edge (with consequent modification of the spectrum radiated by the antenna), has been invoked to justify the experimental results (Porkolab Reference Porkolab1977; Cesario & Cardinali Reference Cesario and Cardinali1989). In a reactor, owing to the very high electron temperature at the plasma separatrix, the LH wave strongly interacts with the plasma periphery and a strong Landau damping can reduce the power available for efficient current drive in the outer part of the plasma radius. It has been shown (Cardinali et al.
Reference Cardinali, Cesario, Panaccione, Santini, Amicucci, Castaldo, Ceccuzzi, Mirizzi and Tuccillo2015, Reference Cardinali, Castaldo, Cesario, Santini, Amicucci, Ceccuzzi, Galli, Mirizzi, Napoli and Panaccione2017; Amicucci et al.
Reference Amicucci, Cardinali, Castaldo, Cesario, Galli, Panaccione, Paoletti, Schettini, Spigler and Tuccillo2016), that operating on the wave spectrum (by reducing its width), and applying correctly quasi-linear theory, the wave can reach more internal regions and deposit its energy in the outer half-radius of the plasma column. Nevertheless, in a reactor, the presence of
$q$
(safety factor) profile in the so called advanced tokamak operation (in this context see for example the paper by Bonoli et al. (Reference Bonoli, Parker, Porkolab, Ramos, Wukitch, Takase, Bernabei, Hosea, Schilling and Wilson2000)). In a tokamak reactor this last point seems to be unavoidable to control the stability of the plasma and to allow operations in steady state conditions. In a reactor, moreover, the problem that concerns the physics of the radio frequency (RF)-plasma interaction is different with respect to the laboratory tokamak. Until now the interaction between the LHW and the plasma was characterized by the difficulty of justifying the experimental results in the frame of the linear or quasi-linear theory. The increase of the parallel wavenumber via the multi-pass approach (Bonoli & Englade Reference Bonoli and Englade1986) or some nonlinear interaction between the wave and the plasma at the edge (with consequent modification of the spectrum radiated by the antenna), has been invoked to justify the experimental results (Porkolab Reference Porkolab1977; Cesario & Cardinali Reference Cesario and Cardinali1989). In a reactor, owing to the very high electron temperature at the plasma separatrix, the LH wave strongly interacts with the plasma periphery and a strong Landau damping can reduce the power available for efficient current drive in the outer part of the plasma radius. It has been shown (Cardinali et al.
Reference Cardinali, Cesario, Panaccione, Santini, Amicucci, Castaldo, Ceccuzzi, Mirizzi and Tuccillo2015, Reference Cardinali, Castaldo, Cesario, Santini, Amicucci, Ceccuzzi, Galli, Mirizzi, Napoli and Panaccione2017; Amicucci et al.
Reference Amicucci, Cardinali, Castaldo, Cesario, Galli, Panaccione, Paoletti, Schettini, Spigler and Tuccillo2016), that operating on the wave spectrum (by reducing its width), and applying correctly quasi-linear theory, the wave can reach more internal regions and deposit its energy in the outer half-radius of the plasma column. Nevertheless, in a reactor, the presence of
![]() $\unicode[STIX]{x1D6FC}$
-particles everywhere in the plasma with a radial density profile which can be established (Waltz & Bass Reference Waltz and Bass2014) could prevents the LH wave interacting correctly with the electrons in the zone where, without the presence of the
$\unicode[STIX]{x1D6FC}$
-particles everywhere in the plasma with a radial density profile which can be established (Waltz & Bass Reference Waltz and Bass2014) could prevents the LH wave interacting correctly with the electrons in the zone where, without the presence of the
![]() $\unicode[STIX]{x1D6FC}$
population, the interaction is likely expected. The
$\unicode[STIX]{x1D6FC}$
population, the interaction is likely expected. The
![]() $\unicode[STIX]{x1D6FC}$
-particles are characterized by a distribution function called ‘slowing down’ which is very different with from the usual Maxwellian that characterizes the background plasma (electrons and ions). Obviously the
$\unicode[STIX]{x1D6FC}$
-particles are characterized by a distribution function called ‘slowing down’ which is very different with from the usual Maxwellian that characterizes the background plasma (electrons and ions). Obviously the
![]() $\unicode[STIX]{x1D6FC}$
-particle after a sufficient time owing to the collisions with the background electrons and ions (deuterium and tritium in a reactor) thermalizes, but at the steady state, most of the
$\unicode[STIX]{x1D6FC}$
-particle after a sufficient time owing to the collisions with the background electrons and ions (deuterium and tritium in a reactor) thermalizes, but at the steady state, most of the
![]() $\unicode[STIX]{x1D6FC}$
-particles are included in an energy range which goes from the energy 3.5 MeV up to the so-called critical energy
$\unicode[STIX]{x1D6FC}$
-particles are included in an energy range which goes from the energy 3.5 MeV up to the so-called critical energy
![]() ${\approx}1~\text{MeV}$
. Previous studies related to the interaction between LHW and
${\approx}1~\text{MeV}$
. Previous studies related to the interaction between LHW and
![]() $\unicode[STIX]{x1D6FC}$
particles in international thermonuclear experimental reactor (ITER) via a complex numerical tool have been reported (Imbeaux, Peysson & Eriksson Reference Imbeaux, Peysson and Eriksson2003; Schneider et al.
Reference Schneider, Eriksson, Imbeaux and Artaud2009). In this paper we derive the dispersion relation in the electrostatic limit (Hermitian and anti-Hermitian part of the dielectric function) of the lower hybrid wave when dealing with a slowing down distribution function for the
$\unicode[STIX]{x1D6FC}$
particles in international thermonuclear experimental reactor (ITER) via a complex numerical tool have been reported (Imbeaux, Peysson & Eriksson Reference Imbeaux, Peysson and Eriksson2003; Schneider et al.
Reference Schneider, Eriksson, Imbeaux and Artaud2009). In this paper we derive the dispersion relation in the electrostatic limit (Hermitian and anti-Hermitian part of the dielectric function) of the lower hybrid wave when dealing with a slowing down distribution function for the
![]() $\unicode[STIX]{x1D6FC}$
-particles, and compare the quasi-linear damping of the wave on the thermal electrons and ions with the damping on this non-thermal ion population. In fact, unlike what happens in a laboratory plasma, in a reactor, the thermal ions are also able to absorb energy from the wave and hence disturb the current drive efficiency. The density of
$\unicode[STIX]{x1D6FC}$
-particles, and compare the quasi-linear damping of the wave on the thermal electrons and ions with the damping on this non-thermal ion population. In fact, unlike what happens in a laboratory plasma, in a reactor, the thermal ions are also able to absorb energy from the wave and hence disturb the current drive efficiency. The density of
![]() $\unicode[STIX]{x1D6FC}$
-particles at the steady state in a tokamak reactor can be evaluated (Zweben et al.
Reference Zweben, Furth, Mikkelsen, Redi and Strachan1988) by considering the following formula
$\unicode[STIX]{x1D6FC}$
-particles at the steady state in a tokamak reactor can be evaluated (Zweben et al.
Reference Zweben, Furth, Mikkelsen, Redi and Strachan1988) by considering the following formula
![]() $n_{\unicode[STIX]{x1D6FC}}\sim S\cdot \unicode[STIX]{x1D70F}$
, where
$n_{\unicode[STIX]{x1D6FC}}\sim S\cdot \unicode[STIX]{x1D70F}$
, where
![]() $S$
is the reaction rate and
$S$
is the reaction rate and
![]() $\unicode[STIX]{x1D70F}$
is the slowing down time (the characteristic time in which the
$\unicode[STIX]{x1D70F}$
is the slowing down time (the characteristic time in which the
![]() $\unicode[STIX]{x1D6FC}$
-particles thermalize). Considering that
$\unicode[STIX]{x1D6FC}$
-particles thermalize). Considering that
![]() $S$
scales like
$S$
scales like
![]() $S\sim n^{2}T_{i}^{2}$
and
$S\sim n^{2}T_{i}^{2}$
and
![]() $\unicode[STIX]{x1D70F}\sim T_{e}^{3/2}n^{-1}$
we have that
$\unicode[STIX]{x1D70F}\sim T_{e}^{3/2}n^{-1}$
we have that
![]() $n_{\unicode[STIX]{x1D6FC}}$
scales like
$n_{\unicode[STIX]{x1D6FC}}$
scales like
![]() $n_{\unicode[STIX]{x1D6FC}}\sim nT_{i}^{2}T_{e}^{3/2}$
. In order to inspect the basic mechanism of the propagation and absorption of the LH wave in the reactor plasma environment and unveiling the physics of the wave–plasma interaction, analytical calculation of the propagation and quasi-linear damping of the LH in a simplified approach is the framework for a more sophisticated numerical code in which these effects are considered without approximation. The approximations we will use in our analytical approach rely on (i) 1-D quasi-linear Fokker–Planck solution for the
$n_{\unicode[STIX]{x1D6FC}}\sim nT_{i}^{2}T_{e}^{3/2}$
. In order to inspect the basic mechanism of the propagation and absorption of the LH wave in the reactor plasma environment and unveiling the physics of the wave–plasma interaction, analytical calculation of the propagation and quasi-linear damping of the LH in a simplified approach is the framework for a more sophisticated numerical code in which these effects are considered without approximation. The approximations we will use in our analytical approach rely on (i) 1-D quasi-linear Fokker–Planck solution for the
![]() $\unicode[STIX]{x1D6FC}$
, ion and electron distribution function, (ii) electrostatic limit of the LH dispersion relation and (iii) 1-D ray-tracing analytical solution. In § 2 a simplified set of ray-tracing equations (in a toroidal geometry) for the wave phase and power damping along the trajectory is derived and solved when taking into account for the power-damping rate the imaginary part of the dielectric function for a general particle distribution function. In § 3 the Fokker–Planck equation for
$\unicode[STIX]{x1D6FC}$
, ion and electron distribution function, (ii) electrostatic limit of the LH dispersion relation and (iii) 1-D ray-tracing analytical solution. In § 2 a simplified set of ray-tracing equations (in a toroidal geometry) for the wave phase and power damping along the trajectory is derived and solved when taking into account for the power-damping rate the imaginary part of the dielectric function for a general particle distribution function. In § 3 the Fokker–Planck equation for
![]() $\unicode[STIX]{x1D6FC}$
-particles, thermal ions and electrons in the presence of a quasi-linear diffusion term (only for electrons and ions), due to the electric field of the LHW, is derived and solved, and the various examples of the (non-Maxwellian) damping rate are discussed. The combined solution of the ray-tracing and Fokker–Planck equations allows us to get the quasi-linear deposition profiles of the LH power over the various species. Application of this scheme to the plasma parameters of the demonstration power station (DEMO) reactor (given in § 4) enables us to establish if the power coupled by the antenna at the plasma edge is able to reach the internal layers of the plasma (beyond the pedestal) where it is absorbed by the electron species and will generate current in layers that are relevant for plasma stabilization and advanced scenarios. Different advanced scenarios range from (i) plasmas that sustain a central region with a flat current density profile (zero magnetic shear), capable of stationary operation at high plasma pressure, to (ii) discharges with an off axis maximum of the current density profile (reversed magnetic shear in the core), able to form internal transport barriers and to increase the confinement of the plasma. Finally in § 5 conclusions are given.
$\unicode[STIX]{x1D6FC}$
-particles, thermal ions and electrons in the presence of a quasi-linear diffusion term (only for electrons and ions), due to the electric field of the LHW, is derived and solved, and the various examples of the (non-Maxwellian) damping rate are discussed. The combined solution of the ray-tracing and Fokker–Planck equations allows us to get the quasi-linear deposition profiles of the LH power over the various species. Application of this scheme to the plasma parameters of the demonstration power station (DEMO) reactor (given in § 4) enables us to establish if the power coupled by the antenna at the plasma edge is able to reach the internal layers of the plasma (beyond the pedestal) where it is absorbed by the electron species and will generate current in layers that are relevant for plasma stabilization and advanced scenarios. Different advanced scenarios range from (i) plasmas that sustain a central region with a flat current density profile (zero magnetic shear), capable of stationary operation at high plasma pressure, to (ii) discharges with an off axis maximum of the current density profile (reversed magnetic shear in the core), able to form internal transport barriers and to increase the confinement of the plasma. Finally in § 5 conclusions are given.
2 Analytical solution of the ray-tracing and power-damping rate equations
In the Eikonal approximation of the wave equation for the lower hybrid frequency domain, widely investigated in the past (Bernstein Reference Bernstein1975; Brambilla & Cardinali Reference Brambilla and Cardinali1982, and more recently by Peysson, Decker & Morini (Reference Peysson, Decker and Morini2012) for combined LHW and electron cyclotron resonance heating (ECRH) schemes), the characteristics of the wave propagation are related essentially to the real part of the dielectric function
![]() $\unicode[STIX]{x1D700}=1+\sum _{s=i,e,\unicode[STIX]{x1D6FC}}\unicode[STIX]{x1D712}_{s}$
(in the electrostatic approximation) while the dissipation is related to the imaginary part, having supposed that
$\unicode[STIX]{x1D700}=1+\sum _{s=i,e,\unicode[STIX]{x1D6FC}}\unicode[STIX]{x1D712}_{s}$
(in the electrostatic approximation) while the dissipation is related to the imaginary part, having supposed that
![]() $\unicode[STIX]{x1D712}_{s}^{\text{Im}}\ll \unicode[STIX]{x1D712}_{s}^{\text{Re}}$
, and
$\unicode[STIX]{x1D712}_{s}^{\text{Im}}\ll \unicode[STIX]{x1D712}_{s}^{\text{Re}}$
, and
![]() $\unicode[STIX]{x1D712}_{s}$
is the susceptibility of the species ‘
$\unicode[STIX]{x1D712}_{s}$
is the susceptibility of the species ‘
![]() $s$
’. The use of the longitudinal approximation is well justified for the LH wave, and this approximation makes the analytical calculations much easier without taking anything away from physics. This is true in our case because we are dealing with the propagation of the LH wave at the first pass in a high density plasma i.e.
$s$
’. The use of the longitudinal approximation is well justified for the LH wave, and this approximation makes the analytical calculations much easier without taking anything away from physics. This is true in our case because we are dealing with the propagation of the LH wave at the first pass in a high density plasma i.e.
![]() $n_{\bot }\gg n_{\Vert }\gg S$
, and we are guessing that the power spectrum is imposed at the first closed magnetic surface without being interested in calculating the wave coupling for which the electromagnetic model shows to be essential for a correct description of the process. In space, the LH wave propagation is thus ruled by the so-called ray-tracing equations, i.e. a coupled set of ordinary differential equations for space and the wave vector:
$n_{\bot }\gg n_{\Vert }\gg S$
, and we are guessing that the power spectrum is imposed at the first closed magnetic surface without being interested in calculating the wave coupling for which the electromagnetic model shows to be essential for a correct description of the process. In space, the LH wave propagation is thus ruled by the so-called ray-tracing equations, i.e. a coupled set of ordinary differential equations for space and the wave vector:
(where
![]() $\boldsymbol{k}$
is the wavevector and
$\boldsymbol{k}$
is the wavevector and
![]() $\unicode[STIX]{x1D714}$
is the wave frequency) whose solution ‘traces’ a line in the physical space confining the plasma (in our case the tokamak is well described by a toroidal geometry). The dissipation of the wave can be calculated by adding the equations for the damping rate along the trajectory,
$\unicode[STIX]{x1D714}$
is the wave frequency) whose solution ‘traces’ a line in the physical space confining the plasma (in our case the tokamak is well described by a toroidal geometry). The dissipation of the wave can be calculated by adding the equations for the damping rate along the trajectory,
where
![]() $P_{j}$
is the normalized power associated with the
$P_{j}$
is the normalized power associated with the
![]() $j$
th component of the power spectrum (see below), and
$j$
th component of the power spectrum (see below), and
![]() $\unicode[STIX]{x1D6FE}=-\unicode[STIX]{x1D700}^{\text{Im}}/(\unicode[STIX]{x2202}\unicode[STIX]{x1D700}^{\text{Re}}/\unicode[STIX]{x2202}\unicode[STIX]{x1D714})$
is the damping factor;
$\unicode[STIX]{x1D6FE}=-\unicode[STIX]{x1D700}^{\text{Im}}/(\unicode[STIX]{x2202}\unicode[STIX]{x1D700}^{\text{Re}}/\unicode[STIX]{x2202}\unicode[STIX]{x1D714})$
is the damping factor;
![]() $\unicode[STIX]{x1D700}^{\text{Re}}$
and
$\unicode[STIX]{x1D700}^{\text{Re}}$
and
![]() $\unicode[STIX]{x1D700}^{\text{Im}}$
are the real and imaginary parts, respectively, of the complex dielectric function whose general formulae (in terms of the equilibrium distribution function) can be easily found in several text-books related to plasma physics (see for example Swanson (Reference Swanson2003, p. 154) and/or Brambilla (Reference Brambilla1998, p. 324) for magnetized and unmagnetized (isotropic) cases. Obviously, when the wave does not affect the plasma, the Fokker–Planck equation for the distribution function gives, at the equilibrium, the Maxwellian solution (at least for background electrons and ions, and the slowing down solution for the
$\unicode[STIX]{x1D700}^{\text{Im}}$
are the real and imaginary parts, respectively, of the complex dielectric function whose general formulae (in terms of the equilibrium distribution function) can be easily found in several text-books related to plasma physics (see for example Swanson (Reference Swanson2003, p. 154) and/or Brambilla (Reference Brambilla1998, p. 324) for magnetized and unmagnetized (isotropic) cases. Obviously, when the wave does not affect the plasma, the Fokker–Planck equation for the distribution function gives, at the equilibrium, the Maxwellian solution (at least for background electrons and ions, and the slowing down solution for the
![]() $\unicode[STIX]{x1D6FC}$
-particles), the dielectric function (and the related dispersion relation) in the cold plasma limit becomes
$\unicode[STIX]{x1D6FC}$
-particles), the dielectric function (and the related dispersion relation) in the cold plasma limit becomes
The real part of the dielectric function in the limit of a cold plasma is used in the ray-tracing equations above: equations (2.1). By making this approximation (cold plasma) we are supposing that the temperature effects are not essential in describing the propagation characteristics of the LH wave. Concerning the absorption, when solving (2.2), we must use the formulae which give
![]() $\unicode[STIX]{x1D700}^{\text{Im}}$
, which depends on the distribution function. This means that simultaneously with the system of equations (2.1)–(2.2) we are obliged to solve also the Fokker–Planck equation (for each species composing the plasma) to correctly account for the so-called quasi-linear damping of the LH wave. Calculation of the imaginary part of the dielectric function becomes straightforward in the simple case of linear damping, when dealing with a Maxwellian distribution function, while for the quasilinear damping the solution of the Fokker–Planck equation is required (see formulae for electrons (magnetized) ions and alpha particles (unmagnetized) in § 3). Equation (2.2) can be integrated together with ray trajectories (2.1), and the linear or quasi-linear damping of the wave can be accounted for. In (2.2)
$\unicode[STIX]{x1D700}^{\text{Im}}$
, which depends on the distribution function. This means that simultaneously with the system of equations (2.1)–(2.2) we are obliged to solve also the Fokker–Planck equation (for each species composing the plasma) to correctly account for the so-called quasi-linear damping of the LH wave. Calculation of the imaginary part of the dielectric function becomes straightforward in the simple case of linear damping, when dealing with a Maxwellian distribution function, while for the quasilinear damping the solution of the Fokker–Planck equation is required (see formulae for electrons (magnetized) ions and alpha particles (unmagnetized) in § 3). Equation (2.2) can be integrated together with ray trajectories (2.1), and the linear or quasi-linear damping of the wave can be accounted for. In (2.2)
![]() $P_{j}$
is the power associated with the
$P_{j}$
is the power associated with the
![]() $j$
th ray composing the power spectrum radiated by the antenna, to reconstruct the global power we must integrate (2.2) for several rays and the following holds:
$j$
th ray composing the power spectrum radiated by the antenna, to reconstruct the global power we must integrate (2.2) for several rays and the following holds:
![]() $\int _{-\infty }^{+\infty }\,\text{d}n_{\Vert }\,\hat{P}(n_{\Vert },\boldsymbol{r})=\sum _{j=1}^{N}\hat{P}_{j}=P_{\text{total}}/P_{0}=1$
. Assuming that the physics of the wave propagation is essentially ruled by the background plasma of electrons and ion, and that the
$\int _{-\infty }^{+\infty }\,\text{d}n_{\Vert }\,\hat{P}(n_{\Vert },\boldsymbol{r})=\sum _{j=1}^{N}\hat{P}_{j}=P_{\text{total}}/P_{0}=1$
. Assuming that the physics of the wave propagation is essentially ruled by the background plasma of electrons and ion, and that the
![]() $\unicode[STIX]{x1D6FC}$
-particles distribution does not affect too much the real part of the dielectric function (owing to the very low fraction of
$\unicode[STIX]{x1D6FC}$
-particles distribution does not affect too much the real part of the dielectric function (owing to the very low fraction of
![]() $\unicode[STIX]{x1D6FC}$
particles present in the plasma at the steady state
$\unicode[STIX]{x1D6FC}$
particles present in the plasma at the steady state
![]() ${\leqslant}1\,\%$
) we are able to perform the integration of the ray-tracing equations (2.1), using a toroidal geometry
${\leqslant}1\,\%$
) we are able to perform the integration of the ray-tracing equations (2.1), using a toroidal geometry
![]() $(\unicode[STIX]{x1D713},\unicode[STIX]{x1D703},\unicode[STIX]{x1D719})$
and the conjugate wave vector
$(\unicode[STIX]{x1D713},\unicode[STIX]{x1D703},\unicode[STIX]{x1D719})$
and the conjugate wave vector
![]() $(k_{\unicode[STIX]{x1D713}},m_{\unicode[STIX]{x1D703}},n_{\unicode[STIX]{x1D719}})$
. To obtain a suitable analytical solution (Cardinali et al.
Reference Cardinali, Morini, Castaldo, Cesario and Zonca2007) we can make the hypothesis that the density is flat and the variation of the confined magnetic field can be neglected (cylindrical limit). This last hypothesis is reasonable because as is well known, the propagation of the LHW in a reactor plasma is a first pass propagation and the absorption of the power in any case concerns only the outer half-radius of the plasma. By using these approximations the ray-tracing equations can be written and solved by quadrature. Far from singularity, cutoffs and reflections (good approximations for LH propagation in a tokamak reactor), and considering
$(k_{\unicode[STIX]{x1D713}},m_{\unicode[STIX]{x1D703}},n_{\unicode[STIX]{x1D719}})$
. To obtain a suitable analytical solution (Cardinali et al.
Reference Cardinali, Morini, Castaldo, Cesario and Zonca2007) we can make the hypothesis that the density is flat and the variation of the confined magnetic field can be neglected (cylindrical limit). This last hypothesis is reasonable because as is well known, the propagation of the LHW in a reactor plasma is a first pass propagation and the absorption of the power in any case concerns only the outer half-radius of the plasma. By using these approximations the ray-tracing equations can be written and solved by quadrature. Far from singularity, cutoffs and reflections (good approximations for LH propagation in a tokamak reactor), and considering
![]() $n_{\unicode[STIX]{x1D719}}=\text{const.}$
(constant of motion), removing the equation for
$n_{\unicode[STIX]{x1D719}}=\text{const.}$
(constant of motion), removing the equation for
![]() $k_{\unicode[STIX]{x1D713}}$
by using the dispersion relation (2.3)
$k_{\unicode[STIX]{x1D713}}$
by using the dispersion relation (2.3)
![]() $k_{\unicode[STIX]{x1D713}}=\sqrt{-k_{\unicode[STIX]{x1D712}}^{2}-(\unicode[STIX]{x1D700}_{zz}/\unicode[STIX]{x1D700}_{xx})k_{\Vert }^{2}}$
and using
$k_{\unicode[STIX]{x1D713}}=\sqrt{-k_{\unicode[STIX]{x1D712}}^{2}-(\unicode[STIX]{x1D700}_{zz}/\unicode[STIX]{x1D700}_{xx})k_{\Vert }^{2}}$
and using
![]() $r=a\sqrt{\unicode[STIX]{x1D713}/\unicode[STIX]{x1D713}_{0}}$
(
$r=a\sqrt{\unicode[STIX]{x1D713}/\unicode[STIX]{x1D713}_{0}}$
(
![]() $\unicode[STIX]{x1D713}$
is the poloidal flux function, and
$\unicode[STIX]{x1D713}$
is the poloidal flux function, and
![]() $a$
is the plasma radius) for the independent variable we have
$a$
is the plasma radius) for the independent variable we have
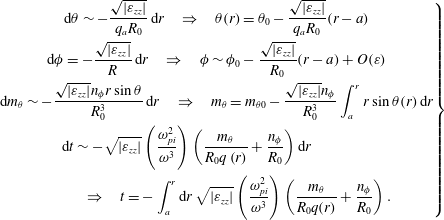 $$\begin{eqnarray}\left.\begin{array}{@{}c@{}}\displaystyle \text{d}\unicode[STIX]{x1D703}\sim -\frac{\sqrt{|\unicode[STIX]{x1D700}_{zz}|}}{q_{a}R_{0}}\,\text{d}r\quad \Rightarrow \quad \unicode[STIX]{x1D703}(r)=\unicode[STIX]{x1D703}_{0}-\frac{\sqrt{|\unicode[STIX]{x1D700}_{zz}|}}{q_{a}R_{0}}(r-a)\\ \displaystyle \text{d}\unicode[STIX]{x1D719}=-\frac{\sqrt{|\unicode[STIX]{x1D700}_{zz}|}}{R}\,\text{d}r\quad \Rightarrow \quad \unicode[STIX]{x1D719}\sim \unicode[STIX]{x1D719}_{0}-\frac{\sqrt{|\unicode[STIX]{x1D700}_{zz}|}}{R_{0}}(r-a)+O(\unicode[STIX]{x1D700})\\ \displaystyle \text{d}m_{\unicode[STIX]{x1D703}}\sim -\frac{\sqrt{|\unicode[STIX]{x1D700}_{zz}|}n_{\unicode[STIX]{x1D719}}r\sin \unicode[STIX]{x1D703}}{R_{0}^{3}}\,\text{d}r\quad \Rightarrow \quad m_{\unicode[STIX]{x1D703}}=m_{\unicode[STIX]{x1D703}0}-\frac{\sqrt{|\unicode[STIX]{x1D700}_{zz}|}n_{\unicode[STIX]{x1D719}}}{R_{0}^{3}}\int _{a}^{r}r\sin \unicode[STIX]{x1D703}(r)\,\text{d}r\\ \displaystyle \text{d}t\sim -\sqrt{|\unicode[STIX]{x1D700}_{zz}|}\left(\frac{\unicode[STIX]{x1D714}_{pi}^{2}}{\unicode[STIX]{x1D714}^{3}}\right)\left(\frac{m_{\unicode[STIX]{x1D703}}}{R_{0}q\left(r\right)}+\frac{n_{\unicode[STIX]{x1D719}}}{R_{0}}\right)\text{d}r\qquad \qquad \\ \qquad \quad \Rightarrow \quad \displaystyle t=-\int _{a}^{r}\text{d}r\,\sqrt{|\unicode[STIX]{x1D700}_{zz}|}\left(\frac{\unicode[STIX]{x1D714}_{pi}^{2}}{\unicode[STIX]{x1D714}^{3}}\right)\left(\frac{m_{\unicode[STIX]{x1D703}}}{R_{0}q(r)}+\frac{n_{\unicode[STIX]{x1D719}}}{R_{0}}\right).\end{array}\right\}\end{eqnarray}$$
In solving (2.4) we have also used the approximation
![]() $\unicode[STIX]{x1D700}_{zz}\sim -(\unicode[STIX]{x1D714}_{pe}^{2}/\unicode[STIX]{x1D714}^{2})\unicode[STIX]{x1D700}_{xx}\sim 1$
and the definition of
$\unicode[STIX]{x1D700}_{zz}\sim -(\unicode[STIX]{x1D714}_{pe}^{2}/\unicode[STIX]{x1D714}^{2})\unicode[STIX]{x1D700}_{xx}\sim 1$
and the definition of
![]() $k_{\unicode[STIX]{x1D712}}\sim m_{\unicode[STIX]{x1D703}}/r-n_{\unicode[STIX]{x1D719}}r/R_{0}^{2}q(r)$
, and
$k_{\unicode[STIX]{x1D712}}\sim m_{\unicode[STIX]{x1D703}}/r-n_{\unicode[STIX]{x1D719}}r/R_{0}^{2}q(r)$
, and
![]() $k_{\Vert }\sim m_{\unicode[STIX]{x1D703}}/R_{0}q(r)+n_{\unicode[STIX]{x1D719}}/R_{0}$
, and
$k_{\Vert }\sim m_{\unicode[STIX]{x1D703}}/R_{0}q(r)+n_{\unicode[STIX]{x1D719}}/R_{0}$
, and
![]() $q(r)=(r/R_{0})(B_{0}/B_{\unicode[STIX]{x1D703}}(r))$
the safety factor.
$q(r)=(r/R_{0})(B_{0}/B_{\unicode[STIX]{x1D703}}(r))$
the safety factor.
Equation (2.2) can be re-written as
and it must be supplemented by the equation for
![]() $\unicode[STIX]{x1D700}^{\text{Im}}$
.
$\unicode[STIX]{x1D700}^{\text{Im}}$
.
The solution of (2.5) requires the computation of the damping rate associated with a single ray that contributes to the power spectrum. If we are interested to the linear damping rate the solution of (2.5) is immediate and it reduces to a simple quadrature by inserting the definition of
![]() $\unicode[STIX]{x1D700}^{\text{Im}}$
that for background electrons and ions is:
$\unicode[STIX]{x1D700}^{\text{Im}}$
that for background electrons and ions is:
 $$\begin{eqnarray}\left.\begin{array}{@{}c@{}}\displaystyle \unicode[STIX]{x1D700}_{e}^{\text{Im}}=\unicode[STIX]{x1D712}_{e}^{\text{Im}}=-\sqrt{\frac{\unicode[STIX]{x03C0}}{2}}\frac{\unicode[STIX]{x1D714}_{pe}^{2}}{k^{2}v_{the}^{2}}\left(\frac{\unicode[STIX]{x1D714}}{k_{\Vert }v_{the}}\right)\text{e}^{-\unicode[STIX]{x1D714}^{2}/2k_{\Vert }^{2}v_{the}^{2}}\\ \displaystyle \unicode[STIX]{x1D700}_{i}^{\text{Im}}=\unicode[STIX]{x1D712}_{i}^{\text{Im}}=-\sqrt{\frac{\unicode[STIX]{x03C0}}{2}}\frac{\unicode[STIX]{x1D714}_{pi}^{2}}{k^{2}v_{thi}^{2}}\left(\frac{\unicode[STIX]{x1D714}}{k_{\bot }v_{thi}}\right)^{3}\text{e}^{-\unicode[STIX]{x1D714}^{2}/2k_{\bot }^{2}v_{thi}^{2}}.\end{array}\right\}\end{eqnarray}$$
The damping rate, in the quasi-linear approximation, instead, depends on the distribution function as resulting from the plasma–wave interaction, and concerning the
![]() $\unicode[STIX]{x1D6FC}$
-particle population, on the distribution function called ‘slowing down’ which characterizes the
$\unicode[STIX]{x1D6FC}$
-particle population, on the distribution function called ‘slowing down’ which characterizes the
![]() $\unicode[STIX]{x1D6FC}$
-particle dynamics. In turn the distribution function is the outcome of the integration of the quasi-linear Fokker–Planck equation and depends on the wave power itself via the quasi-linear diffusion coefficient. In the § 3 the general form of the dielectric function (real and imaginary part) is deduced for a general distribution function and in the case of magnetized electrons and un-magnetized ions (thermal and
$\unicode[STIX]{x1D6FC}$
-particle dynamics. In turn the distribution function is the outcome of the integration of the quasi-linear Fokker–Planck equation and depends on the wave power itself via the quasi-linear diffusion coefficient. In the § 3 the general form of the dielectric function (real and imaginary part) is deduced for a general distribution function and in the case of magnetized electrons and un-magnetized ions (thermal and
![]() $\unicode[STIX]{x1D6FC}$
-particle ions).
$\unicode[STIX]{x1D6FC}$
-particle ions).
3 Solution of 1-D quasi-linear Fokker–Planck equation for the
 $\unicode[STIX]{x1D6FC}$
, bulk ion (i) and electron (e) distribution functions
In order to specify the dielectric function, written in terms of a general distribution function, we must solve the steady state quasi-linear Fokker–Planck equation for the
![]() $\unicode[STIX]{x1D6FC}$
, ion and electron populations forming a plasma at thermonuclear conditions and that accounts for wave–plasma interaction. The wave in fact interacting with the plasma tends to distort the distribution function, causing deviating from the Maxwellian (at the equilibrium) and generating, for example, a flat tail in a certain velocity range as in the case of electron–wave interaction or forming a plasma characterized by an effective temperature much higher than the nominal reference temperature as in the case of the ion–wave interaction. In the case of the
$\unicode[STIX]{x1D6FC}$
, ion and electron populations forming a plasma at thermonuclear conditions and that accounts for wave–plasma interaction. The wave in fact interacting with the plasma tends to distort the distribution function, causing deviating from the Maxwellian (at the equilibrium) and generating, for example, a flat tail in a certain velocity range as in the case of electron–wave interaction or forming a plasma characterized by an effective temperature much higher than the nominal reference temperature as in the case of the ion–wave interaction. In the case of the
![]() $\unicode[STIX]{x1D6FC}$
population, we limit ourselves, in the present analysis, to considering only the slowing down distribution function omitting, in the Fokker–Planck equation, the quasi-linear term. A parametric study of the Fokker–Planck equation in the presence of a quasi-linear term, was given, in a very simplified form, in Barbato & Santini (Reference Barbato and Santini1991), Barbato & Saveliev (Reference Barbato and Saveliev2004), and we will come back on this problem in a subsequent paper. In the following analysis we treat the problem of deriving the distribution function by starting from the
$\unicode[STIX]{x1D6FC}$
population, we limit ourselves, in the present analysis, to considering only the slowing down distribution function omitting, in the Fokker–Planck equation, the quasi-linear term. A parametric study of the Fokker–Planck equation in the presence of a quasi-linear term, was given, in a very simplified form, in Barbato & Santini (Reference Barbato and Santini1991), Barbato & Saveliev (Reference Barbato and Saveliev2004), and we will come back on this problem in a subsequent paper. In the following analysis we treat the problem of deriving the distribution function by starting from the
![]() $\unicode[STIX]{x1D6FC}$
-particles.
$\unicode[STIX]{x1D6FC}$
-particles.
3.1 Slowing down
 $\unicode[STIX]{x1D6FC}$
-particle distribution function
The 2-D Fokker–Planck equation without the quasi-linear term (a much simpler 1-D solution with the inclusion of the quasi-linear terms can be found in Fisch & Rax (Reference Fisch and Rax1992)) for the
![]() $\unicode[STIX]{x1D6FC}$
-particles can be written as
$\unicode[STIX]{x1D6FC}$
-particles can be written as
where the collisional operator is
 $$\begin{eqnarray}\left.\begin{array}{@{}c@{}}\displaystyle S_{v}=\mathop{\sum }_{s=i,e}S_{v}^{\unicode[STIX]{x1D6FC},s}=-\frac{\unicode[STIX]{x1D6E4}^{\unicode[STIX]{x1D6FC},s}}{2}\unicode[STIX]{x1D6F7}(u)\left(\frac{1}{v}\frac{\unicode[STIX]{x2202}f_{\unicode[STIX]{x1D6FC}}}{\unicode[STIX]{x2202}v}+\frac{m_{\unicode[STIX]{x1D6FC}}}{v_{ths}^{2}m_{s}}f_{\unicode[STIX]{x1D6FC}}\right)\\ \displaystyle S_{\unicode[STIX]{x1D707}}=\mathop{\sum }_{s=i,e}S_{\unicode[STIX]{x1D707}}^{\unicode[STIX]{x1D6FC},s}=\frac{\unicode[STIX]{x1D6E4}^{\unicode[STIX]{x1D6FC},s}(1-\unicode[STIX]{x1D707}^{2})^{1/2}}{4v^{2}}[2\text{erf}(u)-\unicode[STIX]{x1D6F7}(u)]\frac{\unicode[STIX]{x2202}f_{\unicode[STIX]{x1D6FC}}}{\unicode[STIX]{x2202}\unicode[STIX]{x1D707}}\end{array}\right\}\end{eqnarray}$$
and
![]() $\unicode[STIX]{x1D6E4}^{\unicode[STIX]{x1D6FC},s}=4\unicode[STIX]{x03C0}n_{s}q_{\unicode[STIX]{x1D6FC}}^{2}q_{s}^{2}\ln \unicode[STIX]{x1D6EC}^{\unicode[STIX]{x1D6FC},s}/m_{\unicode[STIX]{x1D6FC}}^{2}$
,
$\unicode[STIX]{x1D6E4}^{\unicode[STIX]{x1D6FC},s}=4\unicode[STIX]{x03C0}n_{s}q_{\unicode[STIX]{x1D6FC}}^{2}q_{s}^{2}\ln \unicode[STIX]{x1D6EC}^{\unicode[STIX]{x1D6FC},s}/m_{\unicode[STIX]{x1D6FC}}^{2}$
,
![]() $\ln \unicode[STIX]{x1D6EC}^{\unicode[STIX]{x1D6FC},s}$
is the Coulomb logarithm,
$\ln \unicode[STIX]{x1D6EC}^{\unicode[STIX]{x1D6FC},s}$
is the Coulomb logarithm,
![]() $\unicode[STIX]{x1D6F7}(u)=[\text{erf}(u)-u\text{erf}^{\prime }(u)/u^{2}]$
,
$\unicode[STIX]{x1D6F7}(u)=[\text{erf}(u)-u\text{erf}^{\prime }(u)/u^{2}]$
,
![]() $u=v/\sqrt{2}v_{ths}$
is the normalized (to the thermal velocity of species s
$u=v/\sqrt{2}v_{ths}$
is the normalized (to the thermal velocity of species s
![]() $v_{ths}=\sqrt{\unicode[STIX]{x1D705}T_{s}/m_{s}}$
) velocity,
$v_{ths}=\sqrt{\unicode[STIX]{x1D705}T_{s}/m_{s}}$
) velocity,
![]() $S_{\unicode[STIX]{x1D6FC}}=(n_{e}^{2}\langle \unicode[STIX]{x1D70E}v\rangle )/4$
, is the reaction rate for D-T reaction and the reactivity
$S_{\unicode[STIX]{x1D6FC}}=(n_{e}^{2}\langle \unicode[STIX]{x1D70E}v\rangle )/4$
, is the reaction rate for D-T reaction and the reactivity
![]() $\langle \unicode[STIX]{x1D70E}v\rangle$
can be approximated by
$\langle \unicode[STIX]{x1D70E}v\rangle$
can be approximated by
![]() $\langle \unicode[STIX]{x1D70E}v\rangle \approx 1.1\times 10^{-18}T_{keV}^{2}~\text{cm}^{3}~\text{s}^{-1}$
. The parameter
$\langle \unicode[STIX]{x1D70E}v\rangle \approx 1.1\times 10^{-18}T_{keV}^{2}~\text{cm}^{3}~\text{s}^{-1}$
. The parameter
![]() $\unicode[STIX]{x1D70F}_{\unicode[STIX]{x1D6FC}}$
is a parameter representing the confinement time of the
$\unicode[STIX]{x1D70F}_{\unicode[STIX]{x1D6FC}}$
is a parameter representing the confinement time of the
![]() $\unicode[STIX]{x1D6FC}$
particles, which can be represented as a simple function of the energy
$\unicode[STIX]{x1D6FC}$
particles, which can be represented as a simple function of the energy
![]() $\unicode[STIX]{x1D70F}_{\unicode[STIX]{x1D6FC}}\propto E^{-l}$
, and
$\unicode[STIX]{x1D70F}_{\unicode[STIX]{x1D6FC}}\propto E^{-l}$
, and
![]() $\unicode[STIX]{x1D6FF}(v-v_{\text{birth}})\unicode[STIX]{x1D6FF}(\unicode[STIX]{x1D707}-\unicode[STIX]{x1D707}_{0})$
are the Dirac delta functions. At the steady state and considering the
$\unicode[STIX]{x1D6FF}(v-v_{\text{birth}})\unicode[STIX]{x1D6FF}(\unicode[STIX]{x1D707}-\unicode[STIX]{x1D707}_{0})$
are the Dirac delta functions. At the steady state and considering the
![]() $\unicode[STIX]{x1D6FC}$
-particles to be well confined
$\unicode[STIX]{x1D6FC}$
-particles to be well confined
![]() $(\unicode[STIX]{x1D70F}_{\unicode[STIX]{x1D6FC}}\rightarrow \infty )$
, and
$(\unicode[STIX]{x1D70F}_{\unicode[STIX]{x1D6FC}}\rightarrow \infty )$
, and
![]() $v_{thi}\ll v\ll v_{the}$
the solution is the well-known ‘slowing down’ that can be written as (Graffey Reference Graffey1976)
$v_{thi}\ll v\ll v_{the}$
the solution is the well-known ‘slowing down’ that can be written as (Graffey Reference Graffey1976)
 $$\begin{eqnarray}\displaystyle f_{\unicode[STIX]{x1D6FC}}(v,\unicode[STIX]{x1D707}) & = & \displaystyle \frac{n_{\unicode[STIX]{x1D6FC}}C}{(v^{3}+v_{c}^{3})}\mathop{\sum }_{n=0}^{\infty }\left(\frac{2n+1}{2}\right)P_{n}(\unicode[STIX]{x1D707})P_{n}(\unicode[STIX]{x1D707}_{0})\nonumber\\ \displaystyle & & \displaystyle \times \,\left[\frac{v^{3}}{v_{\text{birth}}^{3}}\left(\frac{v_{\text{birth}}^{3}+v_{c}^{3}}{v^{3}+v_{c}^{3}}\right)\right]^{(n\left(n+1\right)/6)Z_{2}}H(v_{\text{birth}}-v),\end{eqnarray}$$
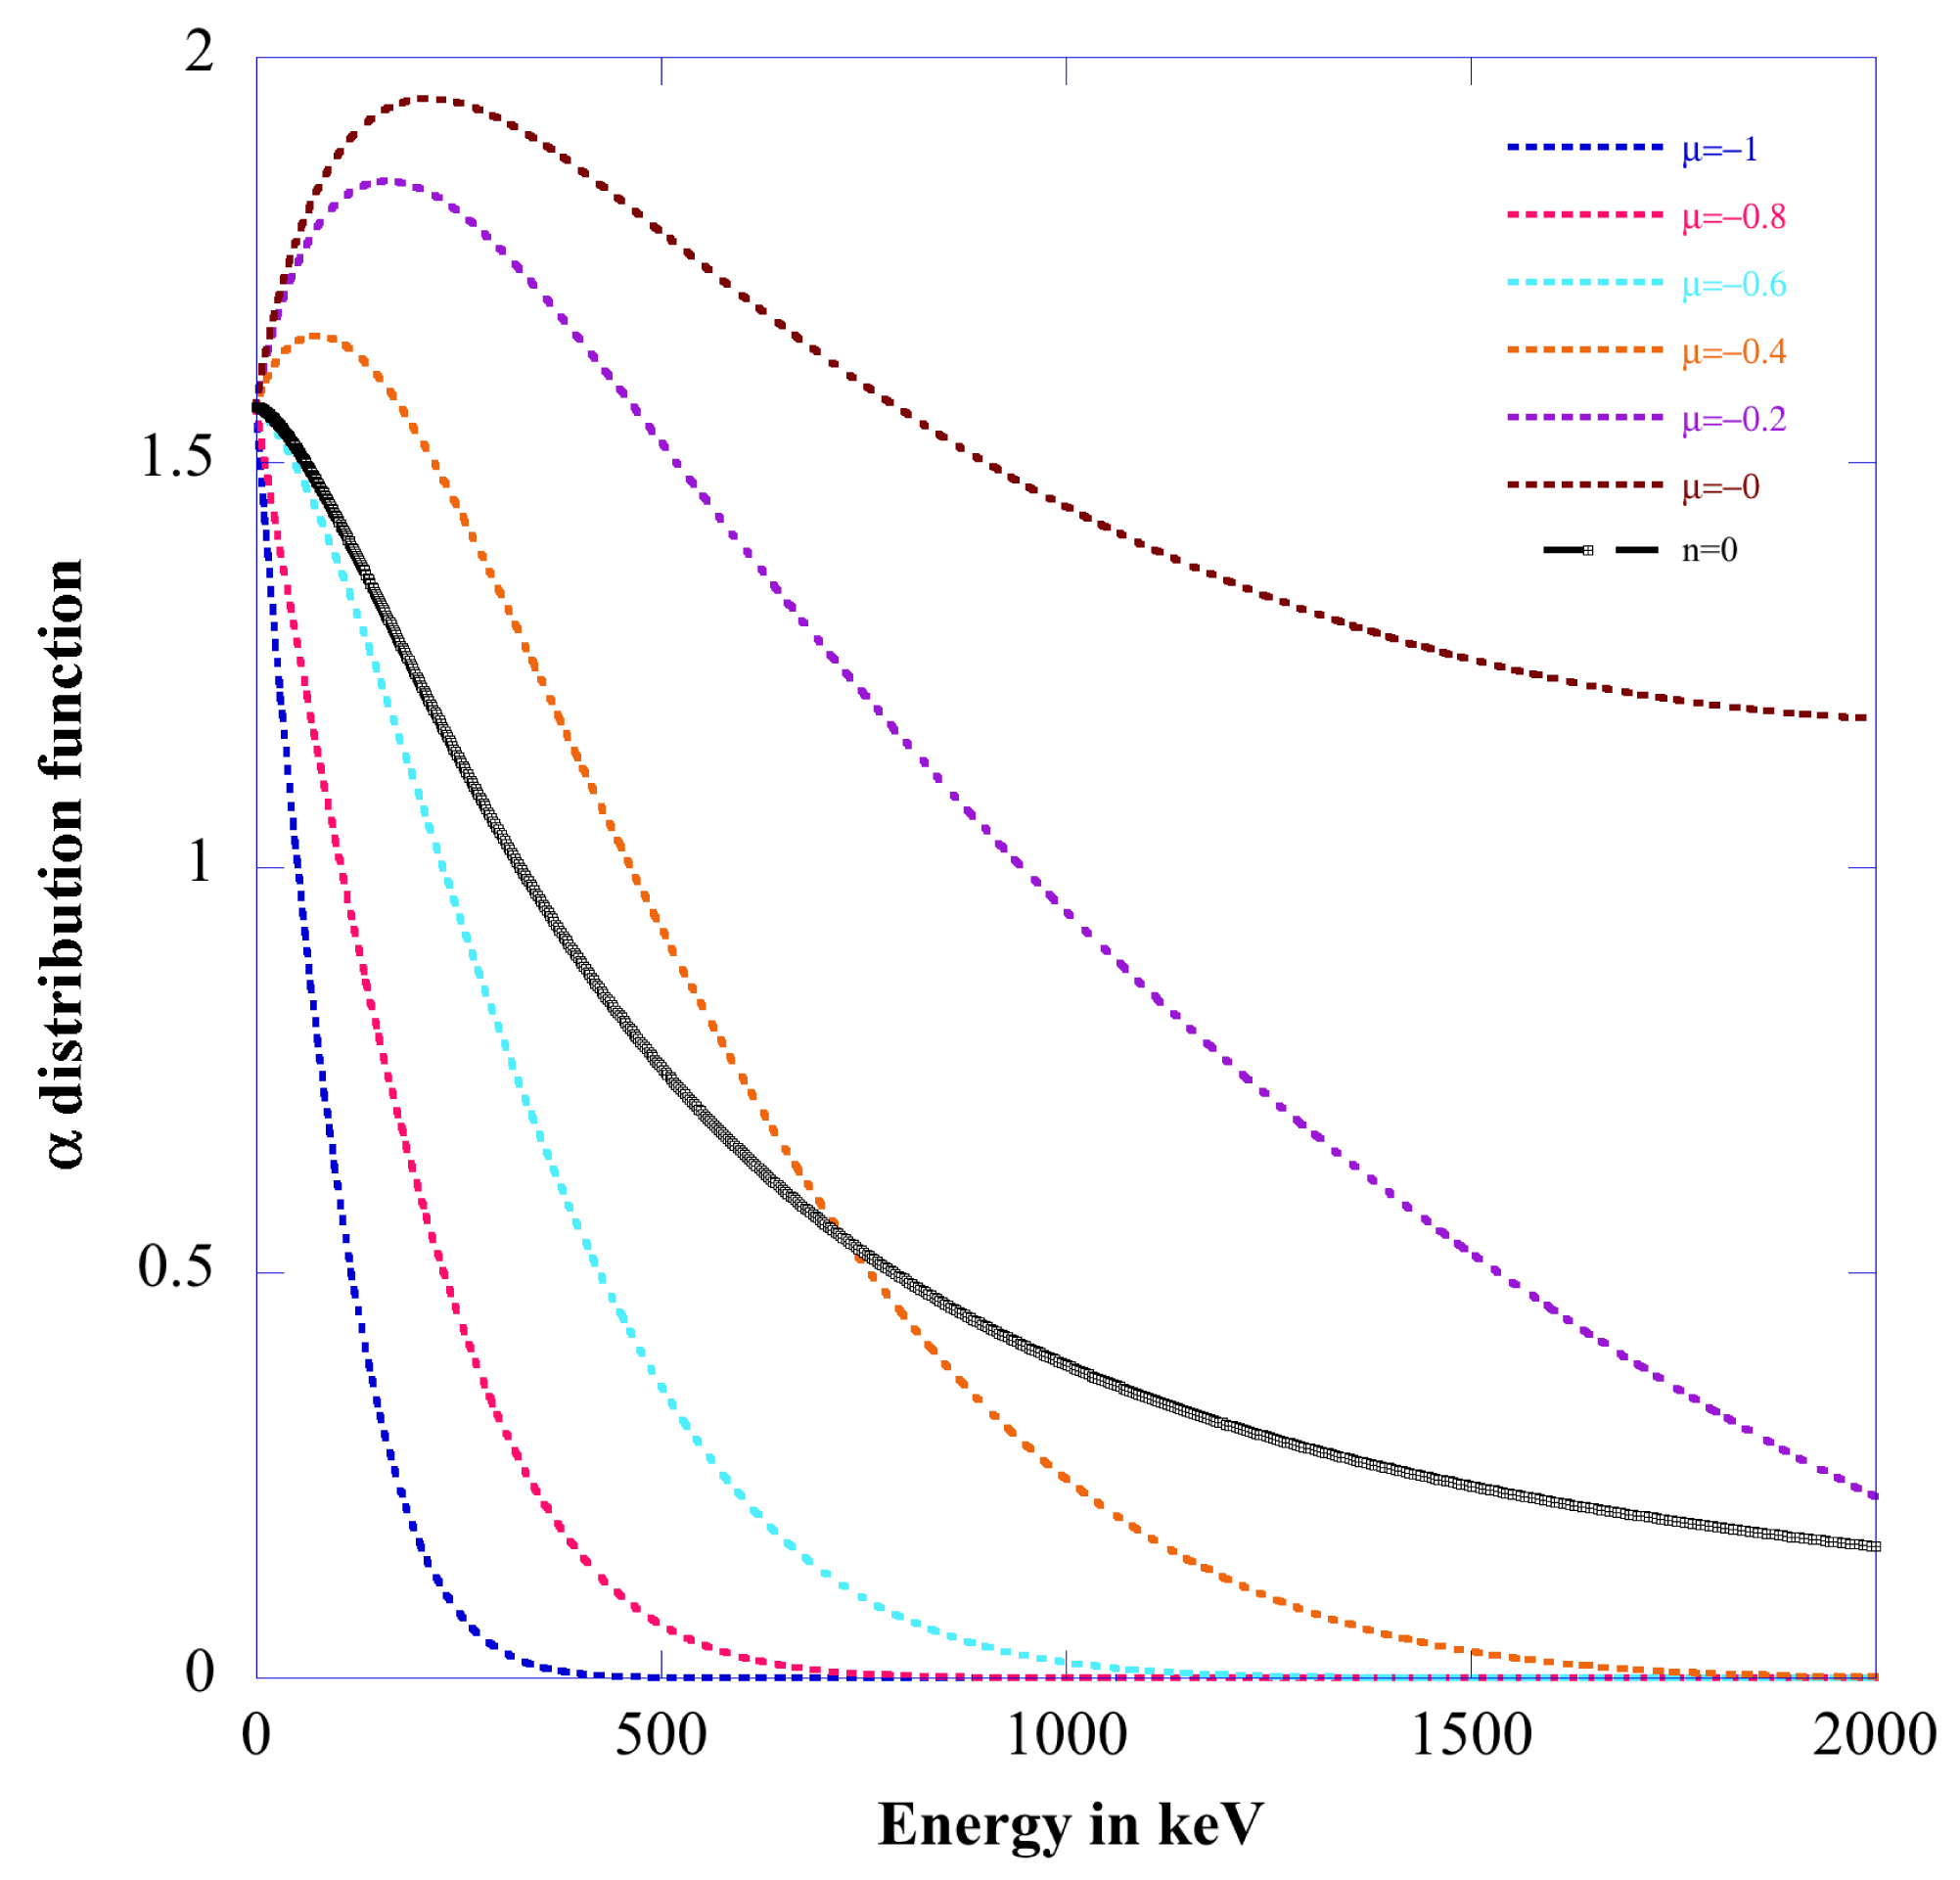
Figure 1. Distribution function
![]() $f_{0\unicode[STIX]{x1D6FC}}(v,\unicode[STIX]{x1D707})$
versus energy (in keV) at various pitch angles
$f_{0\unicode[STIX]{x1D6FC}}(v,\unicode[STIX]{x1D707})$
versus energy (in keV) at various pitch angles
![]() $-1\leqslant \unicode[STIX]{x1D707}=\cos \unicode[STIX]{x1D703}\leqslant 0$
. The black curve refers to the isotropic case
$-1\leqslant \unicode[STIX]{x1D707}=\cos \unicode[STIX]{x1D703}\leqslant 0$
. The black curve refers to the isotropic case
![]() $f_{0\unicode[STIX]{x1D6FC}}(v)$
.
$f_{0\unicode[STIX]{x1D6FC}}(v)$
.
where
is the critical velocity, the constant
![]() $C=3/(2\unicode[STIX]{x03C0}\ln ((v_{\text{birth}}^{3}+v_{c}^{3})/v_{c}^{3}))$
,
$C=3/(2\unicode[STIX]{x03C0}\ln ((v_{\text{birth}}^{3}+v_{c}^{3})/v_{c}^{3}))$
,
![]() $v_{\text{birth}}=\sqrt{2E_{\unicode[STIX]{x1D6FC}}/m_{\unicode[STIX]{x1D6FC}}}$
is the velocity of the generated
$v_{\text{birth}}=\sqrt{2E_{\unicode[STIX]{x1D6FC}}/m_{\unicode[STIX]{x1D6FC}}}$
is the velocity of the generated
![]() $\unicode[STIX]{x1D6FC}$
particles, with
$\unicode[STIX]{x1D6FC}$
particles, with
![]() $E_{\unicode[STIX]{x1D6FC}}=3.5~\text{MeV}$
,
$E_{\unicode[STIX]{x1D6FC}}=3.5~\text{MeV}$
,
![]() $H(v_{\text{birth}}-v)$
is the Heaviside step function,
$H(v_{\text{birth}}-v)$
is the Heaviside step function,
![]() $P_{n}$
the Legendre function of order
$P_{n}$
the Legendre function of order
![]() $n$
and
$n$
and
 $$\begin{eqnarray}\left.\begin{array}{@{}c@{}}\displaystyle Z_{2}=\mathop{\sum }_{i}\frac{Z_{i}^{2}}{Z_{1}}\frac{n_{i}}{n_{e}}\frac{\ln \unicode[STIX]{x1D6EC}^{\unicode[STIX]{x1D6FC},i}}{\ln \unicode[STIX]{x1D6EC}^{\unicode[STIX]{x1D6FC},e}}\\ \displaystyle Z_{1}=\mathop{\sum }_{i}Z_{i}^{2}\frac{n_{i}}{n_{e}}\frac{m_{\unicode[STIX]{x1D6FC}}}{m_{i}}\frac{\ln \unicode[STIX]{x1D6EC}^{\unicode[STIX]{x1D6FC},i}}{\ln \unicode[STIX]{x1D6EC}^{\unicode[STIX]{x1D6FC},e}}.\end{array}\right\}\end{eqnarray}$$
A plot of the function
![]() $f_{0\unicode[STIX]{x1D6FC}}(v,\unicode[STIX]{x1D707})$
equation (3.3) versus the energy is given in figure 1 when considering the DEMO option 1 (pulsed regime) plasma parameters (Zohm et al.
Reference Zohm, Angioni, Fable, Federici, Gantenbein, Hartmann, Lackner, Poli, Porte and Sauter2013; Giruzzi et al.
Reference Giruzzi, Artaud, Baruzzo, Bolzonella, Fable, Garzotti, Ivanova-Stanik, Kemp, King and Schneider2015): dimensions
$f_{0\unicode[STIX]{x1D6FC}}(v,\unicode[STIX]{x1D707})$
equation (3.3) versus the energy is given in figure 1 when considering the DEMO option 1 (pulsed regime) plasma parameters (Zohm et al.
Reference Zohm, Angioni, Fable, Federici, Gantenbein, Hartmann, Lackner, Poli, Porte and Sauter2013; Giruzzi et al.
Reference Giruzzi, Artaud, Baruzzo, Bolzonella, Fable, Garzotti, Ivanova-Stanik, Kemp, King and Schneider2015): dimensions
![]() $R_{0}=6,7~\text{m}$
;
$R_{0}=6,7~\text{m}$
;
![]() $a=2~\text{m}$
, density
$a=2~\text{m}$
, density
![]() $n_{0}=10^{20}~\text{m}^{-3}$
(flat profile), temperature
$n_{0}=10^{20}~\text{m}^{-3}$
(flat profile), temperature
![]() $T_{e0}=24~\text{keV}$
,
$T_{e0}=24~\text{keV}$
,
![]() $DT=50\,\%{-}50\,\%$
and
$DT=50\,\%{-}50\,\%$
and
![]() $1\,\%$
of
$1\,\%$
of
![]() $\unicode[STIX]{x1D6FC}$
-particles at the steady state. It is easy now to reconstruct the imaginary part of the dielectric function by using the Sokhotski–Plemelj formula
$\unicode[STIX]{x1D6FC}$
-particles at the steady state. It is easy now to reconstruct the imaginary part of the dielectric function by using the Sokhotski–Plemelj formula
 $$\begin{eqnarray}\displaystyle \unicode[STIX]{x1D700}_{\unicode[STIX]{x1D6FC}}^{\text{Im}} & = & \displaystyle \unicode[STIX]{x1D712}_{\unicode[STIX]{x1D6FC}}^{\text{Im}}=-2\unicode[STIX]{x03C0}^{2}\frac{4\unicode[STIX]{x03C0}q_{\unicode[STIX]{x1D6FC}}^{2}}{m_{\unicode[STIX]{x1D6FC}}k^{2}}\int _{-1}^{+1}\text{d}\unicode[STIX]{x1D707}\int _{0}^{\infty }\text{d}vv^{2}\frac{\displaystyle \boldsymbol{k}\boldsymbol{\cdot }\frac{\unicode[STIX]{x2202}f_{0\unicode[STIX]{x1D6FC}}(v)}{\unicode[STIX]{x2202}\boldsymbol{v}}}{\unicode[STIX]{x1D714}-\boldsymbol{k}\boldsymbol{\cdot }\boldsymbol{v}}\nonumber\\ \displaystyle & = & \displaystyle \frac{2C\unicode[STIX]{x03C0}^{2}\unicode[STIX]{x1D714}_{p\unicode[STIX]{x1D6FC}}^{2}}{k^{2}v_{\text{birth}}^{2}}\hat{v}_{res}\left[\frac{1}{\hat{v}_{res}^{3}+\hat{v}_{c}^{3}}-\frac{1}{1+\hat{v}_{c}^{3}}\right],\end{eqnarray}$$
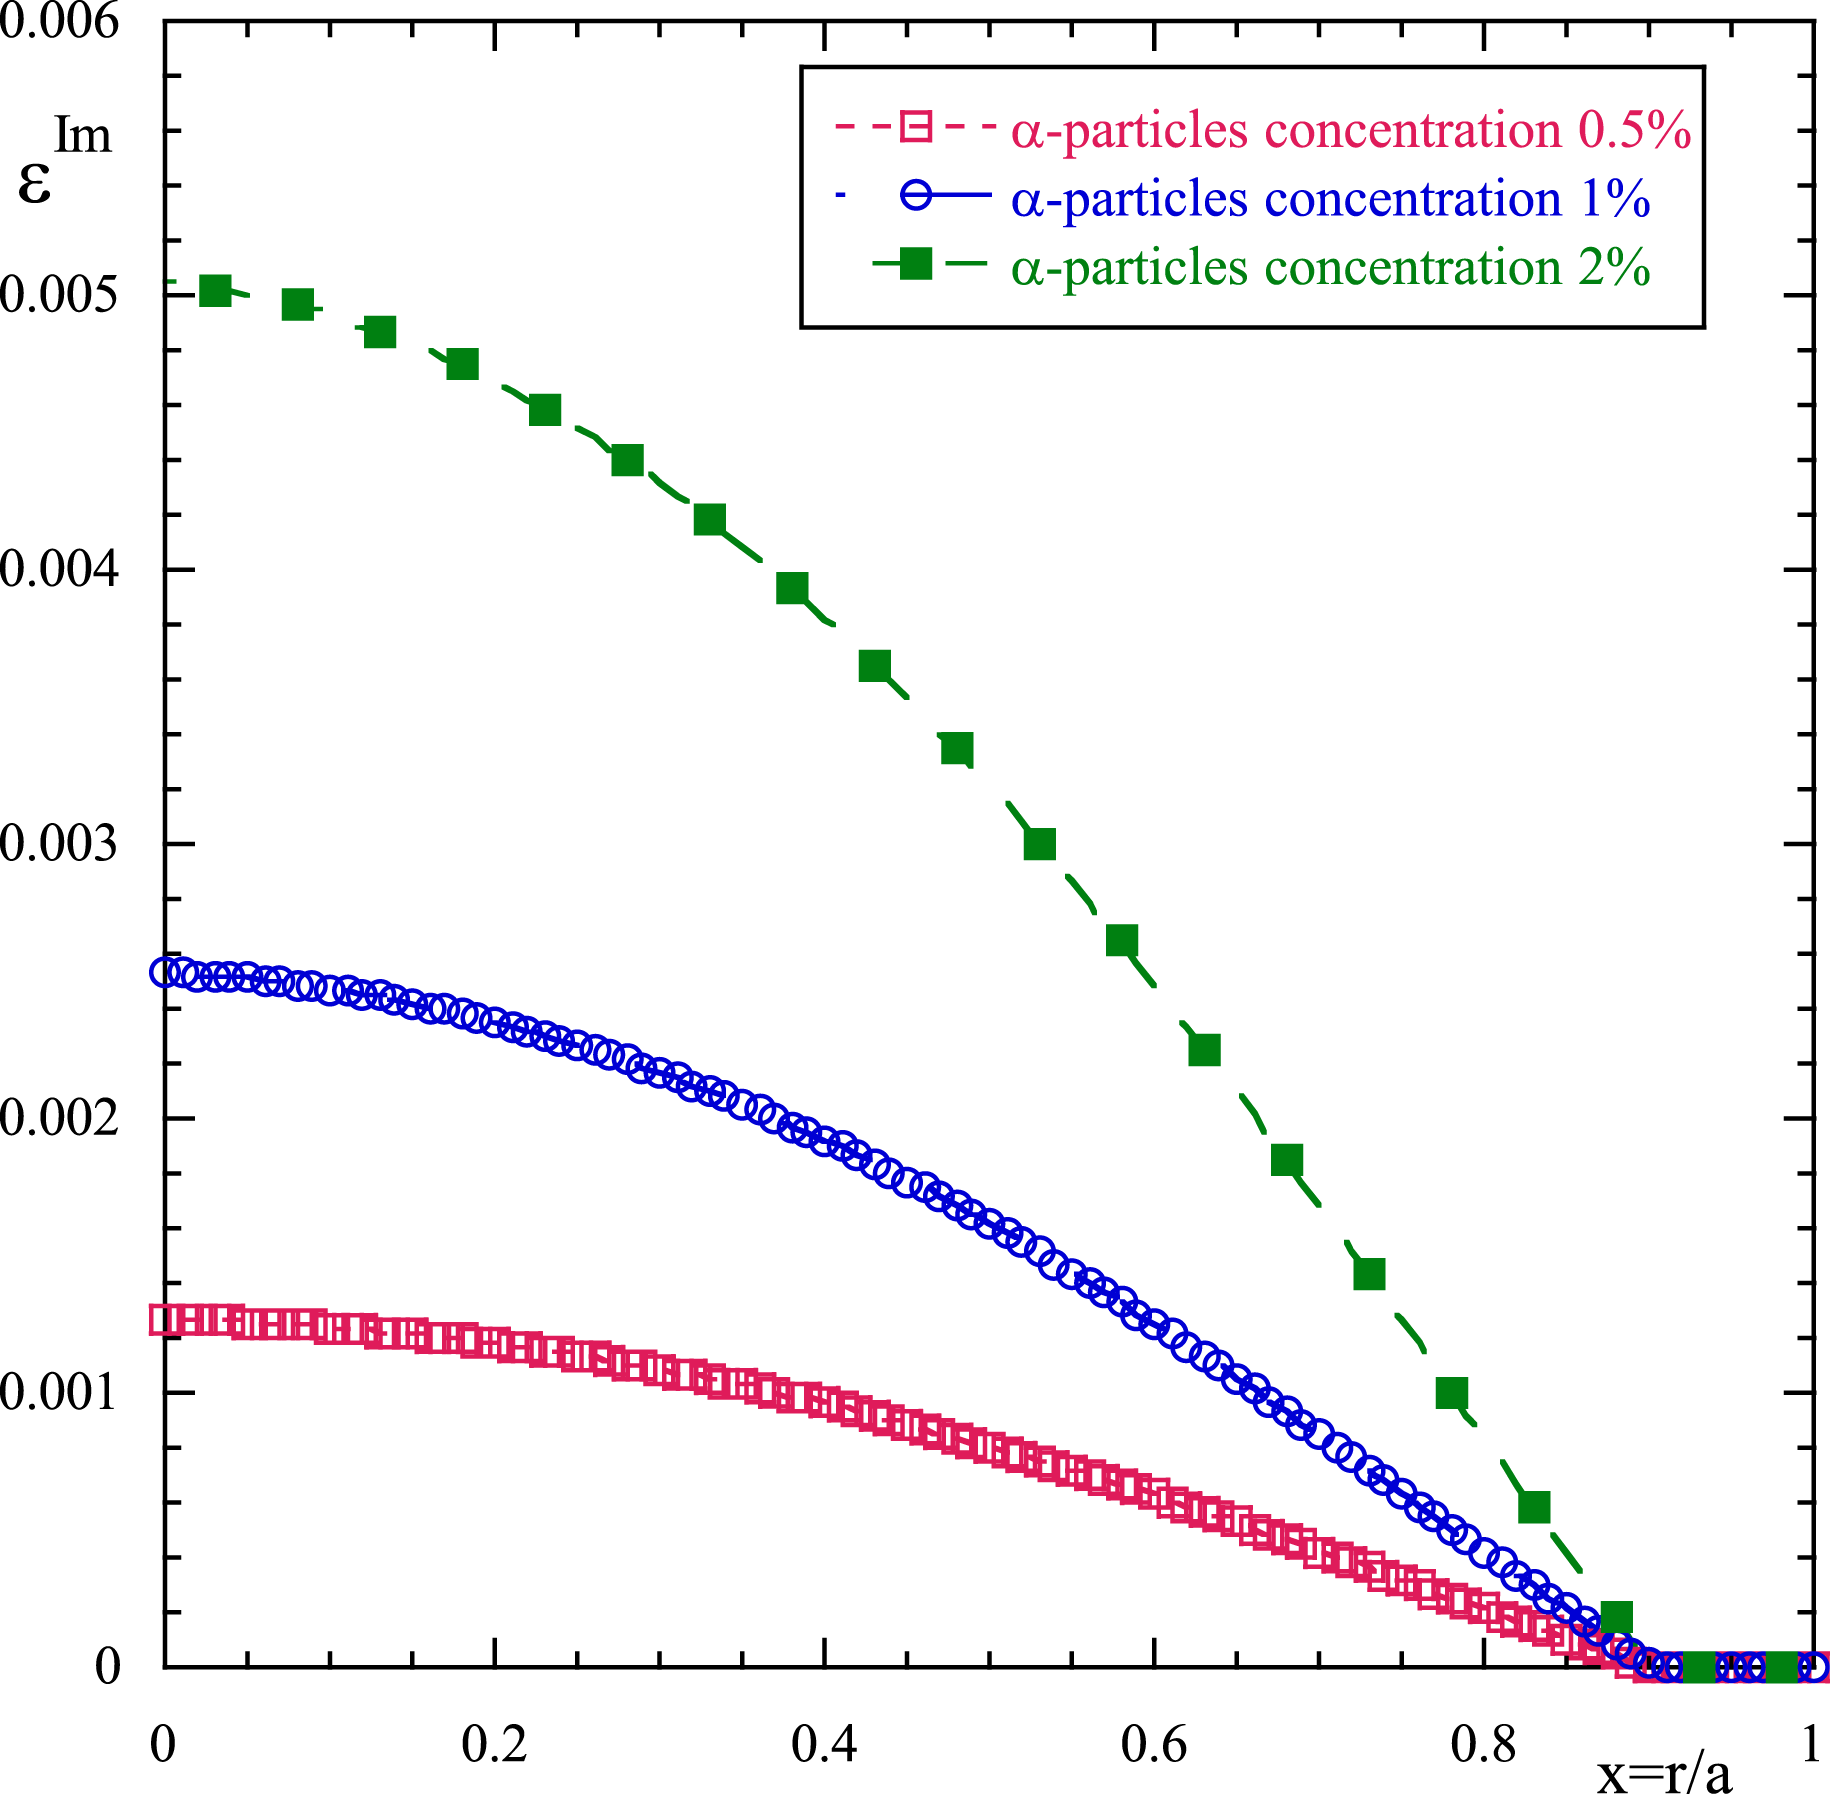
Figure 2. Damping function
![]() $\unicode[STIX]{x1D700}_{\unicode[STIX]{x1D6FC}}^{\text{Im}}$
versus the normalized plasma radius for three values of
$\unicode[STIX]{x1D700}_{\unicode[STIX]{x1D6FC}}^{\text{Im}}$
versus the normalized plasma radius for three values of
![]() $\unicode[STIX]{x1D6FC}$
-particle concentration (red square curve 0.5 %, blue bullet curve 1 %, green square 2 %).
$\unicode[STIX]{x1D6FC}$
-particle concentration (red square curve 0.5 %, blue bullet curve 1 %, green square 2 %).
where we have used the slowing down distribution function averaged on the pitch angle (black curve of figure 1), and the resonant velocity
![]() $\hat{v}_{res}=\unicode[STIX]{x1D714}/kv_{\text{birth}}$
(‘hat’ means normalization over the
$\hat{v}_{res}=\unicode[STIX]{x1D714}/kv_{\text{birth}}$
(‘hat’ means normalization over the
![]() $\unicode[STIX]{x1D6FC}$
birth velocity) Owing to the small fraction of
$\unicode[STIX]{x1D6FC}$
birth velocity) Owing to the small fraction of
![]() $\unicode[STIX]{x1D6FC}$
-particles in the plasma composition, the real part of the susceptibility does not contribute too much to the dispersion relation, and it can be neglected. The imaginary part, which affects the damping of the wave, on the contrary, can be relevant. Note that in the case of
$\unicode[STIX]{x1D6FC}$
-particles in the plasma composition, the real part of the susceptibility does not contribute too much to the dispersion relation, and it can be neglected. The imaginary part, which affects the damping of the wave, on the contrary, can be relevant. Note that in the case of
![]() $\unicode[STIX]{x1D6FC}$
-particles we have neglected the quasi-linear effect in the solution of the Fokker–Planck equation. This is equivalent to assuming that the wave does not affect significantly the distribution of the
$\unicode[STIX]{x1D6FC}$
-particles we have neglected the quasi-linear effect in the solution of the Fokker–Planck equation. This is equivalent to assuming that the wave does not affect significantly the distribution of the
![]() $\unicode[STIX]{x1D6FC}$
-particles. In figure 2 a plot of the damping function strength
$\unicode[STIX]{x1D6FC}$
-particles. In figure 2 a plot of the damping function strength
![]() $\unicode[STIX]{x1D700}_{\unicode[STIX]{x1D6FC}}^{\text{Im}}$
(3.6) versus the normalized plasma radius is shown at different
$\unicode[STIX]{x1D700}_{\unicode[STIX]{x1D6FC}}^{\text{Im}}$
(3.6) versus the normalized plasma radius is shown at different
![]() $\unicode[STIX]{x1D6FC}$
-particle concentrations (a)
$\unicode[STIX]{x1D6FC}$
-particle concentrations (a)
![]() $n_{\unicode[STIX]{x1D6FC}}/n_{e}=0.5\,\%$
, (b)
$n_{\unicode[STIX]{x1D6FC}}/n_{e}=0.5\,\%$
, (b)
![]() $n_{\unicode[STIX]{x1D6FC}}/n_{e}=1\,\%$
, (c)
$n_{\unicode[STIX]{x1D6FC}}/n_{e}=1\,\%$
, (c)
![]() $n_{\unicode[STIX]{x1D6FC}}/n_{e}=2\,\%$
, (Waltz & Bass Reference Waltz and Bass2014) for the plasma parameters of figure 1, LH frequency
$n_{\unicode[STIX]{x1D6FC}}/n_{e}=2\,\%$
, (Waltz & Bass Reference Waltz and Bass2014) for the plasma parameters of figure 1, LH frequency
![]() $f_{LH}=5~\text{GHz}$
and
$f_{LH}=5~\text{GHz}$
and
![]() $k_{\Vert }=(\unicode[STIX]{x1D714}/c)n_{\Vert }=1.89~\text{cm}^{-1}$
. In figures 3 and 4 the damping rate
$k_{\Vert }=(\unicode[STIX]{x1D714}/c)n_{\Vert }=1.89~\text{cm}^{-1}$
. In figures 3 and 4 the damping rate
![]() $(\unicode[STIX]{x1D6FE}=-\unicode[STIX]{x1D700}^{\text{Im}}/\sqrt{|\unicode[STIX]{x1D700}_{zz}|}k_{\Vert })$
, and the power deposition profiles (in
$(\unicode[STIX]{x1D6FE}=-\unicode[STIX]{x1D700}^{\text{Im}}/\sqrt{|\unicode[STIX]{x1D700}_{zz}|}k_{\Vert })$
, and the power deposition profiles (in
![]() $\text{W}~\text{m}^{-3}$
) are depicted for the same plasma parameters and same values of the concentration of
$\text{W}~\text{m}^{-3}$
) are depicted for the same plasma parameters and same values of the concentration of
![]() $\unicode[STIX]{x1D6FC}$
as in the previous figures. Regarding the figure, it can be seen that when increasing the
$\unicode[STIX]{x1D6FC}$
as in the previous figures. Regarding the figure, it can be seen that when increasing the
![]() $\unicode[STIX]{x1D6FC}$
-concentration the damping rate increases and the absorption can be relevant also in more peripheral zones (Wong & Ono Reference Wong and Ono1984).
$\unicode[STIX]{x1D6FC}$
-concentration the damping rate increases and the absorption can be relevant also in more peripheral zones (Wong & Ono Reference Wong and Ono1984).
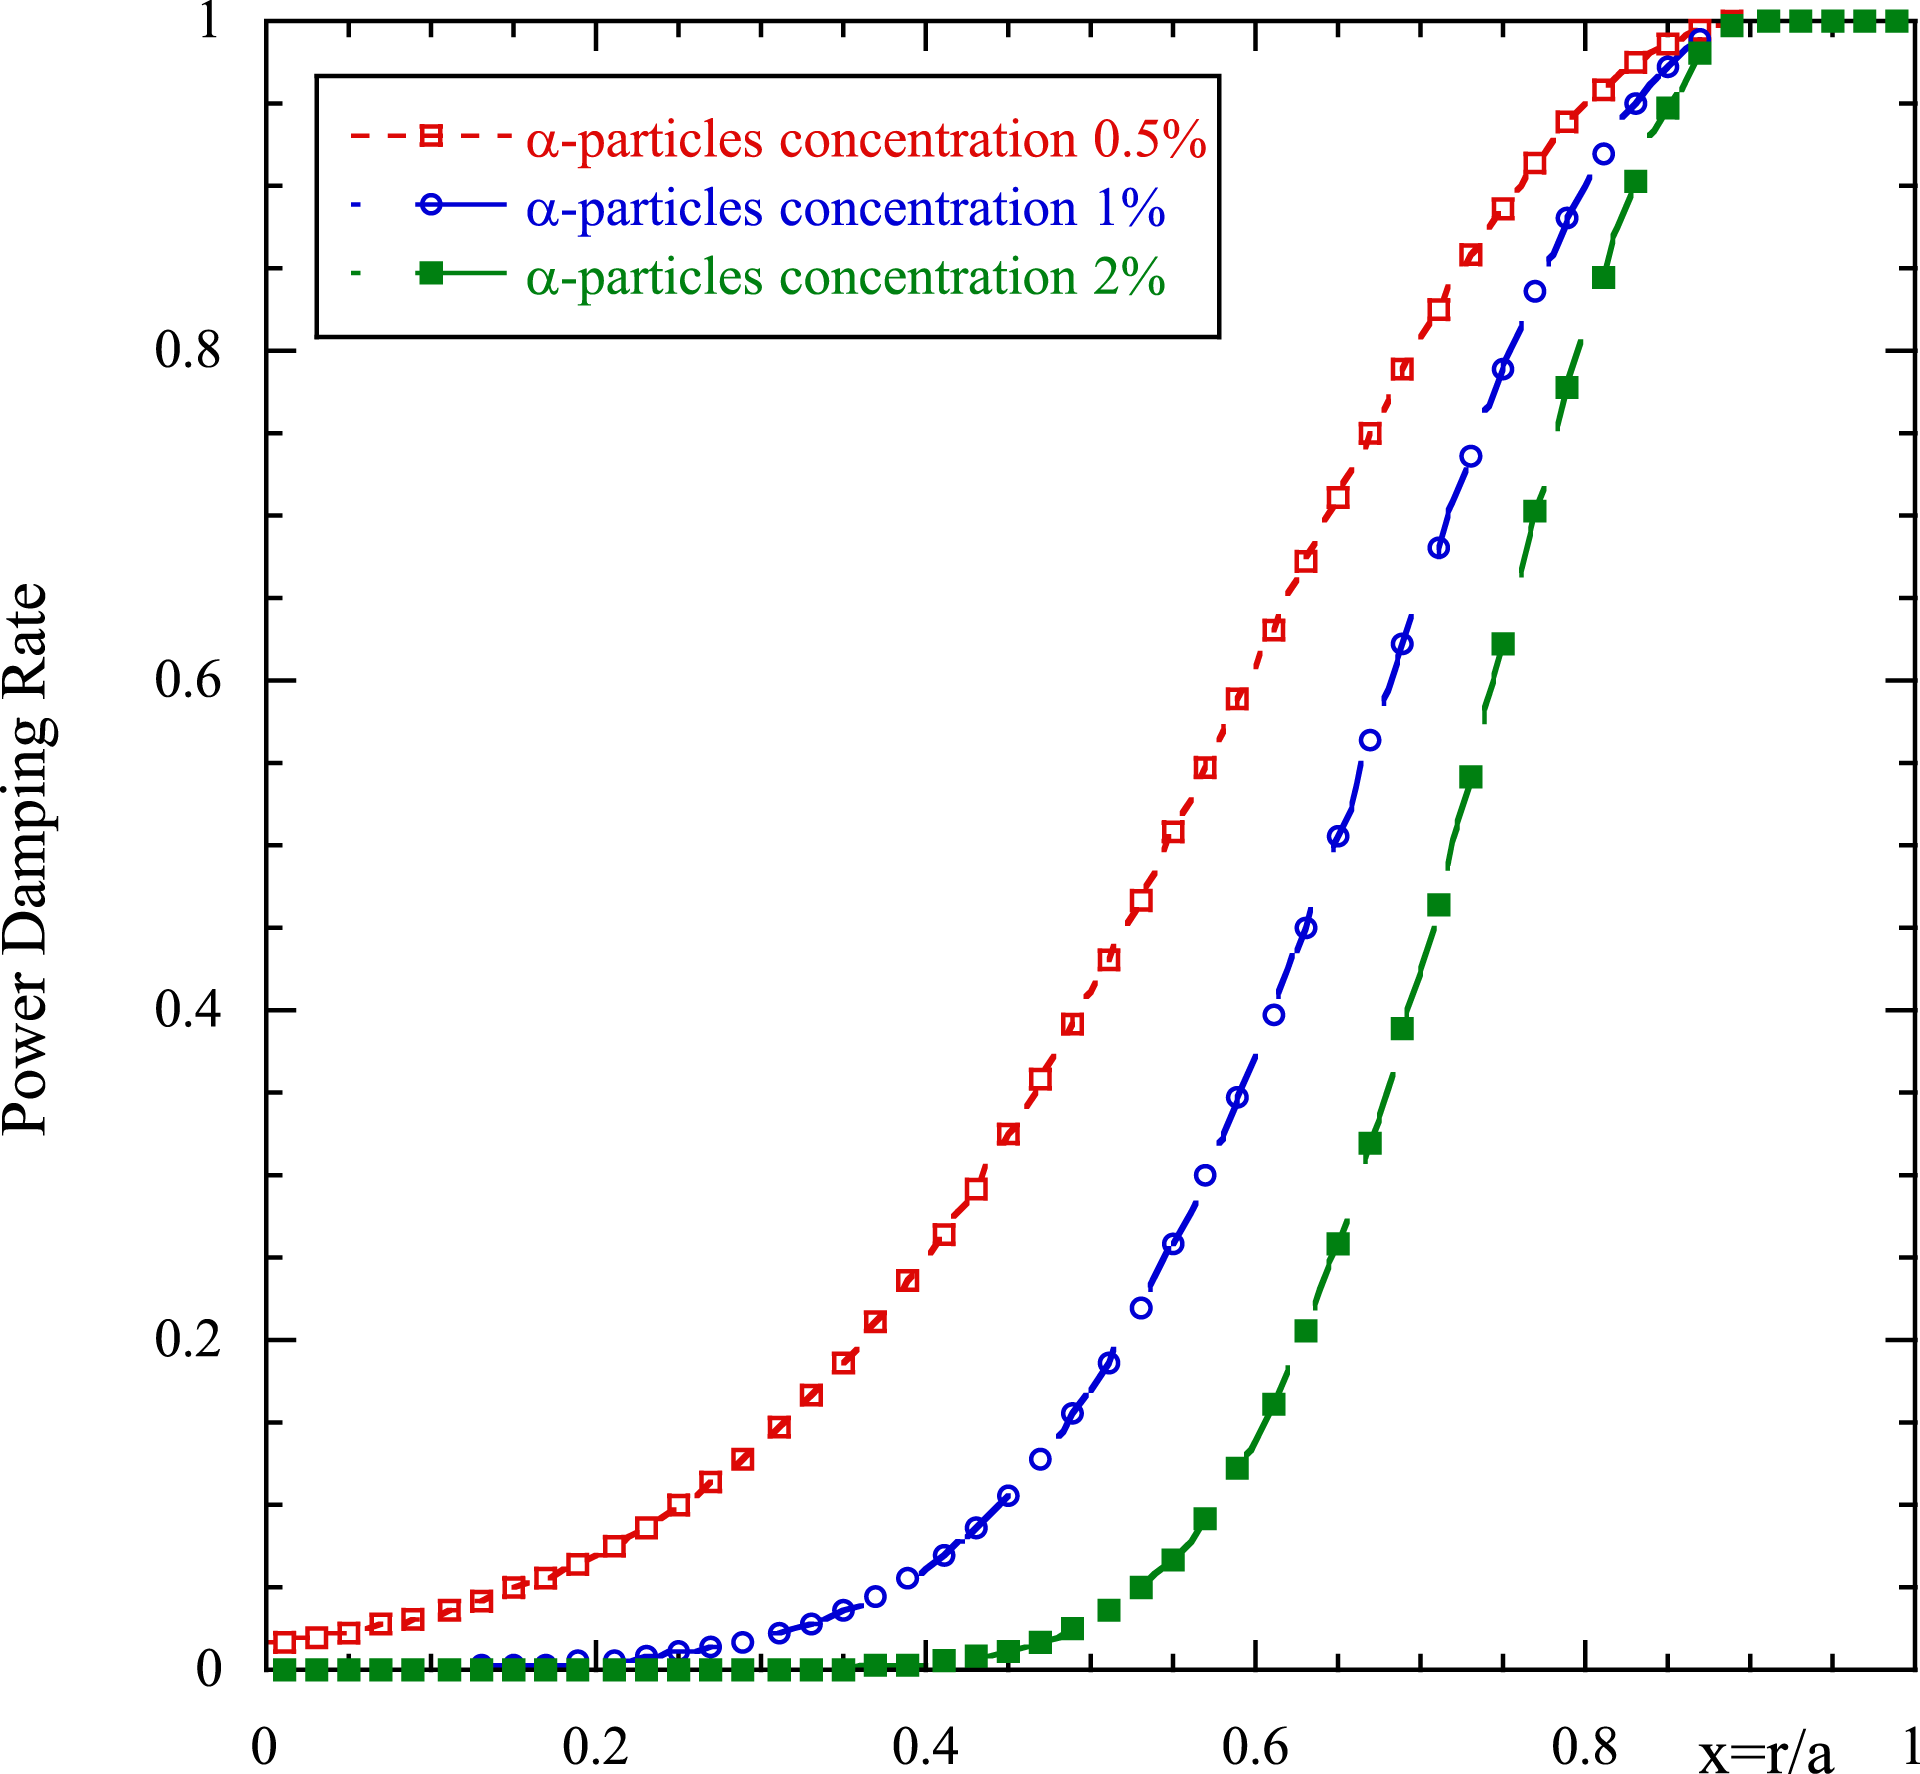
Figure 3. Power-damping rate
![]() $(\unicode[STIX]{x1D6FE}=-\unicode[STIX]{x1D700}^{\text{Im}}/\sqrt{|\unicode[STIX]{x1D700}_{zz}|}k_{\Vert })$
, as a function of the normalized plasma radius for the same values of the concentration of
$(\unicode[STIX]{x1D6FE}=-\unicode[STIX]{x1D700}^{\text{Im}}/\sqrt{|\unicode[STIX]{x1D700}_{zz}|}k_{\Vert })$
, as a function of the normalized plasma radius for the same values of the concentration of
![]() $\unicode[STIX]{x1D6FC}$
-particles as in the previous figures.
$\unicode[STIX]{x1D6FC}$
-particles as in the previous figures.
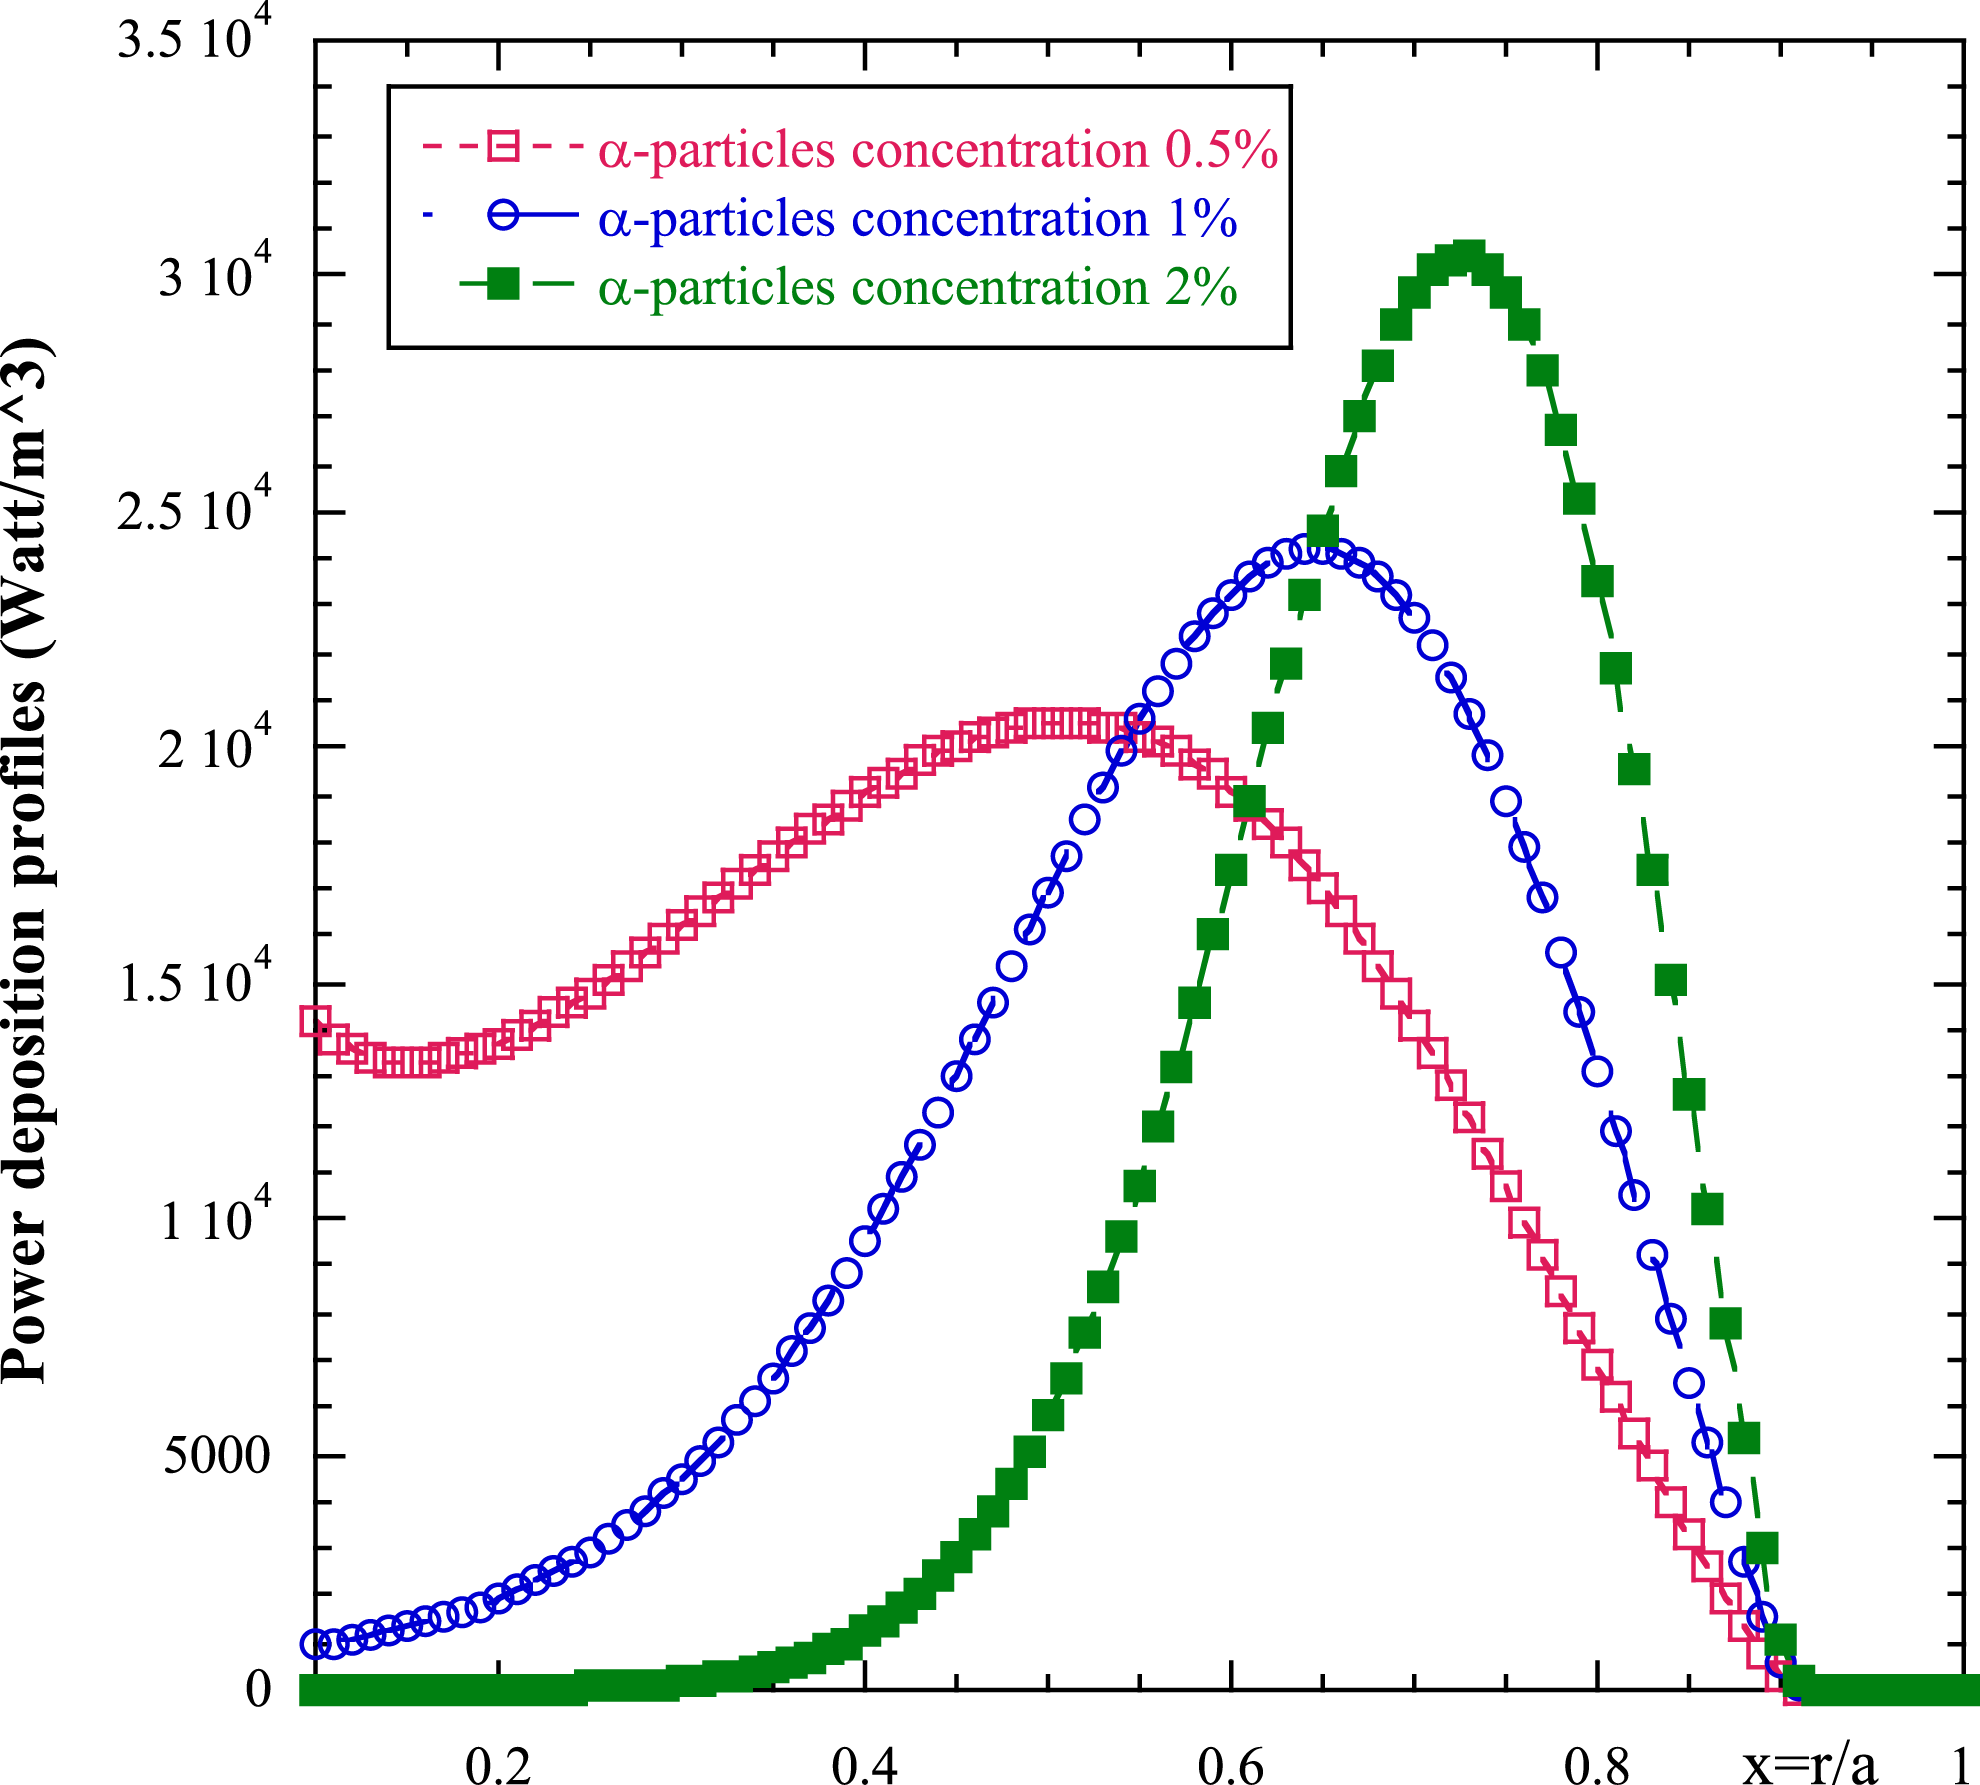
Figure 4. Power deposition profiles in
![]() $\text{W}~\text{m}^{-3}$
as a function of the plasma radius for the same values of the concentration of
$\text{W}~\text{m}^{-3}$
as a function of the plasma radius for the same values of the concentration of
![]() $\unicode[STIX]{x1D6FC}$
-particles as in the previous figures.
$\unicode[STIX]{x1D6FC}$
-particles as in the previous figures.
3.2 Electron distribution function quasi-linear solution
The one-dimensional distribution function in the case of electrons under the influence of the wave electric field is written (Fisch Reference Fisch1978):
where
![]() $u=v_{\Vert }/v_{the}$
,
$u=v_{\Vert }/v_{the}$
,
![]() $C_{e}$
is a constant which can be evaluated by imposing
$C_{e}$
is a constant which can be evaluated by imposing
![]() $n_{0}=\int _{-\infty }^{+\infty }f_{e}(\boldsymbol{v})\,\text{d}\boldsymbol{v}$
and
$n_{0}=\int _{-\infty }^{+\infty }f_{e}(\boldsymbol{v})\,\text{d}\boldsymbol{v}$
and
![]() $D(u)$
is the ratio between the quasi-linear and collisional diffusion coefficient. From this definition we have:
$D(u)$
is the ratio between the quasi-linear and collisional diffusion coefficient. From this definition we have:
and
![]() $\unicode[STIX]{x1D708}^{ee}=4\unicode[STIX]{x03C0}n_{e}e^{4}\unicode[STIX]{x1D706}_{ee}/m_{e}^{2}v_{the}^{3}$
,
$\unicode[STIX]{x1D708}^{ee}=4\unicode[STIX]{x03C0}n_{e}e^{4}\unicode[STIX]{x1D706}_{ee}/m_{e}^{2}v_{the}^{3}$
,
![]() $v_{the}=\sqrt{\unicode[STIX]{x1D705}T_{e}/m_{e}}$
and
$v_{the}=\sqrt{\unicode[STIX]{x1D705}T_{e}/m_{e}}$
and
![]() $\unicode[STIX]{x1D706}_{ee}=24-\ln (n_{e}^{1/2}T_{e}^{-1})$
are respectively the
$\unicode[STIX]{x1D706}_{ee}=24-\ln (n_{e}^{1/2}T_{e}^{-1})$
are respectively the
![]() $e{-}e$
collision frequency, the thermal velocity and the Coulomb logarithm and
$e{-}e$
collision frequency, the thermal velocity and the Coulomb logarithm and
![]() $Z_{i}$
is the ion charge state. In a tokamak reactor, owing to the very high electron temperature the absorption of the power must happen at the first pass in the external zone of the plasma (between the scrape-off layer and the pedestal), for this reason we are confident that the propagation of the wave in this zone must be localized in the so-called resonance cones (Bellan & Porkolab Reference Bellan and Porkolab1975), using the Poynting theorem we calculate the electric field, which appears in (3.8) in terms of the power which flows from the antenna to the plasma, in formula we have
$Z_{i}$
is the ion charge state. In a tokamak reactor, owing to the very high electron temperature the absorption of the power must happen at the first pass in the external zone of the plasma (between the scrape-off layer and the pedestal), for this reason we are confident that the propagation of the wave in this zone must be localized in the so-called resonance cones (Bellan & Porkolab Reference Bellan and Porkolab1975), using the Poynting theorem we calculate the electric field, which appears in (3.8) in terms of the power which flows from the antenna to the plasma, in formula we have
where
![]() $P_{d0}$
is the area-power density,
$P_{d0}$
is the area-power density,
![]() $g(n_{\Vert })$
is the function which takes into account the power spectrum shape,
$g(n_{\Vert })$
is the function which takes into account the power spectrum shape,
![]() $n_{\Vert }$
the parallel wavenumber
$n_{\Vert }$
the parallel wavenumber
![]() $(n_{\Vert }=(c/\unicode[STIX]{x1D714})k_{\Vert })$
and
$(n_{\Vert }=(c/\unicode[STIX]{x1D714})k_{\Vert })$
and
![]() $\unicode[STIX]{x1D700}_{zz}=1-\unicode[STIX]{x1D714}_{pe}^{2}/\unicode[STIX]{x1D714}^{2}-\unicode[STIX]{x1D714}_{pi}^{2}/\unicode[STIX]{x1D714}^{2}\sim -\unicode[STIX]{x1D714}_{pe}^{2}/\unicode[STIX]{x1D714}^{2}$
and
$\unicode[STIX]{x1D700}_{zz}=1-\unicode[STIX]{x1D714}_{pe}^{2}/\unicode[STIX]{x1D714}^{2}-\unicode[STIX]{x1D714}_{pi}^{2}/\unicode[STIX]{x1D714}^{2}\sim -\unicode[STIX]{x1D714}_{pe}^{2}/\unicode[STIX]{x1D714}^{2}$
and
![]() $\unicode[STIX]{x1D700}_{xx}=1-\unicode[STIX]{x1D714}_{pe}^{2}/(\unicode[STIX]{x1D714}^{2}-\unicode[STIX]{x1D6FA}_{ce}^{2})-\unicode[STIX]{x1D714}_{pi}^{2}/(\unicode[STIX]{x1D714}^{2}-\unicode[STIX]{x1D6FA}_{ci}^{2})\sim 1$
are the elements of the cold plasma dielectric tensor and are defined in § 2. Assuming, for the sake of simplicity, that the function
$\unicode[STIX]{x1D700}_{xx}=1-\unicode[STIX]{x1D714}_{pe}^{2}/(\unicode[STIX]{x1D714}^{2}-\unicode[STIX]{x1D6FA}_{ce}^{2})-\unicode[STIX]{x1D714}_{pi}^{2}/(\unicode[STIX]{x1D714}^{2}-\unicode[STIX]{x1D6FA}_{ci}^{2})\sim 1$
are the elements of the cold plasma dielectric tensor and are defined in § 2. Assuming, for the sake of simplicity, that the function
![]() $g(n_{\Vert })=\text{rect}(n_{\Vert }-n_{\Vert p}/\unicode[STIX]{x0394}n_{\Vert })$
, (centred at
$g(n_{\Vert })=\text{rect}(n_{\Vert }-n_{\Vert p}/\unicode[STIX]{x0394}n_{\Vert })$
, (centred at
![]() $n_{\Vert p}$
and duration
$n_{\Vert p}$
and duration
![]() $\unicode[STIX]{x0394}n_{\Vert }$
) in the interval
$\unicode[STIX]{x0394}n_{\Vert }$
) in the interval
![]() $n_{\Vert 1}\leqslant n_{\Vert }\leqslant n_{\Vert 2}$
such that
$n_{\Vert 1}\leqslant n_{\Vert }\leqslant n_{\Vert 2}$
such that
![]() $n_{\Vert p}=n_{\Vert 2}+n_{\Vert 1}/2$
(considering
$n_{\Vert p}=n_{\Vert 2}+n_{\Vert 1}/2$
(considering
![]() $n_{\Vert p}$
is the peak value (in this case the mean value) of the spectrum) we obtain an expression for the quasi-linear diffusion coefficient in terms of the normalized (to the electron thermal velocity) parallel velocity
$n_{\Vert p}$
is the peak value (in this case the mean value) of the spectrum) we obtain an expression for the quasi-linear diffusion coefficient in terms of the normalized (to the electron thermal velocity) parallel velocity
![]() $u=v_{\Vert }/v_{the}$
:
$u=v_{\Vert }/v_{the}$
:
where
and the function
![]() $\text{rect}(u)$
is included between
$\text{rect}(u)$
is included between
![]() $u_{1}=c(n_{\Vert 2}v_{the})^{-1}$
and
$u_{1}=c(n_{\Vert 2}v_{the})^{-1}$
and
![]() $u_{2}=c(n_{\Vert 1}v_{the})^{-1}$
, whose duration is
$u_{2}=c(n_{\Vert 1}v_{the})^{-1}$
, whose duration is
![]() $\unicode[STIX]{x0394}u=(c/v_{the})(\unicode[STIX]{x0394}n_{\Vert }/n_{\Vert 1}n_{\Vert 2})$
, and
$\unicode[STIX]{x0394}u=(c/v_{the})(\unicode[STIX]{x0394}n_{\Vert }/n_{\Vert 1}n_{\Vert 2})$
, and
![]() $u_{p}=c(n_{\Vert 2}+n_{\Vert 1})/2v_{the}n_{\Vert 1}n_{\Vert 2}$
. The distribution function can be obtained by quadrature of the integral in (3.7)
$u_{p}=c(n_{\Vert 2}+n_{\Vert 1})/2v_{the}n_{\Vert 1}n_{\Vert 2}$
. The distribution function can be obtained by quadrature of the integral in (3.7)
 $$\begin{eqnarray}\displaystyle & & \displaystyle \hspace{-10.00002pt}f_{e}(u)=C_{e}\exp \left(-\int \frac{u}{1+D(u)u^{3}}\,\text{d}u\right)\nonumber\\ \displaystyle & & \displaystyle =C_{e}\exp \!\left\{\!-\frac{\displaystyle \ln (D_{0e}^{2/3}u^{2}-D_{0e}^{1/3}u+1)-2\ln (D_{0e}^{1/3}u+1)+2\sqrt{3}\,\text{arctn}\!\left(\!\frac{2D_{0e}^{1/3}u-1}{\sqrt{3}}\!\right)}{6D_{0e}^{2/3}}\!\right\}.\nonumber\\ \displaystyle & & \displaystyle\end{eqnarray}$$
The 2-D distribution function for the electrons can be written as
where we have assumed a Maxwellian distribution for the perpendicular velocity and the constant
![]() $C_{e}$
can be obtained by the normalization of the distribution function on the velocity space
$C_{e}$
can be obtained by the normalization of the distribution function on the velocity space
where
![]() $I(\pm \infty )=\int _{-\infty }^{+\infty }\,\text{d}u\,\text{e}^{-\int (u/(1+D(u)u^{3}))\,\text{d}u}$
.
$I(\pm \infty )=\int _{-\infty }^{+\infty }\,\text{d}u\,\text{e}^{-\int (u/(1+D(u)u^{3}))\,\text{d}u}$
.
For our purpose of application of the LHW for current drive, the imaginary part of the dielectric function is
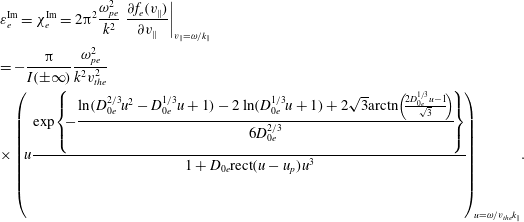 $$\begin{eqnarray}\displaystyle & & \displaystyle \hspace{-8.99994pt}\unicode[STIX]{x1D700}_{e}^{\text{Im}}=\unicode[STIX]{x1D712}_{e}^{\text{Im}}=2\unicode[STIX]{x03C0}^{2}\frac{\unicode[STIX]{x1D714}_{pe}^{2}}{k^{2}}\left.\frac{\unicode[STIX]{x2202}f_{e}(v_{\Vert })}{\unicode[STIX]{x2202}v_{\Vert }}\right|_{v_{\Vert }=\unicode[STIX]{x1D714}/k_{\Vert }}\nonumber\\ \displaystyle & & \displaystyle \hspace{-8.99994pt}=-\frac{\unicode[STIX]{x03C0}}{I(\pm \infty )}\frac{\unicode[STIX]{x1D714}_{pe}^{2}}{k^{2}v_{the}^{2}}\nonumber\\ \displaystyle & & \displaystyle \hspace{-8.99994pt}\times \left(\!u\frac{\exp \!\left\{\!\displaystyle -\frac{\ln (D_{0e}^{2/3}u^{2}-D_{0e}^{1/3}u+1)-2\ln (D_{0e}^{1/3}u+1)+2\sqrt{3}\text{arctn}\!\left(\!\frac{2D_{0e}^{1/3}u-1}{\sqrt{3}}\!\right)}{6D_{0e}^{2/3}}\!\right\}}{1+D_{0e}\text{rect}(u-u_{p})u^{3}}\!\right)_{\!\!u=\unicode[STIX]{x1D714}/v_{the}k_{\Vert }}\!.\nonumber\\ \displaystyle & & \displaystyle\end{eqnarray}$$
As is possible to see in (3.15)
![]() $\unicode[STIX]{x1D700}^{\text{Im}}$
depends on
$\unicode[STIX]{x1D700}^{\text{Im}}$
depends on
![]() $P_{d0}$
via the quasi-linear diffusion coefficient equation (3.11) that appears in the distribution function. When solving the dynamical equations (2.2) which are essentially nonlinear, the integration must be performed very carefully as will be explained below. To deduce some feature of the quasi-linear approach with respect to the linear one we can consider (2.2) by considering
$P_{d0}$
via the quasi-linear diffusion coefficient equation (3.11) that appears in the distribution function. When solving the dynamical equations (2.2) which are essentially nonlinear, the integration must be performed very carefully as will be explained below. To deduce some feature of the quasi-linear approach with respect to the linear one we can consider (2.2) by considering
![]() $D_{0e}\gg 1$
, the damping rate becomes
$D_{0e}\gg 1$
, the damping rate becomes
 $$\begin{eqnarray}\displaystyle \unicode[STIX]{x1D700}_{e}^{\text{Im}} & {\sim} & \displaystyle -\frac{\unicode[STIX]{x03C0}}{I(\pm \infty )}\frac{\unicode[STIX]{x1D714}_{pe}^{2}}{k^{2}}\left(\left(\frac{c}{v_{the}n_{\Vert }}\right)\frac{1}{\displaystyle D_{0e}\text{rect}(n_{\Vert }-n_{\Vert p})\frac{1}{2\sqrt{2}}\left(\frac{c}{v_{the}n_{\Vert }}\right)^{3}}\right)\nonumber\\ \displaystyle & {\sim} & \displaystyle \unicode[STIX]{x1D6EC}(r)\frac{\unicode[STIX]{x0394}n_{\Vert }}{P_{d0}\text{rect}(n_{\Vert }-n_{\Vert p})},\end{eqnarray}$$
where
 $$\begin{eqnarray}\unicode[STIX]{x1D6EC}(r)=-\frac{2^{3/2}\unicode[STIX]{x03C0}}{I(\pm \infty )}\frac{\unicode[STIX]{x1D714}_{pe}^{2}}{k^{2}}\frac{\unicode[STIX]{x1D714}\sqrt{-\unicode[STIX]{x1D700}_{zz}\unicode[STIX]{x1D700}_{xx}}}{\displaystyle \left(\frac{c}{v_{the}n_{\Vert }}\right)^{2}\frac{16\unicode[STIX]{x03C0}^{2}}{c(2+Z_{i})\unicode[STIX]{x1D708}_{ee}v_{the}^{2}}\left(\frac{e}{m_{e}}\right)^{2}}\end{eqnarray}$$
and we have singled out the dependence of
![]() $\unicode[STIX]{x1D700}^{\text{Im}}$
on the width of the spectrum and the power density. In this limit (2.2) can be formally integrated and we have
$\unicode[STIX]{x1D700}^{\text{Im}}$
on the width of the spectrum and the power density. In this limit (2.2) can be formally integrated and we have
It is worth noting that the higher the power density coupled to the plasma, the lower the integrand in (3.18) and consequently the power tends to penetrate more deeply into the plasma. The contrary holds for the width of the spectrum. Narrower power spectra have the tendency to penetrate better into the plasma and deposit energy in a more central region (Cardinali et al.
Reference Cardinali, Castaldo, Cesario, Santini, Amicucci, Ceccuzzi, Galli, Mirizzi, Napoli and Panaccione2017). In figure 5 we show the damping rate for DEMO plasma parameters as in figures 1 and 2 and plasma current
![]() $I=18~\text{MA}$
, the magnetic field on axis
$I=18~\text{MA}$
, the magnetic field on axis
![]() $B_{0}=6.8~\text{T}$
for two different spectra (a) wide
$B_{0}=6.8~\text{T}$
for two different spectra (a) wide
![]() $\unicode[STIX]{x0394}n_{\Vert }=n_{\Vert 2}-n_{\Vert 1}=1$
(red circles) with the minimum and maximum values of the spectrum
$\unicode[STIX]{x0394}n_{\Vert }=n_{\Vert 2}-n_{\Vert 1}=1$
(red circles) with the minimum and maximum values of the spectrum
![]() $n_{\Vert 1}=1.3{-}n_{\Vert 2}=2.3$
and (b) narrow
$n_{\Vert 1}=1.3{-}n_{\Vert 2}=2.3$
and (b) narrow
![]() $\unicode[STIX]{x0394}n_{\Vert }=0.6$
(black circles), with
$\unicode[STIX]{x0394}n_{\Vert }=0.6$
(black circles), with
![]() $n_{\Vert 1}=1.5{-}n_{\Vert 2}=2.1$
; and
$n_{\Vert 1}=1.5{-}n_{\Vert 2}=2.1$
; and
![]() $n_{\Vert p}=1.8$
, and the related Maxwellian damping (green and pale blue lines). The plot clearly shows the behaviour expected by formula (3.18). In figure 6 the power deposition profiles related to the damping rate of figure 5 are shown versus the normalized radial variable
$n_{\Vert p}=1.8$
, and the related Maxwellian damping (green and pale blue lines). The plot clearly shows the behaviour expected by formula (3.18). In figure 6 the power deposition profiles related to the damping rate of figure 5 are shown versus the normalized radial variable
![]() $x$
.
$x$
.
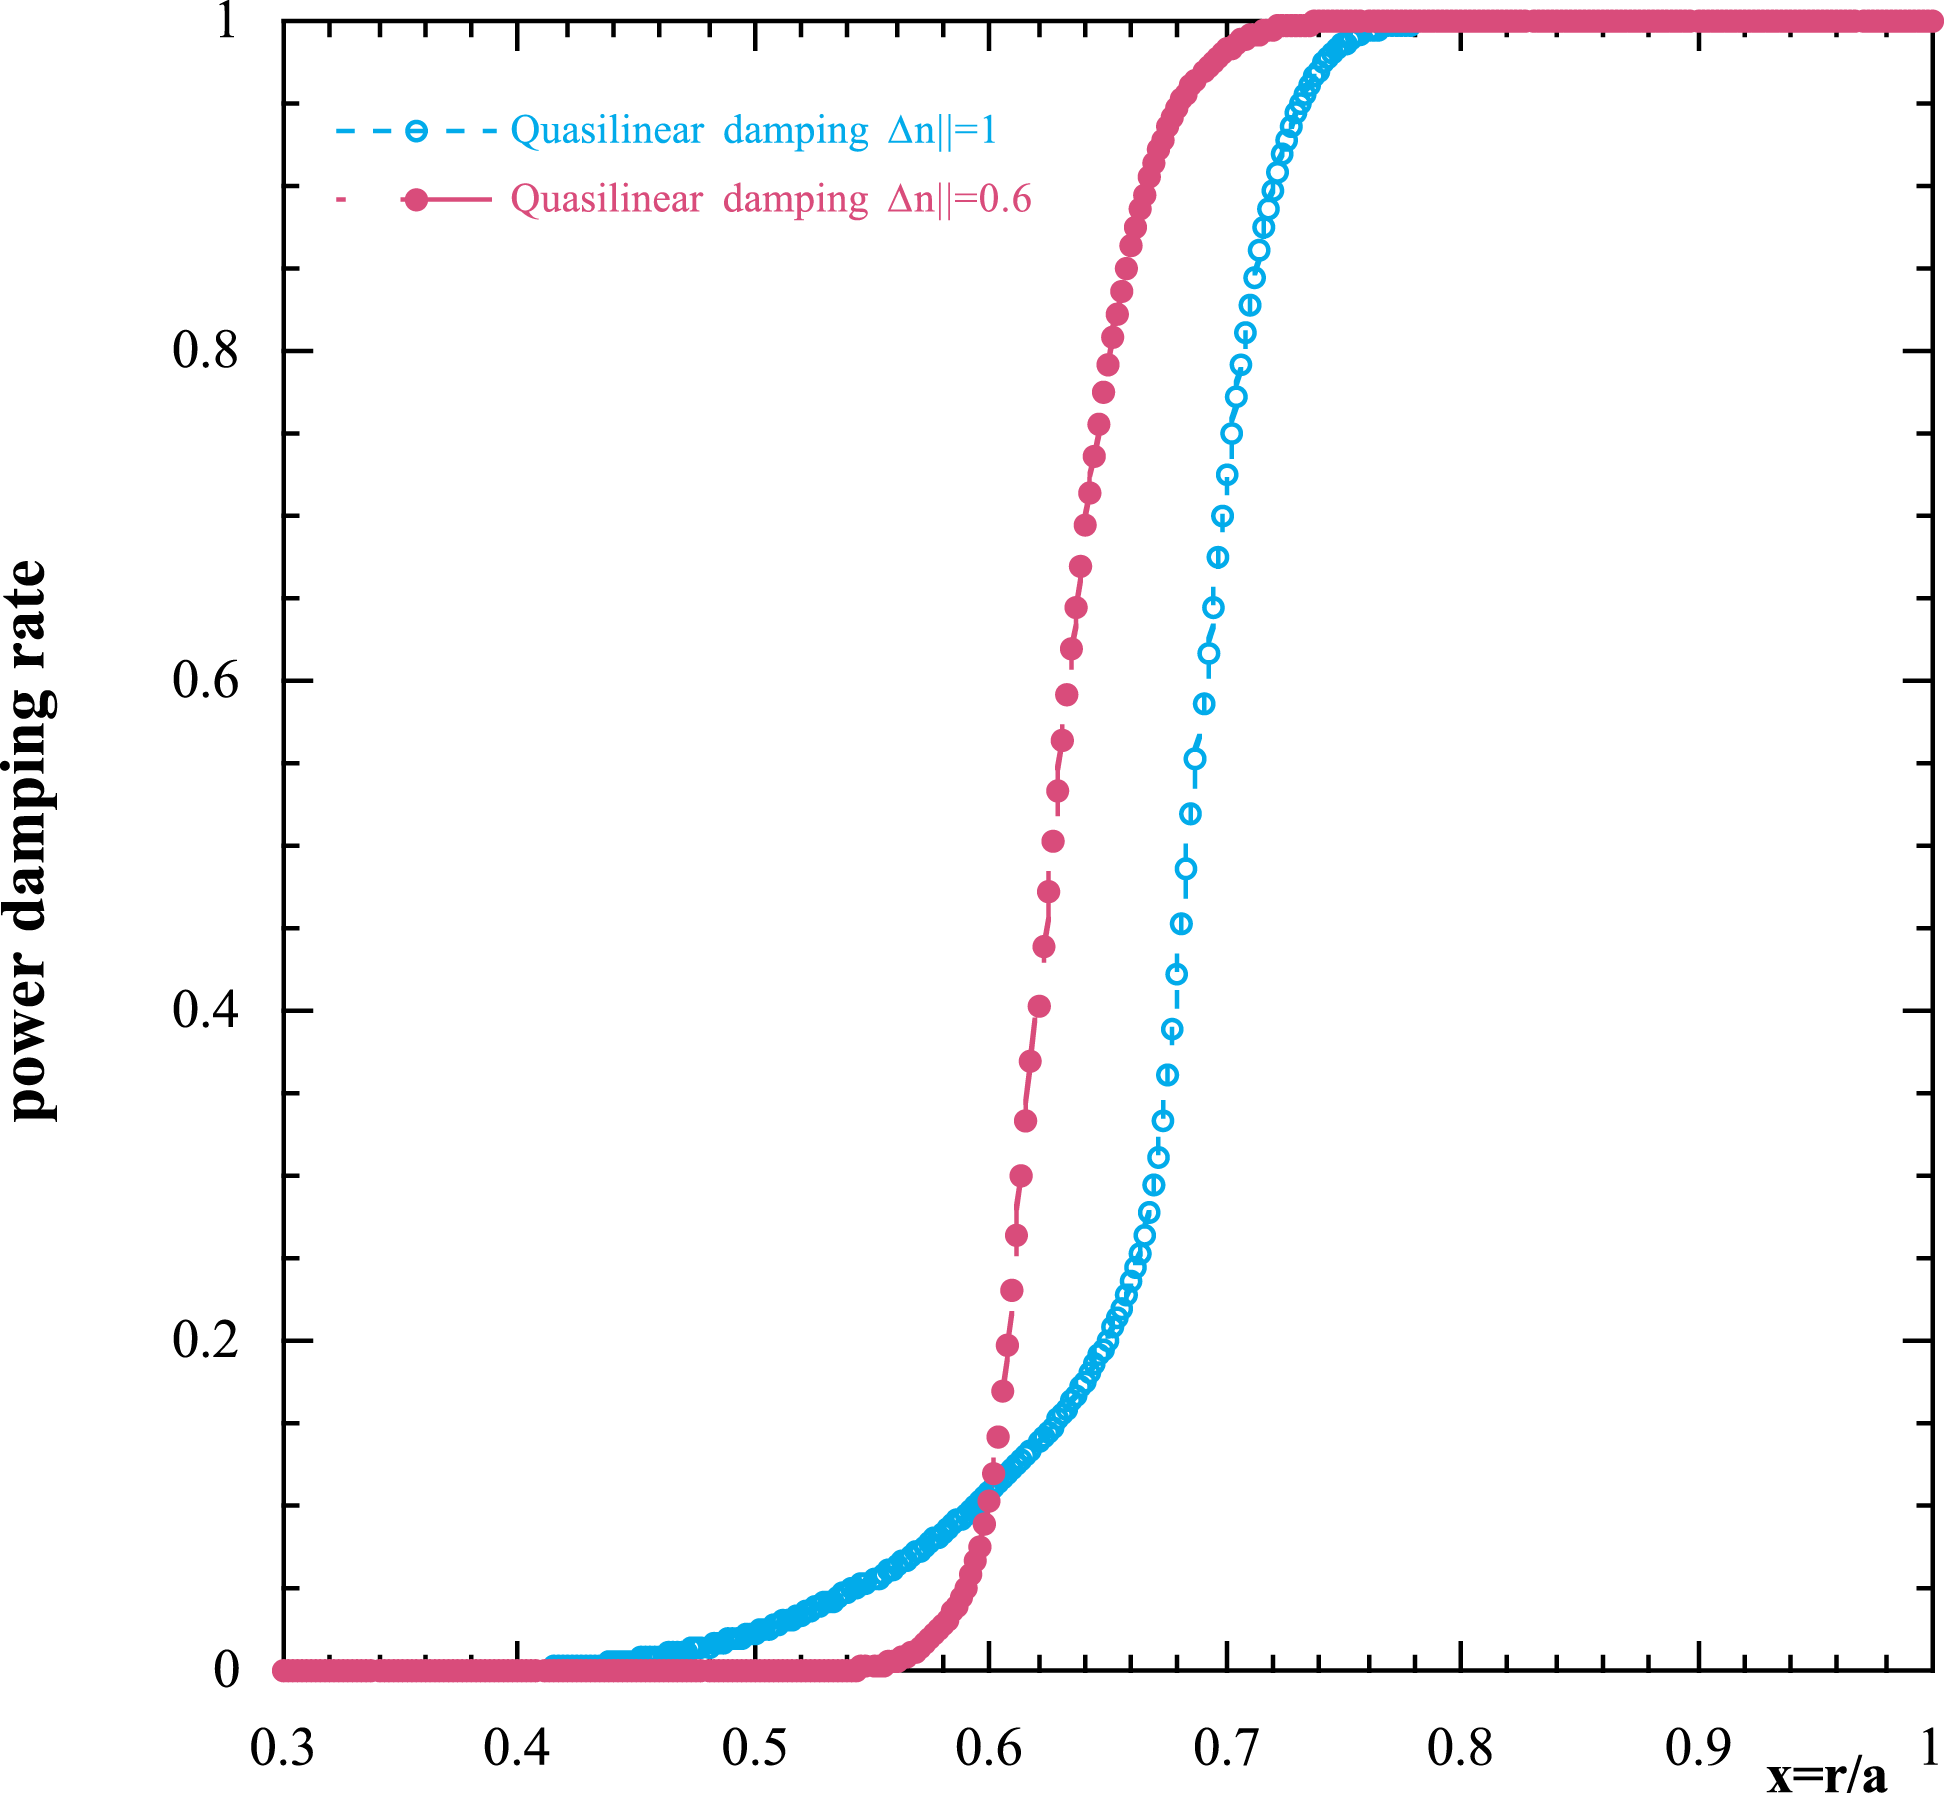
Figure 5. Damping rate versus the normalized radial variable for DEMO plasma parameters as in figure 1 and plasma current
![]() $I=18~\text{MA}$
, magnetic field on axis
$I=18~\text{MA}$
, magnetic field on axis
![]() $B_{0}=6.8~\text{T}$
for two different flat spectra (a) wide
$B_{0}=6.8~\text{T}$
for two different flat spectra (a) wide
![]() $\unicode[STIX]{x0394}n_{\Vert }=1$
(pale blue line) and (b) narrow
$\unicode[STIX]{x0394}n_{\Vert }=1$
(pale blue line) and (b) narrow
![]() $\unicode[STIX]{x0394}n_{\Vert }=0.6$
(red line), with
$\unicode[STIX]{x0394}n_{\Vert }=0.6$
(red line), with
![]() $n_{\Vert p}=1.8$
(peak value).
$n_{\Vert p}=1.8$
(peak value).
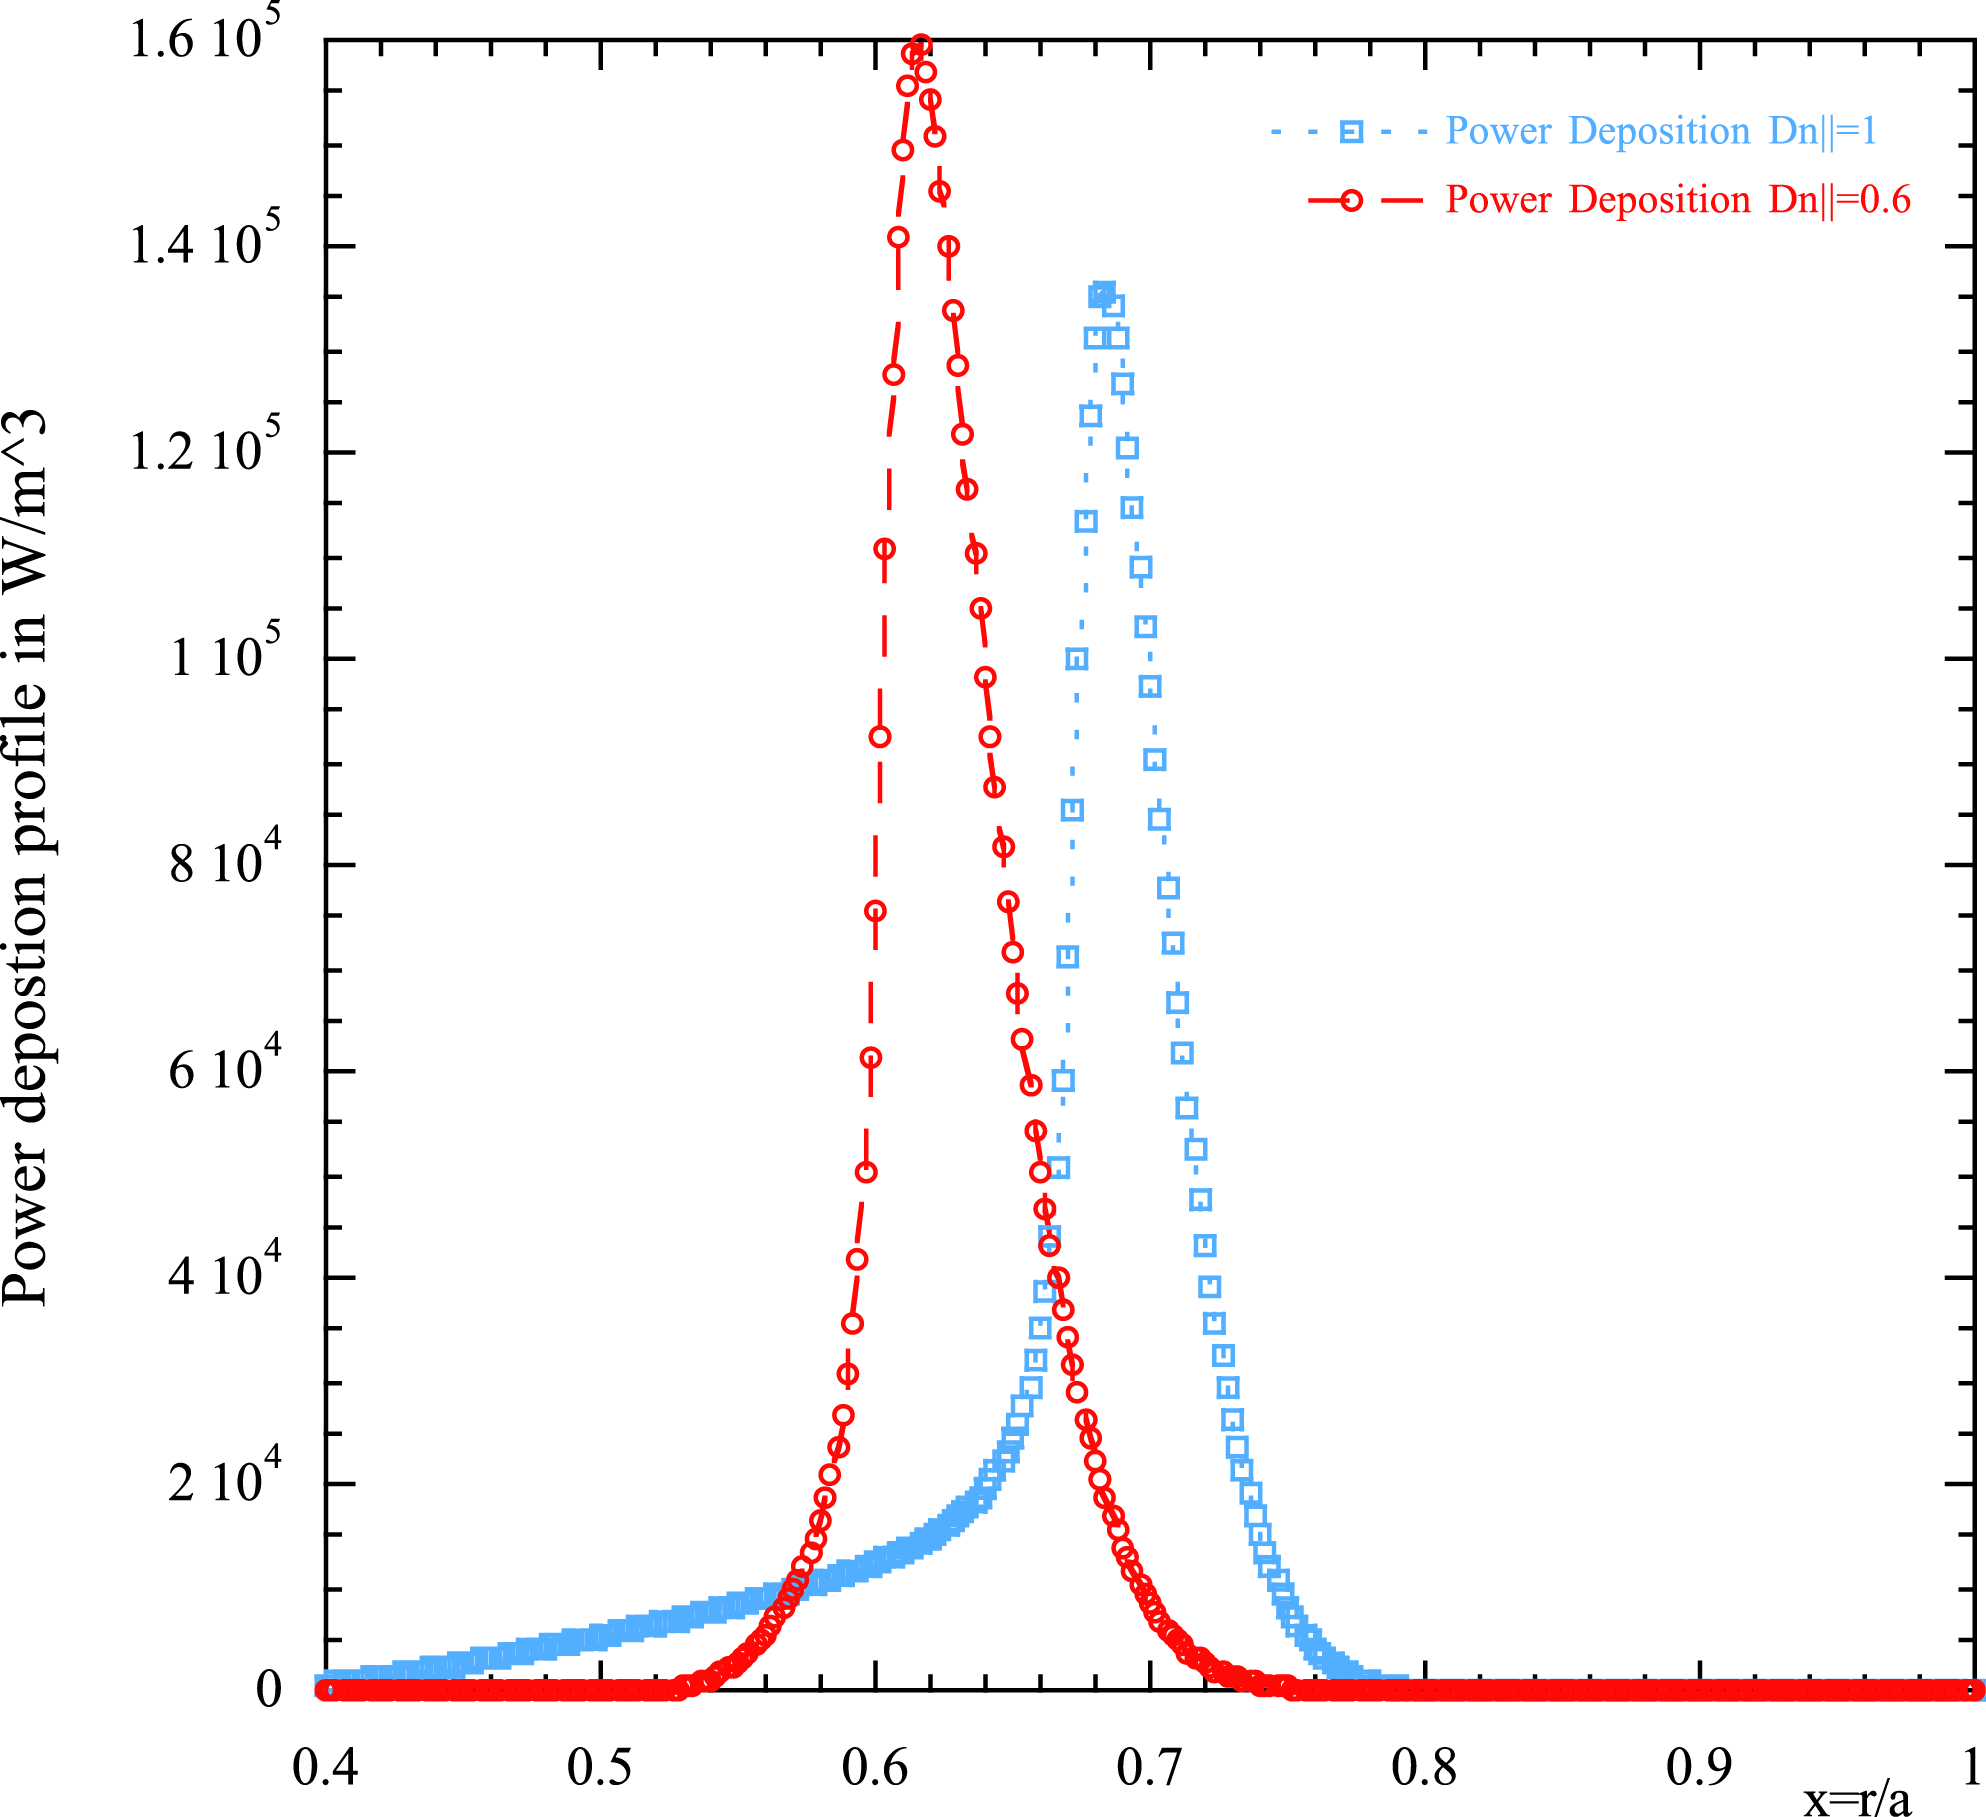
Figure 6. Power deposition profiles in
![]() $\text{W}~\text{m}^{-3}$
(related to the quasi-linear damping rate of figure 5 case
$\text{W}~\text{m}^{-3}$
(related to the quasi-linear damping rate of figure 5 case
![]() $\unicode[STIX]{x0394}n_{\Vert }=0.6$
) versus the normalized radial variable. The same plot shows the power deposition profile for Maxwellian (linear) damping (red line).
$\unicode[STIX]{x0394}n_{\Vert }=0.6$
) versus the normalized radial variable. The same plot shows the power deposition profile for Maxwellian (linear) damping (red line).
3.3 Ion distribution function: quasi-linear solution
To evaluate the ion distribution function under the action of the LH wave, we follow the derivation of Brambilla & Chen (Reference Brambilla and Chen1983), where the 1-D quasi-linear Fokker–Planck equation (at the steady state) for the ion distribution function in the perpendicular direction is solved considering the ion–ion collision frequency. This equation can be derived by considering the high velocity limit
![]() $v\gg v_{ths}$
for the ion–ion collisions operator while disregarding the ion–electron collisions. We have:
$v\gg v_{ths}$
for the ion–ion collisions operator while disregarding the ion–electron collisions. We have:
 $$\begin{eqnarray}\frac{1}{f_{i}(w)}\frac{\unicode[STIX]{x2202}f_{i}(w)}{\unicode[STIX]{x2202}w}=-\frac{\displaystyle 2\frac{m_{i}}{m_{s}}w}{(1+2\sqrt{2}w^{3}D(w))},\end{eqnarray}$$
where
![]() $D(w)=D_{\bot \bot }(w)/\unicode[STIX]{x1D708}^{i,s}v_{ths}^{2}$
,
$D(w)=D_{\bot \bot }(w)/\unicode[STIX]{x1D708}^{i,s}v_{ths}^{2}$
,
![]() $w=v_{\bot }/\sqrt{2}v_{thi}$
, the subscript ‘
$w=v_{\bot }/\sqrt{2}v_{thi}$
, the subscript ‘
![]() $i$
’ refers to the test ions while ‘
$i$
’ refers to the test ions while ‘
![]() $s$
’ refers to the background species which in the reactor can be either deuterium and tritium, and
$s$
’ refers to the background species which in the reactor can be either deuterium and tritium, and
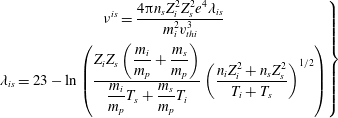 $$\begin{eqnarray}\left.\begin{array}{@{}c@{}}\displaystyle \unicode[STIX]{x1D708}^{is}=\frac{4\unicode[STIX]{x03C0}n_{s}Z_{i}^{2}Z_{s}^{2}e^{4}\unicode[STIX]{x1D706}_{is}}{m_{i}^{2}v_{thi}^{3}}\\ \displaystyle \unicode[STIX]{x1D706}_{is}=23-\ln \left(\frac{\displaystyle Z_{i}Z_{s}\left(\frac{m_{i}}{m_{p}}+\frac{m_{s}}{m_{p}}\right)}{\displaystyle \frac{m_{i}}{m_{p}}T_{s}+\frac{m_{s}}{m_{p}}T_{i}}\left(\frac{n_{i}Z_{i}^{2}+n_{s}Z_{s}^{2}}{T_{i}+T_{s}}\right)^{1/2}\right)\end{array}\right\}\end{eqnarray}$$
are respectively the ion collision frequency and the Coulomb logarithm. The quasi-linear diffusion coefficient is constructed by following the argument outlined in Karney (Reference Karney1979). In our case, in the limit of zero parallel velocity, the quasi-linear diffusion coefficient can be written as
with
![]() $\unicode[STIX]{x1D706}=k_{\bot }v_{\bot }/\unicode[STIX]{x1D6FA}_{ci}=nk_{\bot }v_{\bot }/\unicode[STIX]{x1D714}$
, for
$\unicode[STIX]{x1D706}=k_{\bot }v_{\bot }/\unicode[STIX]{x1D6FA}_{ci}=nk_{\bot }v_{\bot }/\unicode[STIX]{x1D714}$
, for
![]() $v_{\bot }>\unicode[STIX]{x1D714}/k_{\bot }$
, where
$v_{\bot }>\unicode[STIX]{x1D714}/k_{\bot }$
, where
![]() $n$
is fixed by the resonance conditions and
$n$
is fixed by the resonance conditions and
![]() $n\gg 1$
, we have
$n\gg 1$
, we have
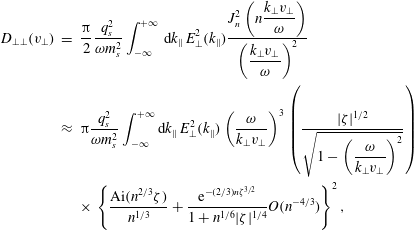 $$\begin{eqnarray}\displaystyle D_{\bot \bot }(v_{\bot }) & = & \displaystyle \frac{\unicode[STIX]{x03C0}}{2}\frac{q_{s}^{2}}{\unicode[STIX]{x1D714}m_{s}^{2}}\int _{-\infty }^{+\infty }\,\text{d}k_{\Vert }\,E_{\bot }^{2}(k_{\Vert })\frac{\displaystyle J_{n}^{2}\left(n\frac{k_{\bot }v_{\bot }}{\unicode[STIX]{x1D714}}\right)}{\displaystyle \left(\frac{k_{\bot }v_{\bot }}{\unicode[STIX]{x1D714}}\right)^{2}}\nonumber\\ \displaystyle & {\approx} & \displaystyle \unicode[STIX]{x03C0}\frac{q_{s}^{2}}{\unicode[STIX]{x1D714}m_{s}^{2}}\int _{-\infty }^{+\infty }\text{d}k_{\Vert }\,E_{\bot }^{2}(k_{\Vert })\left(\frac{\unicode[STIX]{x1D714}}{k_{\bot }v_{\bot }}\right)^{3}\left(\frac{|\unicode[STIX]{x1D701}|^{1/2}}{\displaystyle \sqrt{1-\left(\frac{\unicode[STIX]{x1D714}}{k_{\bot }v_{\bot }}\right)^{2}}}\right)\nonumber\\ \displaystyle & & \displaystyle \times \,\left\{\frac{\text{Ai}(n^{2/3}\unicode[STIX]{x1D701})}{n^{1/3}}+\frac{\text{e}^{-(2/3)n\unicode[STIX]{x1D701}^{3/2}}}{1+n^{1/6}|\unicode[STIX]{x1D701}|^{1/4}}O(n^{-4/3})\right\}^{2},\end{eqnarray}$$
where we have developed for large argument and harmonic number
![]() $n(k_{\bot }v_{\bot }/\unicode[STIX]{x1D714})\gg 1$
, and
$n(k_{\bot }v_{\bot }/\unicode[STIX]{x1D714})\gg 1$
, and
 $$\begin{eqnarray}|\unicode[STIX]{x1D701}|^{1/2}=\left[\frac{3}{2}\left(\sqrt{\left(\frac{k_{\bot }v_{\bot }}{\unicode[STIX]{x1D714}}\right)^{2}-1}-\arccos \left(\frac{\unicode[STIX]{x1D714}}{k_{\bot }v_{\bot }}\right)\right)\right]^{1/3}.\end{eqnarray}$$
For large
![]() $D(w)w^{3}\gg 1$
we can assume
$D(w)w^{3}\gg 1$
we can assume
![]() $D(w)w^{3}=\text{const.}$
, shaped as
$D(w)w^{3}=\text{const.}$
, shaped as
![]() $D_{0i}\text{rect}(k_{\bot }-k_{\bot p})$
. This rectangular interval in
$D_{0i}\text{rect}(k_{\bot }-k_{\bot p})$
. This rectangular interval in
![]() $k_{\bot }$
can be easily calculated by using the cold electrostatic dispersion relation (2.3), and the following relation that is easily obtained
$k_{\bot }$
can be easily calculated by using the cold electrostatic dispersion relation (2.3), and the following relation that is easily obtained
and
where by means of the Poynting theorem
and
![]() $g(k_{\Vert })$
, as in the case of electrons, is a function which represents the power spectrum. Equation (3.19) can be integrated
$g(k_{\Vert })$
, as in the case of electrons, is a function which represents the power spectrum. Equation (3.19) can be integrated
 $$\begin{eqnarray}f_{i}(w)=C_{i}\exp \left(-\int _{0}^{w}\text{d}w\frac{2\displaystyle \frac{m_{i}}{m_{s}}w}{(1+2\sqrt{2}D_{0i})}\right)=C_{i}\exp \left(-\frac{m_{i}}{m_{s}}\frac{w^{2}}{(1+2\sqrt{2}D_{0i})}\right).\end{eqnarray}$$
This distribution function, as has been remarked in Brambilla & Chen (Reference Brambilla and Chen1983), describes a Maxwellian with an effective ion temperature given by
where
![]() $v_{thieff}=\sqrt{\unicode[STIX]{x1D705}T_{i-\text{eff}}/m_{i}c}$
is the thermal velocity corresponding to the effective temperature above. Note that this distribution function describes the interaction RF-ions in the velocity range
$v_{thieff}=\sqrt{\unicode[STIX]{x1D705}T_{i-\text{eff}}/m_{i}c}$
is the thermal velocity corresponding to the effective temperature above. Note that this distribution function describes the interaction RF-ions in the velocity range
![]() $v_{\bot }/v_{ths}>\unicode[STIX]{x1D714}/v_{ths}k_{\bot 2}(k_{\Vert })$
, where
$v_{\bot }/v_{ths}>\unicode[STIX]{x1D714}/v_{ths}k_{\bot 2}(k_{\Vert })$
, where
![]() $k_{\bot 2}(k_{\Vert })$
is the higher value of the perpendicular wavenumber which corresponds to the higher
$k_{\bot 2}(k_{\Vert })$
is the higher value of the perpendicular wavenumber which corresponds to the higher
![]() $k_{\Vert }$
excited by the power spectrum. The effect is to create a tail in the distribution function that extends up to very high velocities. For velocities such that
$k_{\Vert }$
excited by the power spectrum. The effect is to create a tail in the distribution function that extends up to very high velocities. For velocities such that
![]() $v_{\bot }/v_{ths}<\unicode[STIX]{x1D714}/v_{ths}k_{\bot 2}(k_{\Vert })$
, the distribution function is the usual Maxwellian. The constant
$v_{\bot }/v_{ths}<\unicode[STIX]{x1D714}/v_{ths}k_{\bot 2}(k_{\Vert })$
, the distribution function is the usual Maxwellian. The constant
![]() $C_{i}$
can be calculated by normalizing both of the ion distribution functions. A plot of the distribution function (3.27), at various radial positions and under the action of the LH power in the DEMO plasma (same plasma parameters as in the previous figures) is given in figures 7(a) and 7(b), where in (a), in the calculation of the velocity range
$C_{i}$
can be calculated by normalizing both of the ion distribution functions. A plot of the distribution function (3.27), at various radial positions and under the action of the LH power in the DEMO plasma (same plasma parameters as in the previous figures) is given in figures 7(a) and 7(b), where in (a), in the calculation of the velocity range
![]() $v_{\bot }/v_{ths}>\unicode[STIX]{x1D714}/v_{ths}k_{\bot 2}(k_{\Vert })$
, the value of the central density is
$v_{\bot }/v_{ths}>\unicode[STIX]{x1D714}/v_{ths}k_{\bot 2}(k_{\Vert })$
, the value of the central density is
![]() $n_{0e}=10^{20}~\text{m}^{-3}$
, and in (b)
$n_{0e}=10^{20}~\text{m}^{-3}$
, and in (b)
![]() $n_{0e}=2\times 10^{20}~\text{m}^{-3}$
. It is evident from these figures that a noticeable interaction between the wave and the plasma will produce some quasi-linear effects only for a central density greater than
$n_{0e}=2\times 10^{20}~\text{m}^{-3}$
. It is evident from these figures that a noticeable interaction between the wave and the plasma will produce some quasi-linear effects only for a central density greater than
![]() $2\times 10^{14}~\text{cm}^{-3}$
. Below this threshold the wave–plasma interaction occurs in a zone at very high energy where the ion density is extremely low. By using the second of (2.6) we are able to calculate the damping function for the bulk ion species in the tail
$2\times 10^{14}~\text{cm}^{-3}$
. Below this threshold the wave–plasma interaction occurs in a zone at very high energy where the ion density is extremely low. By using the second of (2.6) we are able to calculate the damping function for the bulk ion species in the tail
In figure 8 is plotted the strength of the damping function, equation (3.29), as a function of
![]() $\unicode[STIX]{x1D714}/v_{ths}k_{\bot }$
at various radial positions for
$\unicode[STIX]{x1D714}/v_{ths}k_{\bot }$
at various radial positions for
![]() $k_{\bot }(x,k_{\Vert \text{peak}})$
which corresponds to the
$k_{\bot }(x,k_{\Vert \text{peak}})$
which corresponds to the
![]() $k_{\Vert }$
peak of the power spectrum and for central density (a) blue line
$k_{\Vert }$
peak of the power spectrum and for central density (a) blue line
![]() $n_{0}=10^{20}~\text{m}^{-3}$
, (b) red line
$n_{0}=10^{20}~\text{m}^{-3}$
, (b) red line
![]() $n_{0}=1.5\times 10^{20}~\text{m}^{-3}$
, (c) green line
$n_{0}=1.5\times 10^{20}~\text{m}^{-3}$
, (c) green line
![]() $n_{0}=2\times 10^{20}~\text{m}^{-3}$
. With
$n_{0}=2\times 10^{20}~\text{m}^{-3}$
. With
![]() $k_{\bot }\sim (\unicode[STIX]{x1D714}_{pe}/\unicode[STIX]{x1D714})k_{\Vert }$
the results clearly show that the higher the density and/or the higher the parallel wavenumber, the higher the value of
$k_{\bot }\sim (\unicode[STIX]{x1D714}_{pe}/\unicode[STIX]{x1D714})k_{\Vert }$
the results clearly show that the higher the density and/or the higher the parallel wavenumber, the higher the value of
![]() $k_{\bot }$
. This means that the tail in the distribution function will be formed at lower velocities
$k_{\bot }$
. This means that the tail in the distribution function will be formed at lower velocities
![]() $v_{\bot }>\unicode[STIX]{x1D714}/k_{\bot 2}\sim \unicode[STIX]{x1D714}^{2}/\unicode[STIX]{x1D714}_{pe}k_{\Vert 2}$
and more ions will be extracted from the bulk. Consequently the strength of the imaginary part of the dielectric function equation (3.29) will increase on increasing the central density. In figure 9 the power density profiles is plotted versus the normalized plasma radius corresponding to the damping function of figure 8. An appreciable power deposition on the ion species is seen only for densities grater than
$v_{\bot }>\unicode[STIX]{x1D714}/k_{\bot 2}\sim \unicode[STIX]{x1D714}^{2}/\unicode[STIX]{x1D714}_{pe}k_{\Vert 2}$
and more ions will be extracted from the bulk. Consequently the strength of the imaginary part of the dielectric function equation (3.29) will increase on increasing the central density. In figure 9 the power density profiles is plotted versus the normalized plasma radius corresponding to the damping function of figure 8. An appreciable power deposition on the ion species is seen only for densities grater than
![]() $1.75\times 10^{20}~\text{m}^{-3}$
.
$1.75\times 10^{20}~\text{m}^{-3}$
.
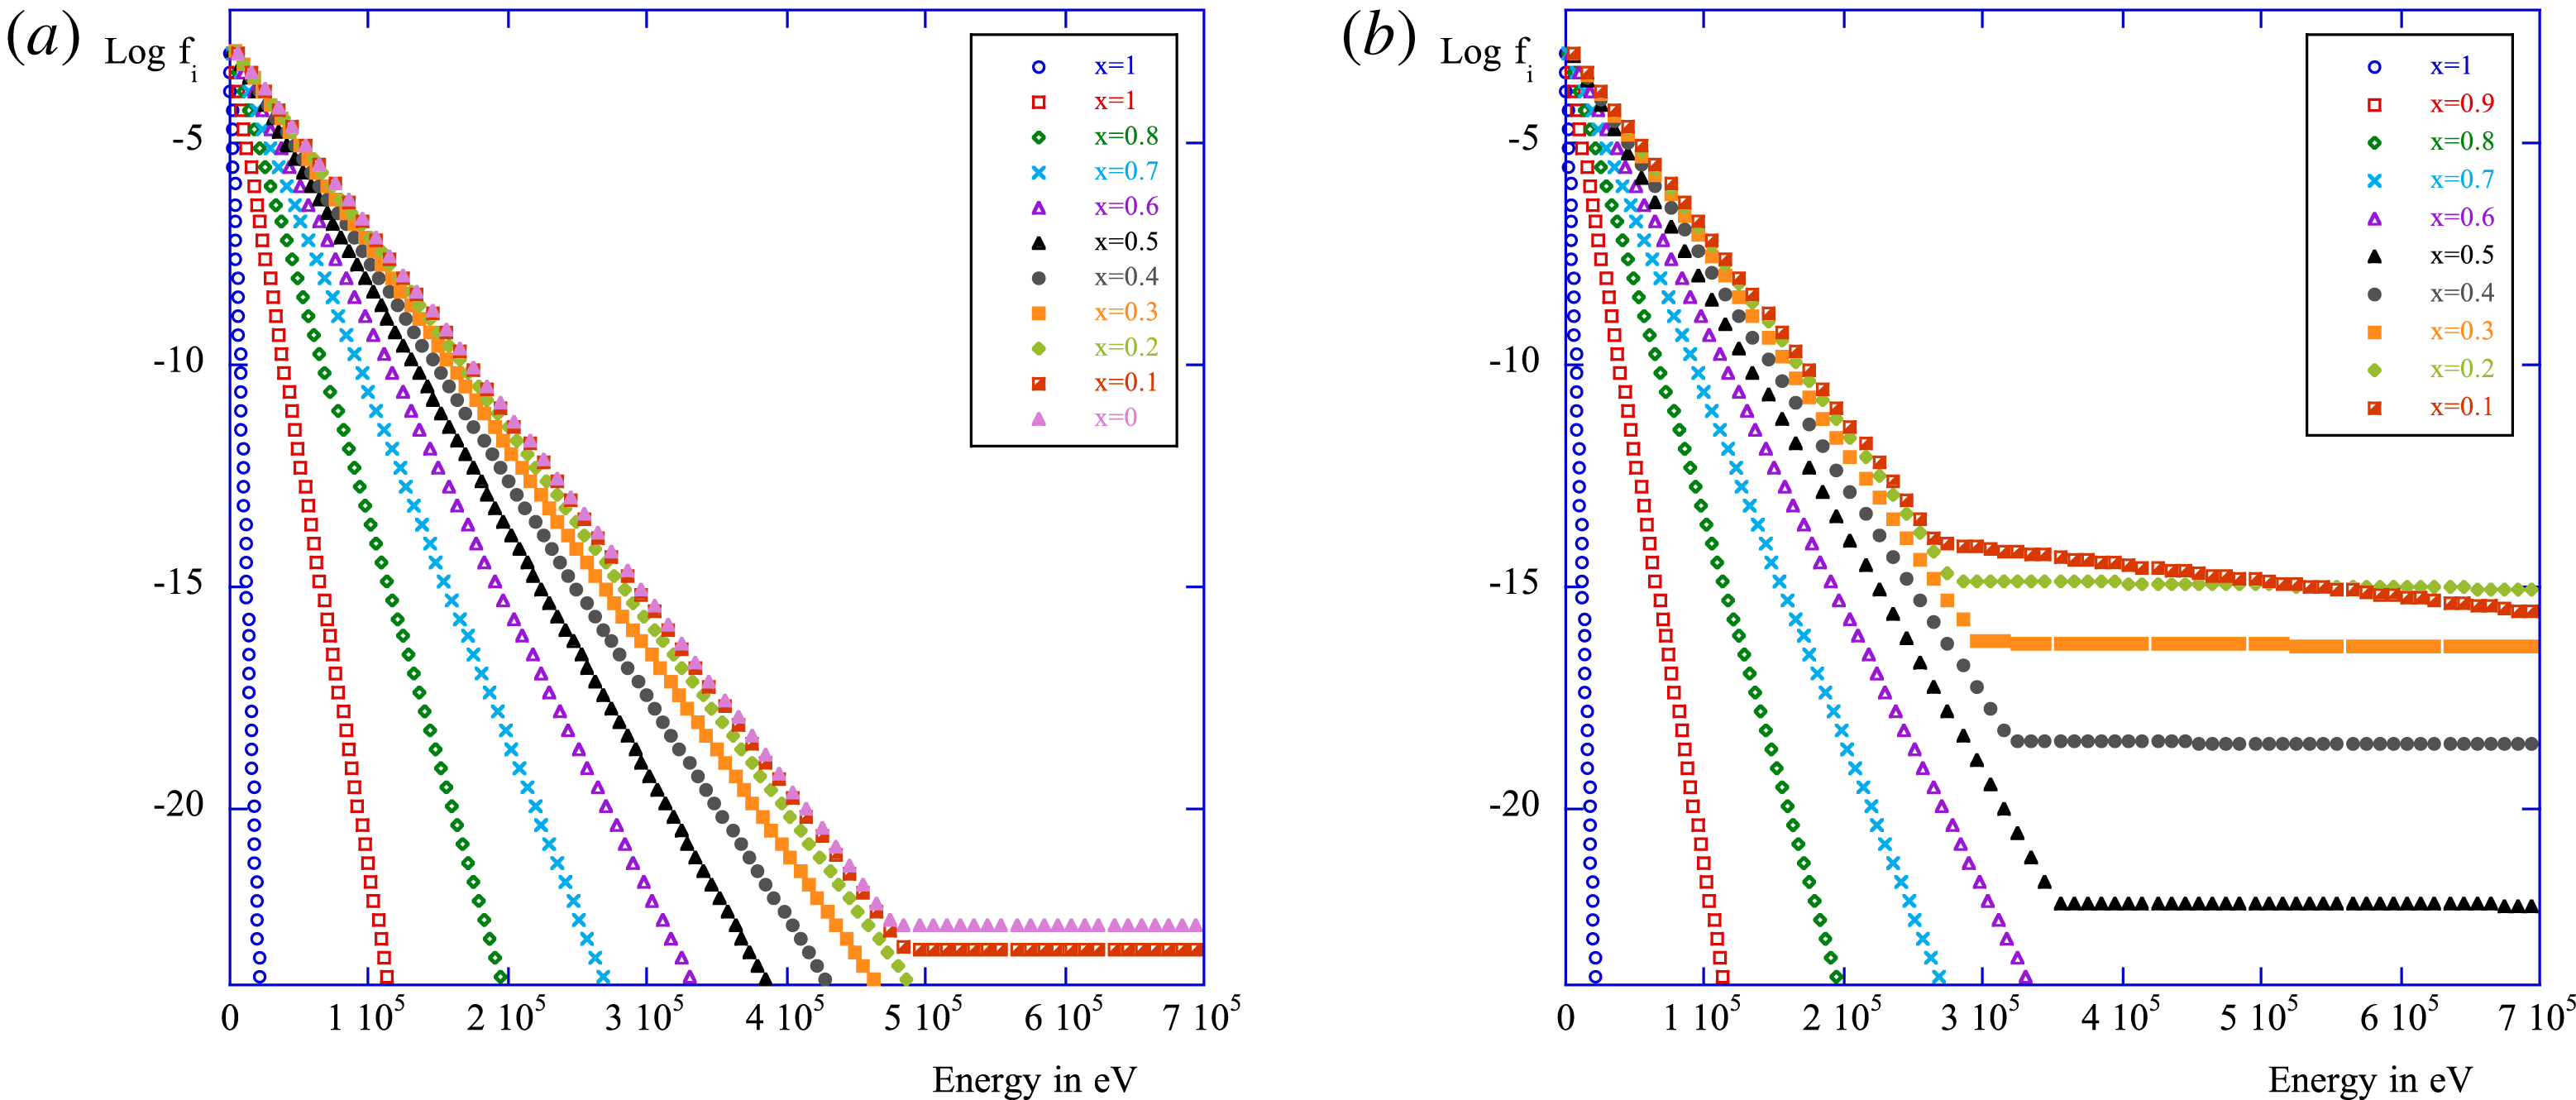
Figure 7. (a) Distribution function
![]() $\text{Log}(f_{i})$
versus the energy in eV for DEMO plasma parameters with a central density
$\text{Log}(f_{i})$
versus the energy in eV for DEMO plasma parameters with a central density
![]() $n_{0}=10^{20}~\text{m}^{-3}$
; (b) same plot as (a) but with
$n_{0}=10^{20}~\text{m}^{-3}$
; (b) same plot as (a) but with
![]() $n_{0}=2\times 10^{20}~\text{m}^{-3}$
.
$n_{0}=2\times 10^{20}~\text{m}^{-3}$
.
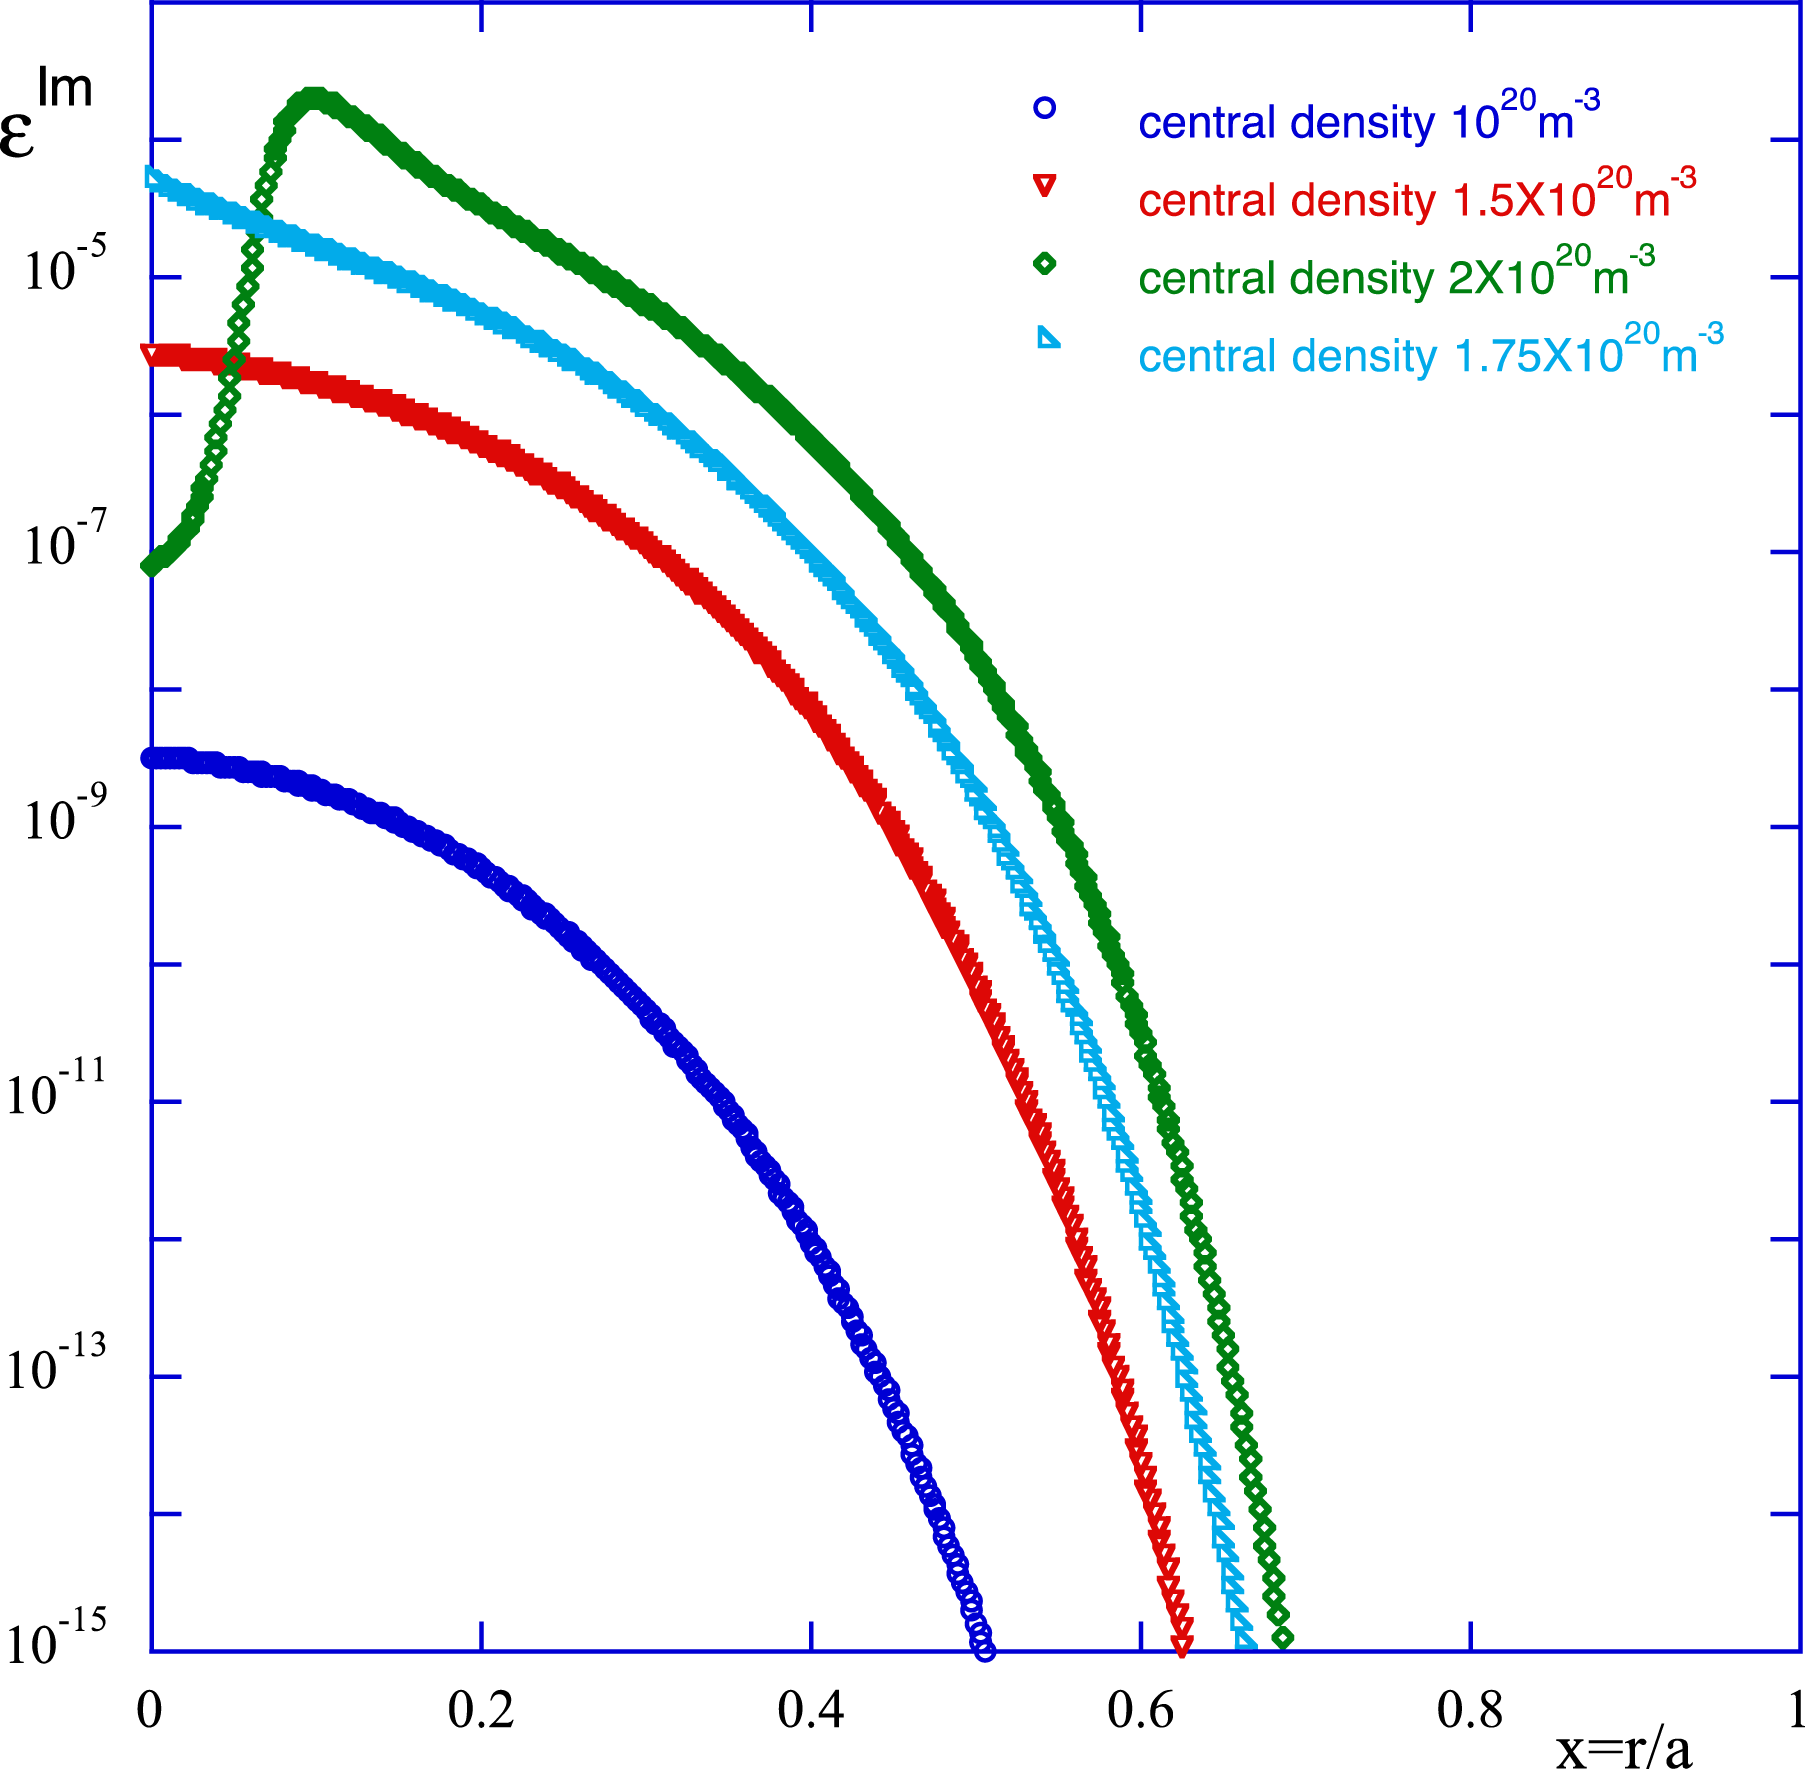
Figure 8. Plot of the strength of the imaginary part of the dielectric function (logarithm) as a function of the normalized radial variable and for four different values of the central density: (i) blue
![]() $n_{0}=10^{20}~\text{m}^{-3}$
; (ii) red
$n_{0}=10^{20}~\text{m}^{-3}$
; (ii) red
![]() $n_{0}=1.5\times 10^{20}~\text{m}^{-3}$
; (iii) pale blue
$n_{0}=1.5\times 10^{20}~\text{m}^{-3}$
; (iii) pale blue
![]() $n_{0}=1.5\times 10^{20}~\text{m}^{-3}$
and (iv) green
$n_{0}=1.5\times 10^{20}~\text{m}^{-3}$
and (iv) green
![]() $n_{0}=2\times 10^{20}~\text{m}^{-3}$
.
$n_{0}=2\times 10^{20}~\text{m}^{-3}$
.
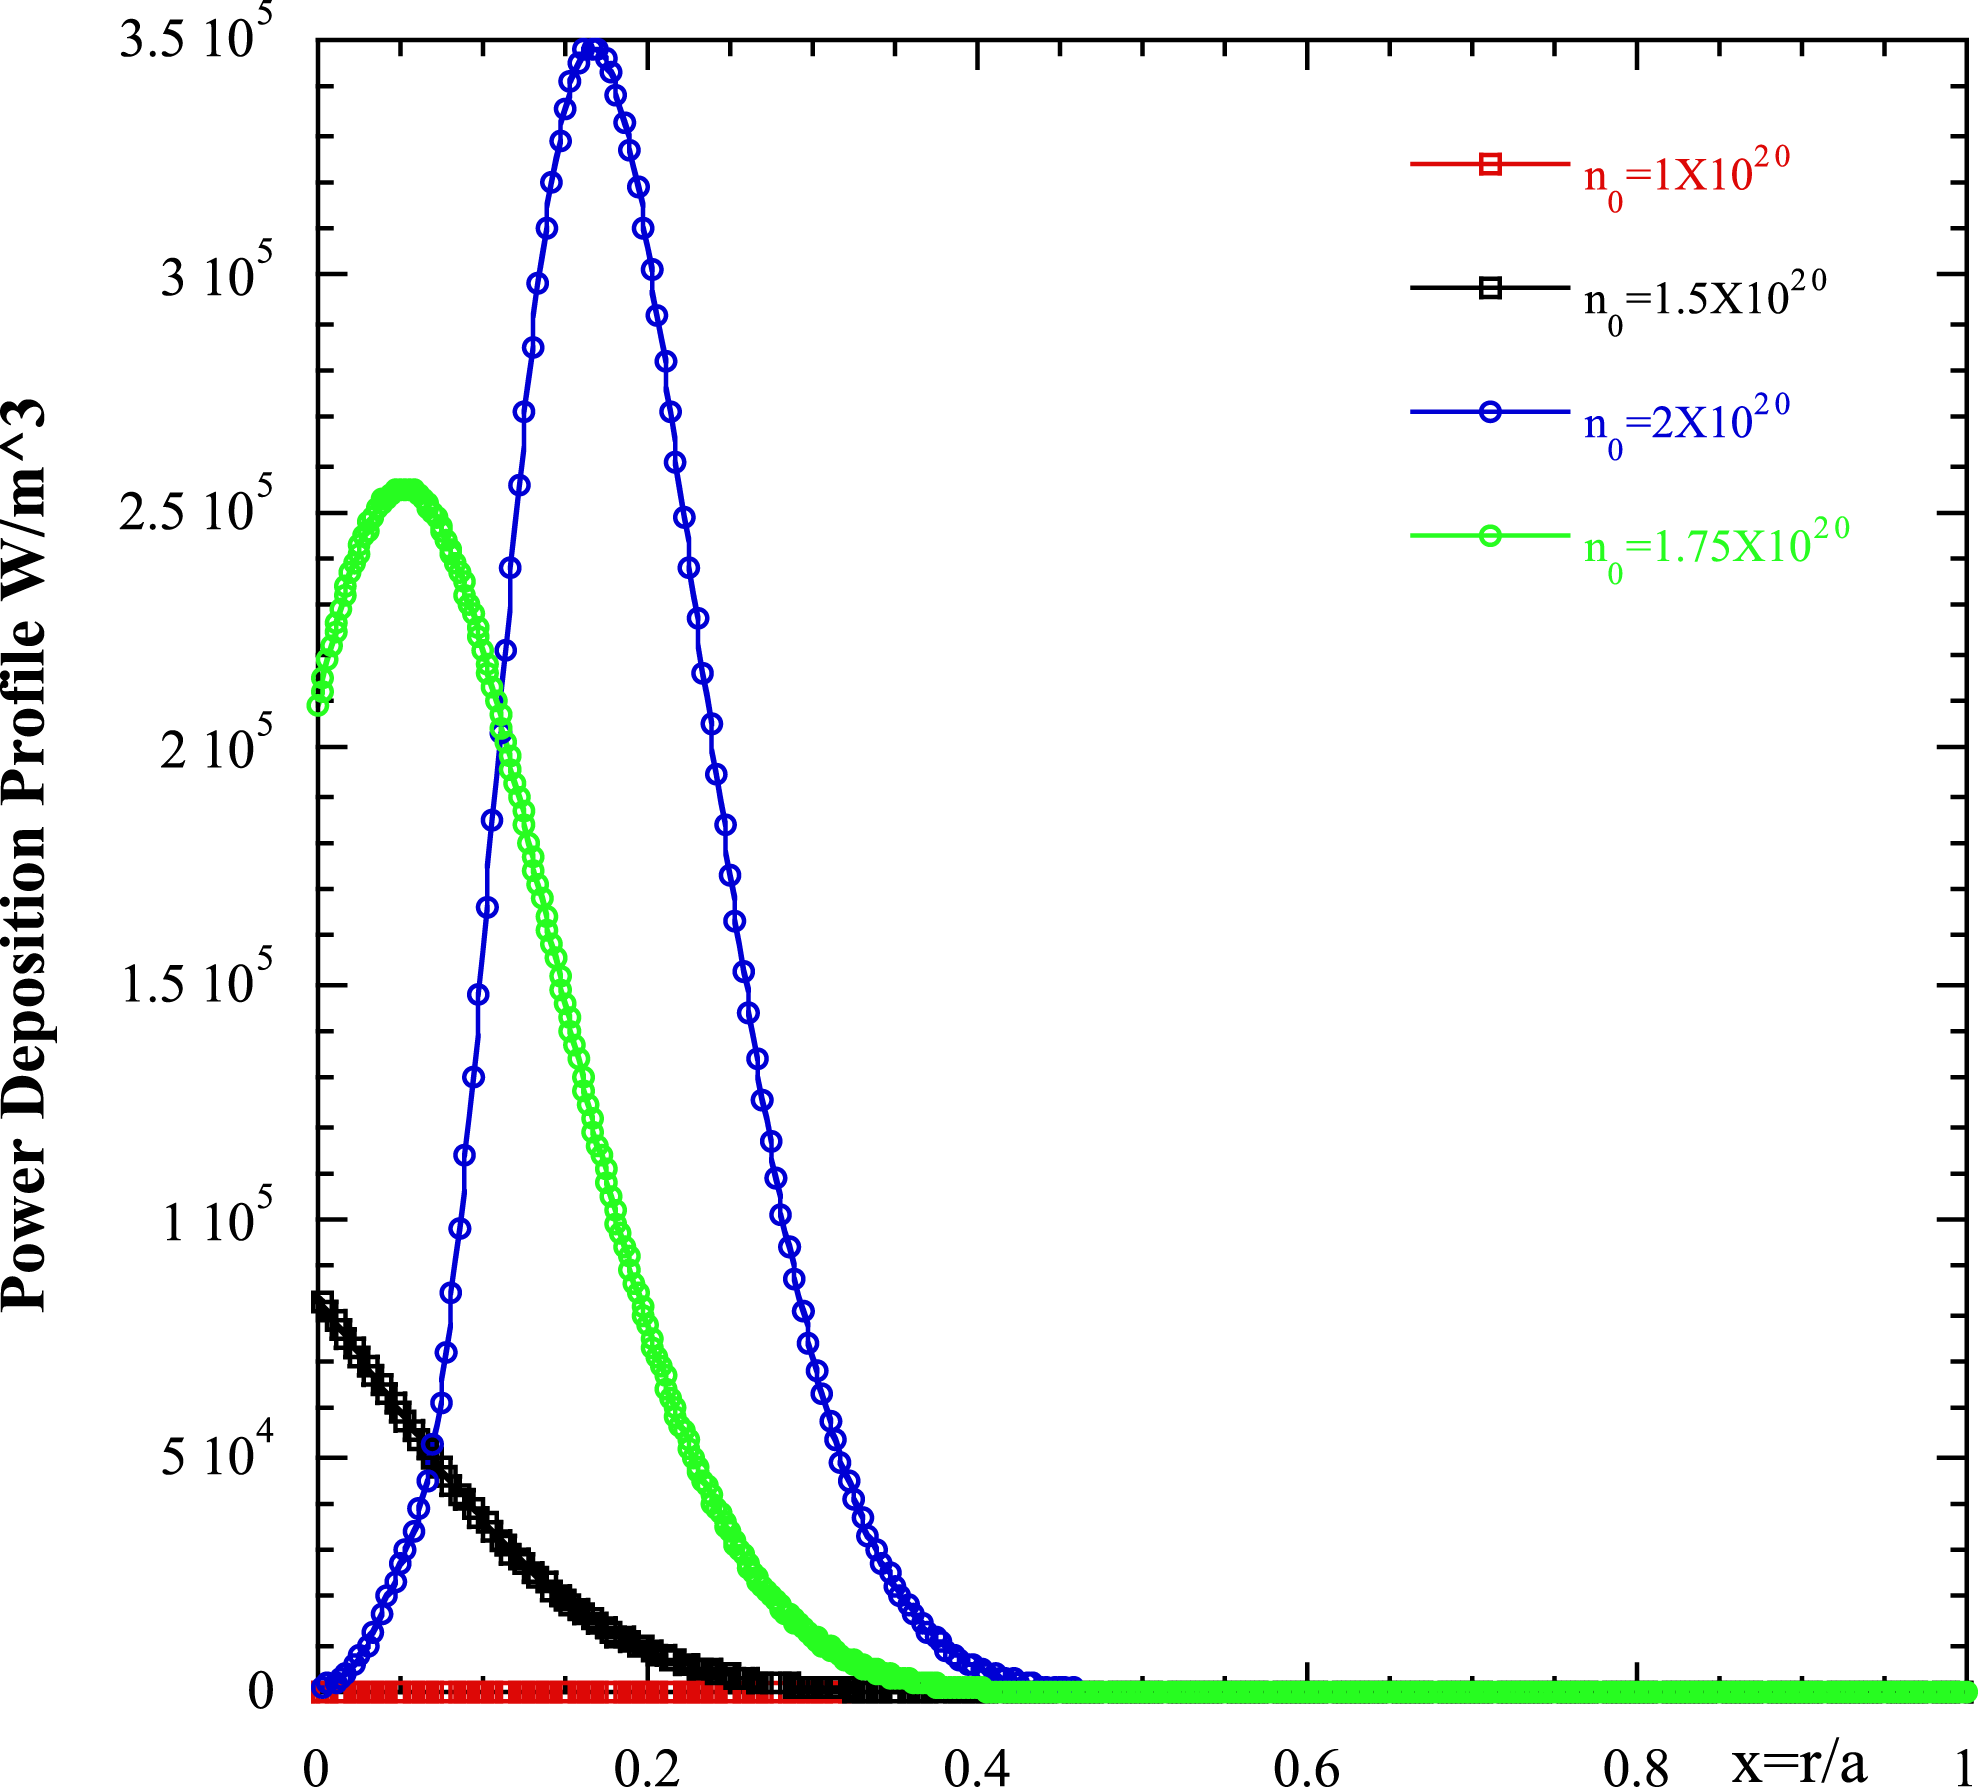
Figure 9. Power deposition profiles in
![]() $\text{W}~\text{m}^{-3}$
versus the normalized plasma radius for the bulk ions of the DEMO plasma parameters as in figure 8 and the same density range.
$\text{W}~\text{m}^{-3}$
versus the normalized plasma radius for the bulk ions of the DEMO plasma parameters as in figure 8 and the same density range.
4 Numerical results of the ray-tracing and power transport equations and determination of the quasi-linear power deposition profiles for
 $\unicode[STIX]{x1D6FC}$
-particles, ions and electrons
Solution of (2.5) (the power transport equation) can be obtained by quadrature considering the position and wave vector determined by the analytical formulae obtained in (2.4) and the damping rate expression given in (3.6)–(3.15) and (3.29) for
![]() $\unicode[STIX]{x1D6FC}$
-particles, electrons and ions respectively. The equation to be solved is
$\unicode[STIX]{x1D6FC}$
-particles, electrons and ions respectively. The equation to be solved is
In principle
![]() $\unicode[STIX]{x1D700}^{\text{Im}}$
depends on
$\unicode[STIX]{x1D700}^{\text{Im}}$
depends on
![]() $P_{j}$
via the quasi-linear diffusion coefficient that is present in the distribution function at least for ions and electrons, and the solution of (4.1), which is essentially nonlinear, must be performed very carefully, as will be explained below. The numerical algorithm is based on an iterative procedure. We start from the first closed magnetic surface of the plasma column
$P_{j}$
via the quasi-linear diffusion coefficient that is present in the distribution function at least for ions and electrons, and the solution of (4.1), which is essentially nonlinear, must be performed very carefully, as will be explained below. The numerical algorithm is based on an iterative procedure. We start from the first closed magnetic surface of the plasma column
![]() $r=a$
, and assign there all the initial conditions compatible with the antenna design for the ray tracing. We divide the plasma in several magnetic surfaces, when the trajectory reaches the second magnetic surface we calculate the quasi-linear diffusion coefficient, the distribution function, the quasi-linear damping and the residual power on that surface. Power density and current drive can be also accounted for locally on this magnetic surface:
$r=a$
, and assign there all the initial conditions compatible with the antenna design for the ray tracing. We divide the plasma in several magnetic surfaces, when the trajectory reaches the second magnetic surface we calculate the quasi-linear diffusion coefficient, the distribution function, the quasi-linear damping and the residual power on that surface. Power density and current drive can be also accounted for locally on this magnetic surface:
![]() $J_{CD}=q_{e}\int \text{d}\boldsymbol{v}\,f_{e}(\boldsymbol{v})$
, and
$J_{CD}=q_{e}\int \text{d}\boldsymbol{v}\,f_{e}(\boldsymbol{v})$
, and
![]() $P_{d}=\int \text{d}\boldsymbol{v}\,D_{\Vert \Vert }(\unicode[STIX]{x2202}f_{e}/\unicode[STIX]{x2202}v_{\Vert })$
. Using the new conditions on the second surface we go towards the third magnetic surface and repeat the treatment until all of the power is depleted. In this manner, we are able to reconstruct the power deposition and current driven profiles by taking into account the dissipation of the power on all of the species of the plasma. The plasma we have considered in the calculation is the plasma foreseen for the DEMO pulsed regime in a flat configuration (H-mode) (Zohm et al.
Reference Zohm, Angioni, Fable, Federici, Gantenbein, Hartmann, Lackner, Poli, Porte and Sauter2013; Giruzzi et al.
Reference Giruzzi, Artaud, Baruzzo, Bolzonella, Fable, Garzotti, Ivanova-Stanik, Kemp, King and Schneider2015). The parameters we have used are the same used to produce the previous figures and are summarized here: dimensions
$P_{d}=\int \text{d}\boldsymbol{v}\,D_{\Vert \Vert }(\unicode[STIX]{x2202}f_{e}/\unicode[STIX]{x2202}v_{\Vert })$
. Using the new conditions on the second surface we go towards the third magnetic surface and repeat the treatment until all of the power is depleted. In this manner, we are able to reconstruct the power deposition and current driven profiles by taking into account the dissipation of the power on all of the species of the plasma. The plasma we have considered in the calculation is the plasma foreseen for the DEMO pulsed regime in a flat configuration (H-mode) (Zohm et al.
Reference Zohm, Angioni, Fable, Federici, Gantenbein, Hartmann, Lackner, Poli, Porte and Sauter2013; Giruzzi et al.
Reference Giruzzi, Artaud, Baruzzo, Bolzonella, Fable, Garzotti, Ivanova-Stanik, Kemp, King and Schneider2015). The parameters we have used are the same used to produce the previous figures and are summarized here: dimensions
![]() $a=2.25~\text{m}$
and
$a=2.25~\text{m}$
and
![]() $R_{0}=9~\text{m}$
; central density is
$R_{0}=9~\text{m}$
; central density is
![]() $n_{0}=0.9\times 10^{20}~\text{m}^{-3}$
, central electron and ion temperatures
$n_{0}=0.9\times 10^{20}~\text{m}^{-3}$
, central electron and ion temperatures
![]() $T_{e/i}=24~\text{keV}$
(the profiles are shown in figure 10(a) for the density and figure 10(b) for the temperature), plasma current
$T_{e/i}=24~\text{keV}$
(the profiles are shown in figure 10(a) for the density and figure 10(b) for the temperature), plasma current
![]() $I=18~\text{MA}$
; magnetic field on axis
$I=18~\text{MA}$
; magnetic field on axis
![]() $B_{0}=6.8~\text{T}$
; frequency
$B_{0}=6.8~\text{T}$
; frequency
![]() $f_{LH}=5~\text{GHz}$
and
$f_{LH}=5~\text{GHz}$
and
![]() $k_{\Vert p}=(\unicode[STIX]{x1D714}/c)n_{\Vert p}=1.89~\text{cm}^{-1}$
and two different Gaussian spectra
$k_{\Vert p}=(\unicode[STIX]{x1D714}/c)n_{\Vert p}=1.89~\text{cm}^{-1}$
and two different Gaussian spectra
![]() $P(n_{\Vert })=P_{0}\text{e}^{-(n_{\Vert }-n_{\Vert p})^{2}/2\unicode[STIX]{x1D70E}^{2}}$
(a) wide
$P(n_{\Vert })=P_{0}\text{e}^{-(n_{\Vert }-n_{\Vert p})^{2}/2\unicode[STIX]{x1D70E}^{2}}$
(a) wide
![]() $\unicode[STIX]{x1D70E}=0.5$
and (b) narrow
$\unicode[STIX]{x1D70E}=0.5$
and (b) narrow
![]() $\unicode[STIX]{x1D70E}=0.1$
, directivity 60 % and coupled power around 50 MW.
$\unicode[STIX]{x1D70E}=0.1$
, directivity 60 % and coupled power around 50 MW.
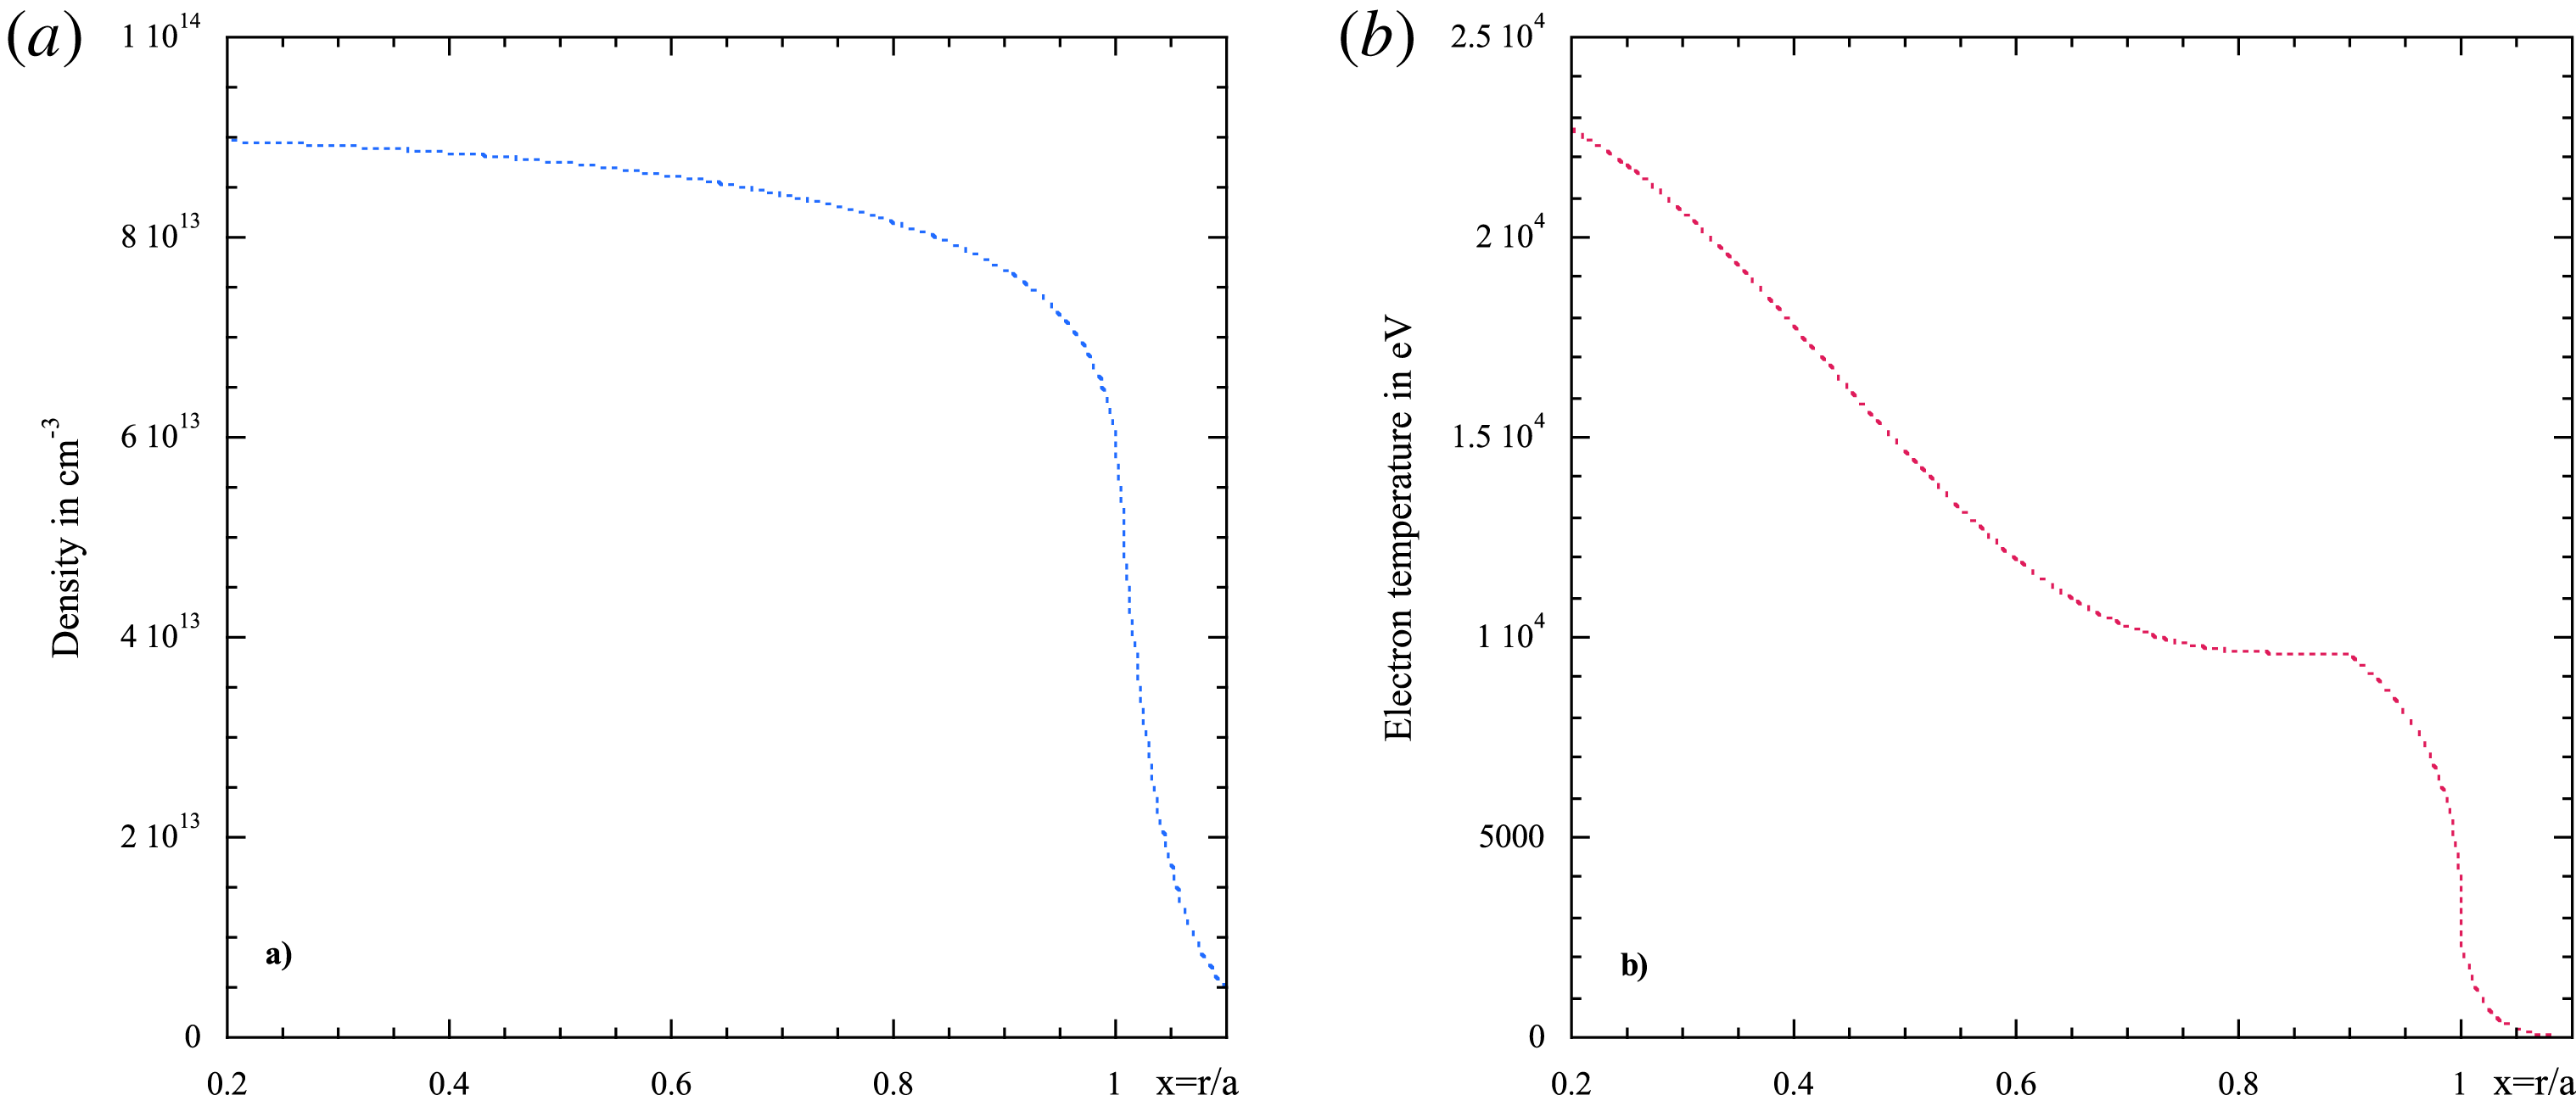
Figure 10. (a) Density profile versus
![]() $x=r/a$
in
$x=r/a$
in
![]() $\text{cm}^{-3}$
; (b) temperature profile versus
$\text{cm}^{-3}$
; (b) temperature profile versus
![]() $x=r/a$
in eV.
$x=r/a$
in eV.
We have, moreover, considered in the plasma three different concentrations of
![]() $\unicode[STIX]{x1D6FC}$
-particles (i) 0.5 %, (ii) 1 %, and (iii) 2 %. In figure 11 we show the power density profile (and the related damping rate) versus
$\unicode[STIX]{x1D6FC}$
-particles (i) 0.5 %, (ii) 1 %, and (iii) 2 %. In figure 11 we show the power density profile (and the related damping rate) versus
![]() $x=r/a$
when coupling approximately 30 MW of the LH power, in the absence of
$x=r/a$
when coupling approximately 30 MW of the LH power, in the absence of
![]() $\unicode[STIX]{x1D6FC}$
-particles and the thermal ion effects. The curve labelled with (a) corresponds to the narrow spectrum and (b) to the broad. It is easy, also in this realistic case (Gaussian spectrum), to recognize the effect of the spectrum extension on the penetration of the wave deposition, as stated in formula (3.18). In figure 12 the same plot as figure 11 is presented for a spectrum extension
$\unicode[STIX]{x1D6FC}$
-particles and the thermal ion effects. The curve labelled with (a) corresponds to the narrow spectrum and (b) to the broad. It is easy, also in this realistic case (Gaussian spectrum), to recognize the effect of the spectrum extension on the penetration of the wave deposition, as stated in formula (3.18). In figure 12 the same plot as figure 11 is presented for a spectrum extension
![]() $\unicode[STIX]{x1D70E}=0.1$
, and two different coupled (absorbed) powers (a)
$\unicode[STIX]{x1D70E}=0.1$
, and two different coupled (absorbed) powers (a)
![]() $P=55~\text{MW}$
, (b)
$P=55~\text{MW}$
, (b)
![]() $P=35~\text{MW}$
. Also in this case the behaviour of formula (3.18) can be recovered. The electrons are extremely efficient in absorbing the wave power in the outer half-radius
$P=35~\text{MW}$
. Also in this case the behaviour of formula (3.18) can be recovered. The electrons are extremely efficient in absorbing the wave power in the outer half-radius
![]() $(r_{\text{peak}}/a)\sim 0.9$
when using the wide power spectrum (b) while the deposition becomes more central
$(r_{\text{peak}}/a)\sim 0.9$
when using the wide power spectrum (b) while the deposition becomes more central
![]() $(r_{\text{peak}}/a)\sim 0.5$
when using the narrow power spectrum (a). The same happens when increasing the coupled power. The presence of
$(r_{\text{peak}}/a)\sim 0.5$
when using the narrow power spectrum (a). The same happens when increasing the coupled power. The presence of
![]() $\unicode[STIX]{x1D6FC}$
-particles and the bulk ions can alter the wave absorption on the electron species and reduce consequently the current drive efficiency.
$\unicode[STIX]{x1D6FC}$
-particles and the bulk ions can alter the wave absorption on the electron species and reduce consequently the current drive efficiency.
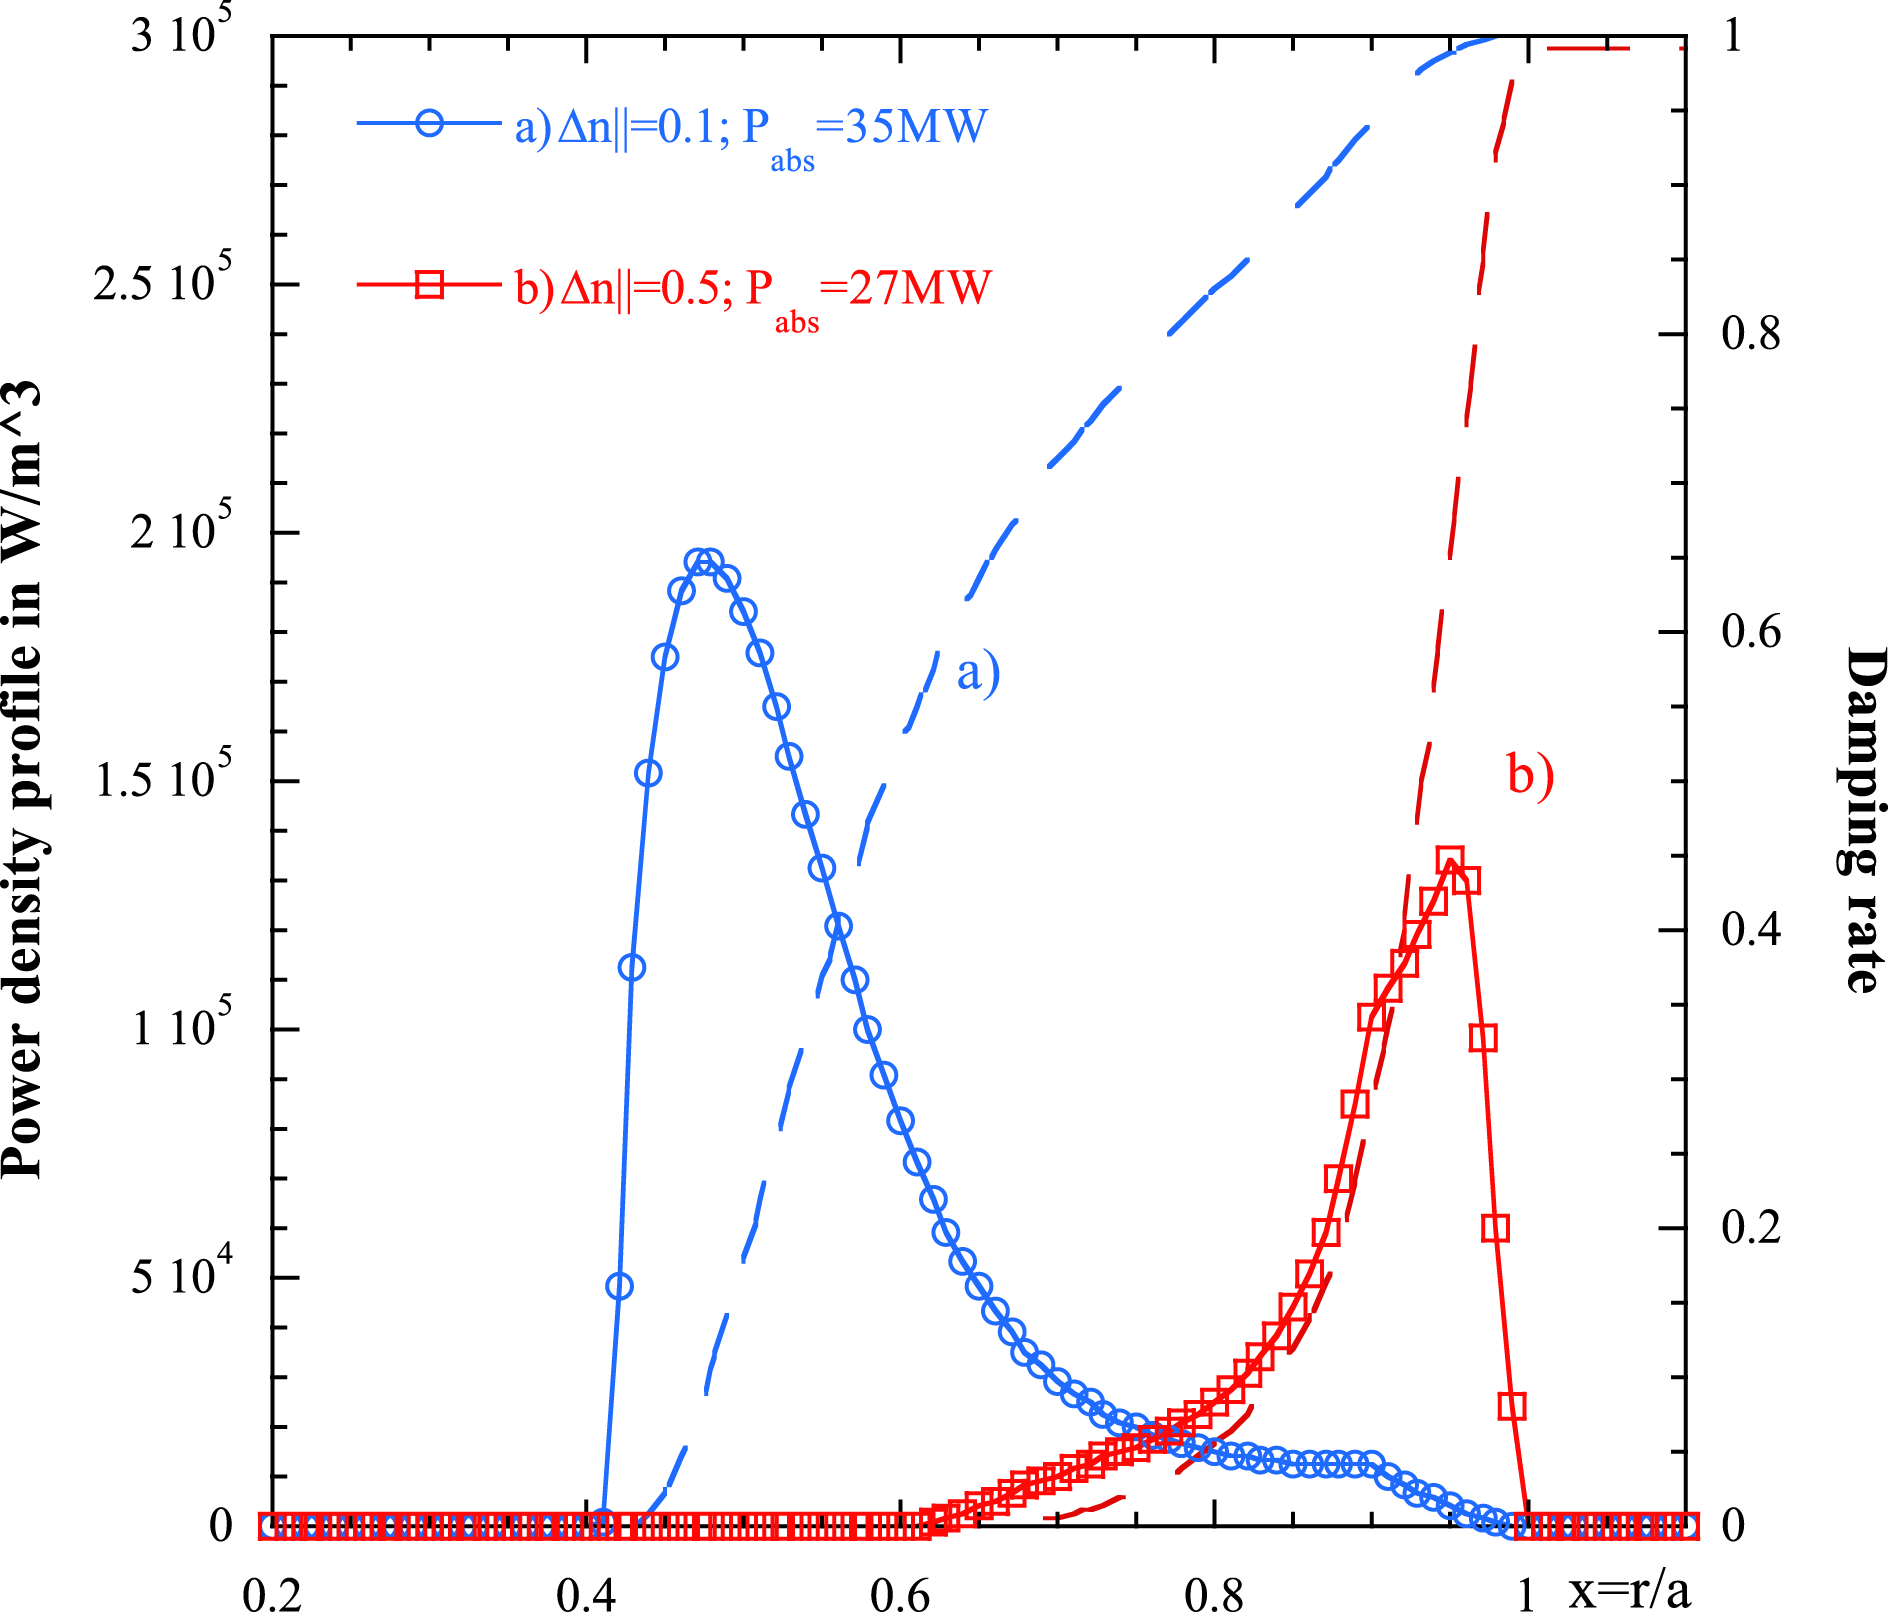
Figure 11. Power density profile (and the related damping rate) versus
![]() $x=r/a$
when coupling approximately 30MW of the LH power, in the absence of
$x=r/a$
when coupling approximately 30MW of the LH power, in the absence of
![]() $\unicode[STIX]{x1D6FC}$
-particles and thermal ion effects. The curve labelled with (a) corresponds to the narrow spectrum and (b) to the broad spectrum.
$\unicode[STIX]{x1D6FC}$
-particles and thermal ion effects. The curve labelled with (a) corresponds to the narrow spectrum and (b) to the broad spectrum.
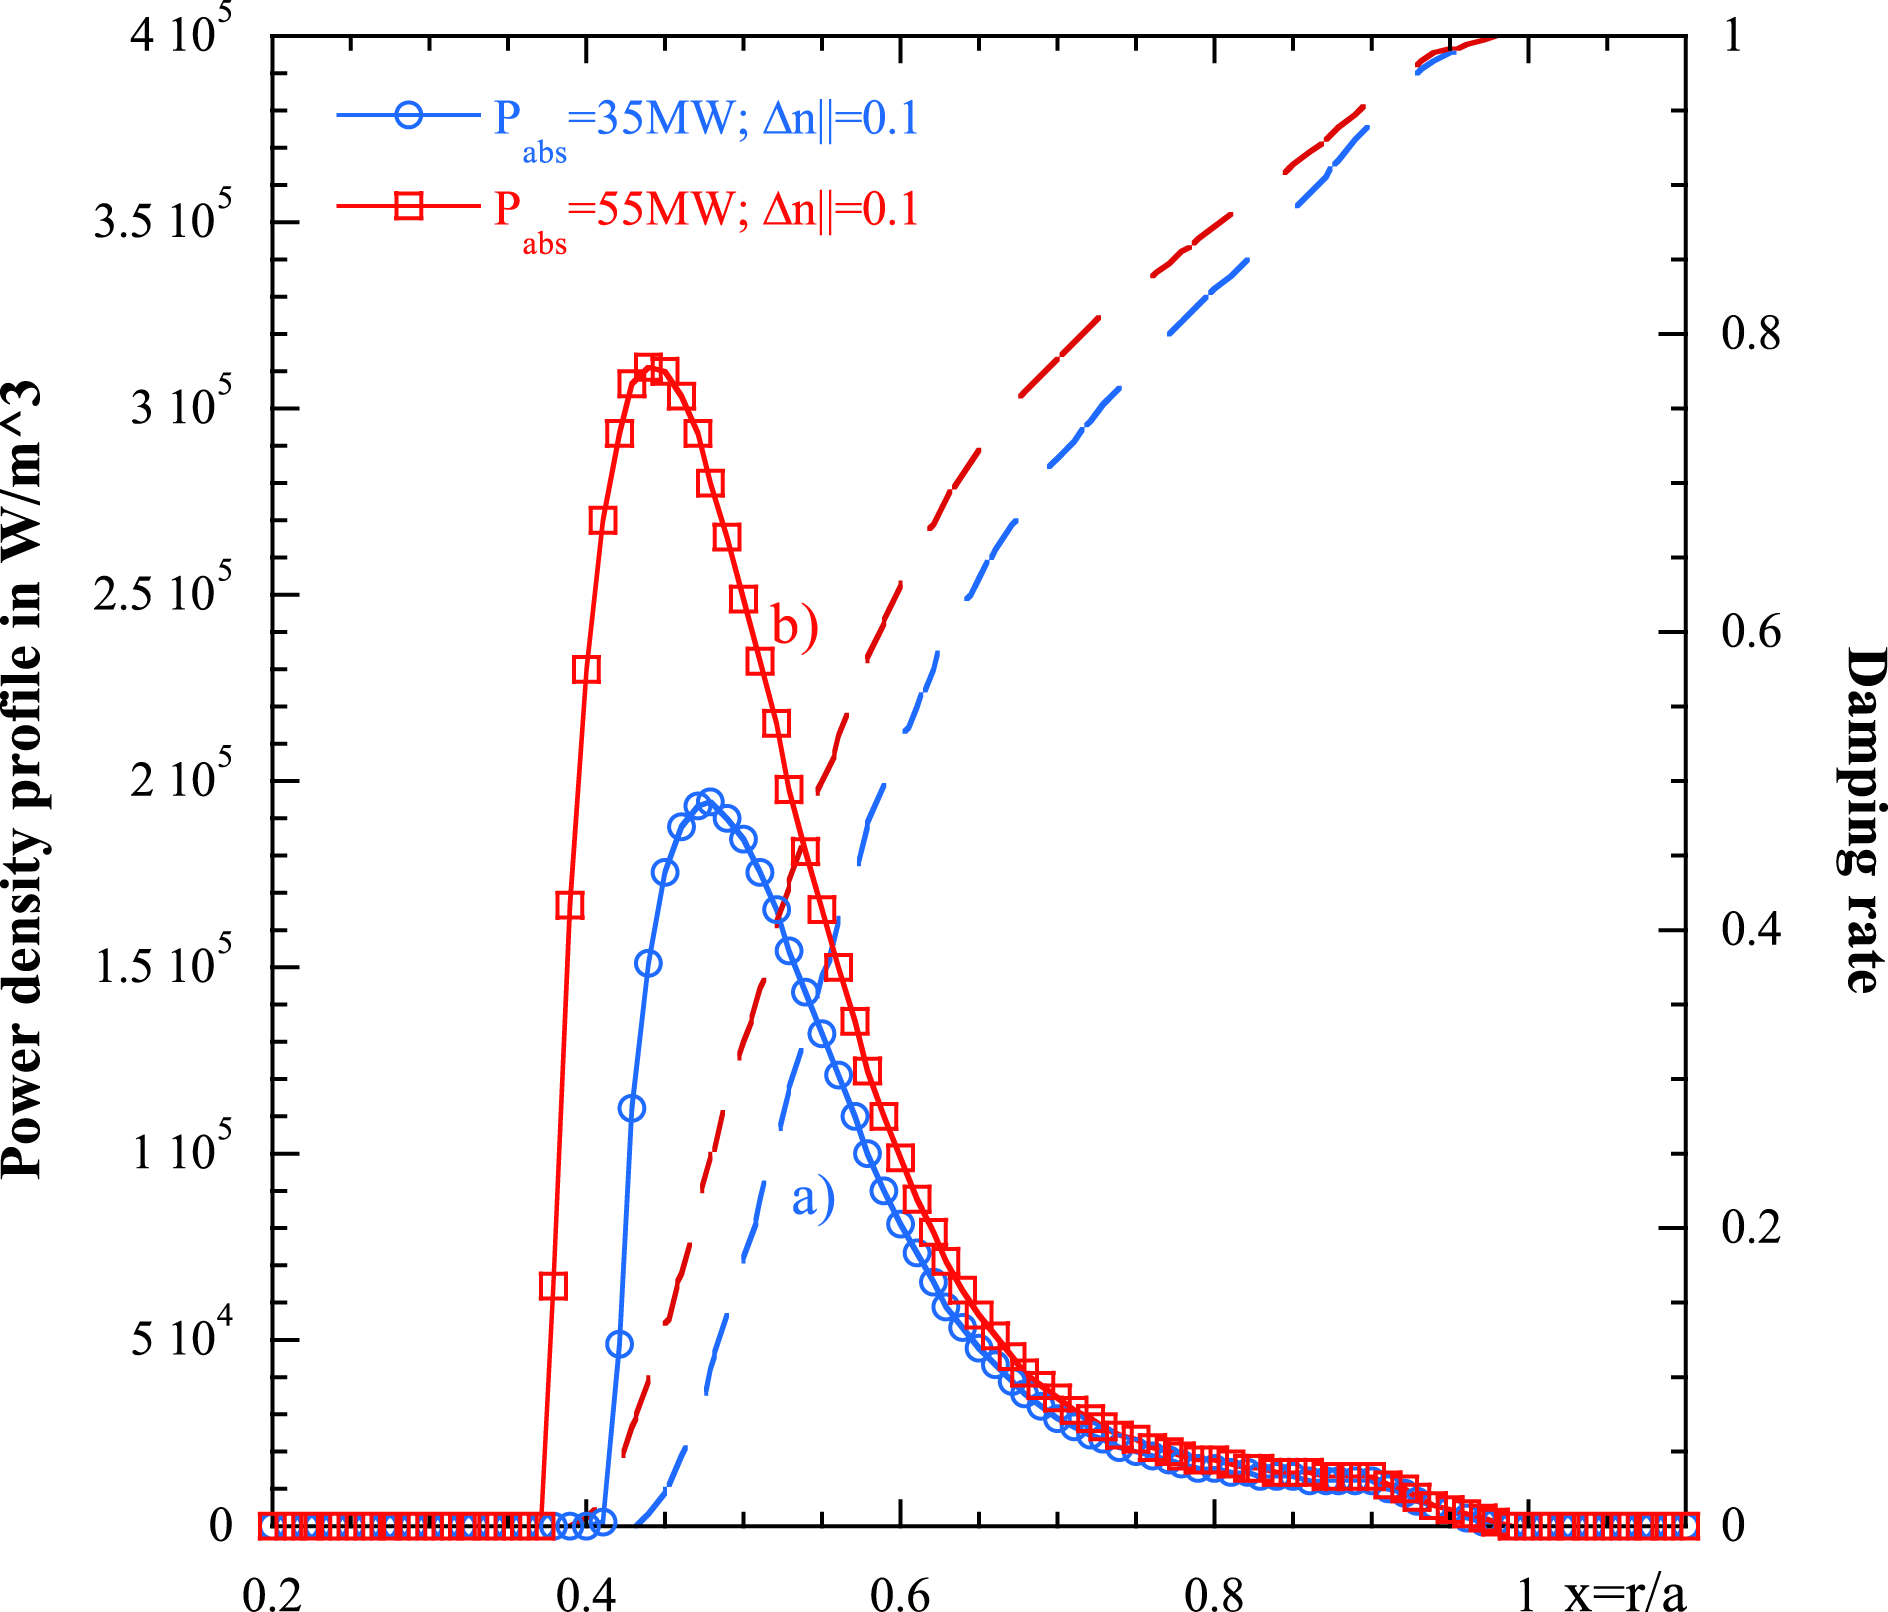
Figure 12. Same plot as figure 11 for a spectrum extension
![]() $\unicode[STIX]{x1D70E}=0.1$
, and two different coupled (absorbed) powers (a)
$\unicode[STIX]{x1D70E}=0.1$
, and two different coupled (absorbed) powers (a)
![]() $P=55~\text{MW}$
, (b)
$P=55~\text{MW}$
, (b)
![]() $P=35~\text{MW}$
.
$P=35~\text{MW}$
.
In figure 13(a,b) the power deposition profiles (a), and the power and current driven (b) when electrons alone and electrons
![]() $+$
$+$
![]() $\unicode[STIX]{x1D6FC}$
particles (fraction 2 %) are acting on the wave, and when a ‘narrow’
$\unicode[STIX]{x1D6FC}$
particles (fraction 2 %) are acting on the wave, and when a ‘narrow’
![]() $(\unicode[STIX]{x1D70E}=0.1)$
power spectrum is coupled to the plasma, are shown. As it is possible to see for this specific DEMO scenario, the large fraction of
$(\unicode[STIX]{x1D70E}=0.1)$
power spectrum is coupled to the plasma, are shown. As it is possible to see for this specific DEMO scenario, the large fraction of
![]() $\unicode[STIX]{x1D6FC}$
particles can disturb the penetration of the wave up to internal layers (peak around
$\unicode[STIX]{x1D6FC}$
particles can disturb the penetration of the wave up to internal layers (peak around
![]() $r/a\sim 0.5$
) (as in the case of only electrons) moving the peak of the deposition to around
$r/a\sim 0.5$
) (as in the case of only electrons) moving the peak of the deposition to around
![]() $r/a\sim 0.9$
. Then same plot depicts also the power which is going on the
$r/a\sim 0.9$
. Then same plot depicts also the power which is going on the
![]() $\unicode[STIX]{x1D6FC}$
particles not useful for current drive (CD). In figure 13(b) the power and current drive are plotted versus
$\unicode[STIX]{x1D6FC}$
particles not useful for current drive (CD). In figure 13(b) the power and current drive are plotted versus
![]() $x=r/a$
for the same condition as figure 13(a). It is possible to see that the presence of
$x=r/a$
for the same condition as figure 13(a). It is possible to see that the presence of
![]() $\unicode[STIX]{x1D6FC}$
particles produces a reduction of the power available for the CD with consequent reduction of the lower hybrid current drive (LHCD) efficiency of approximately 40 %. In the set of figures 14(a,b) and 15(a,b) the same calculation as done for figure 13(a,b) has been repeated but respectively for
$\unicode[STIX]{x1D6FC}$
particles produces a reduction of the power available for the CD with consequent reduction of the lower hybrid current drive (LHCD) efficiency of approximately 40 %. In the set of figures 14(a,b) and 15(a,b) the same calculation as done for figure 13(a,b) has been repeated but respectively for
![]() $\unicode[STIX]{x1D6FC}$
-particles with a concentration of 1 % (figure 14) and 0.5 % (figure 15). For these concentrations the presence of
$\unicode[STIX]{x1D6FC}$
-particles with a concentration of 1 % (figure 14) and 0.5 % (figure 15). For these concentrations the presence of
![]() $\unicode[STIX]{x1D6FC}$
-particles affects the deposition profile of the LH on the electrons and consequently the current drive is much weaker than before. In the case of 1 % of
$\unicode[STIX]{x1D6FC}$
-particles affects the deposition profile of the LH on the electrons and consequently the current drive is much weaker than before. In the case of 1 % of
![]() $\unicode[STIX]{x1D6FC}$
-particles the deposition of the wave is broader and spans a radius of between 0.6–0.9, the efficiency is reduced by almost 20 %. In the more realistic case of 0.05 %
$\unicode[STIX]{x1D6FC}$
-particles the deposition of the wave is broader and spans a radius of between 0.6–0.9, the efficiency is reduced by almost 20 %. In the more realistic case of 0.05 %
![]() $\unicode[STIX]{x1D6FC}$
-particle concentration (figure 15) it is possible to see that the phenomenon is largely reduced. The CD efficiency reduction is around 5 %. It is worth noting that we are assuming that the slowing down of the
$\unicode[STIX]{x1D6FC}$
-particle concentration (figure 15) it is possible to see that the phenomenon is largely reduced. The CD efficiency reduction is around 5 %. It is worth noting that we are assuming that the slowing down of the
![]() $\unicode[STIX]{x1D6FC}$
-particle distribution extends to high energy also in the external layers. These highly energetic particles, in principle, could be lost and do not contribute to the wave damping, for this reason our evaluation may be an overestimate.
$\unicode[STIX]{x1D6FC}$
-particle distribution extends to high energy also in the external layers. These highly energetic particles, in principle, could be lost and do not contribute to the wave damping, for this reason our evaluation may be an overestimate.
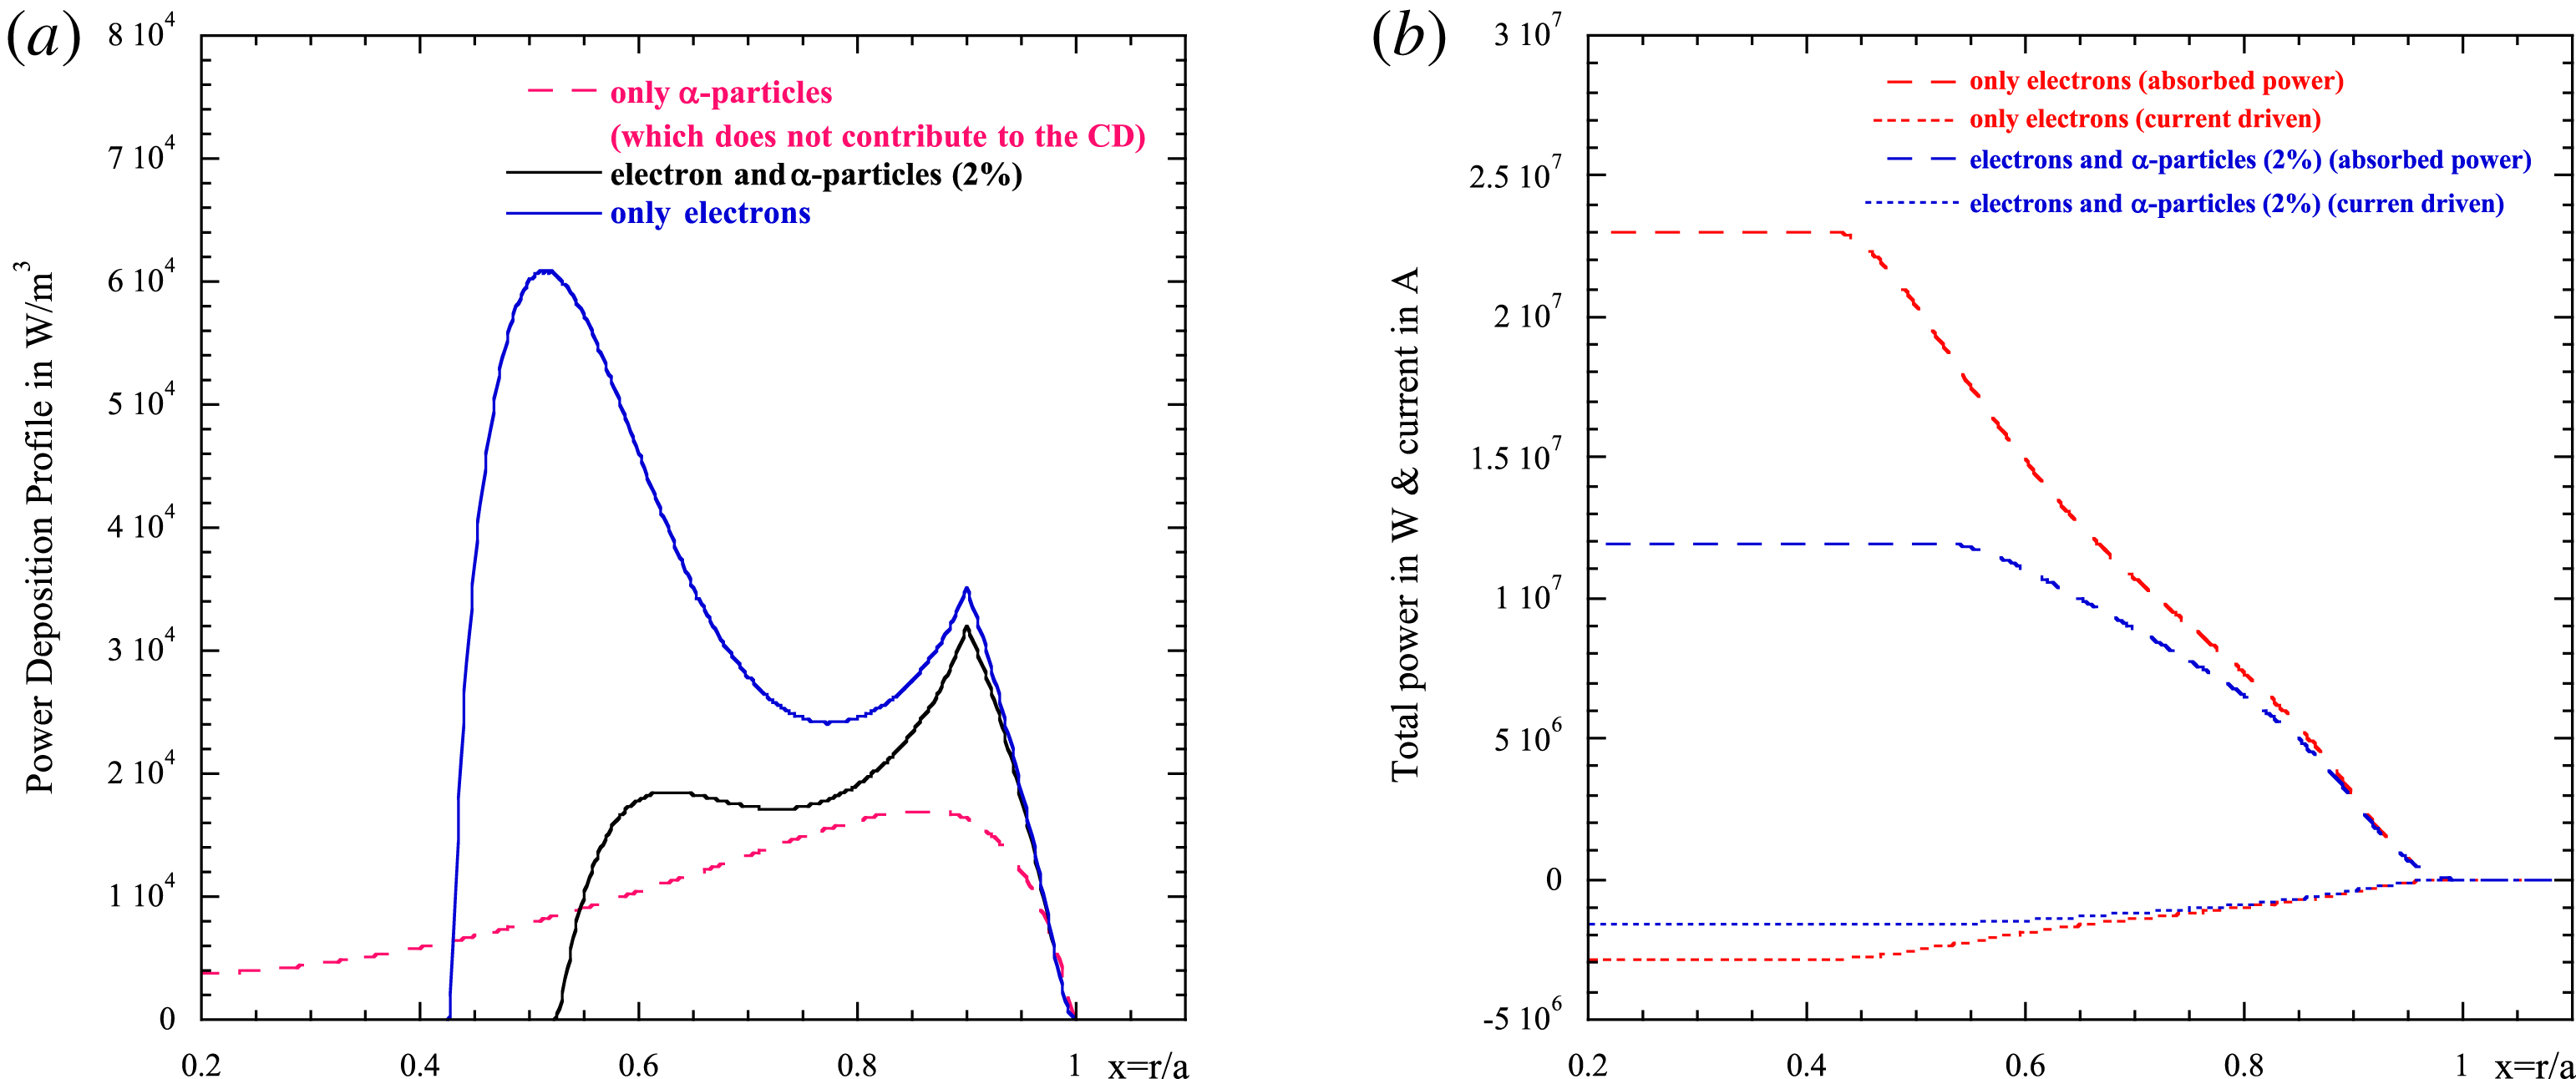
Figure 13. (a) Power density profile versus
![]() $x=r/a$
when coupling 25 MW of the LH power: (i) in absence of
$x=r/a$
when coupling 25 MW of the LH power: (i) in absence of
![]() $\unicode[STIX]{x1D6FC}$
-particles, only electrons (blue continuous curve), (ii) when
$\unicode[STIX]{x1D6FC}$
-particles, only electrons (blue continuous curve), (ii) when
![]() $\unicode[STIX]{x1D6FC}$
-particles (fraction 2 %) and electrons are acting on the wave (black continuous curve) and (iii) as compared to the absorption profile of
$\unicode[STIX]{x1D6FC}$
-particles (fraction 2 %) and electrons are acting on the wave (black continuous curve) and (iii) as compared to the absorption profile of
![]() $\unicode[STIX]{x1D6FC}$
-particles (2 %) (red dashed curve). (b) Absorbed power (in Watt) and current driven (in Ampere) for the same case as figure 13(a).
$\unicode[STIX]{x1D6FC}$
-particles (2 %) (red dashed curve). (b) Absorbed power (in Watt) and current driven (in Ampere) for the same case as figure 13(a).
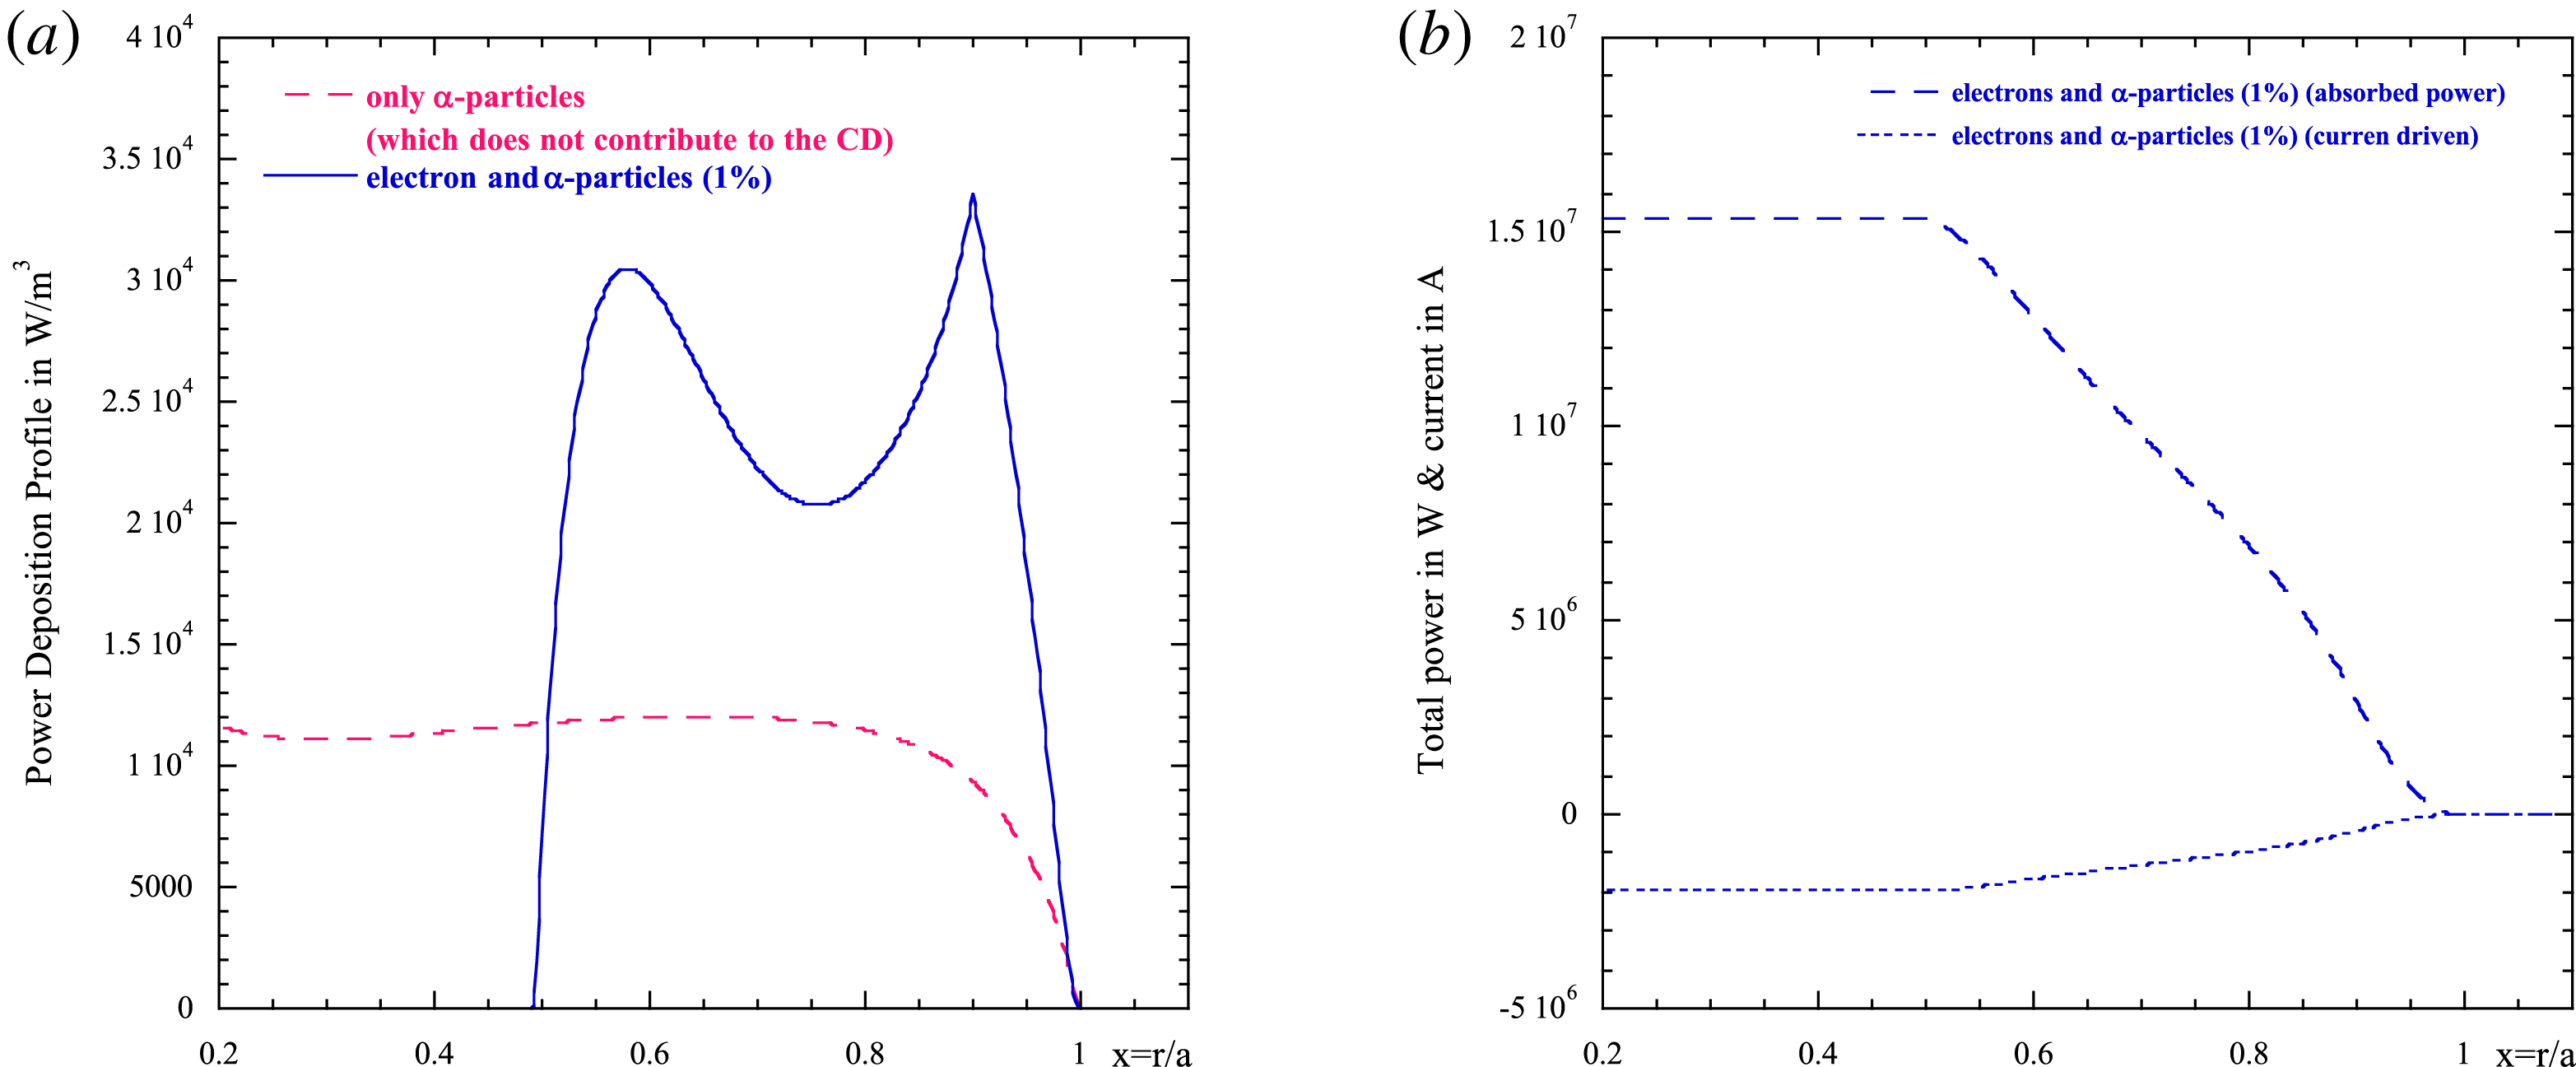
Figure 14. (a) Power density profile versus
![]() $x=r/a$
when coupling 25 MW of the LH power when
$x=r/a$
when coupling 25 MW of the LH power when
![]() $\unicode[STIX]{x1D6FC}$
-particles (fraction 1 %) and electrons are acting on the wave (blue continuous curve) as compared to the absorption profile of
$\unicode[STIX]{x1D6FC}$
-particles (fraction 1 %) and electrons are acting on the wave (blue continuous curve) as compared to the absorption profile of
![]() $\unicode[STIX]{x1D6FC}$
-particles (1 %) (red dashed curve). (b) Absorbed power (in Watt) and current driven (in Ampere) for the same case as (a).
$\unicode[STIX]{x1D6FC}$
-particles (1 %) (red dashed curve). (b) Absorbed power (in Watt) and current driven (in Ampere) for the same case as (a).
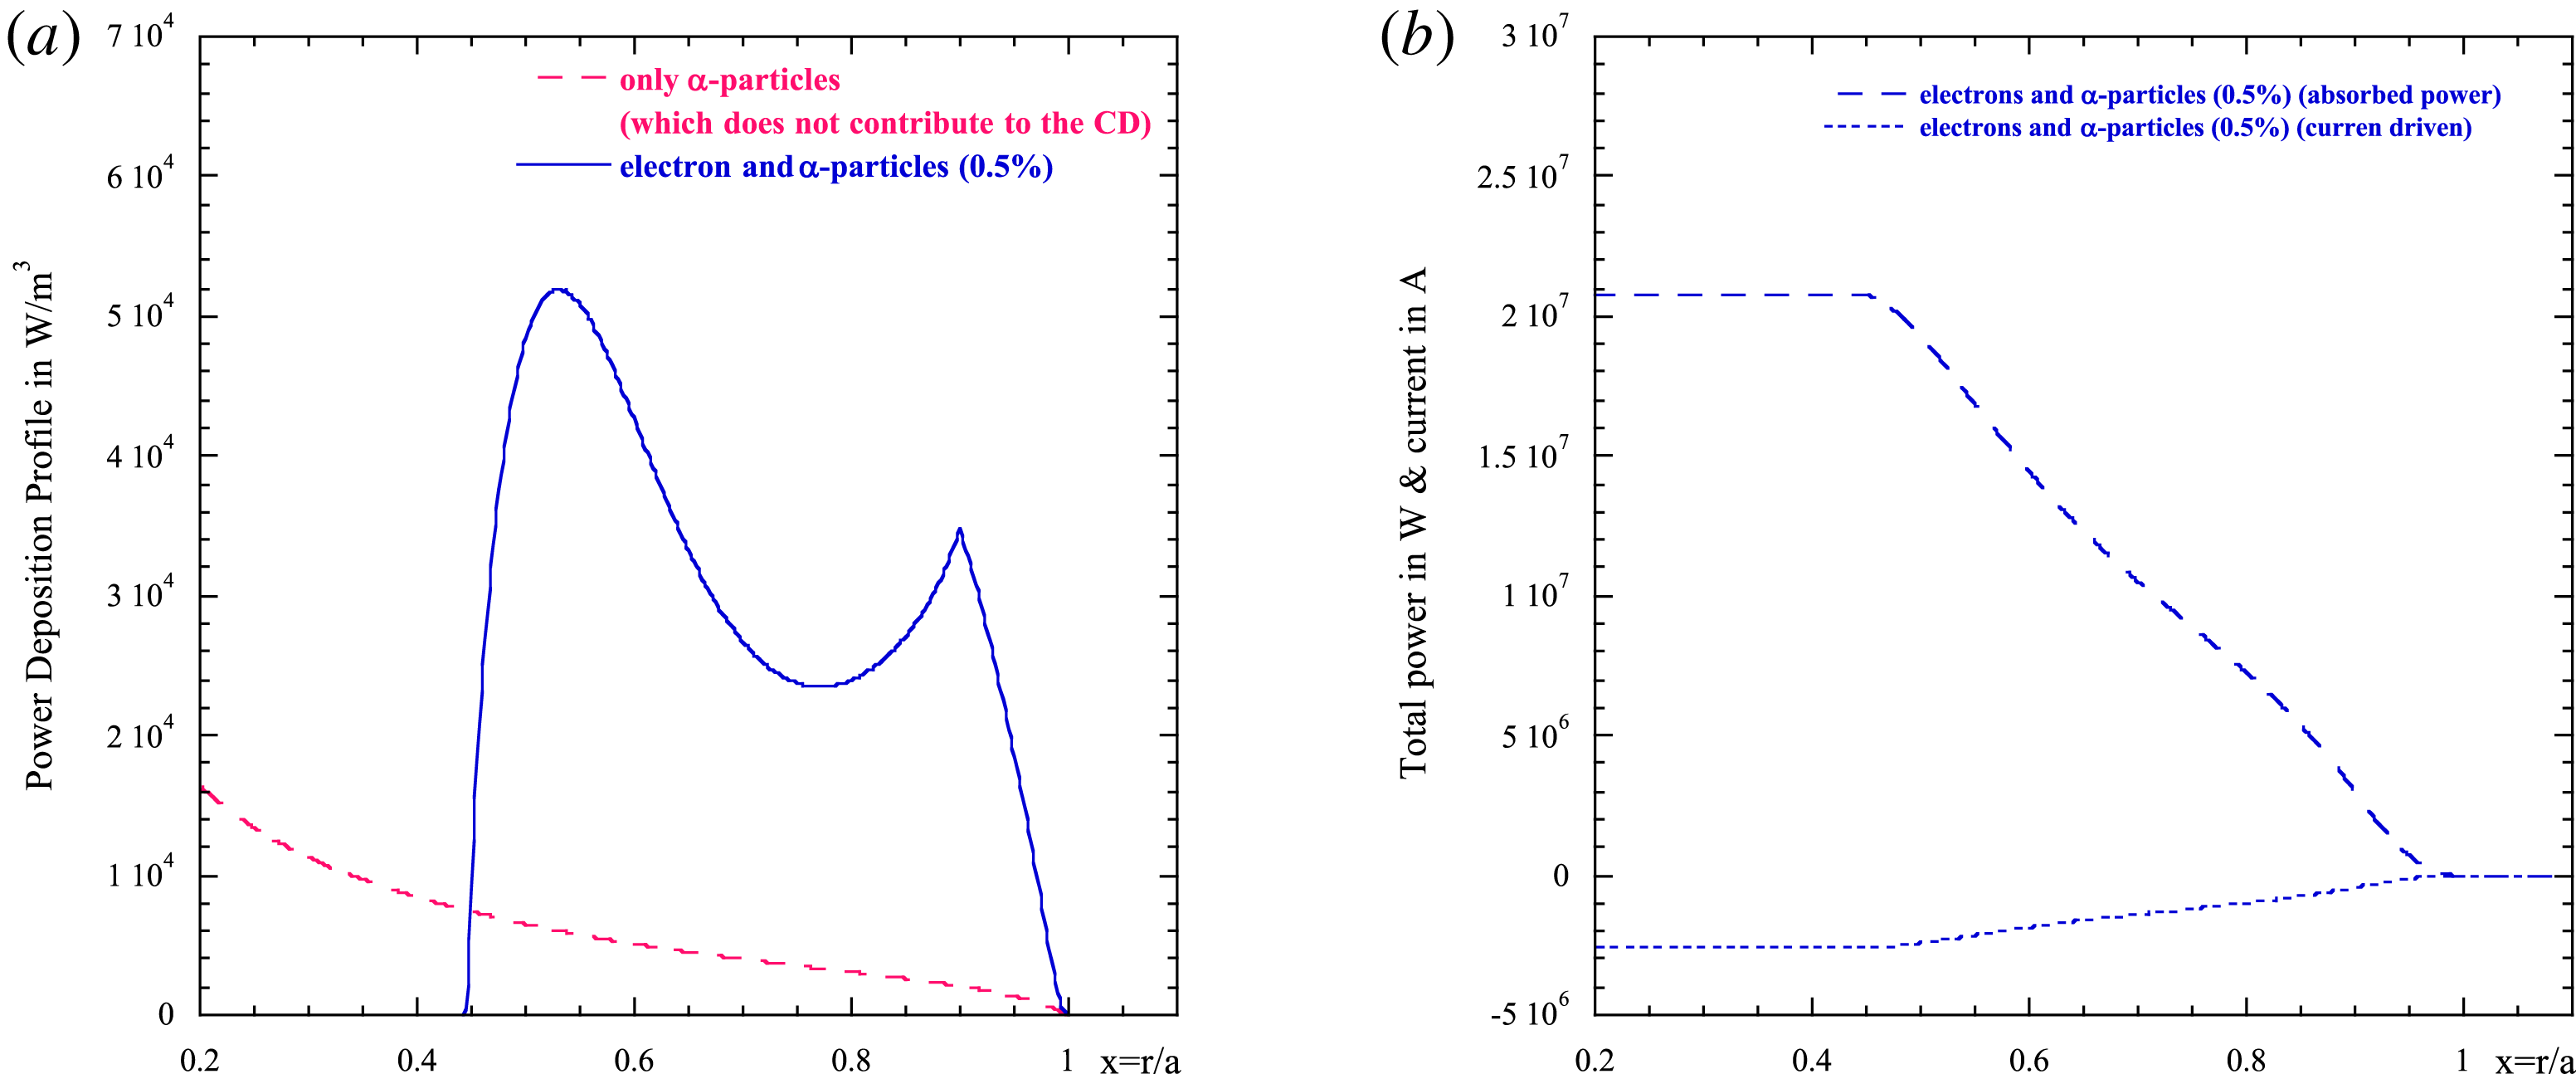
Figure 15. (a) Power density profile versus
![]() $x=r/a$
when coupling 25 MW of the LH power when
$x=r/a$
when coupling 25 MW of the LH power when
![]() $\unicode[STIX]{x1D6FC}$
-particles (fraction 0.5 %) and electrons are acting on the wave (blue curve) as compared to the absorption profile of
$\unicode[STIX]{x1D6FC}$
-particles (fraction 0.5 %) and electrons are acting on the wave (blue curve) as compared to the absorption profile of
![]() $\unicode[STIX]{x1D6FC}$
-particles (0.5 %) (red dashed curve). (b) Absorbed power (in Watt) and current driven (in Ampere) for the same case as (a).
$\unicode[STIX]{x1D6FC}$
-particles (0.5 %) (red dashed curve). (b) Absorbed power (in Watt) and current driven (in Ampere) for the same case as (a).
In figure 16 the same plot is presented when the power spectrum is broader
![]() $(\unicode[STIX]{x1D70E}=0.5)$
for two
$(\unicode[STIX]{x1D70E}=0.5)$
for two
![]() $\unicode[STIX]{x1D6FC}$
-particle concentrations (a) 0.05 %, and (b) 0.2 % as compared to the electrons alone (22 MW of total absorbed power). In this case, owing to the fact that the broader spectrum is depositing power in a more external layer (near the separatrix
$\unicode[STIX]{x1D6FC}$
-particle concentrations (a) 0.05 %, and (b) 0.2 % as compared to the electrons alone (22 MW of total absorbed power). In this case, owing to the fact that the broader spectrum is depositing power in a more external layer (near the separatrix
![]() $x\sim 0.97$
), the presence of
$x\sim 0.97$
), the presence of
![]() $\unicode[STIX]{x1D6FC}$
-particles does not affect so much the deposition of the wave. In fact, the deposition layer of
$\unicode[STIX]{x1D6FC}$
-particles does not affect so much the deposition of the wave. In fact, the deposition layer of
![]() $\unicode[STIX]{x1D6FC}$
-particles for
$\unicode[STIX]{x1D6FC}$
-particles for
![]() $\unicode[STIX]{x1D6FC}$
-concentrations of 2 % and 0.5 % maximizes at a radius
$\unicode[STIX]{x1D6FC}$
-concentrations of 2 % and 0.5 % maximizes at a radius
![]() $x<0.9$
, as can be seen in the previous figures (figure 13
a, and figure 15
a). In this case the deposition layer remains unaffected by the
$x<0.9$
, as can be seen in the previous figures (figure 13
a, and figure 15
a). In this case the deposition layer remains unaffected by the
![]() $\unicode[STIX]{x1D6FC}$
-damping and the reduction of the efficiency is very low
$\unicode[STIX]{x1D6FC}$
-damping and the reduction of the efficiency is very low
![]() ${\leqslant}1\,\%$
. In figure 17 the total absorbed power and generated current are plotted versus
${\leqslant}1\,\%$
. In figure 17 the total absorbed power and generated current are plotted versus
![]() $x$
for the same concentrations of
$x$
for the same concentrations of
![]() $\unicode[STIX]{x1D6FC}$
-particles as figure 16.
$\unicode[STIX]{x1D6FC}$
-particles as figure 16.
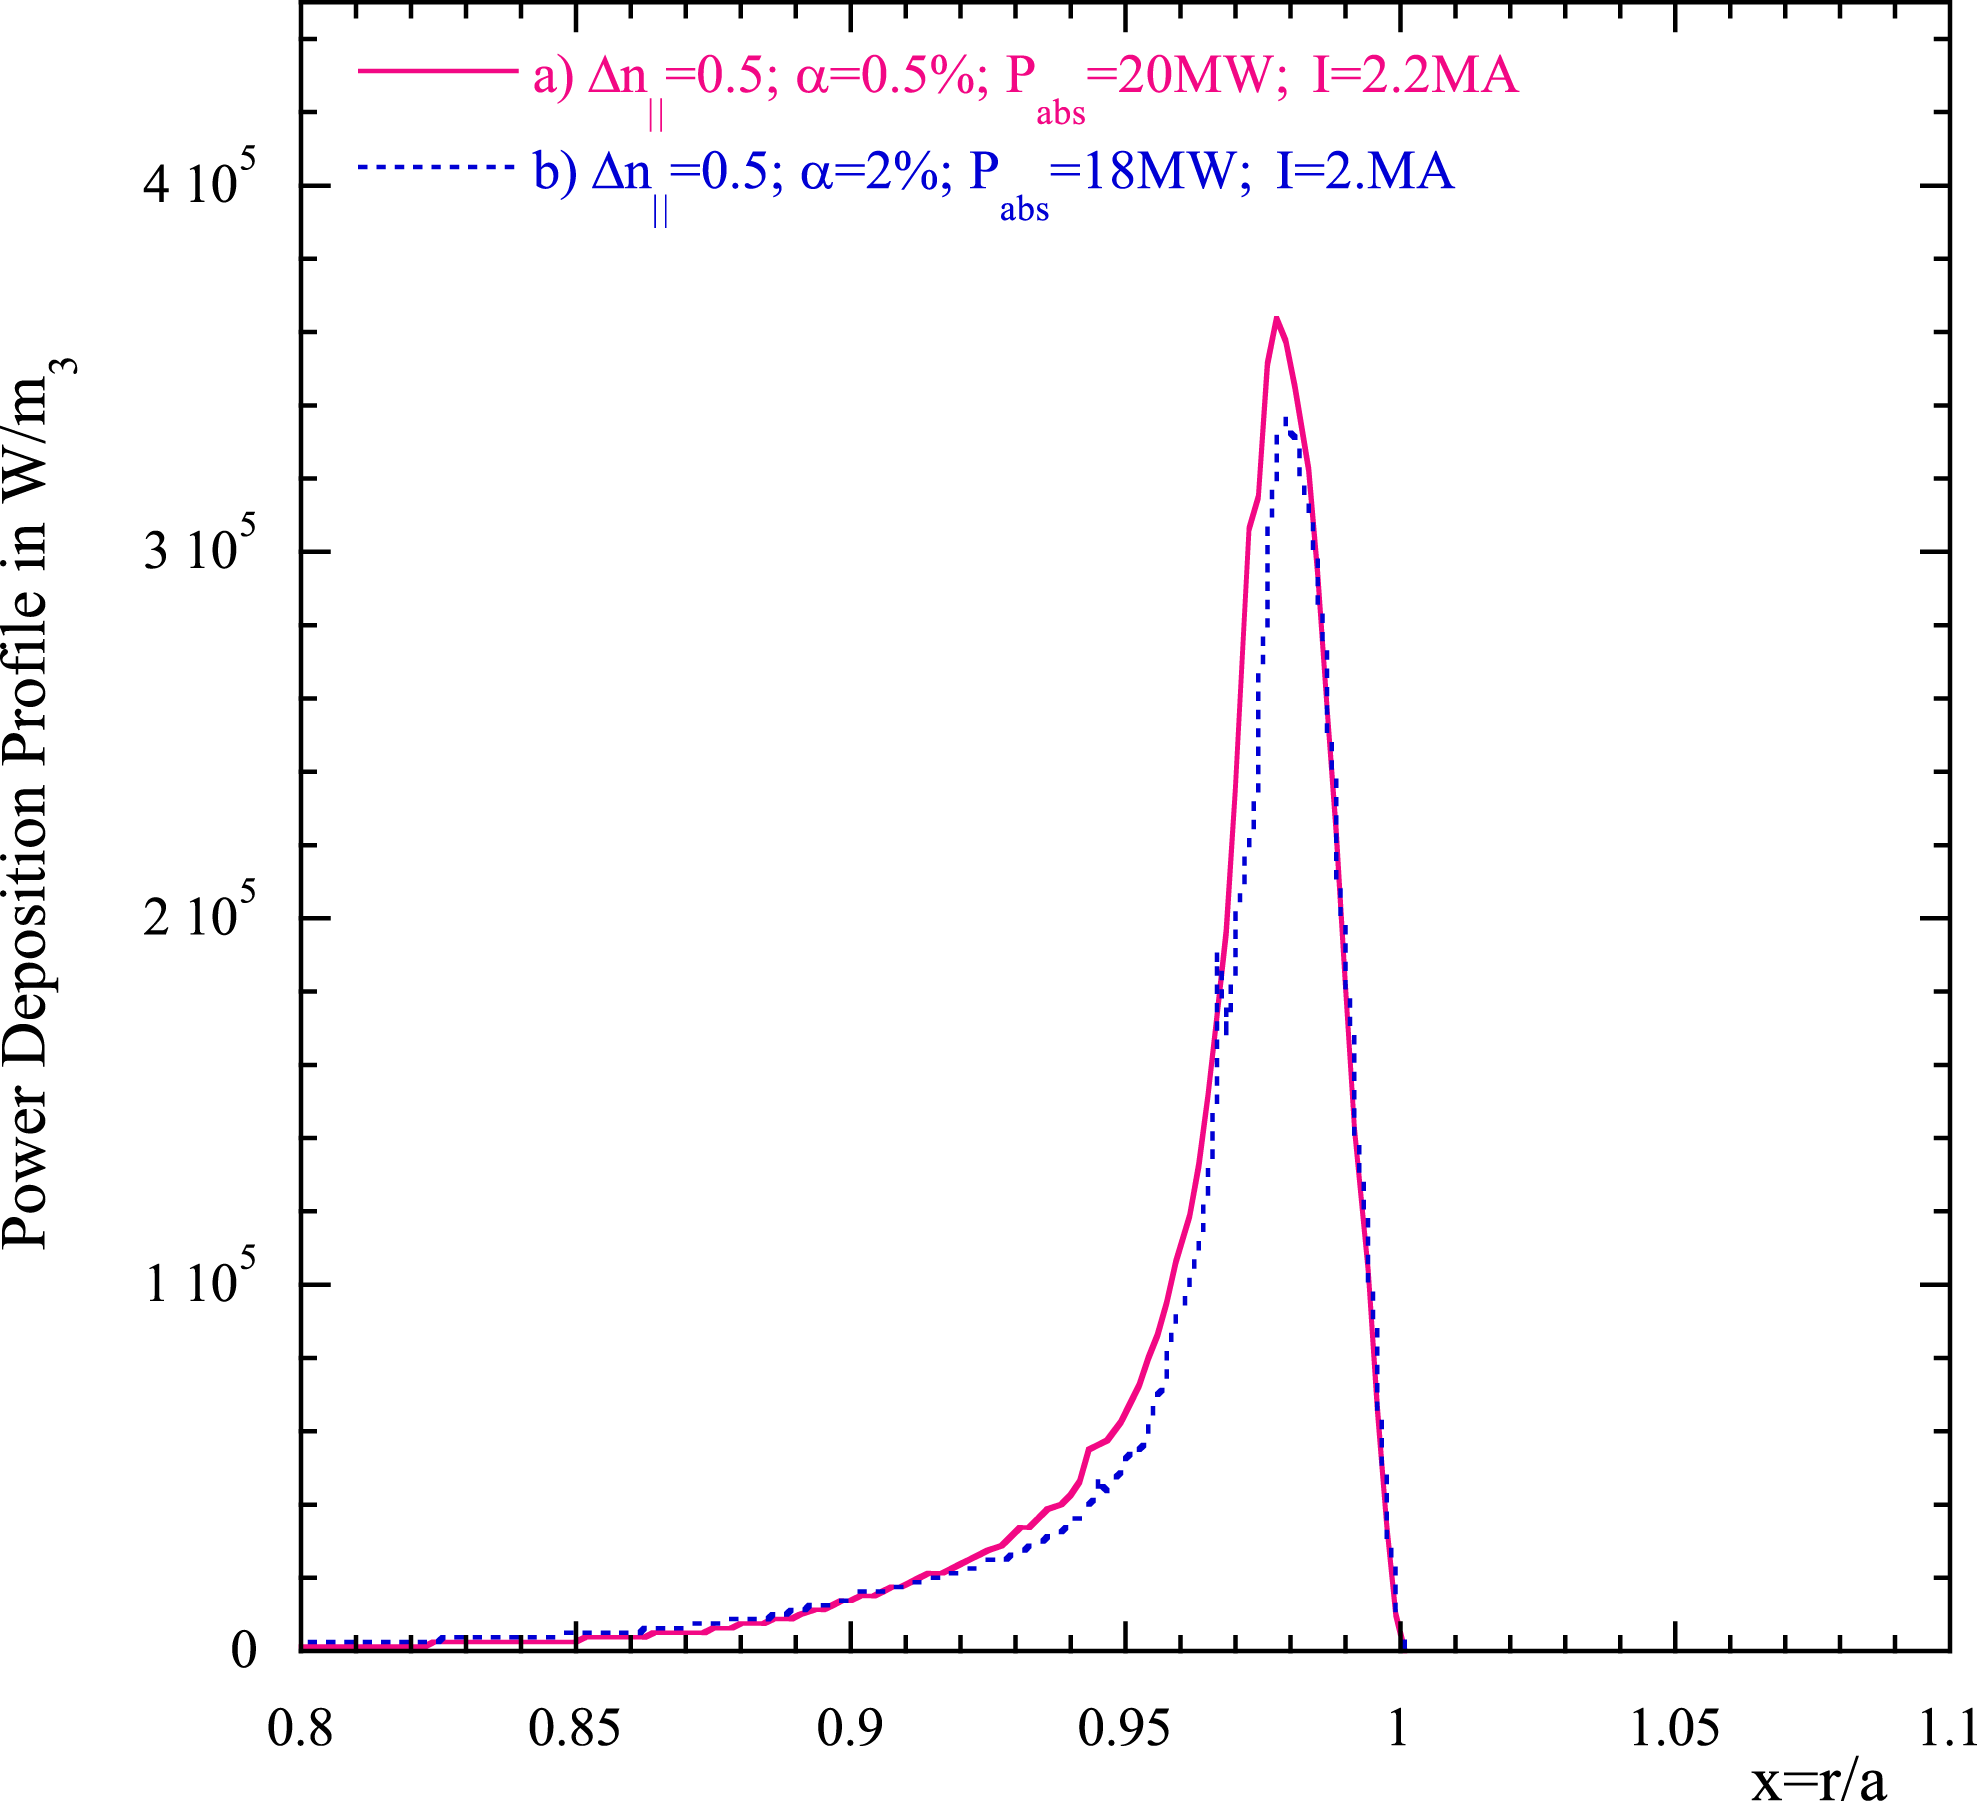
Figure 16. Power density profile versus
![]() $x=r/a$
when coupling 22 MW of the LH power: (i) when
$x=r/a$
when coupling 22 MW of the LH power: (i) when
![]() $\unicode[STIX]{x1D6FC}$
-particles and electrons are acting on the wave with two different concentrations (a) 0.5 % (red continuous curve), (b) 2 % (blue dotted curve).
$\unicode[STIX]{x1D6FC}$
-particles and electrons are acting on the wave with two different concentrations (a) 0.5 % (red continuous curve), (b) 2 % (blue dotted curve).
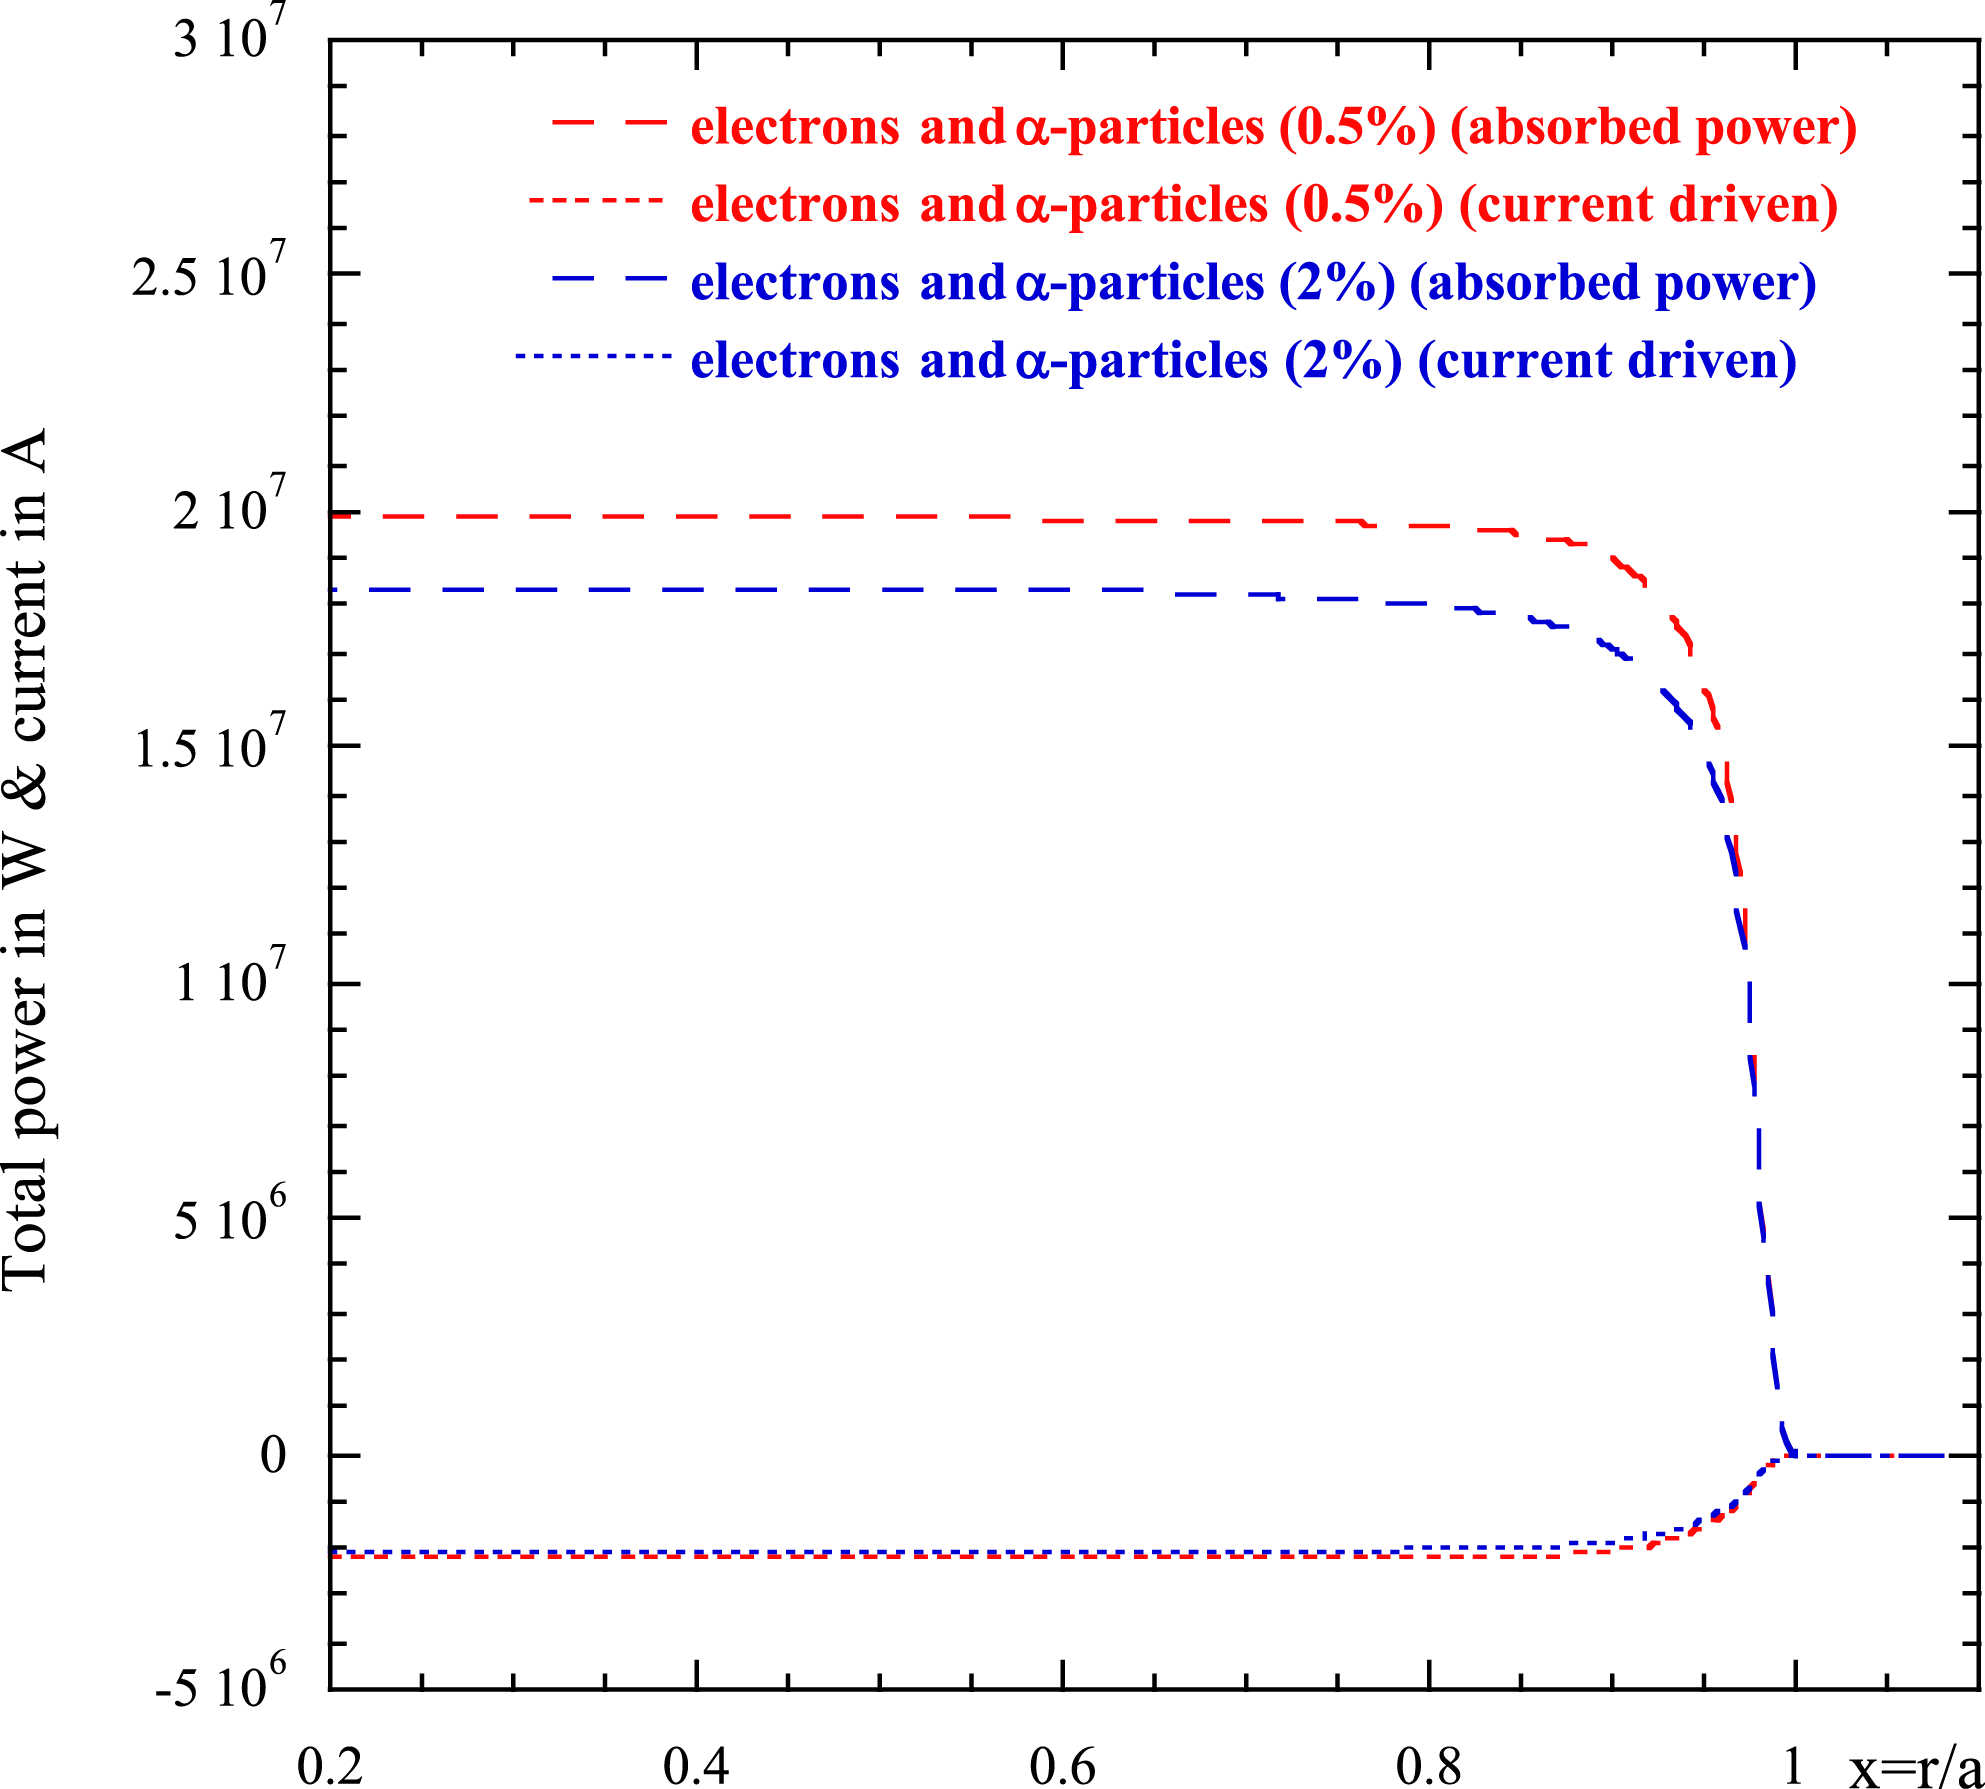
Figure 17. Absorbed power (in Watt) and current driven (in Ampere) for the same case as figure 16.
The main purpose of this investigation was to establish how the LH wave in a reactor plasma loses energy on the ion species composing the plasma and above all in the presence of a relevant
![]() $\unicode[STIX]{x1D6FC}$
-particle population. The main goal of the LH is to release power on the electron population and drive current in a layer that in a reactor is located in the outer half-radius, without being disturbed by the presence of spurious absorption by the ion population. This task (as shown in previous work Cardinali et al. (Reference Cardinali, Castaldo, Cesario, Santini, Amicucci, Ceccuzzi, Galli, Mirizzi, Napoli and Panaccione2017)) is accomplished by tuning the power spectrum width radiated by the antenna. In the figures above it is shown that when the current drive is localized around the pedestal, the
$\unicode[STIX]{x1D6FC}$
-particle population. The main goal of the LH is to release power on the electron population and drive current in a layer that in a reactor is located in the outer half-radius, without being disturbed by the presence of spurious absorption by the ion population. This task (as shown in previous work Cardinali et al. (Reference Cardinali, Castaldo, Cesario, Santini, Amicucci, Ceccuzzi, Galli, Mirizzi, Napoli and Panaccione2017)) is accomplished by tuning the power spectrum width radiated by the antenna. In the figures above it is shown that when the current drive is localized around the pedestal, the
![]() $\unicode[STIX]{x1D6FC}$
-particles absorb a minimum of power from the wave thus leaving the efficiency of the CD almost unaffected. In the case of more central penetration (narrow spectrum) a higher fraction of the LH power is diverted to the
$\unicode[STIX]{x1D6FC}$
-particles absorb a minimum of power from the wave thus leaving the efficiency of the CD almost unaffected. In the case of more central penetration (narrow spectrum) a higher fraction of the LH power is diverted to the
![]() $\unicode[STIX]{x1D6FC}$
-particles, depending on the fraction of
$\unicode[STIX]{x1D6FC}$
-particles, depending on the fraction of
![]() $\unicode[STIX]{x1D6FC}$
-particles in layers more internal than the pedestal layer. For an
$\unicode[STIX]{x1D6FC}$
-particles in layers more internal than the pedestal layer. For an
![]() $\unicode[STIX]{x1D6FC}$
-particle fraction
$\unicode[STIX]{x1D6FC}$
-particle fraction
![]() ${\geqslant}2\,\%$
the loss of efficiency of the CD can be relevant,
${\geqslant}2\,\%$
the loss of efficiency of the CD can be relevant,
![]() ${>}40\,\%$
, however, when the fraction of
${>}40\,\%$
, however, when the fraction of
![]() $\unicode[STIX]{x1D6FC}$
-particles is between 0.5 and 1 % (which would be the most realistic evaluation) the power diverted to
$\unicode[STIX]{x1D6FC}$
-particles is between 0.5 and 1 % (which would be the most realistic evaluation) the power diverted to
![]() $\unicode[STIX]{x1D6FC}$
-particles does not affect strongly the efficiency of the CD and the deposition of the LHW power. As stated before, we remark here that we are assuming that the slowing down of the
$\unicode[STIX]{x1D6FC}$
-particles does not affect strongly the efficiency of the CD and the deposition of the LHW power. As stated before, we remark here that we are assuming that the slowing down of the
![]() $\unicode[STIX]{x1D6FC}$
-particle distribution extends to high energy also in the external layers. These highly energetic particles, in principle, could be lost and do not contribute to the wave damping therefore this evaluation can be overestimated. Moreover the thermal ion dynamics does not affect at all the absorption of the wave by electrons and the CD because its dynamics is essentially located near the plasma centre not reached by the LH wave (first pass absorption).
$\unicode[STIX]{x1D6FC}$
-particle distribution extends to high energy also in the external layers. These highly energetic particles, in principle, could be lost and do not contribute to the wave damping therefore this evaluation can be overestimated. Moreover the thermal ion dynamics does not affect at all the absorption of the wave by electrons and the CD because its dynamics is essentially located near the plasma centre not reached by the LH wave (first pass absorption).
5 Conclusions
A semi-analytical study of the quasi-linear power damping of the LHW in a tokamak reactor (in particular we have used the design parameters of the DEMO pulsed regime), has shown that plasma ions and
![]() $\unicode[STIX]{x1D6FC}$
-particles absorb LH power in the zone of the inner half-radius, and do not prevent the wave releasing power to the electron population and producing the current drive effect in the external part of the plasma radius (around the pedestal). When the penetration of the LH wave is made more central (by acting on the width of the power spectrum) a competition (in damping) with the
$\unicode[STIX]{x1D6FC}$
-particles absorb LH power in the zone of the inner half-radius, and do not prevent the wave releasing power to the electron population and producing the current drive effect in the external part of the plasma radius (around the pedestal). When the penetration of the LH wave is made more central (by acting on the width of the power spectrum) a competition (in damping) with the
![]() $\unicode[STIX]{x1D6FC}$
-particles can lead to a slight modification of the power deposition on the electron species but this is not so important as to reduce the LHCD efficiency to a remarkable extent. The quasi-linear ion absorption, although not so relevant, occurs in the central zone of the plasma near the magnetic axis only when the density is sufficiently high that the condition
$\unicode[STIX]{x1D6FC}$
-particles can lead to a slight modification of the power deposition on the electron species but this is not so important as to reduce the LHCD efficiency to a remarkable extent. The quasi-linear ion absorption, although not so relevant, occurs in the central zone of the plasma near the magnetic axis only when the density is sufficiently high that the condition
![]() $\unicode[STIX]{x1D714}/k_{\bot }v_{thi}\leqslant 3$
is satisfied. In conclusion, on the basis of the present analysis, we can confirm that a natural presence of
$\unicode[STIX]{x1D714}/k_{\bot }v_{thi}\leqslant 3$
is satisfied. In conclusion, on the basis of the present analysis, we can confirm that a natural presence of
![]() $\unicode[STIX]{x1D6FC}$
-particles included at
$\unicode[STIX]{x1D6FC}$
-particles included at
![]() $0.5\,\%{-}1\,\%$
everywhere in the plasma does not affect an eventual use of a LH wave system for inducing the current drive and oriented to the control of the plasma profiles in a tokamak reactor like DEMO.
$0.5\,\%{-}1\,\%$
everywhere in the plasma does not affect an eventual use of a LH wave system for inducing the current drive and oriented to the control of the plasma profiles in a tokamak reactor like DEMO.


