


Introduction
Lentil is a major international pulse crop grown during the winter season in many countries where warm winters and hot summers are predominant. It is an important food legume with various uses as food and feed owing to its protein-rich grains and straw (Abbeddou et al. Reference Abbeddou2011). It is cultivated globally as a rain-fed crop on 5.48 m ha with 6.32 metric tonnes (mt) grain production and average productivity of 1.15 t/ha. In India, lentil occupies about 1.42 m ha with a production of 1.13 mt and average productivity of 0.70 t/ha (FAOSTAT 2016). The lower than average productivity is due mainly to the prevalence of moisture deficit, unbalanced fertilization, lack of improved varieties, and biotic and abiotic stresses. Improved varieties have shown yields of up to 5 t/ha in research fields and up to 3 t/ha in farmers’ fields in Ethiopia (Schneider & Anderson Reference Schneider and Anderson2010). In lentil, yield gaps of 30–105% with an average of 42% have been reported from different production zones in India (Ali & Gupta Reference Ali and Gupta2012). A major portion of this yield gap may be filled with improved nutrient management.
Lentil is a high-protein pulse crop that obtains its nitrogen (N) requirements for protein synthesis primarily from biological N2 fixation. Bremer et al. (Reference Bremer, van Kessel and Karamanos1989) and Matus et al. (Reference Matus1997) reported that lentil yield derives about 0.35 of its seed N from soil, <0.10 from applied N fertilizer and up to 0.70 from N2 fixation. Rhizobium symbiosis has significant potential for N2 fixation but depends upon the effectiveness of bacterial strain colonization. Hence, crop yield declines due to low N-fertilizer application: starter doses (basal) are insufficient and cannot fulfil the whole N requirement. In India, application of N as a starter dose (20 kg/ha) along with phosphorus (P, 40 kg/ha) and potassium (K, 20 kg/ha) and inoculation of seed with Rhizobium is a commonly recommended fertilizer regime for lentil. The prescription of N is based on the hypothesis that most of the N requirement is fulfilled by biological N fixation but sometimes this is negligible due to biotic and abiotic stress, leading to a decline in productivity of the crop. Moreover, despite decreased fertility levels and the introduction of new, high-yielding varieties, the recommended doses of mineral fertilizers have not been refined and in practice still remain old and outdated. Hence, lentil yield cannot attain its potential yield due to imbalances in fertilization. Gan et al. (Reference Gan2009) reported that application of higher doses of N fertilizer improved yield and timely maturity of chickpea. Application of 56 kg N/ha apparently increased yield of dry bean (Phaseolus vulgaris) when compared to N received only from N2 fixation (Nleya et al. Reference Nleya, Walley and Vandenberg2001). Nitrogen application could therefore be a more controllable means of increasing the productivity of lentil in India.
Alluvial soil of the Indo-Gangetic plains (IGP) is rich in K due to the presence of illite in its clay lattice. Therefore, in general farmers avoid K application as they perceive that the soils already contain sufficient K for crop requirements. However, in practice, K uptake is consistently more than that applied in most of the crops grown in this soil; therefore, K reserves are being depleted gradually (Sarkar et al. Reference Sarkar2014). Potassium is an essential component for enzyme activation, stomatal dynamics and water regulation but is applied in very low amounts, which affects the bio-chemical properties of plants adversely. Overexhausting organic matter, lower water retention capacity and low fertility status are other concerns in the Gangetic alluvial soils of India that have negative impacts on crop yield and soil quality (Singh et al. Reference Singh, Swarup, Damodar Reddy and Prasad1998). Therefore, crop yield declines due to sub-optimal fertilizer doses applied for legume cultivation.
Nutrient management is considered to be one of the most important factors for narrowing yield gap in lentil. Optimizing N, P and K doses for achieving the highest productivity may be based on soil testing, soil nutrient content in the rhizosphere (Chen et al. Reference Chen2010), combination of organic resources and mineral fertilizer (Chivenge et al. Reference Chivenge, Vanlauwe and Six2011), site-specific nutrient management, and fertilizer recommendation based on soil testing, yield targets and crop responses (He et al. Reference He2009; Singh et al. Reference Singh2015). However, in order to improve nutrient use efficiency and achieve the highest crop yields of lentil, integrated nutrient management practices require urgent attention because unbalanced fertilization has become a common issue in India over recent years, particularly for macronutrients the N, P and K (He et al. Reference He2009; Cui et al. Reference Cui2010). Sub-optimal doses of inorganic fertilizer not only decrease crop yield but also affect nutrient status and soil quality (Singh et al. Reference Singh2015, Reference Singh2017). According to Hussain et al. (Reference Hussain1999), soil quality assessment may be considered as a tool for evaluating sustainability of soil and crop management. Doran & Parkin (Reference Doran, Parkin, Doran, Coleman, Bezdicek and Stewart1994) defined soil quality as the capacity of soil to function within ecosystem boundaries to sustain biological productivity, maintain environmental quality and promote plant and soil health. Soil function capacity is normally reflected by its physical, chemical and biological properties, which have been noted to pertain to soil quality in agricultural land, grassland and forest soils (Schoenholtz et al. Reference Schoenholtz, Van Miegroet and Burger2000). It influences basic soil functions including soil water movement and supply to plants, nutrient cycling and resistibility to organic and inorganic pollutants. Therefore, modification of fertilizer recommendations is essential to meet actual nutrient requirements through balanced fertilization in lentil.
A soil test and targeted yield equation (ST–TYE) approach was developed considering the three components, i.e. nutritional requirement of the crop, and per cent contribution of the available nutrient both in soil and the applied fertilizer (Ramamoorthy & Velayutham Reference Ramamoorthy and Velayutham1971). The ST–TYE approach is based on targeted yield response, agronomic efficiency and soil-test-based site-specific nutrient management principles employed with the ‘four R's method’ (right source, right dose, right time and right place). In the present study, the continual use of fertilizer recommendations have been assessed through ST–TYE: (1) to determine whether the targeted yield of lentil is achieved with application of balanced fertilizers on the basis of initial soil test values and TYEs; (2) to compare the effect of balanced fertilization based on initial soil test values and targeted yields with the conventionally recommended dose of fertilizer and farmers’ practice in respect of grain yield, soil quality and nutrient status of soil; and (3) to examine whether inoculation (Rhizobium + phosphate solubilizing bacteria) or application of farmyard manure (FYM) can reduce the required doses of N, P and K fertilizer without apparent reduction in soil quality and crop yield.
Materials and methods
Site description
A field experiment was carried out over three consecutive crop seasons (last week of November to first week of March) during 2010–2011, 2011–2012 and 2012–2013 at the Central Research Institute for Jute and Allied Fibres, Kolkata, West Bengal, India (88°26′E, 22°45′N, 9 m a.s.l., mean annual precipitation 1550 mm, Table 1). The experimental site is located on New Gangetic alluvial soils (Typic Ustocrept) according to the USDA classification system (Soil Survey Staff 1998), developed by deposition of alluvium carried out through the Ganga river and its tributaries in the IGP. Non-expanding illite minerals are dominant in these soils, followed by kaolinite and chlorite. The experimental site was non-saline and alkaline, moderately deep, well drained and composed of sandy clay loam (Table 2). Mean minimum and maximum air temperature during the crop season were 21.0 and 31.3 °C, respectively. Mean relative humidity in the morning and at noon was 92.7 and 62.2%, respectively.
Table 1. Temperature, humidity and rainfall during the experimental period (2010–2013)

Table 2. Initial soil properties recorded at the start of the study

EC, Electrical conductivity; SOC, soil organic carbon; N, nitrogen; P, phosphorus; K, potassium; CEC, cation exchange capacity; KMnO4, potassium permanganate; NaHCO3, sodium bicarbonate; NH4OAc, ammonium acetate.
Experimental design
A field experiment comprising nine treatments (Table 3) was laid out in a randomized block design (RBD) with three replicates. The treatments were: T1: Control (no mineral fertilizers, FYM or inoculants), T2: FYM at the rate of 5 t/ha, T3: Bio-inoculants (mixture of Rhizobium + Bacillus megaterium), T4: Farmers’ practice (15:30:20 kg N: phosphorus pentoxide (P2O5): potassium oxide (K2O)/ha), T5: Recommended dose of mineral fertilizers (30:40:20 kg N:P2O5:K2O/ha), T6: Balanced application of mineral fertilizers (47:50:107 kg N:P2O5:K2O/ha) based on initial soil test values and targeted yield equations (STV–TYE) for achieving target grain yield of 1.50 t/ha, T7: Integrated approached (43:45:97 kg N:P2O5:K2O/ha) based on initial STV–TYE for achieving target grain yield of 1.50 t/ha + FYM @ 5 t/ha and T8: Integrated approached (43:45:97 kg N:P2O5:K2O/ha) based on initial STV–TYE for achieving target yield of 1.50 t/ha lentil grain + bio-inoculants and T9: Balanced application of mineral fertilizers (73:72:153 kg N:P2O5:K2O/ha) based on initial STV–TYE for achieving target grain yield of 2.0 t/ha. Each treatment was imposed on a fixed plot size (5 × 5 m2) in each year. Well-decomposed FYM @ 5 t/ha was incorporated into respective plots before preparation of the seedbed. It contained 40% moisture, 6.1 g N/kg, 3.0 g P/kg, 7.0 g K/kg, 0.18 g sulphur (S)/kg, 1.9 g iron (Fe)/kg, 0.039 g zinc (Zn)/kg, 0.16 g manganese (Mn)/kg and 0.0037 g copper (Cu)/kg on dry weight basis and had a C/N ratio of 39.1. Each plot was tilled separately with a power tiller to a depth of 20 cm, followed by levelling and planking with wooden planks. Indigenous symbiotic, free-living N-fixing bacterium Rhizobium leguminosarum and phosphate-solubilizing bacterial (PSB) strain B. megaterium var. phosphaticum were procured from the Survey, Selection and Mass Production Unit, Bidhan Chandra Krishi Vishva Vidyalaya, District, Nadia, West Bengal (India). These strains were selected for their effective N fixation, phosphate-solubilizing ability, growth-promoting capacity, their potential to suppress root pathogens and their capacity to interact positively with each other. In each year of the experiment, lentil seeds were inoculated with R. leguminosarum and B. megaterium var. phosphaticum at the rate of 500 g culture/ha seed before sowing: 106–107 colony forming units (cfu) per seed were applied via seed encapsulation. Seeds were air-dried for 30 min after inoculation and then sown. Apart from seed inoculation, charcoal-based bio-inoculant culture was also broadcast at the rate of 2.0 kg/ha before preparation of the seedbed, to ensure microbial inoculation. Lentil (var. B 256) was sown at the rate of 35 kg/ha in the rabi season (last week of November to the first week of March) in each year at a planting distance of 25 × 5 cm2. A TYE (FN = 4.94 T–0.09 SN–0.07 ON, FP2O5 = 4.43 T–0.24 SP–0.16 OP and FK2O = 9.03 T–0.24 SN–0.17 OK) was developed for lentil during 2008–2009 for alluvial soil of the IGP of India (i.e. the experimental site) considering three basic components, i.e. nutrient requirement to achieve grain yield of 100 kg and utilization efficiencies of nutrients available both in soil and those applied through inorganic fertilizers and organic sources (Ramamoorthy & Velayutham Reference Ramamoorthy and Velayutham1971). Based on initial soil test values and achievable fixed target yield of lentil, requirements of mineral fertilizer for treatments T6, T7, T8 and T9 were calculated using the target yield equations. A full dose of N, P and K fertilizers were applied as a basal dressing of urea, DAP (diammonium phosphate) and MOP (muriate of potash), respectively, at sowing.
Table 3. Fertilizer doses as per recommended dose of fertilizers (RDF) and soil test values (STV) and targeted yield equations (TYE) of lentil

Initial soil test values: available nitrogen (Na) = 292.2 kg N/ha, available phosphorus (Pa) = 68.8 kg P/ha, available potassium (Ka) = 118.2 kg K/ha.
Targeted yield equation for grain yield of lentil (var. B 256):
FN = 4.94 T–0.09 SN–0.07 ON.
FP2O5 = 4.43 T–0.24 SP–0.16 OP.
FK2O = 9.03 T–0.24 SN–0.17 OK.
where FN, FP2O5 and FK2O are mineral fertilizers N, phosphorus pentoxide (P2O5) and potassium oxide (K2O) (kg/ha); SN, SP and SK are initial soil test values estimated before sowing of crop; ON, OP and OK are the N, P and K in their elemental form (kg/ha) mineralized from farmyard manure (FYM). To make symmetry, P2O5 and K2O were converted into P and K by applying factor 2.29 and 1.20, respectively. T-targeted grain yield of lentil (t/ha). N, P2O5 and K2O fertilizers were calculated on the basis of above equations for the T5, T6 and T7 treatments.
a FYM contained 0.61% N, 0.30% P and 0.70% K.
Experimental methods
In order to count nodule numbers and record the fresh and dry weight of nodules, ten healthy plants were gently removed randomly from each plot, without disturbing the roots, at early bloom stage (Erskine et al. Reference Erskine, Muehlbaure and Short1990). The freshly removed plants were washed thoroughly with tap water, surface-dried with filter paper to enable the recording of nodule number and fresh weight before drying in a hot air oven to obtain the dry weight, firstly at 70 °C for 48 h followed by 80 °C for 72 h, until a constant weight of nodules was obtained. Data on grain and straw yield were taken at maturity by difference methods. The total dry weights of biological and grain yields were measured separately. Straw yield was obtained by deducting grain yield from biological yield (straw yield = biological yield − grain yield). Three representative surface (0–15 cm) soil samples were collected from each plot using an auger before sowing and at harvest in each year. Composite soil samples were prepared from the three representative soil samples after proper mixing and homogenization and each soil sample was divided into two parts. One half of the fresh moist soil samples were packed in airtight plastic bags and stored at −20 °C for analysis of microbial biomass carbon (MBC), microbial counts and extra-cellular enzymatic activities. The remaining half was air-dried, ground and passed through a 2-mm sieve and used for analysis of physical and chemical properties. Soil pH was measured with a compound electrode using soil-to-water ratio of 1: 2.5. Soil organic carbon was determined according to Walkley & Black (Reference Walkley and Black1934) method. Total N was determined by the Kjeldahl method and available N (Na) by the alkaline permanganate (KMnO4-N) method using an auto N analyser as suggested by Subbiah & Asija (Reference Subbiah and Asija1956). Available phosphorus (Pa) was determined by the Olsen method (Olsen et al. Reference Olsen1954) and available potassium (Ka) was analysed by the 1 N ammonium acetate (NH4OAc) method given by Jackson (Reference Jackson1973). Representative straw and grain samples were collected from each plot at harvest for determination of nutrient content in the straw and grain and were dried in a hot air oven at 70 °C for 5 days. The dried samples were ground in a stainless steel Wiley mill and wet-digested in concentrated sulphuric acid (H2SO4) for determination of N and in di-acid mixture (nitric acid, HNO3 and perchloric acid, HClO4: 4:1) for determination of total P and K. Nitrogen content was determined by the Kjeldahl method, P in plant extracts by the vanado-molybadate yellow colour method using a UV-spectrophotometer and K in plant extracts by flame photometer. The nutrient uptake (kg/ha) in straw and grains was measured by multiplying the dry biomass (kg/ha) of straw and grain with its nutrient content (%). Crude protein (CP; dry matter basis) was calculated by applying N content in lentil grain × 6.25, specific for pulses (AOAC 1999). The apparent nutrient recovery of fertilizer use was calculated by comparing nutrient uptake in above-ground biomass between treatments and the control, expressed in percentage as follows:
 $${\rm ANR}_{{\rm NPK}} = \displaystyle{{{\rm NU}_{\rm T} - {\rm NU}_{\rm C}} \over {F_{\rm N}}} \times 100$$
where ANRNPK is the apparent nutrient recovery of N, P and K (%); NUT and NUc is the nutrient uptake by treated and control plot (kg/ha), respectively and F N is the amount of fertilizer applied (kg/ha).
The serial dilution plate technique was used for enumeration of cultivable microbial counts using selective media for specific groups of micro-organisms. Nutrient agar containing 50 mg/l cyclohexamide (Parkinson et al. Reference Parkinson, Gray and Williams1971), Rose Bengal chloramphenicol agar media containing 100 mg/l chloramphenicol (Martin Reference Martin1950) and Ken knight agar medium were used for the counting of total cultivable bacteria (TCB), fungi (TCF) and actinomycetes (TCA), respectively. Ashby's N-free mannitol agar and Pikovskaya's agar media (Pikovskaya Reference Pikovskaya1948) were used for enumeration of Azotobacter (AZO) and phosphate solubilizing micro-organisms (PSM). The chloroform fumigation-extraction method (Vance et al. Reference Vance, Brookes and Jenkinson1987) was used for measurement of MBC. Soil respiration was determined by incubating moist soils in airtight sealed flasks along with a small flask containing 10 ml 1 N sodium hydroxide (NaOH) for 24 h at 25 °C. Evolved carbon dioxide–carbon (CO2–C) trapped in NaOH was measured by titrating with barium chloride as prescribed by Anderson (Reference Anderson, Page, Miller and Keeney1982). Dehydrogenase activity in soil was determined by the method of Tabatabai (Reference Tabatabai, Page, Miller and Keeney1982), whereas fluorescein diacetate hydrolytic activity (FDHA) was measured by quantifying fluorescein content released with the help of a spectrophotometer at 490 nm (Schnurer & Rosswall Reference Schnurer and Rosswall1982). Urease activity (UA) was determined by measuring NH4+ released during soil incubation with urea for 120 min at 37 °C. Acid phosphatase (ACP) and alkaline phosphatase (ALP) activities were measured based on detection of p-nitrophenol (PNP) released after incubation of soil (37 °C, 60 min) at pH 6.5 with p-nitrophenyl phosphate disodium (Tabatabai & Bremner Reference Tabatabai and Bremner1969).
Soil quality index
The soil quality index (SQI) was calculated by using crop productivity as a management goal. The minimum dataset (MDS) or soil quality indicators include the most significant variables that represent soil functions associated with selected goal. After normalization of MDS indicators, all the indicators and scores were integrated into an overall index of soil quality (Andrews et al. Reference Andrews2002a). Soil properties that had significant treatment differences were used to determine MDS through principal component analysis (PCA) employed as a data reduction technique (Andrews et al. Reference Andrews, Karlen and Mitchell2002b). Principal components having high eigenvalues (>1) and variables that explained at least 5% of variation in the data with high factor loading within 10% were assumed to be the variables that best represented attributes (Wander & Bollero Reference Wander and Bollero1999). Correlation analysis was performed to determine whether some of highest weighted variables were redundant and further reduction could be operated (Andrews et al. Reference Andrews2002a).
A non-linear scoring method was used for transforming each observation in every MDS indicator. Indicators were arranged in order depending on whether a higher value was considered beneficial for, or detrimental to, soil fertility (Andrews et al. Reference Andrews, Karlen and Mitchell2002b). In the present study, all the indicators identified under MDS were considered beneficial and scored as ‘more is better’, as increasing levels of indicators related directly to increases in soil quality. Under the ‘more is better’ approach, each observed value was divided by the highest value in such a way that the highest observed value received a maximum score of 1. The PCA results were employed to weight each observed value of MDS variables after transformation. A certain amount (%) of variation in the total dataset was explained by each PC, and the percentage divided by total percentage of variance explained by all PCs (eigenvectors >1) provided the weighted factor for each variant chosen under a given PC. After that, the weighted MDS variable scores were summed up for each observation using the following equation:
 $${\rm SQI} = \mathop \sum \limits_{i = 1}^n \,W_{\rm i} \,S_{\rm i} $$
where W i denotes the assigned weight of each indicator deduced from PCA, S i is the score for the subscripted variable and n is the number of indicators in the final MDS.
Better soil quality or greater performance of soil functions were expected if a higher index score was recorded. The calculated SQI values showed the contribution (%) of each final key indicator tested for their level of significance at P < 0.05.
Statistical analysis
Statistical analysis of data was carried out using SPSS version 16.0. The homogeneity of error variance was tested using Bartlett's χ 2 test. As error variance was homogeneous, pooled analysis was performed according to Cochran & Cox (Reference Cochran and Cox1957). A two-factor analysis of variance (ANOVA) was carried out to determine the effects of fertilizer treatment, season and their interactions on grain yield (Table 4). The mean data of three crop seasons were used to analyse the treatment variance (ANOVA) by employing RBD at P < 0.05 prior to using experimental error rate and presented with standard errors of means (s.e.m. ± = √MSE/r). The data were normalized before performing PCA to assess the impact of various fertilizer treatments on soil quality (Wold et al. Reference Wold, Esbensen and Geladi1987). Correlations among the variables were assessed by determining Pearson correlation coefficients and probability of P < 0.05 and P < 0.01 levels of significance.
Table 4. ANOVA tables showing interaction effects of year, treatments, replication and their interactions

DF, degrees of freedom; MS, mean squares.
Results
Nodulation and yield of lentil
Application of mineral fertilizers through different approaches significantly (P < 0.05) affected nodule counts as well as fresh and dry weight of nodules over the control (T1). Application of FYM (T2) and bio-inoculants (T3) increased nodulation significantly (P < 0.05) over the control but were comparable with T5 and T9 (Fig. 1). However, the highest nodule counts (37.6 nodules/plant), fresh weight (37.8 mg/plant) and dry weight (22.3 mg/plant) of nodules were measured in T8, closely comparable with T7. Application of balanced fertilizers to achieve a higher grain yield (T9) reduced nodule counts, fresh and dry weight of nodules by 26.6, 18.5 and 18.4%, respectively, over T8.

Fig. 1. (a) Nodule counts, (b) nodule fresh weight and (c) nodule dry weight affected by different fertilizers treatments. T1: Control (no mineral fertilizers, farmyard manure (FYM) or inoculants), T2: FYM @ 5 t/ha, T3: Bio-inoculants, T4: Farmers practice, T5: Recommended dose of mineral fertilizers, T6: Precise application of mineral fertilizers based on initial soil test values and targeted yield equations for achieving target yield of 1.5 t/ha lentil grain, T7: Integrated approached based on initial soil test values and targeted yield equations for achieving target yield of 1.5 t/ha lentil grain + FYM @ 5 t/ha, T8: Integrated approached based on initial soil test values and targeted yield equations for achieving target yield of 1.5 t/ha lentil grain + Bio-inoculants and T9: Precise application of mineral fertilizers based on initial soil test values and targeted yield equations for achieving targeted yield of 2.0 t/ha lentil grain. The error bars within the matrix indicated standard deviations within the treatments.
Grain and straw yield were significantly (P < 0.05) enhanced in the fertilizer treatments compared with the unfertilized control. Application of balanced fertilizers calculated to achieve specific target yields of 1.50 and 2.0 t/ha returned only 90.7% (1.36 t/ha) and 82.5% (1.65 t/ha), respectively, of the target yield (Table 5). However, integration of FYM with balanced fertilizers (T7) achieved the specific target yield of 1.50 t/ha, and that of balanced fertilizers with bio-inoculants (T8) increased yield to 109.3% (1.64 t/ha) of the target. Also, the T8 treatment decreased N, P2O5 and K2O requirement by 30, 27 and 56 kg/ha, respectively, over balanced fertilizers alone (T9) without reduction of grain yield. Application of FYM (T2) and bio-inoculants (T3) resulted in grain yields comparable with T5 and T6. Treatments T8 and T9 recorded significantly (P < 0.05) higher grain and straw yield than the rest of the treatments and were closely comparable with each other. Treatment T9 increased lentil grain yield by 9.09, 17.8, 21.8, 27.3, 22.4, 23.0 and 40.6% over T7, T6, T5, T4, T3, T2 and T1, respectively.
Table 5. Effect of different treatments on growth, nodulation, yield, nutrient uptake and nutrient use efficiency of lentil

T1: Control (no mineral fertilizers, farmyard manure (FYM) or bio-inoculants), T2: FYM @ 5 t/ha, T3: Bio-inoculants (mixture of Rhizobium + Bacillus megaterium), T4: Farmers practice, T5: Recommended dose of mineral fertilizers, T6: Precise application of mineral fertilizers based on initial soil test values and targeted yield equations(STV–TYE) for achieving target yield of 1.5 t/ha lentil grain, T7: Integrated approached based on initial STV–TYE for achieving target yield of 1.5 t/ha lentil grain + FYM @ 5 t/ha, T8: Integrated approached based on initial STV–TYE for achieving target yield of 1.5 t/ha lentil grain + Bio-inoculants and T9: Precise application of mineral fertilizers based on initial STV–TYE for achieving targeted yield of 2.0 t/ha lentil grain. ± represents standard errors of mean (s.e.m.±).
a Crude protein is given on dry matter basis.
Nutrient acquisition, crude protein and nutrient use efficiency
Application of mineral fertilizer significantly increased N, P and K acquisition, CP and nutrient recovery over the control (T1) at P < 0.05 (Table 5). Nutrient uptake (N, P and K) varied significantly (P < 0.05) between the treatments. The highest N (76.6 kg/ha), P (8.60 kg/ha) and K (40.7 kg/ha) uptake was recorded in T8 and lowest in T1 treatment (41.6, 3.74 and 23.1 kg/ha). The T8 treatment improved N, P and K uptake by 9.30, 1.29 and 5.10 kg, respectively, over T7. Similarly, crude protein was also highest in T8 (268 g/kg), followed by T9 (265 g/kg) and T7 (262 g/kg).
Nutrient recovery exhibited a direct relationship with crop yield and nutrient utilization. Nutrient recovery varied with different fertilizer doses applied in different treatments (Table 5). The highest apparent N and P recovery were recorded in T8 followed by T7 whereas K recovery was highest in T4 followed by T8. Application of bio-inoculants with balanced fertilizers (T8) increased N and P use efficiency by 39.3 and 60.4%, respectively, over the T5 treatment, and by 35.5 and 35.9% over the T7 treatment. Application of higher doses of mineral fertilizers for a higher target yield (T9) also achieved 50.4, 14.2 and 13.9% N, P and K recovery, respectively.
Microbial biomass carbon, microbial counts and soil enzymes
Application of mineral fertilizers significantly altered TCB, TCA, TCF, AZO and PSM counts over the control (P < 0.05; Table 6). Treatment T7 (FYM with balanced fertilizers) showed significantly (P < 0.05) higher TCB counts (9.67 × 10⁵ cfu/g soil), TCF (4.01 × 10⁴ cfu/g soil) and AZO counts (24.3 × 10⁴ cfu/g soil) over rest of the treatments, whereas TCA count (5.52 × 10⁵ cfu/g soil) was highest in T9 and PSM counts (16.4 × 10⁴ cfu/g soil) was highest in T8. Unbalanced application of mineral fertilizers (T4 and T5) could not improve TCF and AZO counts compared to T1. Application of higher doses of mineral fertilizers for a higher target yield (T9) decreased TCB, TCF, AZO and PSM significantly (P < 0.05) over T7 and T8. Azotobacter and PSM counts were highly susceptible to large doses of N and P fertilizer compared with TCB, TCA and TCF. The TCB/TCA ratio was highest (24.1) in T8 whereas the TCA/TCF ratio was highest (16.4) in T9.
Table 6. Effect of different treatments on microbial activity of lentil were presented with standard error of mean (s.e.m.±)

TCB, total culturable bacteria; TCA, total culturable actinomycetes, TCF, total culturable fungi; PSM, total culturable phosphate solubilizing microorganisms, TCB/TCF, ratio of total culturable bacteria and total culturable fungi, TCB/TCA, ratio of total culturable bacteria and total culturable actinomycetes; cfu/g, colony forming unit per gram soil.
T1: Control (no mineral fertilizers, farmyard manure(FYM) or bio-inoculants), T2: FYM @ 5 t/ha, T3: Bio-inoculants, T4: Farmers practice, T5: Recommended dose of mineral fertilizers, T6: Precise application of mineral fertilizers based on initial soil test values and targeted yield equations for achieving target yield of 1.5 t/ha lentil grain, T7: Integrated approached based on initial soil test values and targeted yield equations for achieving target yield of 1.5 t/ha lentil grain + FYM @ 5 t/ha, T8: Integrated approached based on initial soil test values and targeted yield equations for achieving target yield of 1.5 t/ha lentil grain + Bio-inoculants and T9: Precise application of mineral fertilizers based on initial soil test values and targeted yield equations for achieving targeted yield of 2.0 t/ha lentil grain. ± represents standard errors of mean (s.e.m.±).
Soil MBC varied significantly (P < 0.05) between the treatments and was highest in T7 (379.2 µg c/g) and lowest in the control (131.4 µg c/g). Treatment T7 increased MBC by 35.4, 25.9 and 80.5% over that of T9, T8 and T6, respectively (Table 7). As with MBC, the highest (9.14 µg CO2/g soil/h) and lowest (5.82 µg CO2/g soil/h) soil respiration rates were found in T7 and T1, respectively. Application of fertilizers through different approaches significantly (P < 0.05) affected DHA, FDHA, urease, ACP and ALP activities over the control (T1). The highest DHA (2.01 µg triphenyl formazan (TPF)/g/h), FDHA (106.1 µg fluorescein/g/h), urease (58.7 µg NH4+/g/h) and ACP (351.1 µg PNP/g/h) were measured in the T7 treatment, while the highest ALP (240.6 µg PNP/g/h) was recorded in T8. The lowest enzymatic activities were recorded in T1. Treatment T9 reduced enzymatic activities in soil but levels were still generally higher than T4 and T5 in most cases. Treatment T7 increased DHA, FDHA and urease activities by 10.4, 7.44 and 14.5%, respectively, over T8. However, T8 showed 12.5% higher ALP over T7.
Table 7. Effect of different treatments on microbial biomass carbon and enzymatic activity

CO2, carbon dioxide; TPF, triphenyl formazan; NH4+, ammonium; PNP, p-nitrophenol.
T1: Control (no mineral fertilizers, farmyard manure(FYM) or bio-inoculants), T2: Farmyard manure @ 5 t/ha, T3: Bio-inoculants (mixture of Rhizobium + Bacillus megaterium), T4: Farmers practice, T5: Recommended dose of mineral fertilizers, T6: Precise application of mineral fertilizers based on initial soil test values and targeted yield equations (STV–TYE) for achieving target yield of 1.5 t/ha lentil grain, T7: Integrated approached based on initial STV–TYE for achieving target yield of 1.5 t/ha lentil grain + FYM @ 5 t/ha, T8: Integrated approached based on initial STV–TYE for achieving target yield of 1.5 t/ha lentil grain + Bio-inoculants and T9: Precise application of mineral fertilizers based on initial STV–TYE for achieving targeted yield of 2.0 t/ha lentil grain. ± represents standard errors of mean (s.e.m.±).
Nutrient status
Significant differences (P < 0.05) were seen in soil organic carbon (SOC), available nitrogen (Na), phosphorus (Pa) and potash (Ka) over the control (T1) due to fertilization through different approaches (Table 8). Similarly, all treatments apparently increased Na, Pa and Ka over initial levels, with the exception of T1. Balanced fertilization (T6, T7, T8 and T9) had pronounced effects on improving SOC, Na, Pa and Ka over unbalanced fertilization (T4 and T5). The SOC contents ranged from 7.23 g/kg in T1 to 7.97 g/kg in T7, significantly (P < 0.05) higher than the rest of the treatments. Treatments T7, T8 and T9 increased SOC contents by 11.2, 8.50 and 9.21%, respectively, over the initial SOC level of 7.17 g/kg. The highest Na (164 mg/kg) and Ka (71 mg/kg) were recorded in T9, improvements of 18 and 12 mg/kg over initial Na (146 mg/kg) and Ka (59 mg/kg) status, respectively. Available P was significantly (P < 0.05) higher in T8 than in the other treatments; it was 8.80 mg/kg higher than initial Pa levels (34 mg/kg). After completing three cycles of lentil cultivation, SOC had improved slightly in all treatments; however, Na was greatly reduced in T2 (−3.0 mg/kg) compared with initial levels, followed by T3 (−2.0 mg/kg). However, Pa (−1.20 mg/kg) and Ka (−3.0 mg/kg) were reduced slightly in the control plot only.
Table 8. Effect of different treatments on soil organic carbon (SOC) and nutrient status (nitrogen (N), phosphorus (P) and potassium (K)) after harvest of third cycle of lentil

T1: Control (no mineral fertilizers, farmyard manure(FYM) or bio-inoculants), T2: Farmyard manure @ 5 t/ha, T3: Bio-inoculants (mixture of Rhizobium + Bacillus megaterium), T4: Farmers practice, T5: Recommended dose of mineral fertilizers, T6: Precise application of mineral fertilizers based on initial soil test values and targeted yield equations (STV–TYE) for achieving target yield of 1.5 t/ha lentil grain, T7: Integrated approached based on initial STV–TYE for achieving target yield of 1.5 t/ha lentil grain + FYM @ 5 t/ha, T8: Integrated approached based on initial STV–TYE for achieving target yield of 1.5 t/ha lentil grain + Bio-inoculants and T9: Precise application of mineral fertilizers based on initial STV–TYE for achieving targeted yield of 2.0 t/ha lentil grain. ± represents standard errors of mean (s.e.m.±).
Correlation among the variables
Correlation matrix amongst various variable is given in Table 9. Lentil grain yield had strong significant positive correlation with straw yield (R 2 = 0.937, P < 0.001), crude protein (R 2 = 0.944, P < 0.001), Pa (R 2 = 0.895, P < 0.001), Ka (R 2 = 0.832, P < 0.005), SR(R 2 = 0.872, P < 0.01), ALP (R 2 = 0.876, P < 0.002), SOC (R 2 = 0.840, P < 0.005), SR (R 2 = 0.799, P < 0.01) than TCA (R 2 = 0.704, P < 0.034), TCF (R 2 = 0.671, P < 0.048), FDHA (R 2 = 0.727, P < 0.027) and Na (R 2 = 0.673, P < 0.047). However, CP had strong positive relationship with Pa (R 2 = 0.936, P < 0.001), DHA (R 2 = 0.837, P < 0.006), Ka (R 2 = 0.822, P < 0.006), ALP (R 2 = 0.813, P < 0.008) and SOC (R 2 = 0.804, P < 0.009). The total culturable bacteria counts, the backbone of biochemical reactions in soil, correlated strongly with urease (R 2 = 0.934, P < 0.001), AZO (R 2 = 0.930, P < 0.001), ACP (R 2 = 0.917, P < 0.001), MBC (R 2 = 0.907, P < 0.001), PSM (R 2 = 0.897, P < 0.001), TCF (R 2 = 0.886, P < 0.001), DHA (R 2 = 0.849, P < 0.004), SR (R 2 = 0.816, P < 0.007), FDHA (R 2 = 0.819, P < 0.007) and SOC (R 2 = 0.806, P < 0.009). The TCF counts exhibited significant strong positive relationship with ACP (R 2 = 0.953, P < 0.001), FDHA (R 2 = 0.935, P < 0.001), DHA (R 2 = 0.930, P < 0.001), MBC (R 2 = 0.904, P < 0.001), SOC (R 2 = 0.901, P < 0.001), UA (R 2 = 0.874, P < 0.002) and SR (R 2 = 0.831, P < 0.005). PSM had strong positive correlation with ACP (R 2 = 0.867, P < 0.002), UA (R 2 = 0.827, P < 0.003) and DHA (R 2 = 0.814, P < 0.008). MBC also had significant correlation with ACP (R 2 = 0.945, P < 0.001), SOC (R 2 = 0.923, P < 0.001), DHA (R 2 = 0.915, P < 0.001), SR (R 2 = 0.865, P < 0.003), FDHA (R 2 = 0.831, P < 0.005) and ALP (R 2 = 0.824, P < 0.006). SOC showed positive correlation with Ka (R 2 = 0.755, P < 0.019) and Pa (R 2 = 0.751, P < 0.020).
Table 9. Correlation matrix among determined variables

Grain yield (GY), straw yield (SY), crude protein (CP), total cultivable bacteria (TCB), total culturable actinomycetes (TCA), total culturable fungi (TCF), Azotobacter (AZO), phosphate solubilizing microorganism (PSM), microbial biomass carbon (MBC), soil respiration (SR) and soil enzyme activities viz., dehydrogenase (DHA), fluorescence diacetatehydrolytic (FDHA), urease (UA), acid phosphatase (ACP), alkaline phosphatase (ALP), Soil organic carbon (SOC), available nitrogen (Na), available phosphorus (Pa), available potassium (Ka).
n = 9, **Pearson correlation is significant at P < 0.01, *Correlation is significant at P < 0.05.
Soil quality index
The impact of mineral fertilizer application through different approaches was assessed by computing a SQI. Considering the 16 microbial, enzymatic and chemical attributes of soil, three PCs were identified with eigenvalues >1 (Table 10). The total variance explained by these PCs was 86%. PC1, PC2 and PC3 contributed 56.9, 18.7 and 10.3% of the variance. The first PC had five highly weighted variables (SOC, TCF, SR, TCB and MBC) within 10% of the highest factor loading, which explained 56.9% of variation (Table 9). Among these five variables, SOC, TCF and MBC were identified for the MDS. In PC2, ACP was selected whereas in PC3 only Pa was retained in the MDS. Therefore, the final MDS included SOC, TCF, MBC, ACP and Pa. After deciding the shape of the anticipated response (more is better), the threshold values were assigned taking into account site-specific characteristics and management goals (Table 11). All MDS indicators scored in the range of 0.1–1.0. Weights were assigned to MDS indicators using the PCA outcomes (Table 11), which were equal to percentage of variance explained by the PC. The SQI was measured by employing data of estimated factors to soil quality indicators using integrated quality index equations (Eqn (2)).
 $${\rm SQI} = \displaystyle{{0{\cdot}19S_{{\rm SOC}} + 0{\cdot}19S_{{\rm TCF}} + 0{\cdot}19S_{{\rm MBC}} + 0{\cdot}19S_{{\rm ACP}} + 0{\cdot}19S_{{\rm P}_{\rm a}}} \over {0{\cdot}86}}$$
 $${\rm SQI} = 0{\cdot}{\rm 22}S_{{\rm SOC}} + 0{\cdot}{\rm 22}S_{{\rm TCF}} + 0{\cdot}{\rm 22}S_{{\rm MBC}} + 0{\cdot}{\rm 22}S_{{\rm ACP}} + 0{\cdot}{\rm 12}S_{{\rm P}_{\rm a}} $$
where S is the score for the subscribed variable and coefficient are the weighting factors.
Table 10. Principal component analysis of soil quality indicator for the first four PCs

Variables viz., Total culturable bacteria (TCB), total culturable actinomycetes (TCA), total culturable fungi (TCF), Azotobacter (AZO), total culturable phosphate solubilizing microorganisms (PSM), microbial biomass carbon (MBC), soil respiration (SR), dehydrogenase activity (DHA), fluorescence diacetate hydrolytic activity (FDHA), urease activity (UA) acid phosphatase activity (ACP), alkaline phosphatase activity (ALP), soil organic carbon (SOC), available N (Na), available P (Pa) and available K (Ka). Eigenvalues in bold correspond to the PCs examined for the index.
Component loadings in bold are considered highly weighted, Bold-underlined component loadings correspond to indicators included in MDS.
Table 11. Scoring functions (SF), threshold values and weight for the minimum data set (MDS)-indicators

SOC, soil organic carbon; TCF, total culturable fungi; MBC, microbial biomass carbon; ACP, acid phosphatase; Pa, available phosphorus; La, lower threshold, at which or below score is 0; Ba, baseline, at which score is 0.5; Ua, upper threshold, at which or above score is 1.
Among the treatments, SQI ranged from 0.66 in the control treatment (T1) to 0.92 in T7. Treatment T7 measured the highest SQI (0.92, P < 0.05) followed by T8 (0.85) and T9 (0.82). The lowest SQI (0.66, P < 0.05) was recorded in T1. The average contributions of each MDS indicator were 20.7, 19.5, 18.3, 10.2 and 9.31% towards SQI through SOC, ACP, TCF, Pa and MBC, respectively (Fig. 2). Correlation analysis results showed that SQI had significant correlation with CP (y = 7.42 × + 20.05; R 2 = 0.735) (Fig. 3(a)) and grain yield (y = 2.395 × −0.518; R 2 = 0.701) (Fig. 3(b)).
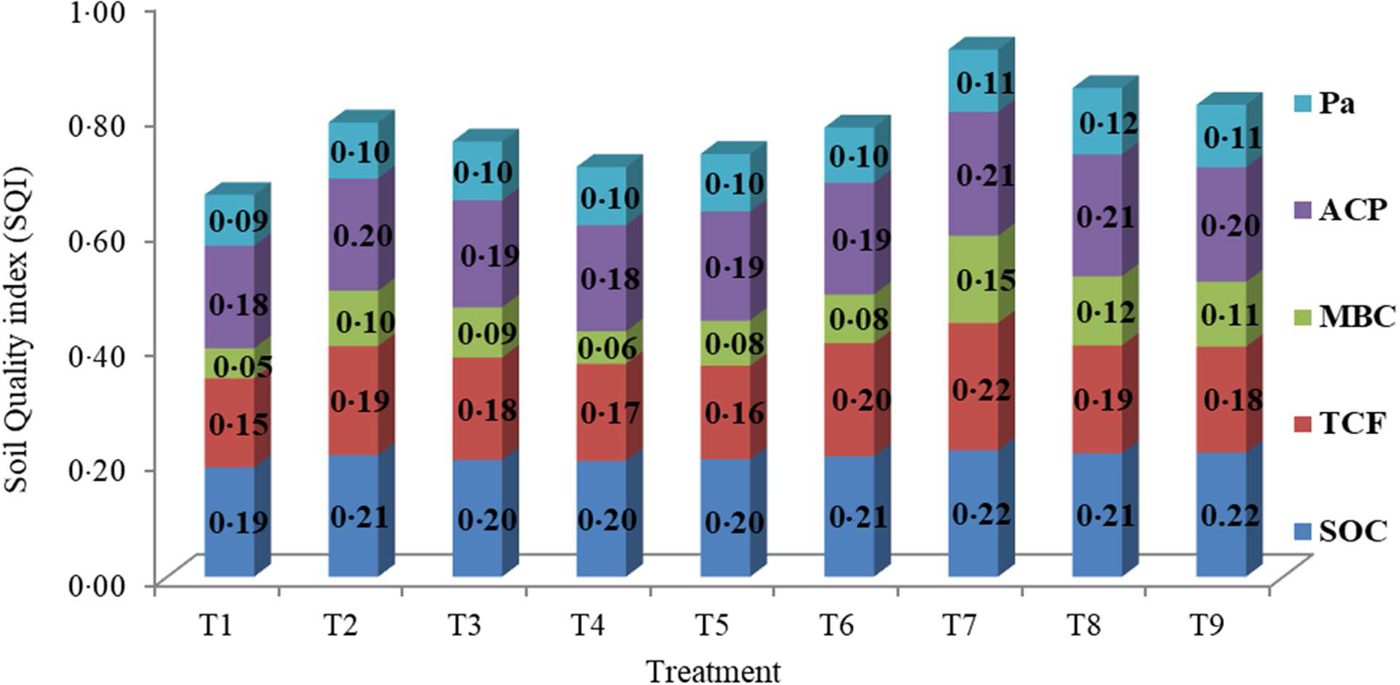
Fig. 2. Average effect of different treatments on soil quality index (SQI) and individual contribution of minimum data set (MDS) indicator (scored and weighted) to overall index value. T1: Control (no mineral fertilizers, farmyard manure (FYM) or Bio-inoculants), T2: FYM @ 5 t/ha, T3: Bio-inoculants, T4: Farmers practice, T5: Recommended dose of mineral fertilizers, T6: Precise application of mineral fertilizers based on initial soil test values and targeted yield equations for achieving target yield of 1.5 t/ha lentil grain, T7: Integrated approached based on initial soil test values and targeted yield equations for achieving target yield of 1.5 t/ha lentil grain + FYM @ 5 t/ha, T8: Integrated approached based on initial soil test values and targeted yield equations for achieving target yield of 1.5 t/ha lentil grain + Bio-inoculants and T9: Precise application of mineral fertilizers based on initial soil test values and targeted yield equations for achieving targeted yield of 2.0 t/ha lentil grain. Pa, available phosphorus; ACP, acid phosphatase; MBC, microbial biomass carbon; TCF, total culturable fungi; SOC, soil organic carbon.

Fig. 3. (a) Correlation between soil quality index (SQI) values and crude protein (CP) of lentil; (b) Correlation between soil quality index (SQI) values and grain yield of lentil.
Discussion
Nodulation, yield, nutrient acquisition and nutrient use efficiency
In the present study, significant variations were observed in nodule number, and fresh and dry weight of nodules in response to fertilizer regime. Integration of bio-inoculants and FYM with balanced fertilization showed higher nodulation than unbalanced fertilization. This might be due to balanced fertilization providing adequate nutrient supply at critical stages of plant development, promoting proliferation and development of the root system. The negative impact of low mineral N on nodulation under unbalanced fertilizer treatments could be related to nutrient stress for the host plant and the high energetic cost of the process (Robertson & Groffman Reference Robertson, Groffman and Paul2015). Inoculation of B. megaterium as a P-solubilizer enhanced nodulation by promoting early root and lateral fibre formation resulting in improved P uptake, as clearly depicted in the current results. Shahzad et al. (Reference Shahzad2008) suggested that P played a vital role in energy transformation and translocation, which helps nodule formation and their activation. Further, co-inoculation was more effective than FYM integrated with balanced fertilizers, owing to the synergistic effect of co-inoculated Rhizobium and B. megaterium. Together, these enhance nodulation by reducing endogenous ethylene production by plants, producing antibiotics against pathogenic organisms and siderophores that chelate insoluble cations and colonizing root surfaces, thereby out-competing pathogens (Contesto et al. Reference Contesto2008). Application of FYM ensured a balanced supply of macro- and micro-nutrients, besides improving the physical, chemical and microbiological properties of soil, and is also used as a carbon substrate by native as well as inoculated bio-inoculants, resulting in better nodulation. Moreover, the inoculated Rhizobium strain is more efficient than native populations, again resulting in better nodulation (Zafar et al. Reference Zafar2012; Iqbal et al. Reference Iqbal2016). Robertson & Groffman (Reference Robertson, Groffman and Paul2015) revealed that the higher mineral N concentration in the soil solution common in high fertilizer regimes would limit nodulation and biological N fixation. The current results also showed that higher doses of mineral fertilizers, applied for higher yield targets (T9), reduced nodulation notably compared with that of balanced fertilizer treatments due to increasing nitrate (NO3−) levels, leading to greater NO3− uptake. The decrease in nodulation in most legume specie sowing to substantial nitrous oxide (NO) uptake by the legumes is usually associated with decreasing nodule weight. This decrease was reported by Andrews et al. (Reference Andrews, Ramsay and Middlefell-Williams1992) to be greater in lentil (92%) than field bean (60%).
Grain and straw yield of lentil in the present study were altered significantly in the fertilizer treatments compared with the unfertilized control. Similar results have been reported in mung bean by Choudhary et al. (Reference Choudhary2011). Several researchers have reported that application of conventionally recommended doses of inorganic fertilizers had poor impact on yield, nutrient uptake, crop quality and fertility status (Ramamurthy et al. Reference Ramamurthy2009; Singh et al. Reference Singh2015). This failure could be due to unbalanced application of nutrients through old and out-dated general recommendations of fertilizers under intensive cropping systems. Mono-cropped lentil has been reported to remove 52–67 kg N/ha from the soil, which cannot be met through unbalanced fertilization. Also, lentil crops do not acquire much mineralizable-N from soil layers deeper than 0.6 m due to their shallow root system and higher risk of N losses through de-nitrification, which minimize N availability and cause adverse effects on crop yield (Kutschera Reference Kutschera1960). However, in the present study the highest yield (straw and grain) was observed in balanced treatments (T6, T7, T8 and T9) due to improvements in nodulation, dry matter yield and nutrient uptake. The lower target yield (1.5 t/ha) was achieved by the application of balanced fertilizers because the gap between applied nutrients and their availability was smaller. However, the higher target yield (2.0 t/ha) could not be achieved, which might be attributed to a mismatch between nutrient availability and removal. Adequate supply of nutrients to the crop under balanced fertilizer treatments, based on soil tests and target yields, significantly enhanced plant growth, nodulation and dry matter, which are directly proportional to the grain yield of lentil (Lavanya & Toms Reference Lavanya and Toms2009; Kundu et al. Reference Kundu, Mandal and Majumder2013). Integration of FYM and bio-inoculants with balanced fertilizer treatment improved grain yield by 14.0 and 21.3% over balanced fertilizers alone, in spite of lower doses of mineral fertilizers being applied. This could be attributed to increased MBC, soil enzymes and nutrient status, promoting nutrient supply to the plant. The current results clearly revealed that grain yields had a positive relationship with straw yield, crude protein, TCA, TCF, MBC, SR, DHA, FDHA, ACP, ALP, SOC, Na, Pa and Ka. These results corroborate those of Elfstrand et al. (Reference Elfstrand, Hedlund and Martensson2007). Rhizobium–Bacillus association promoted nodulation, dry matter and nutrient concentrations to produce higher levels of yield despite some extent of subsidy from mineral fertilizers. Beside N2 fixation and P solubilizing efficiency, these bacteria produce various biologically active compounds, viz. auxins, enzymes, phytohormones and siderophores, which play a crucial role for yield improvement (Egamberdiyeva Reference Egamberdiyeva2005).
Nutrient acquisition varied significantly due to application of fertilizer through different approaches. The highest nutrient removal was found in the bio-inoculant plus balanced fertilizer treatment, despite application of 41.1, 37.5 and 36.6% lower doses of N, P2O5 and K2O than in the higher fertilized treatment. This might be attributed to increased nutrient content in plants and grains resulting in higher biomass yield owing to balance supply of nutrient at active stages of crop growth. The effect of bio-inoculation plus balanced fertilizers on nutrient acquisition was more pronounced than FYM application because co-inoculation had a direct impact on the nutrient supply system. Although FYM application increased SOC, SR, microbial counts and soil enzymes, thereby improving the physical condition of soil (Stark et al. Reference Stark2007), this had only indirect effects on nutrient uptake. Rhizobium is a symbiotic N fixer which has high potential to fix N2 into NH3, thereby improving N concentration in plants and grains. Similar results were also reported by Basu & Bansyopadhyay (Reference Basu and Bansyopadhyay1990). Bacillus megaterium solubilizes insoluble P into available P by production of organic acids, which enhances P concentration in the rhizosphere of plants. Rhizobium and Bacillus, having synergistic effects, played a vital role in promoting their activity and nutrient content in plant biomass (Gull et al. Reference Gull2004). Crude protein was found to be highest in balanced fertilizer treatments. It seems that the higher nodule dry weight and shoot N contents supplied sufficient N for synthesis of amino acids, which translated into higher seed protein content. Moreover, a balanced nutrient supply system in the soil and symbiotic N fixation carried out by Rhizobium may enhance N availability in soil, resulting in higher N content in grains (Hoque & Haq Reference Hoque and Haq1994). The increase in seed protein percentage can be linked with better N supply to the plant.
Apparent nutrient recovery is an indicator for assessing the impacts of different fertilizer treatments. The maximal N and P recovery in an integrated, balanced fertilizer treatment is due to it having the highest N and P uptake and biomass yield. The higher N recovery seen in balanced fertilizer treatments compared with other treatments might be due to symbiotic N2 fixation improving N availability and its translocation into the plants and grains of lentil, resulting in higher biomass yield. However, enhancing P recovery is the result of improving ACP and ALP, which promoted P dynamics in the soil. In the present study, Pa was positively correlated with ACP, which indicated that a balanced supply of P during the growth period of lentil accelerated P recovery. However, a lower dose of balanced fertilization recorded the highest K recovery rate. This may have been due to effective uptake of applied nutrients (Bera et al. Reference Bera2006). The lowest P recovery, seen under farmers’ practice, might be due to imbalances in microbial (bacterial, fungal, actinomycetes, Azotobacter and PSM) and enzymatic dynamics in soil that adversely affected the conversion and translocation of plant nutrients.
Microbial biomass carbon, microbial counts and enzymatic activity
Balanced fertilization based on soil tests and target yield had a beneficial effect on MBC, SR, microbial counts and enzymatic activities. The current results revealed that application of FYM or bio-inoculants alone or in combination with inorganic fertilizers significantly increased bacterial, fungal, actinomycetes, Azotobacter and PSM counts, whereas unbalanced application of mineral fertilizers caused lower MBC and SR. Kumar et al. (Reference Kumar2013) reported that organic manure containing vast quantities of readily utilizable energy sources and balanced fertilizers being rich in available nutrients that stimulate growth of microorganisms (TCB, TCA, TCF, AZO and PSM), positively correlated with MBC and SR. In addition to this, organic manure improved build-up of SOC in the soil and had a significant positive correlation with MBC, thus helping to increasing MBC and SR. Moreover, FYM supplies organic C substrates that help microorganisms not only for maintenance but also for production of new biomass. The current findings revealed that SOC had a positive relationship with TCB and exhibited an active role for enhancing the microbial count, resulting in higher MBC and SR.
Integration of FYM or bio-inoculants with balanced inorganic fertilizers significantly enhanced TCB, TCA, TCF, AZO and PSM in the present study. These results support those of Kanazawa et al. (Reference Kanazawa, Asakawa and Takai1988), who reported that application of FYM or bio-inoculation increased SOC and MBC, which had significant positive effects on microbial counts. However, application of higher doses of mineral fertilizers had a positive effect on TCA but a negative effect on Azotobacter counts, as it is more sensitive to nitrogenous fertilizers. Although ammonium is the preferred N source for most bacteria and fungi (Marzluf Reference Marzluf1997), when applied at high rates through urea and ammonium fertilizers it may inhibit soil microorganisms due to ammonia toxicity, increase in soil pH and ionic strength (Omar & Ismail Reference Omar and Ismail1999).
Chang et al. (Reference Chang, Chung and Tsai2007) and Ai et al. (Reference Ai2012) reported that application of organic manure and inorganic fertilizers not only affect microbial counts but also soil enzymes. Enzymatic activity is widely used as an indicator of soil quality and has a close relationship to nutrient transformation of soil (Yang et al. Reference Yang2008). Li et al. (Reference Li2008) reported that soil microbial biomass was positively correlated with soil enzymatic activities. Higher enzymatic activities were observed in FYM plus balanced fertilizer treatments in the present study, based on soil test values and target yield equations. These results are coherent with the findings reported by Singh et al. (Reference Singh2017). Geisseler & Horwath (Reference Geisseler and Horwath2009) found an increased availability of mineral N due to production of extracellular enzymes involved in the C, N and P cycle. These results are in line with the present study, which showed a marked increase in DHA, FDHA, ACP and ALP activities when available N increased. Yang et al. (Reference Yang2007) explained that UA was affected slightly by mineral fertilizers applied alone, even though urea is a common N fertilizer, but improved significantly due to integration of FYM or bio-inoculants with balanced fertilizers. Bio-inoculation improved enzymatic activity due to increasing microbial counts, MBC, SOC and availability of N and P, which had a direct impact on soil enzymes. These results, attributed to N2 fixation, P solubilization, and production of plant growth-promoting and bio-controlling substances, might promote bacterial, actinomycetes, fungal, PSM and Azotobacter counts at adequate supply of nutrient. The increasing microbial counts result in enhanced enzymatic activity because they have a direct correlation with microbial counts, as depicted in the current results.
Fertility status and soil quality
Application of balanced fertilizer had pronounced effects on improving SOC, Na, Pa and Ka over the unbalanced fertilization and initial nutrient status. In the present study, balanced mineral fertilization with FYM increased SOC by 10.2% compared with the control. These findings are corroborated with results of Körschens et al. (Reference Körschens2013). With increasing lentil productivity over the years, the major portion of plant residues (rhizo-deposition, root, shoot and branch biomass) is returned to the soil during crop growth and at harvest has a positive impact on SOC (Ladha et al. Reference Ladha2011), microbial counts (TCB, TCA, TCF, AZO and PSM), MBC, SR and enzymatic activity (DHA, FDHA, urease, ACP and ALP). Zhong & Cai (Reference Zhong and Cai2007) illustrated that soil available nutrients (Na, Pa and Ka) were notably altered by the application of mineral fertilizers in comparison to a control, which is in accordance with the current results. The increase in SOC seen in the present study for FYM plus balanced mineral fertilization might be attributed to increasing microbial activities (bacteria, actinomycetes, fungal counts), MBC, grain and straw yield by the addition of residue biomass and stabilization in to SOC that had significant positive correlation with TCB. Moreover, the current findings also indicate that microbial biomass is more important than plant biomass for enhancing SOC as the FYM plus balanced fertilizer treatment had higher SOC than balanced fertilizers alone, where higher amounts of plant biomass were added. These results are accordance with the findings of Gregorich et al. (Reference Gregorich, Drury and Baldock2001) and Srinivasrao et al. (Reference Srinivasrao2012). Application of higher doses of mineral fertilizers in an attempt to achieve higher target yields based on soil test values and target yield equations showed the highest Na and Ka. This indicates that balanced fertilization improved the build-up of Na and Ka status in soil, despite having the highest nutrient acquisition. The N fixed in plant nodules is partly used by the plant as indicated by improvement in N contents of straw and grains. The remaining N is added to the soil and can be utilized by the subsequent crop. Similar observations reported by Daterao et al. (Reference Daterao1990) also revealed increased soil N after the harvest of green gram. However, inoculation of bio-inoculants, especially P-solubilizers, solubilized unavailable forms of inorganic P into available inorganic P through production of organic acids.
In the present study, SOC (0.316) and TCF (0.302) were retained in the MDS owing to higher factor loading values, whereas TCB counts and SR were redundant owing to low factor loading values and significant correlation with SOC (Rezaei et al. Reference Rezaei, Gilkes and Andrews2006). Microbial biomass carbon was selected as a soil quality indicator despite a lower factor loading value than TCB and SR in PC1 because of strong significant correlations with SOC, grain yield, crude protein, TCB, TCA, TCF, AZO and PSM which promote grain yield and soil quality. Soil organic carbon, an agent of labile nutrients, is a determinant for establishment of soil quality in management systems (Qi et al. Reference Qi2009). Moreover, SOC was not only significantly correlated with grain yield, straw yield and crude protein but also significantly correlated with TCB, TCA, TCF, SR, DHA, FDHA, ACP and ALP. Therefore, SOC was retained in PC1 as a soil quality indicator, although it was significantly correlated with MBC. Total cultivable fungi was selected as a soil quality indicator with the next highest factor loading value after SOC because it plays a vital role in decomposition of crop residues, mobilization/solubilization of nutrients, producing plant growth promoting substances and addition of fungal biomass. Also, the fungal mycelium helps to stabilize soil aggregates (Ellouze et al. Reference Ellouze2014). Acid phosphatase, FDHA and Ka were the only high-loading factor variables in PC2. Acid phosphatase was retained in the MDS in PC2 since it had a higher loading factor value (0.358) than FDHA (0.340) or Ka (0.332). Fluorescein diacetate hydrolytic activity had a strong, significant correlation with ACP and low factor loading value; therefore, it could not be retained in PC2. Phosphorous is an important factor for growth and development, especially in leguminous plants that have very low recovery rates. Hence, this clearly indicates the preference of available P to lentil. In the present study, Pa was a primary factor in PC3 having high factor loading (0.479). Urease activity and Na could not be retained in the MDS due to lower loading values. The choice among well-correlated variables could also be based on the practicability of the variables; hence, one could use the final MDS considering the logical utility and interpretability (Andrews et al. Reference Andrews2002a). Considering these objectives, options were utilized to retain or eliminate the variables from the MDS. Hence, the final MDS consisted of SOC, TCF, MBC, ACP and Pa. Among these five indicators, SOC was the most dominant factor.
Integration of FYM or bio-inoculants with balanced fertilizer treatments enhanced SQI due to improvement in MBC, microbial counts, enzymatic activity, SOC and nutrient content of soil. Soil organic carbon is well known for improving soil quality owing to significant correlations with MBC, microbial counts, enzymatic activity and soil fertility. Application of higher doses of mineral fertilizer to achieve higher yield targets also enhances soil quality due to increases MBC, SOC and available nutrient in soil, despite slightly lower microbial counts and enzymatic activity than integration of FYM and bio-inoculants (Singh et al. Reference Singh2015). Coming to the role of MBC, microbial biomass consists mostly of bacteria and fungi, which decompose crop residue and organic matter in soil and release nutrients into the soil that are then available for plant uptake. Several studies have suggested that MBC is a useful and sensitive measure of changes in soil organic matter by microbial activities that are the driving force behind soil organic matter transformation through mineralization and immobilization. These transformations are the basis of plant decomposition, nutrient availability, soil pH, soil aggregation and soil tilth (Dhull et al. Reference Dhull2004). Chinnadurai et al. (Reference Chinnadurai, Gopalaswamy and Balachandar2014) also reported that MBC is influenced strongly by management practices and that it provides an indication of a soil's ability to store and recycle nutrients and energy. In lentil, being a leguminous crop, the contribution of ACP to yield and SQI is important as ACP is the most important enzyme for P dynamics. Hence, Pa is not only important in energy transformation and storage for metabolic processes but also plays a very crucial role in root establishment, proliferation and N2 fixation.
Conclusions
The results implied that application of balanced fertilization based on initial soil test values and target yields achieved the lower of two target grain yields of lentil with slight deviation (−9.33%) but increased soil microbial counts, MBC, soil respiration and enzymatic activities, rendering significant improvement in SQI through maintenance of soil N, P and K status. The highest increase in microbial counts, enzymatic activities, nutrient status and SQI were seen in balanced fertilizers applied as per initial soil test value and target yield equations with organic manure (FYM) and co-inoculation of Rhizobium + B. megaterium. However, unbalanced fertilization such as farmers’ practice and recommended doses of fertilizers led to a deterioration of the soil quality, which impacted grain and straw yields of lentil adversely. Overall, the present study therefore clearly reflected that the balanced application of mineral fertilizers based on site-specific soil test values and target grain yields in combination with organic manures and bio-fertilizers is the best approach for accelerating nutrient acquisition, fertility status and improving SQI for sustaining lentil productivity in the New Gangetic alluvial soils of India.
Acknowledgements
We express our gratitude to the Director, ICAR-Central Research Institute for Jute and Allied Fibers, Barrackpore, Kolkata, India for providing facilities, technical suggestions and constant encouragement. The assistance provided by technical staff during the conductance of experiments is duly acknowledged.
Financial Support
We are thankful to Indian Council of Agricultural Research, New Delhi, India and All India Coordinated Research Project on Soil Test and Crop Response (AICRP on STCR), Bhopal, for their financial assistance towards the study.
Conflict of Interest
None.


