Introduction
Insects are host to diverse microbial communities (Dillon & Dillon, Reference Dillon and Dillon2004; Anderson et al., Reference Anderson, Sheehan, Eckholm, Mott and DeGrandi-Hoffman2011) that include a wide range of pathogenic taxa (Schmid-Hempel, Reference Schmid-Hempel1998). Pathogens can have a range of effects on their insect hosts, including reduced reproduction (Calleri et al., Reference Calleri, Rosengaus and Traniello2006; Dunn et al., Reference Dunn, Torchin, Hatcher, Kotanen, Blumenthal, Byers, Coon, Frankel, Holt, Hufbauer, Kanarek, Schierenbeck, Wolfe and Perkins2012). Symptoms include low-energy reserves and reduced fertility. Low-fat content alone can impact survival. Ants with a lower fat content, for example, have been found to be less able to survive physiologically stressful conditions (Elmes et al., Reference Elmes, Wardlaw, Nielsen, Kipyatkov, Lopatina, Radchenko and Barr1999). Fat content also plays a role in immunity and is thus one indicator of general health (Fellous & Lazzaro, Reference Fellous and Lazzaro2010).
In many social insects, the queen or queens are the sole reproducing females in the colony. They alone produce workers that are responsible for all the other tasks essential for colony functioning such as brood care, colony defense and foraging (Alaux et al., Reference Alaux, Folschweiller, McDonnell, Beslay, Cousin, Dussaubat, Brunet and Le Conte2011). In polygynous ant species, population size and spread is usually positively correlated with queen number (Ingram, Reference Ingram2002a, Reference Ingramb; McGlynn, Reference McGlynn2010). Therefore, low queen numbers in polygyne colonies may constrain colony growth and expansion (Nonacs, Reference Nonacs1991). Low queen numbers may be due to low queen production or relatively high queen mortality.
In social insect societies, pathogens can affect colony health via the queen, either by killing the queen directly, or negatively affecting her reproduction. For example, the microsporidian, Kneallhazia solenopsae, has been shown to cause a reduction in colony size in fire ants, potentially by destroying the fat bodies of queens, and thereby reducing queen fertility (Briano et al., Reference Briano, Patterson and Cordo1995a). In Apis mellifera colonies in Australia, the most common cause of death of larval queens is the Black queen cell virus (Nguyen et al., Reference Nguyen, Ribiere, vanEngelsdorp, Snoeck, Saegerman, Kalkstein, Schurr, Brostaux, Faucon and Haubruge2011). Similarly, Valles et al. (Reference Valles, Porter, Choi and Oi2013) found Solenopsis invicta queens infected with S. invicta virus 3 (SINV-3) had fewer eggs in their ovaries than uninfected queens. Clearly there are a wide variety of pathogens that can influence the reproductive rates of social insects.
Social insects, like other social animals, are thought to be particularly vulnerable to disease because their extremely close living conditions may increase pathogen transmission rates (Schmid-Hempel, Reference Schmid-Hempel1998). Pathogens affecting social insects are especially well studied in the honey bee, A. mellifera, because of the myriad of pathogens associated with colony collapse disorder (Cox-Foster et al., Reference Cox-Foster, Conlan, Holmes, Palacios, Evans, Moran, Quan, Briese, Hornig, Geiser, Martinson, vanEngelsdorp, Kalkstein, Drysdale, Hui, Zhai, Cui, Hutchison, Simons, Egholm, Pettis and Lipkin2007; Oldroyd, Reference Oldroyd2007; vanEngelsdorp et al., Reference vanEngelsdorp, Evans, Saegerman, Mullin, Haubruge, Nguyen, Frazier, Frazier, Cox-Foster, Chen, Underwood, Tarpy and Pettis2009). Other hymenopteran species may also harbor many pathogens and parasites that affect their population dynamics (Briano et al., Reference Briano, Patterson and Cordo1995b; Briano, Reference Briano2005; Cameron et al., Reference Cameron, Lozier, Strange, Koch, Cordes, Solter and Griswold2011). Pathogens of invasive species are of particular interest because of their potential role in biocontrol (Oi & Valles, Reference Oi, Valles, Hajek, Glare and O'Callaghan2009; Valles et al., Reference Valles, Oi, Yu, Tan and Buss2012; Lester et al., Reference Lester, Bosch, Gruber, Kapp, Peng, Brenton-Rule, Buchanan, Stanislawek, Archer, Corley, Masciocchi, Van Oystaeyen and Wenseleers2015; Sébastien et al., Reference Sébastien, Lester, Hall, Wang, Moore and Gruber2015; Gruber et al., Reference Gruber, Cooling, Baty, Buckley, Friedlander, Quinn, Russell, Sébastien and Lester2017). To date, the most well-studied invasive ant species, S. invicta, has been found to host over 40 species of pathogens and parasites (Oi & Valles, Reference Oi, Valles, Hajek, Glare and O'Callaghan2009).
The yellow crazy ant, Anoplolepis gracilipes (F. Smith), is one of the six most widespread, abundant and damaging invasive ants globally (Holway et al., Reference Holway, Lach, Suarez, Tsutsui and Case2002). It is prevalent in the Pacific region and is thought to most likely be native to Southeast Asia (Wetterer, Reference Wetterer2005; Drescher et al., Reference Drescher, Feldhaar and Bluthgen2011). Multiple studies have identified numerous microorganisms associated with this ant (Sébastien et al., Reference Sébastien, Gruber and Lester2011; Gruber, Reference Gruber2012), and several pathogens have recently been detected (Cooling et al., Reference Cooling, Gruber, Hoffmann, Sébastien and Lester2016), but the effect these pathogens may have on the host population has yet to be documented. Population crashes or declines have been observed in this species, without obvious causes (Haines & Haines, Reference Haines and Haines1978; Gruber et al., Reference Gruber, Burne, Abbott, Pierce and Lester2012; Cooling & Hoffmann, Reference Cooling and Hoffmann2015), though pathogens have been suggested (Gruber, Reference Gruber2012; Cooling & Hoffmann, Reference Cooling and Hoffmann2015). The nature of these observed population declines, the lack of worker symptoms and the slow rate of decline led to the hypothesis that if a pathogen was involved, it was likely to be affecting the queens either through direct mortality and/or reducing their reproductive output (Cooling & Hoffmann, Reference Cooling and Hoffmann2015). Here we investigated if there is evidence of a pathogen that could be responsible for killing ant queens or affecting their reproductive output in A. gracilipes populations in Arnhem Land, Australia. Specifically we compared: (1) queen number, (2) queen fecundity and (3) the queen fat content among populations of varying worker abundance levels. We hypothesized that low- and medium-abundance populations would have significantly fewer queens per nest, and associated queens would have a lower reproductive output and reduced energy reserves than queens from high-abundance populations.
Materials and methods
Population selection
We used six populations classed into three population types (low, medium and high abundance), previously defined from a combination of spatial surveys, population abundances and historical observations (Cooling & Hoffmann, Reference Cooling and Hoffmann2015; Cooling, Reference Cooling2016; Cooling et al., Reference Cooling, Gruber, Hoffmann, Sébastien and Lester2016). See Supplementary Material S1 for details of the surveying process and surveyed population maps. Population selection was determined by both A. gracilipes worker abundance in each population at the time of sampling and each population's history of decline or expansion. The methods used to determine abundance are described in detail in Cooling et al. (Reference Cooling, Gruber, Hoffmann, Sébastien and Lester2016). Briefly, we selected four populations where A. gracilipes abundance was in various stages of decline in the absence of any human intervention (fig. 1) (low- and medium-abundance populations), and two that were expanding (high-abundance populations). The two low-abundance populations (L1, L2) were remnants of much larger populations that had declined substantially in the previous 5 years (Cooling & Hoffmann, Reference Cooling and Hoffmann2015; Cooling et al., Reference Cooling, Gruber, Hoffmann, Sébastien and Lester2016). Worker abundances at L1 and L2 were 31.75 ± 4.78 workers (mean of eight plots, each consisting of five pooled pitfall trap samples ± standard error) and 21 ± 10 workers, respectively. The two medium-abundance populations (M1, M2) had higher abundances (mean ± SE: 80 ± 22 workers and 57 ± 9 workers, respectively) than the low-abundance populations and covered a wider area. These populations were stable, but belonged to populations that were previously larger and had been observed to decline (Cooling et al., Reference Cooling, Gruber, Hoffmann, Sébastien and Lester2016). The two high-abundance populations (H1, H2) were expanding, had abundances two orders of magnitude higher (mean ± SE: 2749 ± 327 and 1401 ± 264, respectively) than the low- and medium-abundance populations, and covered large areas (Cooling et al., Reference Cooling, Gruber, Hoffmann, Sébastien and Lester2016).
Fig. 1. Study site locations (red squares) in NE Arnhem Land. L, M and H denote low-, medium- and high-abundance populations, respectively. Sites M1 and M2 are 450 m apart and H1 and H2 are 400 m apart and are discrete populations.
Nest and queen number
Queens were collected in February 2013 and 2015. Each year, three 30 m transects spaced a minimum of 30 m apart were haphazardly placed in each population. The length of each transect extending out 1 m on one side (30 m2) was searched for queens by scraping away litter with a trowel and moving rocks and logs. Every A. gracilipes nest found was excavated and the queens were collected, counted and the nest they were from recorded. Because this ant does not utilize persistent nest sites and individuals regularly move among nests (Hoffmann, Reference Hoffmann2014), a nest was defined as where workers and eggs, larvae, or pupae were present. A congregation of workers without the presence of eggs, larvae, or pupae was not considered a nest. A nest was considered completely excavated when the flow of workers exiting the nest had stopped and no queens had been found for at least 10 min. Nests within the same transect were considered separate from each other when there were no underground connections between chambers housing workers, eggs, larvae, pupae, or queens. To account for the effect of environmental differences among populations, at each nest and every 5 m mark, starting at 0 m along a transect, the following parameters were measured: canopy cover (%) (estimated visually), litter cover (%) (estimated visually), number of Acacia plants over 0.5 m tall, number of Eucalyptus plants over 0.5 m tall, rock cover (%), deadwood cover (%) and litter depth (average of three measurements) in a 1 m2 area with the nest at the center. In populations where no, or very few, nests were found along transects, the surrounding area was searched intensively, using the same methods as above of scraping away litter with a trowel to reveal nest entrances and looking under rocks and logs, to locate additional nests. The environmental measures associated with these nests were measured in the same manner as described above. Queens were chilled in a refrigerator at 4°C for 1.5 h, then placed into RNAlater ® Stabilization Solution (Life Technologies, Auckland, New Zealand) alive for optimal preservation (RNAlater Handbook, 2006). The vials of RNAlater ® were left at room temperature for 24 h before being placed in a freezer to allow the liquid to permeate the tissue. In order to increase replication, an additional 16 queens were randomly collected in February 2014 (eight from L1, eight from M2). These additional queens were included in the potential fecundity analysis only.
Generalized mixed effect models (GLMMs) with Poisson distributions were used to test if any of the environmental variables affected queen number per nest and nest number. Population, transect and year were random effects, with transect nested within population. Population type (low-, medium- or high-abundance population), canopy cover, litter depth, litter cover, number of Acacia and number of Eucalyptus were fixed effects. We did not use the sequential Bonferroni technique to correct for multiple comparisons, as it has been shown to substantially increase the chance of a making a type II error (failing to reject a false null hypothesis) (Moran, Reference Moran2003). GLMMs would be inappropriate if the data were spatially correlated; however, Mantel tests (9999 permutations) indicated that there was no spatial autocorrelation in the data (queen number: R 2 = 0.062, P = 0.086; nest number: R 2 = −0.011, P = 0.893).
All data analyses were performed using R v 3.0.2 (R Core Team, 2013). The package ‘ade4’ was used for the Mantel tests (Dray & Dufour, Reference Dray and Dufour2007). The package ‘lme4’ was used for the GLMMs (Bates et al., Reference Bates, Maechler, Bolker and Walker2014). Post-hoc comparisons used the package ‘lsmeans’ (Russell et al., Reference Russell, Hervão and Hervão2015).
Potential fecundity
To investigate reproductive output among population type, 278 queens (74 from low-abundance; 103 from medium-abundance; 101 from high-abundance populations; 143 from 2013; 16 from 2014; 119 from 2015) were dissected and ovariole number, the number of mature oocytes and length of longest basal oocyte (to the nearest 10 µm) counted. These variables are indicators of egg-laying rates in ants (Dalecky et al., Reference Dalecky, Gaume, Schatz, McKey and Kjellberg2005). The fat bodies were removed, placed in water and frozen for fat content analysis. Before dissection, head width and gaster width were measured to the nearest 0.05 mm with an ocular micrometer mounted on a dissecting scope. Head width is a standard and accurate measure of overall body size (Hölldobler & Wilson, Reference Hölldobler and Wilson1990; Kaspari, Reference Kaspari1993) and gaster width is a measure of egg-laying capacity in ants (Dalecky et al., Reference Dalecky, Gaume, Schatz, McKey and Kjellberg2005). While dissecting, it was discovered that some queens had melanized nodules, a cellular immune response in insects (Stanley et al., Reference Stanley, Haas and Miller2012), in their ovaries and fat bodies (fig. 2). A Poisson GLMM was used to test which variables affected oocyte number. Population, nest, year, queen number (how many queens were present in the original nest), head width, gaster width, ovariole number and length of longest basal oocyte were random effects, with the nest variable nested within population. Nodulation status (whether or not a queen had nodules), population type and their interaction term were fixed effects. Post-hoc comparisons were performed on population type and the interaction term. When interactions are present, comparisons can be difficult to extract from GLMMs as significance is measured relative to the lowest level of each factor (the intercept). To overcome this limitation, we undertook pairwise tests of significance using least-square means. However, as least-square means compares the means of terms to each other instead of the intercept, the GLMM interaction term results may differ slightly from those of the post-hoc comparisons.
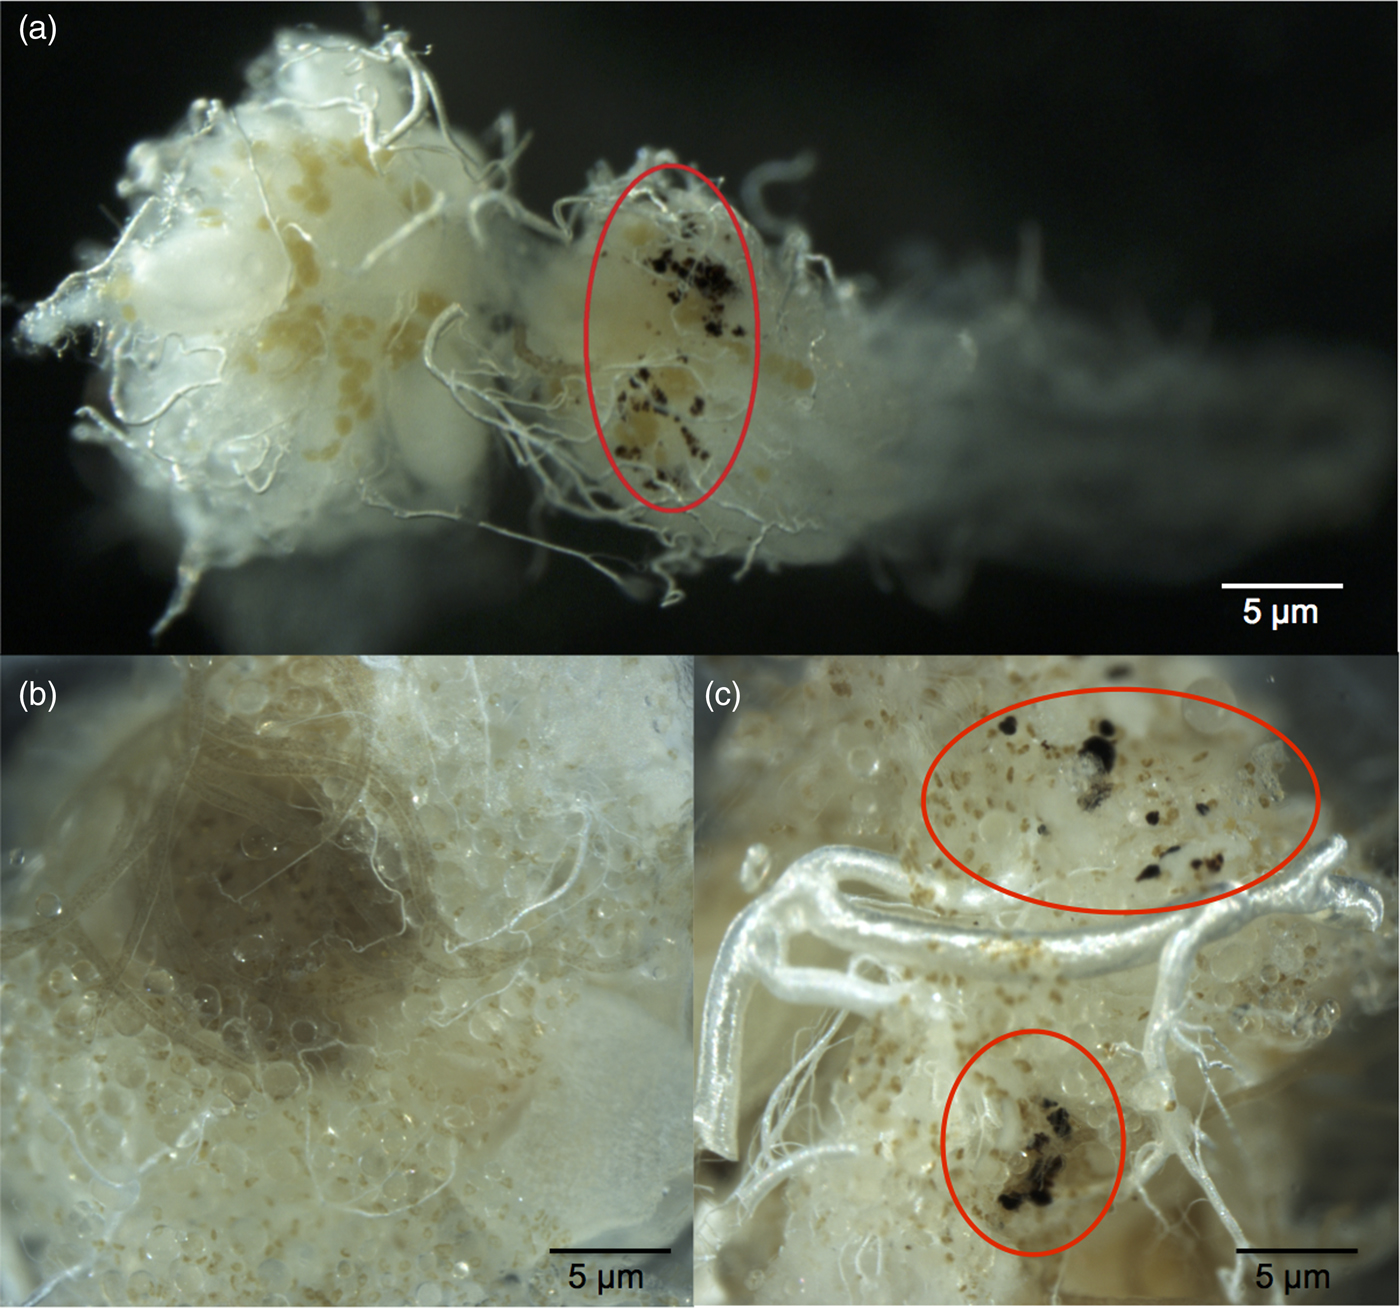
Fig. 2. (a) Ovaries from a queen with nodules. The ovary on the right contains melanized nodules (circled in red), the ovary on the left does not. (b) Fat bodies of a queen without nodules. (c) Nodules (circled in red) induced in the fat bodies of a queen by the authors, using spores of the entomopathogenic fungus, Metarhizium anisopliae. See Supplementary Material S1 for the injection process methods.
Egg laying
We hypothesized queens from high-abundance populations would have higher egg-laying rates than queens from medium- and low-abundance populations. To test this hypothesis, we experimentally compared egg-laying rates between queens from the different populations. Egg laying was quantified in February 2013 using the maximum number of queens that were found, being ten and four queens from the two low-abundance populations, and 20 from each of the high- and medium-abundance populations. The egg-laying rate was measured in queens by placing one queen and three workers in a collection jar (5.5 cm high and 4.5 cm across) containing a 1 cm thick layer of damp plaster. The jar sides were coated with Insect-A-Slip (BioQuip Products, USA) to prevent ants escaping, and the outside of the jar wrapped in white paper to provide a dark environment. Ants were maintained without food, at approximately 25 ± 2°C, and in constant darkness to simulate conditions inside the nest. Ants were placed in the jars within 3 h of collection. After 24 h, the ants were removed and eggs counted. Preliminary tests showed that worker presence was critical for egg laying to occur and that 24 h was sufficient to observe egg laying. Queens were later dissected and examined for nodules, but because few egg-laying queens had nodules (18/96), analyses were restricted to egg laying by population type (i.e., not compared between queens with and without nodules within each population type) and egg laying between queens with and without nodules pooled from each population type. The number of eggs laid by queens among the three different population types was compared used a Kruskal–Wallis H test because the data were not normally distributed. Likewise, the number of eggs laid by queens with and without nodules was compared using a Mann–Whitney U test.
Fat content
We measured queen fat content collected in February 2015 using a petroleum ether extraction following the methods of Richards & Packer (Reference Richards and Packer1994). During queen dissections (discussed above), the fat bodies were isolated from the queen, collected in water and frozen at −20°C until processing. The fat samples were then placed in a drying oven at approximately 65°C for 10 days until their weight stabilized. The samples were weighed on a Kern ABT 220-4 M analytical balance to the nearest ten-thousandth of a gram four times over 2 days. After that period, 2 ml of petroleum ether was added to each sample. Samples were left for 5 days, at which point the fat had dissolved into the petroleum ether. The remaining petroleum ether was decanted from each sample into another container to remove the dissolved fat. Samples were then placed in a drying oven at 65°C for a further 10 days. Samples were then reweighed, with the difference between the initial and final weight taken to be the amount of fat each queen possessed. A GLMM with a γ distribution and log-link function was used to test which variables affected fat content. Population, nest, queen number per nest and head width were random effects, with nest nested within population. Nodulation status, population type and their interaction term were fixed effects.
Results
Nest and queen number
A total of 284 queens were collected from 61% of the 171 nests excavated (table 1). Fifty percent of nests had fewer than four queens. Nest number varied significantly with population type (medium abundance vs. high abundance z = −3.060, P = 0.002; low abundance vs. high abundance z = −4.981, P < 0.001) with high-abundance populations having the most nests and low-abundance populations having the fewest (tables 1 and 2). Population types had significantly different queen numbers (medium abundance vs. high abundance z = −0.444, P = 0.657; low abundance vs. high abundance z = 3.077, P = 0.002; table 2), with low-abundance populations having higher numbers of queens per nest. There was a clear negative relationship between nest number and queen number, with 19% of nests that had queens in low-abundance populations had five or more queens, medium-abundance populations had 13% and high-abundance populations had only 7%. The number of Acacia was the only environmental variable with a significant, positive association with nest presence. Queen number was significantly and positively associated with canopy cover, litter cover and the number of Acacia (table 2).
Table 1. Population type, site, the percentage of dissected queens with the total number of queens dissected in brackets, total number of nests excavated and nest density per site.
1 Nest density could not be accurately calculated due to paucity of nests.
Table 2. (A) Results of a generalized mixed effect model (GLMM) testing the effect of population type, canopy cover, litter depth and cover, Acacia number and Eucalyptus number on nest presence and number of queens per nest. Random effects were site, year and transect. The least square means post hoc tests for population type are reported after the GLMM results. (B) Results of a GLMM testing the effect of population type, nodulation status (status), and their interaction on oocyte number and fat content. Random effects were site, year, nest, gaster width, head width, queen number per nest, ovariole number and longest basal oocyte.

1 β coefficient.
2 Standard error.
3 Statistical significance.
*P < 0.05; **P < 0.01; ***P < 0.001.
Potential fecundity
A total of 278 queens were dissected, of which 23% had melanized nodules (table 1). More than half the queens with nodules (34/65) were from population M2, which was a medium-abundance population (fig. 1). Oocyte number was significantly negatively associated with the presence of nodules (z = −2.585, P = 0.010) (table 2, fig. 3a). Across all populations, queens without nodules had on average 22% more oocytes in their ovaries than queens with nodules (mean ± SE: 30.73 ± 1.43; 23.97 ± 2.36). Oocyte number did not vary significantly with population type (medium abundance vs. high abundance z = 0.363, P = 0.793; low abundance vs. high abundance z = −0.262, P = 0.793; table 2), although the interaction between population types and nodulation status were significant (medium abundance × with nodules vs. high abundance × without nodules z = −2.241, P = 0.025; low abundance × with nodules vs. high abundance × without nodules z = 2.539, P = 0.011; table 2, see Supplementary Material S1 for the post-hoc comparisons for this interaction term). On average, queens without nodules from medium-abundance populations had 38% more oocytes in their ovaries than queens with nodules (mean ± SE: 32.48 ± 2.69 vs. 20.94 ± 2.85 oocytes, respectively). Queens without nodules from high-abundance populations had on average 17% more oocytes in their ovaries than queens with nodules (mean ± SE: 29.81 ± 2.05 vs. 24.73 ±3.10 oocytes, respectively), but queens without nodules from low-abundance populations had on average 17% fewer oocytes in their ovaries than queens with nodules (mean ± SE: 30.03 ± 2.80 vs. 35.13 ± 11.80 oocytes, respectively).
Fig. 3. (a) Box plot showing the median number of oocytes found in queens without nodules and queens with nodules at the three site types. Different letters above plots indicate significant differences (P < 0.05). Post-hoc tests using least-square means were done using the R package ‘lsmeans.’. (b) Boxplot showing the median number of eggs laid by queens from low-abundance (light gray), medium-abundance (dark gray) and high-abundance (black) sites in the laboratory over a 24 h period. There were no differences in number of eggs laid between the different population types. (c) Box plot showing the median weight of fat found in queens without and with nodules at the three site types. There were no differences in fat content between queens from different population types.
Egg laying
There was no difference in the number of eggs laid by queens among population types (Kruskal–Wallis H test; χ22 = 0.272, P = 0.873; fig. 3b). However, only 35% of the 96 queens laid eggs; but excluding queens that did not lay eggs from the analysis also found no difference among the population types (Kruskal–Wallis H test; χ22 = 1.005, P = 0.605). There was no difference in the number of eggs laid between queens with and without nodules (Mann–Whitney U test; U = 549.500, P = 0.246). As only 19% of queens in the egg-laying test had nodules, additional samples and analysis would be necessary to confirm the lack of statistical difference in egg-laying behavior between queen groups.
Fat content
Queens had a mean fat content of 3.55 × 10⁻³ ± 1.33 × 10⁻⁴ mg (mean ± SE). Fat content did not vary with nodulation status (z = −0.030, P = 0.978) (fig. 3c) or population type (medium abundance vs. high abundance z = 0.260, P = 0.797; low abundance vs. high abundance z = −1.18, P = 0.238), nor was there an interaction effect (table 2).
Discussion
This is the first study to find evidence that queens of the invasive ant A. gracilipes may be significantly affected by pathogens. Twenty-three percent of queens had melanized nodules in their ovaries or fat bodies, which was significantly associated with reduced oocyte number. It is unclear if the observed reduction in oocyte number was a direct effect of the invading pathogen, or a trade-off in immune response. Though a queen's immune system may have dealt effectively with the invader, such an immune function is biologically expensive and can result in physiological trade-offs, at both the individual and colony level (Rolff & Siva-Jothy, Reference Rolff and Siva-Jothy2003; Siva-Jothy et al., Reference Siva-Jothy, Moret and Rolff2005). For example, A. mellifera colonies whose members mounted a strong immune response to pathogens produced significantly fewer larvae than those that did not (Evans & Pettis, Reference Evans and Pettis2005). Mosquitos that have encapsulated micro-filarial parasites also have reduced and delayed egg laying (Ferdig et al., Reference Ferdig, Spray, Li and Christensen1993).
The production of melanized nodules (nodulation) is an innate cellular immune response in insects (Stanley et al., Reference Stanley, Haas and Miller2012). When an invading pathogen or parasite enters the hemocoel and is not phagocytized by a single hemocyte (the equivalent of white blood cells in insects), aggregations of hemocytes will surround the invader, smother and melanize it (Rolff & Siva-Jothy, Reference Rolff and Siva-Jothy2003; Stanley et al., Reference Stanley, Haas and Miller2012). The resulting nodule is attached to an organ or the inner body wall where it typically remains for the rest of the insect's life (Stanley et al., Reference Stanley, Haas and Miller2012). This response may be induced by bacteria, fungus, parasitoid eggs and, in some cases, viruses (Carton et al., Reference Carton, Frey, Stanley, Vass and Nappi2002; Mullen & Goldsworthy, Reference Mullen and Goldsworthy2006; Durmus et al., Reference Durmus, Buyukguzel, Terzi, Tunaz, Stanley and Buyukguzel2008; Gatschenberger et al., Reference Gatschenberger, Azzami, Tautz and Beier2013). It should be noted that though pathogens are the most likely cause of melanized nodules, ingestion of finely abrasive materials, such as cornstarch, may also cause them (L. Solter, personal communication). Bacteria have been the most commonly studied pathogen in relation to nodulation (Stanley et al., Reference Stanley, Haas and Miller2012; Gatschenberger et al., Reference Gatschenberger, Azzami, Tautz and Beier2013). The nodulation response by hosts to viral challenge has been mixed. Azzami et al. (Reference Azzami, Ritter, Tautz and Beier2012) found that injecting A. mellifera larvae and adults with Acute bee paralysis virus did not elicit a cellular immune response, though subjects did respond to Escherichia coli injection. However, larvae of the endoparasitoid wasp, Pimpla turionellae, produced nodules in response to an injection of the Bovine Herpes simplex virus-1 (Durmus et al., Reference Durmus, Buyukguzel, Terzi, Tunaz, Stanley and Buyukguzel2008). In addition to this work, we have unpublished laboratory tests that found no nodulation in A. gracilipes queens in response to injection of lipopolysaccharide, a major component of the outer membrane of Gram-negative bacteria, but a significant nodulation response when injected with fungal spores from Metarhizium anisopliae (see Supplementary Material S1). However PCR with universal fungal primers did not detect fungal DNA in A. gracilipes queens with a nodulation response (M. Cooling, unpublished data). We have not yet identified the cause of the nodules in this study.
There was no difference in fat content of queens between populations. It is possible that this pathogen or the observed immune response does not affect fat content in A. gracilipes queens, but there may also be a compensatory response from the ants. For example, it has been shown that the fungal pathogen Nosema ceranae can cause fat reduction in overwintering bees (Baily & Ball, Reference Baily and Ball1991), but the fat content of A. mellifera queens infected with N. ceranae have been found to not differ from uninfected queens (Alaux et al., Reference Alaux, Folschweiller, McDonnell, Beslay, Cousin, Dussaubat, Brunet and Le Conte2011). The latter study suggested that because workers feed the queen, the queen might be able to compensate for the nutritional stress of N. ceranae infection by increasing her food demand from the workers. This mechanism may also be the case in A. gracilipes queens, which are also fed by workers. Ants are known to develop fat during times of high resource abundance (Hahn, Reference Hahn2006; Lease & Wolf, Reference Lease and Wolf2011). We collected queens during February, which is the peak of the wet season, when A. gracilipes abundance, and presumably resources, is at their highest (Hoffmann, Reference Hoffmann2015). It is possible that differences in fat content may have been found among populations if queens had been collected in the dry season, when resources are scarcer and queens may be more likely to be stressed.
Surprisingly, low-abundance populations had the highest numbers of queens per nest and high-abundance populations had the lowest. This result does not support the hypothesis that queens are dying disproportionately at low- and medium-abundance populations compared with high-abundance populations. Perhaps the population must reach a critical mass before queens colonize new nests, as A. gracilipes queens require the attendance of workers to survive (Holldobler & Wilson, Reference Hölldobler and Wilson1990). The relationship between queen number and nest density in polygynous ant species is variable and appears to be due to a complex interaction between ecological and genetic factors (Herbers & Stuart, Reference Herbers and Stuart1996; Chapuisat et al., Reference Chapuisat, Bocherens and Rosset2004). For example, Ingram (Reference Ingram2002a) found Argentine ant, Linepithema humile, queen numbers increased as nest density increased. However, another study by the same author discovered that low-density populations of L. humile had more queens per nest than a high-density population Ingram (Reference Ingram2002b).
It is extremely difficult to document queen death in the field because workers dismember and dispose of dead queens immediately after death (personal observation). The replacement of dead queens by newly produced queens may also mask the depletion of queens. In Arnhem Land, however, new queens are only produced at one time of the year: at the end of the dry season around September (Hoffmann, Reference Hoffmann2015). The timing of this production means that in February, new queens should not be present to obscure functional queen numbers and we saw no evidence of this, as very few alates were observed.
Like other organisms, insects are constantly exposed to microbial pathogens and parasites, but few of these encounters result in a chronic or deleterious infection. We believe, though further work will be necessary to confirm it, we have documented an immune response in A. gracilipes queens to an unknown pathogen or parasite. While this work suggests that there may be a trade-off between immune response and oocyte production in A. gracilipes queens, we do not know if the pathogen that caused the immune response is still present in the population, or if the queens’ immune system was capable of destroying it upon its initial invasion of the hemocoel. If it is still present in the population, it is also possible that the pathogen or pathogens are asymptomatic, like some Picornavirales RNA viruses that are commonly present as low-level chronic infections in hymenopterans like S. invicta and A. mellifera (de Miranda et al., Reference de Miranda, Cordoni and Budge2010). These viruses, such as SINV-1, usually appear to have no effect on colony health, though periods of high stress, or other, unknown causes, may trigger them to enter an acute-lethal stage (Bailey, Reference Bailey1967; de Miranda et al., Reference de Miranda, Cordoni and Budge2010; Porter et al., Reference Porter, Valles and Oi2013).
Our previous work has demonstrated that A. gracilipes are infected with various pathogens (Cooling et al., Reference Cooling, Gruber, Hoffmann, Sébastien and Lester2016). Our current study provides a strong indication that pathogens are likely to affect the reproductive biology of this invasive ant. However, it remains unclear whether these possible pathogens could be responsible for the observed population declines. Nodulation rate was not associated with population type, and the two high-abundance sites had the second and third highest nodulation rates after site M2 (23 and 20% respectively). Further analyses are needed to determine the nature of the microorganisms contained in the nodules. This may open a new avenue of biological control options for A. gracilipes, providing solutions to limitations currently experienced by toxic treatments.
Supplementary material
The supplementary material for this article can be found at https://doi.org/10.1017/S0007485317000967.
Acknowledgements
The authors thank many people that provided technical assistance, especially Daryl Lacey, Paul Augustin, Leanne Dzendolet, Tony Schultz and the many people involved with Conservation Volunteers Australia. Thanks to Dhimurru Aboriginal Corporation and the traditional landowners of northeast Arnhem Land for access to the region, and the staff of Rio Tinto for access to the mining leases and accommodation. The authors also thank the Lester laboratory group for constructive comments on the manuscript. This work was funded and supported by CSIRO Australia, Rio Tinto Alcan and the Dhimurru Aboriginal Corporation. M. Cooling was supported by a Victoria University of Wellington Doctoral Scholarship.