INTRODUCTION
Concussion gives rise to a wide array of somatic, cognitive, emotional, and other symptoms that persist for weeks or longer in a small subset of athletes and a sizable percentage of non-athlete patients (McCrea et al., Reference McCrea, Guskiewicz, Marshall, Barr, Randolph, Cantu and Kelly2003; McMahon et al., Reference McMahon, Hricik, Yue, Puccio, Inoue and Lingsma2014). Symptom checklists, such as the Sport Concussion Assessment Tool 3 (SCAT3; McCrory et al., Reference McCrory, Meeuwisse, Aubry, Cantu, Dvorak, Echemendia and Turner2013) and the more recent SCAT5 (McCrory et al., Reference McCrory, Meeuwisse, Dvorak, Aubry, Bailes, Broglio and Vos2017), are widely used in clinical settings to identify injury sequelae and have been proposed to be useful for detecting differences between patients in injury characteristics.Footnote 1 In particular, several studies conducted in athlete and non-athlete settings have suggested that there are separable dimensions of concussion symptoms (e.g., cognitive, somatic, emotional; Ayr, Yeates, Taylor, & Browne, Reference Ayr, Yeates, Taylor and Browne2009; Joyce, Labella, Carl, Lai, & Zelko, Reference Joyce, Labella, Carl, Lai and Zelko2015; Kontos et al., Reference Kontos, Elbin, Schatz, Covassin, Henry, Pardini and Collins2012; Merritt & Arnett, Reference Merritt and Arnett2014; Meterko et al., Reference Meterko, Baker, Stolzmann, Hendricks, Cicerone and Lew2012; Piland, Motl, Ferrara, & Peterson, Reference Piland, Motl, Ferrara and Peterson2003; Potter, Leigh, Wade, & Fleminger, Reference Potter, Leigh, Wade and Fleminger2006; Sady, Vaughan, & Gioia, Reference Sady, Vaughan and Gioia2014; Vanderploeg et al., Reference Vanderploeg, Silva, Soble, Curtiss, Belanger, Donnell and Scott2015; Waljas et al., Reference Waljas, Iverson, Hartikainen, Liimatainen, Dastidar, Soimakallio and Ohman2012) and that attending to these distinct facets of clinical presentation may reveal ways to tailor clinical management approaches to individual athletes (Collins, Kontos, Reynolds, Murawski, & Fu, Reference Collins, Kontos, Reynolds, Murawski and Fu2014). Identifying distinct clinical phenotypes of concussion could lead to more precision medicine approaches to managing concussed patients. However, finding that multiple distinct constructs underlie concussion symptoms would call into question the validity of the widespread practice of summing symptom ratings into a single total score. Thus, evaluating the degree to which concussion symptoms are unidimensional or multidimensional is important both to validate how concussion symptom checklists are currently used and to inform the question of whether clinical management practices should shift toward more individualized approaches.
Although numerous studies have suggested the presence of distinct dimensions underlying concussion symptom reporting, there is reason to believe that the degree to which the dimensions identified are truly distinct has been overstated. For example, studies using latent trait models (typically lower- or higher-order factor models) and simpler data reduction strategies (principal component analysis [PCA]) with concussion symptom checklists have yielded models with marginal fit (Ayr et al., Reference Ayr, Yeates, Taylor and Browne2009; Joyce et al., Reference Joyce, Labella, Carl, Lai and Zelko2015; Meterko et al., Reference Meterko, Baker, Stolzmann, Hendricks, Cicerone and Lew2012), significant cross-loadings of items on different factors (Merritt & Arnett, Reference Merritt and Arnett2014), a dominant first factor (Joyce et al., Reference Joyce, Labella, Carl, Lai and Zelko2015; Kontos et al., Reference Kontos, Elbin, Schatz, Covassin, Henry, Pardini and Collins2012; Waljas et al., Reference Waljas, Iverson, Hartikainen, Liimatainen, Dastidar, Soimakallio and Ohman2012), and highly correlated factors (Joyce et al., Reference Joyce, Labella, Carl, Lai and Zelko2015; Piland et al., Reference Piland, Motl, Ferrara and Peterson2003; Potter et al., Reference Potter, Leigh, Wade and Fleminger2006; Sady et al., Reference Sady, Vaughan and Gioia2014; Vanderploeg et al., Reference Vanderploeg, Silva, Soble, Curtiss, Belanger, Donnell and Scott2015). Furthermore, few studies have presented data to validate the factor structures identified, although the high inter-factor correlations suggest limited potential for purportedly distinct factors to demonstrate discriminant validity (e.g., Franke, Czarnota, Ketchum, & Walker, Reference Franke, Czarnota, Ketchum and Walker2015). Taken together, these findings could indicate that concussion symptoms are essentially unidimensional, with some multidimensional features, and that alternative modeling approaches might better represent their underlying structure.
One alternative conceptualization of the structure of concussion symptoms that may better account for the evidence of both a dominant over-arching factor and multi-faceted subdimensions is a bifactor modeling approach. Figure 1 depicts a more traditional higher-order model in comparison to a bifactor model. These models account for covariance among item responses in different ways. In a higher-order model, item covariance is represented by an over-arching second-order factor (or factors) accounting for covariance between lower-order factors, with lower-order factors further parsed into responses to the items that load on these factors.

Fig. 1 (A) Higher-order factor model represented by lower-order factors (F1, F2) on which each item loads and a higher-order factor (GEN) representing a broader construct encompassed by the two correlated lower-order factors. (B) Bifactor model in which all items load on a single general factor (GEN), with two additional specific factors (S1, S2) that account for the residual covariance among items after extraction of the general factor.
In a bifactor model, each item is saturated by a general factor, meaning that a broad general factor directly influences scores on each item, and the residual variance unaccounted for by the general factor evinces structure such that certain items make up specific factors representing correlated residuals among these items. The general factor and specific factors of the bifactor model are parameterized to be independent from one another, whereas correlations between lower-order factors of the higher-order model are accounted for by higher- or second-order factors.
Distinctions in interpretation of these models have implications for understanding the structure of concussion symptoms and for their clinical assessment. For example, the covariance accounted for by factors in a higher-order model between lower-order factors and their constituent items indicates that an individual scoring highly on the higher-order factor (or factors) would likely score highly on the lower-order factors loading on that dimension as well, which would also have bearing on other factors of the model (because they are allowed to correlate). In contrast, the independence of the general and specific factors of the bifactor model indicates that an individual’s standing on the latent general factor has no bearing on their endorsement of symptoms marking subfactors of the model. In other words, a person with a low total score may actually score highly on one or another subfactor, and this endorsement pattern would be masked by relying solely on the general factor or total score. In the context of self-report symptom scales, the specific factors are often referred to as “method” factors, and these factors may represent constructs of limited substantive value (e.g., as tends to be the case for items that are similarly worded) or in some cases represent clinically relevant constructs in their own right (such as acquiescence or other forms of response bias; Campbell & Fiske, Reference Campbell and Fiske1959).
Bifactor models have become popular in psychiatric and medical research (Chen, Hayes, Carver, Laurenceau, & Zhang, Reference Chen, Hayes, Carver, Laurenceau and Zhang2012; Ebesutani et al., Reference Ebesutani, Smith, Bernstein, Chorpita, Higa-McMillan and Nakamura2011; Gignac & Watkins, Reference Gignac and Watkins2013; Patrick, Hicks, Nichol, & Krueger, Reference Patrick, Hicks, Nichol and Krueger2007; Thomas, Reference Thomas2012) due to the practical and theoretical advantages of modeling broad traits of interest in these research domains (Reise, Reference Reise2012; Reise, Morizot, & Hays, Reference Reise, Morizot and Hays2007; Thomas, Reference Thomas2012). For example, the Brief Symptom Inventory (BSI; Derogatis, Reference Derogatis1993), a self-report measure of internalizing symptoms most commonly conceptualized as measuring correlated lower-order factors of depression, anxiety, and somatization, has been modeled in a bifactor framework. In particular, Thomas (Reference Thomas2012) argued that the lack of consistent fit of the higher-order model across studies and high between-factor correlations suggests that the BSI predominantly captures a single underlying dimension of internalizing symptoms/emotional distress. Modeling the BSI with a bifactor model formally acknowledges that a large general factor influences item responding and also yields domain-specific factors. That bifactor model factors better predict many DSM-IV-TR diagnoses as compared to those of the corresponding higher-order model suggests that the bifactor model may have value as an alternative way to conceptualize and measure aspects of BSI symptomatology (Thomas, Reference Thomas2012).
An example of another clinical construct for which bifactor modeling has proven valuable is psychopathy. Originally conceptualized as a unitary condition reflecting the presence of affective-interpersonal features (e.g., grandiosity, deceitfulness, shallow affect, superficial charm) coupled with impulsive-antisocial proclivities, this unitary concept has been difficult to reconcile with findings of highly distinct patterns of association for these two symptom components of psychopathy with other personality and behavioral measures. Bifactor modeling proved valuable in this case for separating out distinct trait-like subdimensions from general antisocial behavior (Patrick et al., Reference Patrick, Hicks, Nichol and Krueger2007). This modeling work paved the way for a new model of psychopathy (Patrick, Fowles, & Krueger, Reference Patrick, Fowles and Krueger2009) that conceptualizes this condition in terms of core dispositions termed boldness (reflecting fearlessness), meanness (reflecting callous-unemotionality), and disinhibition (reflecting proneness to impulse control problems), with the former two constructs representing psychopathy-specific dimensions, and the latter a more general externalizing psychopathology dimension (Nelson & Foell, Reference Nelson and Foell2018).
Our objective was to investigate the factor structure of the SCAT3 symptom checklist to inform its clinical use and advance efforts to empirically derive distinct clinical phenotypes of concussion. We aggregated data from two recent prospective longitudinal studies of sport-related concussion in high school and collegiate athletes who were assessed in the acute (<48 hr) post-injury period, from which we derived and compared a range of plausible structural models (lower-order, higher-order, bifactor) to determine the best model and establish to what extent the SCAT3 captures a unidimensional versus multidimensional construct. This acute postinjury timepoint was the focus of this study given the rapid typical course of recovery from sport-related concussion and our goal to characterize the structure of concussion symptoms.
With the luxury of concussed patients who completed extensive clinical assessments before and after injury, we also evaluated relations between SCAT3 factors identified and various clinical assessment measures to provide preliminary validation of the models derived. We hypothesized that, in comparison to a higher-order factor model, a bifactor model would provide the best fit to the SCAT3 item set while also yielding factors with more distinctive relationships with other patient and injury variables. We predicted that the bifactor model would fit best based on (a) the evidence, reviewed above, that concussion symptoms appear to predominantly reflect a strong general factor and (b) the fact that, for measurement reasons, bifactor models tend to be favored over higher-order models (Cucina & Byle, Reference Cucina and Byle2017; Mansolf & Reise, Reference Mansolf and Reise2017). For this latter reason, we present results for both the bifactor model and a counterpart higher-order model, to be able to evaluate the two models in other ways apart from comparative fit.
METHODS
Participants
The sample consisted of participants from two prospective longitudinal studies of sport-related concussion: Project Head to Head 1 and 2. Project Head to Head 1 (2012–2014) recruited 2148 high school and collegiate contact sports athletes at preseason, of which 166 were followed serially after concussions (Nelson, LaRoche, et al., Reference Nelson, LaRoche, Pfaller, Lerner, Hammeke, Randolph and McCrea2016; Nelson, Tarima, et al., Reference Nelson, Tarima, LaRoche, Hammeke, Barr, Guskiewicz and McCrea2016). Project Head to Head 2 (2015–present) is recruiting high school and collegiate football players; current analyses used data for 912 athletes (69 of whom had incurred concussions) enrolled at the time this analytic work was undertaken.
Datasets for these two samples were aggregated and trimmed of repeat cases, yielding N=219 concussed individuals for current analyses. Both studies were approved by the Medical College of Wisconsin’s institutional review board, and participants in each provided informed consent (or assent if under 18 years of age) before participation. Sample, injury, and recovery characteristics are listed in Table 1.
Table 1 Sample demographics and injury characteristics (N=219)

Note. Within the football cohort, participants were distributed by position as follows: 25% offensive line, 23% defensive line, 13% linebacker, 13% wide receiver, 12% defensive back, 8% running back, 6% quarterback, and 1% kicker. The 36 soccer players were distributed by position as follows: 31% midfield, 28% defense, 25% forward, and 17% goalkeeper. ADHD=attention deficit hyperactivity disorder.
Concussion Definition and Characteristics
Both studies from which data were aggregated for this project used the same definition of concussion and common inclusion/exclusion criteria. In particular, concussion was defined based on that of the study sponsor (the U.S. Department of Defense): “an injury to the brain resulting from an external force and/or acceleration/deceleration mechanism from an event such as a blast, fall, direct impact, or motor vehicle accident which causes an alteration in mental status typically resulting in the temporally related onset of symptoms such as headache, nausea, vomiting, dizziness/balance problems, fatigue, insomnia/sleep disturbances, drowsiness, sensitivity to light/noise, blurred vision, difficulty remembering, and/or difficulty concentrating” (Helmick et al., Reference Helmick, Guskiewicz, Barth, Cantu, Kelly, McDonald and Warden2006).
Diagnoses were made by athletic trainers at participating schools and confirmed by the research staff at the acute (24–48 hr post-injury) assessment. Only four participants underwent clinical brain imaging following their injuries (all head CTs), and none indicated the presence of any acute intracranial abnormalities. The acute injury characteristics were distributed as follows: 5.5% loss of consciousness, 11.5% posttraumatic amnesia, and 7.4% retrograde amnesia. Duration of unconsciousness, when present, was M=29 s (SD=36; range 2 s to 2 min). Duration of posttraumatic amnesia, when present, was M=46 min (SD=97 min; range 1 min to 7 hr).
Baseline and Post-Injury Test Battery
Athletes in both studies completed pre-season baseline examinations and post-injury clinical assessments at 24–48 hr and 8, 15, and 45 days post-injury. The baseline assessments for each included demographic and health history questionnaires and the Wechsler Test of Adult Reading (Wechsler, Reference Wechsler2001). Pre- and post-injury assessments also included a neuropsychological assessment battery including the Sport Concussion Assessment Tool 3 (SCAT3) symptom checklist (McCrory et al., Reference McCrory, Meeuwisse, Aubry, Cantu, Dvorak, Echemendia and Turner2013), the Standardized Assessment of Concussion (McCrea et al., Reference McCrea, Kelly, Randolph, Kluge, Bartolic, Finn and Baxter1998), the Balance Error Scoring System (Guskiewicz, Ross, & Marshall, Reference Guskiewicz, Ross and Marshall2001), and the Brief Symptom Inventory – 18 (BSI-18; Derogatis, Reference Derogatis2001).
Additional assessment measures were available for a subset of the combined sample: 168 (78%) athletes completed a computerized neurocognitive test battery, the Immediate Postconcussion and Cognitive Testing (ImPACT, online version; ImPACT Applications Inc.), at each assessment; 24 (11%) took the King-Devick Test (Galetta et al., Reference Galetta, Brandes, Maki, Dziemianowicz, Laudano, Allen and Balcer2011); and 66 (30%) took additional self-report measures of personality and emotional functioning (the latter two types of measures were only in the second study protocol). Relevant to the current study, measures of the latter type included a brief (29-item) version of the Multidimensional Personality Questionnaire (which provides estimates of trait negative [NEM] and positive emotionality [PEM]; Patrick, Curtin, & Tellegen, Reference Patrick, Curtin and Tellegen2002) and the following somatic and cognitive symptom subscales of the adult and adolescent Restructured Forms of the Minnesota Multiphasic Personality Inventory (i.e., MMPI-2-RF and MMPI-2-A): Somatic Complaints (RC1), Malaise, Gastrointestinal Complaints, Head Pain Complaints, Neurologic Complaints, and Cognitive Complaints (Archer, Handel, Ben-Porath, & Tellegen, Reference Archer, Handel, Ben-Porath and Tellegen2014; Ben-Porath & Tellegen, Reference Ben-Porath and Tellegen2008). Participants who were at least 18 years old at the preseason assessment (78% of the Project Head to Head 2 sample) completed the MMPI-2-RF; those below age 18 completed the MMPI-2-A. The numbers of items shared between counterpart scales of the two test forms are: 19/30 RC1, 8/8 Malaise, 4/5 Gastrointestinal Complaints, 4/6 Head Pain Complaints, 7/10 Neurologic Complaints, 4/11 Cognitive Complaints. Test manual norms were used to convert raw scores to uniform T scores before aggregating scores across the two test forms for analysis.
Statistical Analysis
Our primary goal was to investigate the factor structure of the 22-item SCAT3 symptom checklist, focusing on the acute (24–48 hr post-injury) time point given that this is when symptom severity (and thus variance in reported symptomatology, and potential covariance among differing symptoms) is generally the highest. First, we reviewed item-level descriptive statistics (Table 2) and inter-item correlations (see online Supplementary Table). The Kaiser-Meyer-Olkin coefficient and Bartlett’s test, computed in IBM SPSS Statistics for Windows (Version 24), were used to test for sampling adequacy and sphericity, respectively.
Table 2 SCAT3 item-level descriptive statistics (24–48 hours post-injury)

Note. “Endorsement” was operationalized as any non-zero rating (i.e., rating of 1–6).
All factor analyses were conducted in Mplus (7th edition; Muthén & Muthén, Reference Muthén and Muthén1998–2015) using WLSMV estimation (given the ordinal nature of the items). Geomin rotation, an oblique rotation method, was used in factor analyses that allowed factors to be correlated. First, we conducted exploratory factor analyses (EFA) and exploratory bifactor analyses (bi-EFA) to inform the specification of confirmatory factor analytic (CFA) models. Inspection of the eigenvalues and the scree plot from an initial EFA indicated the presence of a dominant first factor (eigenvalues one–five were 11.79, 1.62, 1.14, .92, and .79, respectively), with a subtle break evident in the scree plot between the second and third eigenvalues.
Given prior work suggesting the presence of more than two factors (often three–four) underlying responses on similar symptom checklists, we explored a range of factor solutions (one–five lower-order factors for higher-order models; one–five specific factors for bifactor EFA models) and used a combination of model fit, factor interpretability, and factor external correlates to select the optimal model(s).
Next, CFAs were run for higher-order and bifactor models configured according to results from the exploratory analyses. A four-factor higher-order model was not included at this stage, as the four-factor EFA included a factor on which all items loaded more strongly on other factors. For the higher-order models (involving one, two, three, or five factors), each item was specified as loading on the factor on which it loaded most highly in the corresponding EFA. In all five higher-order EFA models, all items but four loaded at least .4 on a factor, with loadings above .29 for the remaining four. For bifactor models, all items were parameterized to load on the general factor, with items parameterized to load as well on a specific factor if they loaded at least .30 on that factor in the bi-EFA. A small number of items that met this criterion were ultimately dropped from the final CFA models, given that they were not conceptually related to other items associated with the specific factor, and did not improve model fit or load significantly on the specific factor at the CFA stage.
Model-based reliability measures of omega, omega hierarchical (omegaH), and relative omega (omega/omegaH) were computed for the best-fitting (five-factor bifactor) model, with a particular focus on omegaH (and relative omega) as an estimate of the proportion of observed variance (or proportion of reliable variance, in the case of relative omega) in total and subscale scores that could be attributed to the underlying general and specific factors (Rodriguez, Reise, & Haviland, Reference Rodriguez, Reise and Haviland2016). Finally, regression-based factor scores for models of major interest (i.e., five-factor higher-order factor model and five-factor bifactor model) were computed for use in analyses examining associations of model factors with a range of clinical criterion measures available from the pre- and post-injury assessments.
RESULTS
Item-Level Descriptive Analyses
Item-level descriptive statistics are presented in Table 2, while inter-item correlations are in the Supplementary Table. Across all items, endorsement frequencies (i.e., instances of a non-zero rating) ranged from 21.8% (sadness) to 83.6% (headache), with item medians ranging from zero to two. Correlations between items (rho coefficients) ranged from .08 to .78, and all items correlated at least .29 with one or more items. Values of the Kaiser-Meyer-Olkin coefficient (.92) and Bartlett’s test of sphericity (χ2[231]=2995.09; p<.001) were clearly acceptable and suggestive of sufficient shared variance among items to conduct factor analyses.
Confirmatory Factor Analyses
Higher-order models
All CFA model fit statistics are presented in Table 3. The two-factor model separated items with emotional content (emotional, irritability, sadness, nervousness/anxiousness) from all other items, with a correlation between factors of r=.67. This emotional factor remained robust in solutions with more factors, whereas other concussion symptoms were split up to varying degrees across factors in other models. Beyond the clear emotional factor, other factors were often difficult to interpret and were very highly correlated (r =.76–.91).
Table 3 CFA model fit statistics

Note. CFI=comparative fit index; G=general factor; S=specific factor; RMSEA=root mean square error of approximation; TLI=Tucker-Lewis index. All χ2 p-values were<.001. k=number of free parameters.
Model fit improved with extraction of more factors (e.g., comparative fit index [CFI] values for the one-, two-, three-, and five-factor higher-order solutions were .939, .967, .975, and .981, respectively). The high factor inter-correlations suggested that a higher-order factor explaining the covariance among items might fit well, or that the measure might be better represented by a bifactor model. For the five-factor model, we explicitly modeled a higher-order factor as accounting for the covariance among the five lower-order factors, which improved model fit by a nominal amount (CFI went from .981–.982).
Bifactor models
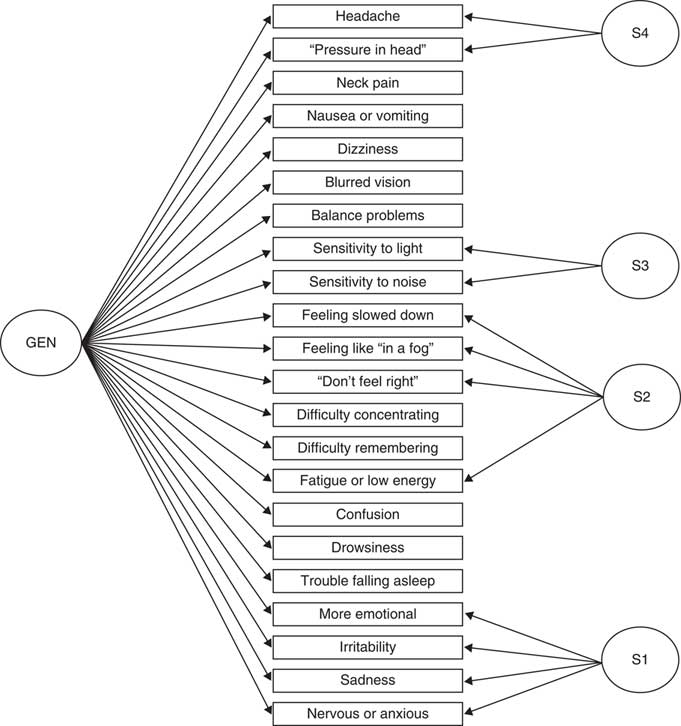
Fit statistics for the bifactor CFA model are shown in Table 3. Loadings for the two- and five-factor models appear in Table 4. All solutions contained a specific factor (S1) reflecting covariance among the residuals for the four emotional-content items. Additional specific factors (S2, S3, S4) reflected torpor (feeling slowed down, feeling as if in a “fog,” don’t feel right, fatigue; four items), sensory sensitivity (i.e., to light and noise; two items), and headache/pressure in head (two items). The five-factor bifactor model (depicted in Figure 2) fit best among the bifactor solutions and exhibited modest improvement over the best-fitting higher-order model (CFI=.989 vs. .982 for the five-factor higher-order model). The six-factor bifactor model split the four-item torpor specific factor into two factors, which slightly attenuated model fit (CFI=.987). In each of these bifactor models, all 22 SCAT3 items loaded substantially on the general factor (GEN; ~.5 or higher; see Table 4), providing evidence for considerable unidimensionality to the scale.

Fig. 2 Structure of the best-fitting bifactor model of acute concussion symptoms, derived from Sport Concussion Assessment Tool 3 (SCAT3) symptom ratings at 24-48 hr postconcussion.
Table 4 Loadings for selected higher-order and bifactor CFA models

Note. F=factor within a higher-order model; S=specific factor within a bifactor model. In the two-factor higher-order model, r=.67 between factors. In the five-factor higher-order model, r=.55–.67 between F1 and the other factors, while correlations between F2–F5 ranged from r=.78–.91. The loadings of F1–F5 on a higher-order general factor were .83, .95, .85, .95, and .69, respectively. Factors in the bifactor model are uncorrelated by design.
Values of omega for GEN, S1 (emotional), S2 (torpor), S3 (sensory sensitivities), and S4 (headache) were .97, .89, .94, .87, and .83, respectively. OmegaH for the factors was .94, .45, .12, .33, .28, respectively, and values of relative omega were .96, .51, .13, .38, .33. The very high relative omega value for the general factor suggests that most (96%) of the reliable variance in the SCAT3 can be attributed to this factor and that the correlation between the general factor and observed SCAT3 symptom severity scores is nearly perfect (sqrt[omegaH]=.97) (Rodriguez et al., Reference Rodriguez, Reise and Haviland2016).
External Correlates of Factors
To examine the potential clinical value of the CFA models specified by our analyses, we computed correlations between factor scores for the best-fitting (five-factor) higher-order and bifactor models and available clinical criterion measures; these correlations are shown in Table 5. Of note, although the five-factor higher-order and bifactor models evidenced the best fit, a concern with each of these models is the possibility of over-extraction of factors. To address this issue, we specified alternative two-factor versions of the higher-order and bifactor models. The factors that were shared across two- and five-factor higher-order models were very highly correlated across model types (rs>.99 in each case), and, therefore, we present data on the external correlates for only the five-factor models.
Table 5 External correlates of factors from the best-fitting higher-order and bifactor models

Note. Bold where p<.05. The sample size with available King-Devick Test data was small (n=16 for pre-injury and n=14 for post-injury measures). 24–48-hour assessment variables=baseline difference scores. BESS=Balance Error Scoring System; BSI-18=Brief Symptom Inventory 18-item; COG=Cognitive Complaints scale; GIC=Gastrointestinal Complaints scale; GSI=Global Severity Index; HPC=Head Pain Complaints scale; ImPACT=Immediate Postconcussion and Cognitive Testing; MMPI-2-RF=Minnesota Multiphasic Personality Inventory-2-Restructured Form; MPQ=Multidimensional Personality Questionnaire; NEM=negative emotionality; NUC=Neurologic Complaints scale; PEM=positive emotionality; RC1=RC1 Somatic Complaints scale; RT=Reaction Time composite; SAC=Standardized Assessment of Concussion; VERM=Verbal Memory composite; VISM=Visual Memory composite; VMS=Visual Motor Speed composite
As could be expected from the high correlations among factors in the higher-order model, there was substantial overlap in the clinical correlates of the five factors from this model. In contrast, the bifactor model provided higher specificity, with scores on the general factor correlating robustly with self-report (somatic symptoms, distress) and performance-based (cognitive, balance) clinical criterion measures assessed at the same acute post-injury time point. The implication is that the general factor best captured the acute clinical effects of concussion, consistent with the intended purpose of this inventory as a whole. However, this factor also correlated positively with pre-injury ratings of somatic symptoms and general distress (as assessed by the BSI-18), as well as with time to complete the King-Devick Test of oculomotor functioning at baseline.
In contrast, the headache specific factor (S4) correlated in a selective manner with acute post-injury neurocognitive impairment as indexed by ImPACT, and showed a single significant correlation with one self-report measure (baseline MMPI-2-RF Malaise). The emotional specific factor (S1) correlated most strongly with ratings of pre-injury emotional distress (BSI-18 anxiety/depression), and the torpor specific factor (S2) correlated to a modest degree with pre-injury ratings of agentic PEM. The sensory sensitivity specific factor (S3) was relatively uncorrelated with these clinical criterion measures.
DISCUSSION
The current work provides a novel approach to representing the structure of concussion symptoms. In contrast to prior investigations using only conventional EFA, CFA, or PCA approaches in conceptualizing the structure of concussion, we present evidence that a bifactor modeling approach could accommodate findings of both a dominant general factor and multidimensionality underlying this measure. In particular, we demonstrated that the vast majority of variance in concussion symptom reporting is accounted for by a single general factor that appears to influence ratings on all 22 items of the SCAT3 checklist. This finding, alongside the strong fit of a bifactor model, suggests that the SCAT3 is essentially unidimensional and, accordingly, that it is appropriate for clinician users of the scale to continue to use total scores when a single index of overall concussion symptom severity is desired.
On the other hand, we also found that representing the underlying structure of SCAT3 symptoms through a single factor is insufficient, as there is substantial covariation in symptom reporting not accounted for by a single factor alone. The bifactor model presented suggests that there are additional constructs beyond the general factor that influence concussion symptom reporting. Additional investigation is needed to clarify the clinical and research utility of these specific factors. Given consistency across the iterations, these findings also apply to the newer SCAT5.
Additional research is needed to understand the constructs represented by the specific factors identified in our best-fitting bifactor model. Given the similarities in the content of items comprising the sensory sensitivity and headache (S3 and S4) factors, one might wonder if these two factors in particular simply reflect non-substantive “method” factors. If this proves to be the case, redundant items could be merged or eliminated to achieve a more abbreviated and empirically informed self-report measure of the general factor that underlies concussion symptoms. Work to investigate this question should be informed by modern test theory (item response theory) to ensure the retention of items that precisely measure concussion symptom severity across the continuum.
In addition, reliability estimates for the specific factors (especially S2–S4) were rather low, which might call into question their utility. Nonetheless, specific factors did manifest significant relationships with various criterion measures, such as injury-related neurocognitive impairment (S4) and pre-injury emotional distress (S1), suggesting that they could represent meaningful and distinct constructs. The finding that the emotional specific factor loaded preferentially on pre-injury distress suggests that the bifactor model may provide a useful way to explicitly measure dispositional factors that affect concussion symptom reporting from post-injury data (a challenge in the civilian TBI literature where pre-injury baseline assessments are not readily obtained). Future research should explicate the constructs underlying these specific factors and determine if they can be more reliably measured with adjustments to the model or inclusion of additional items or variables within the model.
We also demonstrated that SCAT3 symptom ratings can alternatively be represented through a (more traditional) multidimensional higher-order model, which some readers may have theoretical reasons for favoring over a bifactor model. Our findings illustrate, however, that when distinct dimensions of the SCAT3 are represented by a higher-order model, their correlations are so high that the practical value of parsing them apart is questionable. In particular, we demonstrated that factors within the higher-order model have limited discriminant validity. The high correlation of factors in this model, consistent with other work (Joyce et al., Reference Joyce, Labella, Carl, Lai and Zelko2015; Potter et al., Reference Potter, Leigh, Wade and Fleminger2006; Sady et al., Reference Sady, Vaughan and Gioia2014; Vanderploeg et al., Reference Vanderploeg, Silva, Soble, Curtiss, Belanger, Donnell and Scott2015), suggests that researchers should avoid statistically forcing lower-order factors to be uncorrelated (i.e., through orthogonal rotation), as it parses symptoms that are highly coherent and thus properly represented by correlated dimensions (as in the higher-order model of our study) or a broad common factor (as in the bifactor model we presented). In contrast to a bifactor model, these types of models may mask the importance/dominance of a single, broad dimension accounting for large proportions of variance in the domain. Irrespective of identification of a best-fitting model, ultimately, the true test of a model’s utility lies in demonstrating that it advances scientific understanding or informs clinical practice.
Given that SCAT3 symptoms were assessed in the acute postconcussive period in our study sample and correlated robustly with other subjective and objective markers of injury, one might draw the obvious conclusion that the general factor specified in the bifactor model represents concussion symptoms. With this in mind, it is interesting that the general factor also correlated robustly with several pre-injury clinical variables, including pre-injury baseline somatic and distress symptoms. This finding is consistent with a wealth of evidence indicating a direct link between pre-injury emotional functioning and response to concussion which in turn points to the need for more investigation into the mechanisms by which pre-injury risk and resilience factors influence patients’ responses to injury and courses of recovery (Broshek, De Marco, & Freeman, Reference Broshek, De Marco and Freeman2015; Nelson, Tarima, et al., Reference Nelson, Tarima, LaRoche, Hammeke, Barr, Guskiewicz and McCrea2016; Root et al., Reference Root, Zuckerbraun, Wang, Winger, Brent, Kontos and Hickey2016).
Some limitations of the current study are important to acknowledge. One is that the sample size, although large for a prospective study of acute concussion, was modest for a factor analytic study. A second limitation is that, given the sample size, we did not evaluate the applicability of models specified in the current work to other post-injury time points or test for their emergence in subgroups posited to vary in symptom reporting and recovery (e.g., differing age or gender groups; Dick, Reference Dick2009; Field, Collins, Lovell, & Maroon, Reference Field, Collins, Lovell and Maroon2003). Ongoing multicenter studies of sport-related concussion (Broglio et al., Reference Broglio, McCrea, McAllister, Harezlak, Katz and Hack2017) will provide opportunities to cross-validate findings from the current study in larger samples and to extend them to different stages of recovery and patient groups. Consideration of alternative quantitative modeling approaches would also be worthwhile, such as those designed to identify subgroups of patients with qualitatively distinct patterns of symptom presentation (Muthen & Asparouhov, Reference Muthen and Asparouhov2006). Additionally, consideration of a larger item pool beyond those of the SCAT3 would be useful to enable identification of factors for which there were too few items in this scale alone. Finally, some questionnaire measures used as criterion measures in this study (e.g., scales from the MMPI-2-RF) were administered in isolation rather than as part of the entire measure as they were originally validated. This could diminish the validity of these scales and, by extension, the interpretability of correlations between these measures and the SCAT3 factors.
CONCLUSION
The current study provides evidence that the symptom checklist on the SCAT3 (and its more recent iteration, the SCAT5) captures an essentially unidimensional construct related to concussion symptom reporting, suggesting that current practices to sum SCAT3/5 items into a single severity score are appropriate. We also presented preliminary evidence that a bifactor model provides a useful way to identify distinct dimensions that contribute to SCAT3/5 symptoms, although additional research is needed to establish the clinical utility of the specific factors identified and to refine their measurement.
Future work examining the stability of this model across different post-injury time points and patient groups will be useful for validating the structure and psychometric properties of the SCAT3/5 for a range of clinical applications. Additional studies comparing a broader range of structural models and incorporating clinical and neurobiological variables into these models may reveal distinct phenotypes of concussion with relevance to clinical management decisions and translational research.
ACKNOWLEDGMENTS
We thank Jana Ranson, PhD, for her involvement in discussions about these data. We thank the University of Minnesota Press for permissions to reproduce select MMPI-2-RF and MMPI-2-A subscales for use in the study. This secondary data analysis project was funded by National Institutes of Health (NIH) grant 1R03NS100691-01. The studies from which data were obtained for the project were funded by U.S. Army Medical Research and Materiel Command (Department of Defense) under award numbers W81XWH-12-1-0004 and W81XWH-14-1-0561. Study data were collected and managed using REDCap (Harris et al., Reference Harris, Taylor, Thielke, Payne, Gonzalez and Conde2009) electronic data capture tools hosted at the Medical College of Wisconsin’s Clinical and Translational Science Institute, supported by NIH grant 1UL1-RR031973 (-01). The manuscript’s contents are solely the responsibility of the authors and do not necessarily represent the official views of the NIH and are not necessarily endorsed by the U.S. Army. The authors have no conflicts of interest to disclose.
Supplementary material
To view supplementary material for this article, please visit https://doi.org/10.1017/S1355617718000462