


Enzymatic hydrolysis of proteins is an important process in the food industry that improves the functional properties of proteins, reduces potential allergenicity and releases peptides displaying a number of biological activities (Tavano, Reference Tavano2013). Food protein hydrolysates present improved properties such as solubility, emulsifying capacity, foaming ability, water- or oil-holding capacities, related to crude proteins (Muro Urista et al. Reference Muro Urista, Álvarez Fernández, Riera Rodriguez, Arana Cuenca and Téllez Jurado2011; García-Moreno et al. Reference García-Moreno, Pérez-Gálvez, Espejo-Carpio, Ruiz-Quesada, Pérez-Morilla, Martínez-Agustín, Guadix and Guadix2016). Moreover, these can be incorporated into nutraceutical formulations where they exert certain biological reactions, including antimicrobial, antioxidant and antihypertensive activities (Capriotti et al. Reference Capriotti, Cavaliere, Piovesana, Samperi and Laganà2016). Among a wide range of substrates, cow milk protein hydrolysates have been the subject of extensive research, while goat milk protein hydrolysates have only recently been shown to exhibit functional and bioactive properties (Bernacka, Reference Bernacka2011; El-Salam & El-Shibiny, Reference El-Salam and El-Shibiny2013). Serine endopeptidases, such as subtilisin and trypsin, are usually employed in the hydrolysis of food proteins. Particularly, while subtilisin is able to attack a wide range of peptide bonds, trypsin preferentially cleaves at arginine and lysine residues. Both enzymes have been used for producing peptides displaying biological activities such as antioxidant (Pihlanto, Reference Pihlanto2006), antihypertensive (López-Fandiño et al. Reference López-Fandiño, Otte and van Camp2006) or antimicrobial (Gobbetti et al. Reference Gobbetti, Minervini and Rizzello2004). Moreover, these enzymes yield protein hydrolysates with improved technological properties such as solubility, emulsifying and foaming capacity (Van der Ven et al. Reference Van der Ven, Gruppen, De Bont and Voragen2001; Severin & Xia, Reference Severin and Xia2006).
Many functional and biological properties of protein hydrolysates are related to their degree of hydrolysis (DH). For example, emulsifying and foaming capacities present a maximum at a specific degree of hydrolysis and, if this is exceeded, these properties are reduced (de Castro et al. Reference de Castro, Bagagli and Sato2015). An extensive DH exerts a positive effect on antihypertensive activity because most of the active peptides have chain lengths shorter than 12 amino acids (Li et al. Reference Li, Le, Shi and Shrestha2004; Phelan & Kerins, Reference Phelan and Kerins2011). Similarly, extensive hydrolysis of milk proteins can reduce allergenicity significantly for use in infant formulas (Duan et al. Reference Duan, Yang, Li, Zhao and Huo2014; Dupont et al. Reference Dupont, Hol, Nieuwenhuis, De Jongste, Samsom, Van Leer, Elink Schuurman, De Ruiter, Neijens, Versteegh, Groeneweg, Van Veen, Vaessen-Verberne, Smit, Vriesman, Roosen and Den Exter2015).
It can be concluded the extent of the hydrolysis reaction is a key parameter which should be controlled and predicted accurately to obtain hydrolysates with specific characteristics. Mechanistic approaches fail to describe the complexity of various proteins present in milk and different reactions that occurs during milk hydrolysis (e.g., product inhibition, enzyme thermal denaturation: Ba & Boyaci, Reference Ba and Boyaci2007). In this context, methods based on direct analysis of experimental data using response surfaces or artificial neural networks, are a suitable alternative to those based on phenomenological hypotheses. These empirical methods are applicable to all types of enzymatic reactions and do not require kinetic assumptions (Baş et al. Reference Baş, Dudak and Boyacı2007).
In particular, response surface methodology is widely used for modelling and optimization purposes, for which the response of interest is influenced by several variables. However, this method is limited in most cases by the use of polynomial equations. Instead, ANNs can be used to ensure better data fit and estimation capabilities (Ba & Boyaci, Reference Ba and Boyaci2007; Fatiha et al. Reference Fatiha, Sameh, Youcef, Zeineddine and Nacer2013).
ANN is composed of individual processing elements (i.e., neurons) that transform weighted input variables into an output by means of an activation function. ANNs comprise one or more hidden layers of neurons. A key element of this approach is the training algorithm, which allows one to update the weights and biases of the neurons to obtain outputs closer to the targets. This training consists of minimizing the average squared error (MSE) between the calculated values and the experimental data. ANN arises as an alternative to obtain predictive models for protein hydrolysis, especially when a large volume of data is available. The strength of these models, inspired by the human brain, lies in its ability to learn from experimental data by training algorithms. By this approach, the model parameters are updated iteratively, until minimizing the error between predicted and actual data. In the field of biochemical processes, this approach allows obtaining predictive models without needing to have extensive knowledge of the underlying mechanism. This is especially useful in enzymatic reactions where several phenomena (i.e. substrate solubilization, substrate or product inhibition, thermal inactivation of the enzyme) may occur simultaneously.
The ANNs have been successfully employed for modelling enzymatic reactions. For example, Bryjak et al. (Reference Bryjak, Murlikiewicz, Zbiciński and Stawczyk2000) applied ANNs to model starch hydrolysis by glucoamylase, while Baş et al. (Reference Baş, Dudak and Boyacı2007) studied the reaction rates of maltose hydrolysis by amyloglucosidase. As for the protein hydrolysis, Abakarov et al. (Reference Abakarov, Teixeira, Simpson, Pinto and Almonacid2011) satisfactorily modelled the kinetics of enzymatic hydrolysis of squid protein with subtilisin using the reaction time and the substrate concentration as input variables. Buciński et al. (Reference Buciński, Karamać, Amarowicz and Pegg2008) and Li et al. (Reference Li, Hu, Hong, Xu, Zhou, Fu, Wang, Xu and Li2016) evaluated the variation of DH during the hydrolysis of bovine haemoglobin and pea proteins, respectively. Li et al. (Reference Li, Wang, Zhao, Cui and Jiang2006) developed a predictive model for the production of antioxidant peptides from fish proteins taking into account a number of input variables such as pH, temperature, hydrolysis time, muscle/water ratio and enzyme/substrate ratio. Regarding milk proteins, Pinto et al. (Reference Pinto, Giordano and Giordano2007) proposed a hybrid neural-kinetic model for predicting the molecular mass distribution of whey protein hydrolysates.
The aim of this study was to develop two ANN models for the enzymatic hydrolysis of goat milk proteins, employing either subtilisin or trypsin as catalysts. For each model, the DH was modelled as a function of temperature, enzyme–substrate ratio and the reaction time. Firstly, the architecture of the neural network (i.e., number of neurons in the hidden layer) and the training algorithm were chosen to maximize the degree of fitness (i.e., mean-squared error) of the model. Both ANN models were then optimized for the maximal DH, which is desirable because it improves ACE inhibitory and antioxidant activities of the resulting hydrolysates.
Materials and methods
Materials
Commercial UHT goat milk (33 g protein/l) was purchased from a local store. The enzymes used for the assays were subtilisin (EC 3.4.21.62) and trypsin (EC 3.4.21.4), both supplied by Novozymes (Denmark).
Enzymatic reaction and determination of the degree of hydrolysis
Before hydrolysis, the milk was skimmed by centrifugation at 4 °C and 5000 g for 20 min in a Sigma 6k15 centrifuge (Sigma Laborzentrifugen, Germany). Skimmed goat milk (200 ml) was then hydrolysed in a stirred tank reactor for 5 h. Initially, the pH of the milk was set at pH 8 with 1 m NaOH. After reaching the desired temperature, the enzyme was added at different enzyme–substrate ratio. In alkaline medium, the cleavage of peptide bonds releases protons which cause the pH to drop. An automatic titrator was employed (718 Stat Titrino, Metrohm, Switzerland) to keep the pH constant during the reaction by adding NaOH (1 m). The degree of hydrolysis (DH), defined as the percentage of available peptide bonds which are cleaved during the reaction, can be related to the amount of base consumed by Eq. 1 (Adler Nissen, Reference Adler Nissen1986):
 $$\hbox{DH} = {{n_{\rm B}} / {\lpar {\alpha \cdot m_{\rm P}\cdot h_{{\rm TOT}}} \rpar }}$$
where DH is the degree of hydrolysis, n B (mol) is the amount of NaOH consumed to keep the pH constant, α is the average degree of dissociation of α-NH2 groups released during hydrolysis, m P = 6·6 g is the mass of protein in the substrate and h TOT = 0·0082 eq/g is the average number of equivalents of peptide bonds per gram of casein protein.
Experimental design
A total of 60 hydrolysates were produced, broken down into two factorial designs of 30 experiments where subtilisin or trypsin was employed as catalysts. Each hydrolysate was produced at a given combination of reaction temperature (T) and enzyme–substrate ratio (ES), which were the input variables of the factorial designs. The reaction temperature was varied at six levels according to the thermal stability of the enzyme assayed. Subtilisin exhibits wide thermal stability, presenting optimal activity around 50–55 °C. As for trypsin, it presents maximal activity around 40 °C (Adler Nissen, Reference Adler Nissen1986). Therefore, subtilisin was tested at 45, 50, 55, 60, 65 and 70 °C, while trypsin was at 30, 35, 40, 45, 50 and 55 °C. The levels assayed for the enzyme to substrate ratio were 1, 2, 3, 4 and 5% for both enzymes. As for the time of reaction (t), the DH value was recorded every 60 s over the course of the reaction (5 h). This yields an amount of 300 experimental data (T, ES, t, DH) for each hydrolysis curve.
Structure and training of the artificial neuronal network
Two artificial neural network (ANN) models were developed in this work (i.e. subtilisin and trypsin), where DH was related to the reaction temperature (T), the enzyme-substrate ratio (ES) and the time of reaction (t) as input variables. Both ANN models were constructed by means of the Neural Network Toolbox, implemented in Matlab 7.0 (Mathworks, USA).
Both artificial neural networks comprised an input layer, a single hidden layer and an output layer. The input layer comprised three neurons, corresponding to the 3 input variables (T, ES, t). This layer is connected to the hidden layer, whose number of neurons was varied from 1 to 10 neurons. Each neuron k of the hidden layer received a weighted signal from the input layer sk, expressed as follows:
 $$s_k = \sum\limits_{i = 1}^3 {w_{ik}\cdot X_i + b_k} $$
where w ik were the weight factors and b k was the bias for the neuron k. Each neuron of the hidden layer processes the signal s k by means of a transfer function. The sigmoid function (implemented in Matlab as logsig) was selected as transfer function in the hidden layer, which returns a value ranging between 0 and 1 according to Eq. 3:
 $$\hbox{logsig} (s_k) = \displaystyle{1 \over {1 + \exp \lpar { - s_k} \rpar }}$$
The k responses exiting the hidden layer are combined into a single weighted signal t, which is received by an output neuron, which returns the predicted value of DH. The saturated symmetric lineal function was chosen as transfer function for the output layer. This function truncates the weighted signal t within the interval [0,1], avoiding either negative DH values or above 1.
Three training algorithms were tested in this work: gradient descent with momentum backpropagation (traingdm), resilient backpropagation (trainrp) and Levenberg–Marquardt backpropagation (trainlm). These algorithms update the weight and bias values in order to minimize the mean squared error (MSE) between observed and predicted DH.
For a fixed number of hidden neurons in the hidden layer and training algorithm (traingdm, trainrp and trainlm), 30 runs were carried, ensuring an appropriate population of predicted data. At the beginning of each run, the dataset was normalized and then randomly divided into three subsets: training, validation and test. The biggest subset (70% of the total amount of experimental data) was used for training the network using the algorithm selected. During the training, the error obtained from the validation set (15% of the data) was employed for early stopping (i.e. interruption of the iteration process when over-fitting in the training dataset is detected). In back-propagation methods, over-fitting occurs when an improvement in the fit of the training data is accompanied by larger generalization errors. The number of iterations per training run was limited to 10 000. As an early stopping criterion, the training process stopped when the MSE increased for 10 iterations. At this point, the algorithm returned the weights and biases corresponding to the minimal MSE recorded so far. Finally, the remaining data (15%) are employed to compute the test error, which assesses the predictive capability of the network. This error is also useful to know if a good division of the data set (i.e. training, validation and evaluation subset) has been done.
ANN model for DH and optimization procedure
The objective of the ANN procedure was to obtain a predictive model of DH for each of the enzymes employed. Each model allowed the calculation of DH as a function of the experimental conditions of temperature, enzyme-substrate ratio and time of reaction, as expressed by Eq. 4:
 $$\hbox{DH} = \sum\limits_{k = 1}^N {{\rm \omega} _k \cdot \hbox{logsig}\left( {\sum\limits_{i = 1}^3 {w_{ki}} \cdot X_i + b_k} \right) + {\rm \beta}} $$
X (T, eS, t) denotes the vector of input variables (i.e, the experimental conditions for each hydrolysis assay); wki and bk are the weight factors and bias of the input layer, respectively; ω and β are the weights and bias of the hidden layer and the transfer function logsig was defined by Eq. 3.
The training procedure allowed the estimation of the set of parameters w k, b k, ω and β yielding the minimal squared error between predicted and observed DH (i.e., the best fit between the experimental DH and the predictive model).
The goal of the optimization problem was to find the set of experimental conditions X (T, eS, t), within their experimental range, which maximizes DH calculated by Eq. 4. To this end, the Generalized Reduced Gradient (GRG), implemented in the Solver tool of the MS Excel, was chosen for the optimization of both models. GRG is a non-linear optimization algorithm, which basically evaluates the gradient or slope of the objective function (i.e. predicted DH) as the input values (i.e. experimental conditions Xi in Eq. 4) change and determines that it has reached an optimum solution when the partial derivatives equal zero. Since GRP is a local method, the multistart method was chosen to find a globally optimal solution of the problem. This option consists in operating the GRP algorithm from a set of starting points, reaching different local optimums which are then compared to select a global optimum.
Results and discussion
Architecture and training algorithm of the ANN
The time evolution of the DH was modelled by two artificial neural networks, depending on the enzyme employed for the hydrolysis. Each ANN comprised an input layer of three neurons corresponding to each one of the experimental factors (T, ES, t), connected to a hidden layer with a variable number of neurons between 1 and 10. The hidden layer is connected to an output layer with a single neuron, which returns the predicted value for the degree of hydrolysis. An average of 30 simulations was performed by a combination of three training algorithms (i.e. trainrp, traingdp, trainlm) and a fixed number of neurons in the hidden layer (i.e. 1 to 10). Every training procedure was executed 30 times, starting from different initial values of weights and biases. For each trial, the mean squared errors of the training, validation and test subsets were recorded. Average training and validation errors were in all cases very similar to test error values. Indeed, the differences between these errors were below 1 and 2% for subtilisin and trypsin networks, respectively. Fig. 1 presents the test error of the networks obtained for the hydrolysis with subtilisin (a) and trypsin (b) as a function of the training algorithm and the number of neurons in the hidden layer. For both ANN models, the Levenberg-Marquardt algorithm showed the best performance, followed by trainrp and traingdm. Indeed, test errors decreased with an increasing number of neurons in the hidden layer for the trainlm algorithm, resulting in final MSE values of and 5 × 10⁻⁴ and 10−3 at 10 neurons for the subtilisin and tripsin network, respectively. Contrarily, the traingdp algorithm presented overfitting above 6 neurons for both ANN models. According to these results, the Levengberg–Marquardt training algorithm was chosen to model the degree of hydrolysis for both enzymes.
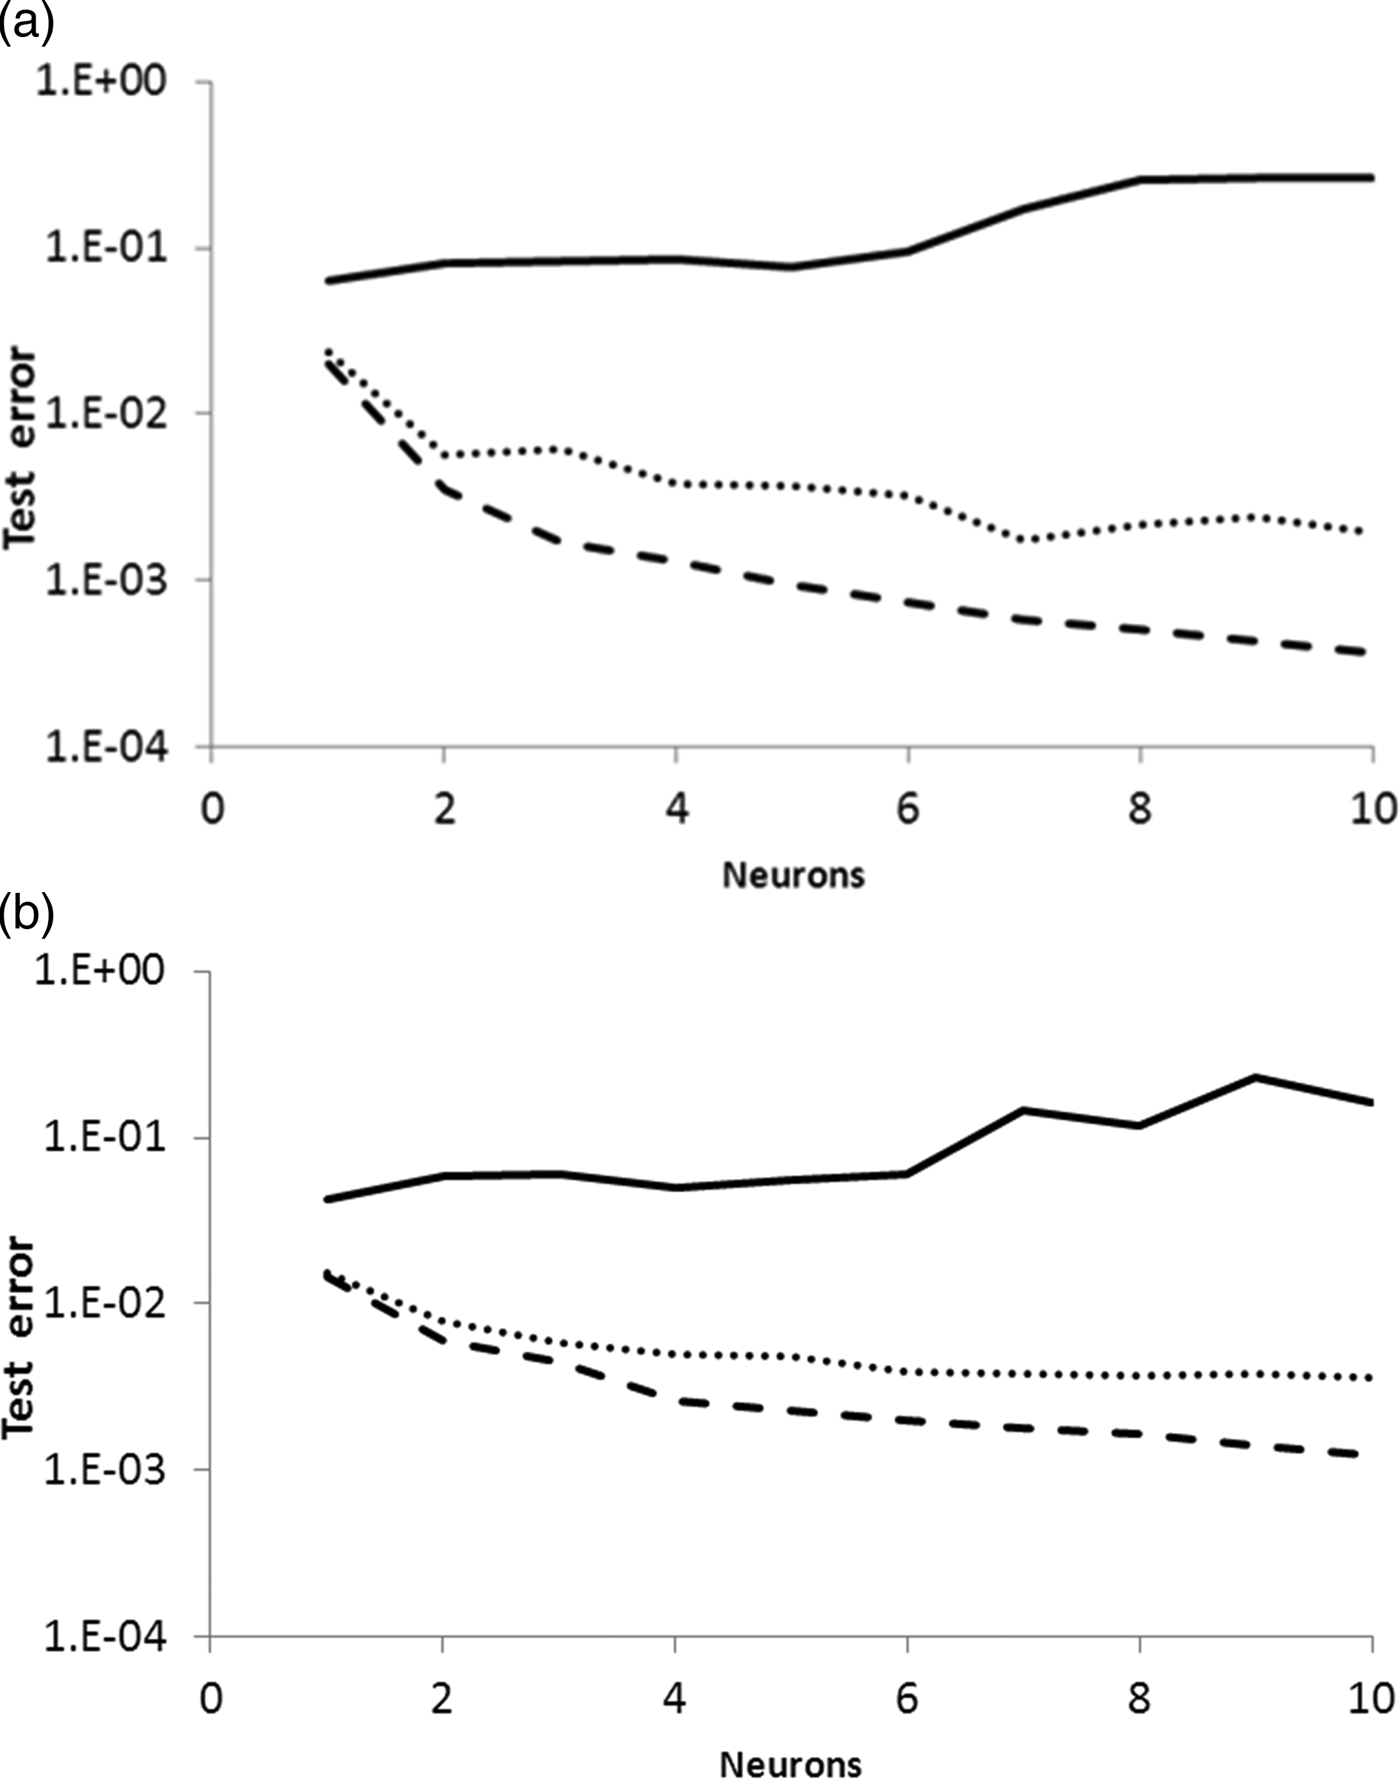
Fig. 1. Test error as a function of the number of neurons in the hidden layer for (a) subtilisin and (b) trypsin. Test errors reported as average of 30 trials trained by gradient descent with momentum (solid line), resilient backpropagation (dotted line) and Levensberg-Marquardt algorithm (dashed line).
The predictability of both ANN models and the trainlm algorithm was assessed by the slope and intercept of the linear fit between predicted and observed values of DH (Fig. 2). Ideally, the slope and the intercept should be 1 and 0, respectively. In the case of the subtilisin ANN, the network with 2 neurons in the hidden layer led to an average slope (i.e. mean value from 30 trials) above 0·950, which increased up to 0·996 at 8 neurons. This value remained steady in 9 and 10 neurons. The intercept value for the subtilisin ANN was 6 × 10⁻³ at 2 neurons and decreased down to 4 × 10⁻⁴ at 10 neurons. Similarly, the average slope and intercept values for the trypsin ANN increased and decreased, respectively, with the number of neurons in the hidden layer. This model reached a maximal slope of 0·984 and a minimal intercept of 2 × 10⁻³ at 10 neurons.

Fig. 2. Slope (dashed line) and intercept (solid line) of the linear fit of experimental against calculated DH as a function of the number of neurons in the hidden layer for (a) subtilisin and (b) trypsin. Slope and intercept reported as average of 30 trials trained by the Levengsberg–Marquardt algorithm.
In line of the above, two ANN models were proposed to fit the experimental data employing the Levengberg-Marquardt training algorithm. The number of neurons in the hidden layer was fixed at 8 and 10 for the subtilisin and trypsin ANN, respectively. Under these conditions, the predictability of both models (i.e. MSE and slope values) was acceptable while their complexity and time of computation were limited. This algorithm has been successfully employed to model enzymatic processes. For example, Pinto et al. (Reference Pinto, Giordano and Giordano2007) modelled the molecular weight distribution of whey protein hydrolysates. Feed-forward ANNs trained by the Levensberg–Marquardt algorithm was used to model the time evolution of DH in the hydrolysis of blood protein (Pérez-Gálvez et al. Reference Pérez-Gálvez, Espejo-Carpio, Guadix and Guadix2016) and horse mackerel protein (Morales-Medina et al. Reference Morales-Medina, Pérez-Gálvez, Guadix and Guadix2016) with subtilisin. Abakarov et al. (Reference Abakarov, Teixeira, Simpson, Pinto and Almonacid2011) used gradient descent algorithm to predict the hydrolysis of squid protein using subtilisin. Similarly, Buciński et al. (Reference Buciński, Karamać, Amarowicz and Pegg2008) use it for hydrolysis of pea protein employing trypsin.
ANN models for the hydrolysis with subtilisin and trypsin
In all cases, the time evolution of DH followed the characteristic curve described for enzymatic hydrolysis. As an example, Figs. 3a, b represent the observed values of DH (point markers) against the time of reaction and enzyme-substrate ratio for subtilisin and trypsin at 50 °C. It can be observed that DH presented a sharp linear increase at the beginning of the hydrolysis, followed by a slight reduction to achieve steady state. As the proteolysis progresses, the remaining number of peptide bonds available for enzyme attack decreases and so, therefore, does the reaction rate (Adler Nissen, Reference Adler Nissen1986; Valencia et al. Reference Valencia, Pinto and Almonacid2014). Depending on its thermal stability, prolonged times of reaction at high temperatures may provoke thermal inactivation of the enzyme. The denaturation of the quaternary structure of the enzyme results in a decrease of its enzymatic activity. Finally, some authors such as Valencia et al. (Reference Valencia, Pinto and Almonacid2014) relate the decrease of the reaction rate to the occurrence of product inhibition. In this case, the peptides released during hydrolysis may inhibit the reaction progress by forming stable complexes with substrate or enzyme.

Fig. 3. Experimental (marker points) and predicted (solid lines) values of DH against time of reaction and enzyme-substrate ratio for (a) subtilisin at 50 °C and (b) trypsin at 50 °C.
The hydrolysis curves depicted in Fig. 3 show that increasing enzyme–substrate ratios improved the final values of DH for the subtilisin reaction. This trend was not clear for the trypsin reactions, where hydrolysis curves at ES 4% and 5% were very close or even overlapped with each other.
As example, at 50 °C, the final DH values observed for substilisin and trypsin were in the range of 18–24%, and 16–23%, respectively. The solid lines in Fig. 3 represent the predicted DH calculated from the ANN models presented above. Fig. 3 illustrates the high degree of fitting between the observed values of DH and those calculated by ANN modelling. The determination coefficients of the linear fit between experimental and calculated values of DH were r 2 = 0·996 and r 2 = 0·994 for subtilisin and trypsin, respectively.
Optimization of the degree of hydrolysis
The application of the Levengsberg–Marquardt algorithm allowed estimation of the weights and biases of both ANN models (Eq. 2) for a fixed number of neurons in the hidden layer. This set of parameters allowed computation of DH as a function of the reaction conditions (i.e. T, ES and t). Furthermore, these models were optimized by an evolutionary algorithm to determine the optimal parameters for maximal DH. Extensive hydrolysis seems to enhance a number of biological activities such as the ACE-inhibitory and the antioxidant activities. Some of the most potent ACE inhibitors identified in milk protein hydrolysates correspond to di and tripeptides (Hernández-Ledesma et al. Reference Hernández-Ledesma, García-Nebot, Fernández-Tomé, Amigo and Recio2014). Similarly, several short peptides (500–1800 Da) have been identified as potent antioxidants (Samaranayaka & Li-Chan Reference Samaranayaka and Li-Chan2011; Ahmed et al. Reference Ahmed, El-Bassiony, Elmalt and Ibrahim2015; Moreno-Montoro et al. Reference Moreno-Montoro, Olalla-Herrera, Rufián-Henares, Martínez, Miralles, Bergillos, Navarro-Alarcón and Jauregi2017). Peptide size is also a crucial factor for bioavailability of bioactive peptides. According to the literature, there is no evidence that peptides bigger than tripeptides can move across the tissues of gastrointestinal tract intact and enter into the blood stream in bioactive concentrations (Miner-Williams et al. Reference Miner-Williams, Stevens and Moughan2014). The contour plots shown in Figs. 4a, b represent the calculated values of the final DH (5 h) against the reaction temperature and the enzyme-substrate ratio. Both contour plots confirm the positive effect of increasing enzyme-substrate ratio on DH. This trend was clear for the hydrolysis with subtilisin, regardless the reaction temperature. Increasing ES ratios favoured the proteolysis with subtilisin, obtaining maximum DH of 22–23% with 5% ES ratio. Optimization of the ANN model confirmed that maximum DH (23·47%) can be achieved for goat milk proteins using subtilisin at 56·4 °C with 5% ES ratio. The optimal reaction temperature is within the range of maximal activity reported for subtilisin (Adler Nissen, Reference Adler Nissen1986; Ma et al. Reference Ma, Sun and Wang2015). According to the contour plot, the final values of DH at 5% ES ratio kept above 22% within the experimental range from 45 to 70 °C. This suggests that this enzyme was not significantly affected by thermal deactivation, and therefore its proteolytic activity remained unaltered. This is in line with previous studies which highlight the high resistance of subtilisin against thermal denaturation (Adler-Nissen, Reference Adler Nissen1986; Nagodawithana & Reed, Reference Nagodawithana and Reed2013). Subtilisin-like serine proteases contain a variable number (2–7) of Ca2+-binding sites. Binding of the calcium ions has been reported to greatly stabilize the protein structure against thermal unfolding (Foophow et al. Reference Foophow, Foophow, Tanaka, Koga, Takano and Kanaya2010).

Fig. 4. Contour plots of final DH (5 h) against enzyme-substrate ratio and reaction temperature for (a) subtilisin ANN model with 8 neurons in the hidden layer and (b) trypsin ANN model with 10 neurons in the hidden layer.
In contrast, the contour plots for the hydrolysis with trypsin (Fig. 4b) indicated that the final DH was influenced by the reaction temperature. This may have resulted from inactivation of trypsin at higher temperature. The optimal conditions for maximal DH (21·3%) were 35 °C and ES 4%. Higher levels of enzyme-substrate ratio did not improve the extent of the hydrolysis, suggesting the saturation of the peptide bonds available. Trypsin exhibits narrow specificity towards arginine and lysine residues (Olsen et al. Reference Olsen, Ong and Mann2004), while subtilisin is a wide-spectrum protease. This fact could explain the saturation of available peptide bonds at ES ratios above 4%. The optimal temperature condition calculated for trypsin was 35 °C, similar to the maximum of 37 °C reported in scientific literature (Adler-Nissen, Reference Adler Nissen1986; Morales-Medina et al. Reference Morales-Medina, Pérez-Gálvez, Guadix and Guadix2016).
For validation purposes, the optimal operating conditions for maximal DH were reproduced experimentally for both enzymes. To this end, the predicted optimum conditions for both subtilisin (56·4 °C and ES 5%) and trypsin (35 °C and ES 4%) were experimentally evaluated as illustrated in Fig. 5. Some of the observed values of DH were represented by point markers, while the curves predicted from the ANN model were depicted as solid lines. Both curves fitted satisfactorily the observed data. This was confirmed by the coefficients of determination R 2 for both models, which were 0·9883 and 0·9929 for subtilisin and trypsin, respectively. Moreover, the average deviation between observed and predicted values was 1·9 ± 1·7% for the hydrolysis with subtilisin and 1·7 ± 1·6% for trypsin. The verification hydrolysis with subtilisin led to a maximal DH of 23·26% at experimental conditions 56·4 °C, 5% ES ratio and 5 h of reaction, which was similar to the optimum DH (23·47%, 56·4 °C, 5% ES ratio, 5 h) predicted by the proposed ANN model with 8 neurons in the hidden layer. However, maximum DH obtained for trypsin mediated hydrolysis under experimental conditions (35 °C, 4% ES ratio and 5 h of reaction) was 22·17%, which is slightly higher than the predicted value (21·3%) with optimum conditions (35 °C, ES 4% and 5 h) using the ANN model with 10 neurons.

Fig. 5. Validation experiment: experimental (marker points) and predicted (solid lines) values of DH against time of hydrolysis under optimal conditions for maximizing DH (ES 5%, T = 56·4 °C and ES 4%, T = 35 °C for subtilisin and trypsin, respectively).
In conclusion, ANN modelling was successfully employed to predict the degree of hydrolysis of skimmed goat milk proteins with subtilisin and trypsin as a function of the operating conditions, namely the reaction temperature, the enzyme-substrate ratio and the time of hydrolysis. The predictability of both ANN models was improved by testing three training algorithm and a variable number of neurons (i.e. 1–10) in the hidden layer. In this regard, two ANN models with 8 and 10 neurons in the hidden layer were selected for subtilisin and trypsin hydrolysis, respectively. As for the training algorithm, the Levengsberg-Marquardt led to the minimal test errors (MSE) for both subtilisin and trypsin with determination coefficients of 0·996 and 0·984, respectively. Furthermore, these models were optimized by an evolutionary algorithm to obtain the combination of operating conditions leading to the maximal DH. Maximum DH (23·47%) was calculated for subtilisin at 56·4 °C, ES 5% and 5 h of reaction, while the máximum DH obtained for trypsin was 21·3% at 35 °C, ES 4% and 5 h reaction. There was a significant correlation between DH predicted using ANN models and DH obtained under experimental conditions.
This work was funded by the project P07-TEP-02579 from the Consejería de Economía, Innovación, Ciencia y Empleo of Junta de Andalucía, Spain.


