


1. Introduction
A flow in a porous medium is characterized by length scales of different magnitudes. Assuming continuous fluid flow, i.e. a sufficiently small Knudsen number, the smallest relevant geometric scale is the pore scale, which can be estimated by the average hydraulic diameter of the pores. Next in the hierarchy of scales comes the size of a representative elementary volume (REV), which is relevant in cases where pores are of very different individual sizes. For a homogeneous matrix with pores of the same size and a flow in the laminar regime the size of an REV is of the order of the pore size.
These considerations are important when it comes to the question of turbulent flow in porous media. For high enough pore-scale Reynolds numbers the flow within the pores will be turbulent since the connected pores can be viewed as microchannels. Indeed, if the Reynolds number exceeds the critical Reynolds number for such microchannels, the flow becomes turbulent. This is the same as for macroscopic flows through conduits (Wibel & Ehrhard Reference Wibel and Ehrhard2006, Reference Wibel and Ehrhard2009).
The topic of turbulence in porous media was reviewed in recent books by de Lemos (Reference de Lemos2012) and Nield & Bejan (Reference Nield and Bejan2013) and in many review chapters, such as Lage, de Lemos & Nield (Reference Lage, de Lemos, Nield, Ingham and Pop2002), de Lemos (Reference de Lemos, Ingham, Bejan, Mamut and Pop2004, Reference de Lemos, Ingham and Pop2005), and Vafai et al. (Reference Vafai, Minkowycz, Bejan, Khanafer, Minkowycz and Sparrow2006). There are two distinct views on turbulence in porous media. The first view was originally expressed in Nield (Reference Nield1991, p. 271) and then further developed in Nield (Reference Nield2001). According to this view, true macroscopic turbulence, at least in a dense porous medium, is impossible because of the limitation on the size of turbulent eddies imposed by the pore scale. This prevents the transfer of energy from large to smaller turbulent eddies. Thus, any turbulence in porous media is restricted to turbulence within the pores.
Although most published turbulence models attempt to obtain macroscopic characteristics of flow in porous media, some of them do this by simulating pore-scale turbulence. According to Nield (Reference Nield2001), the model developed by Nakayama & Kuwahara (Reference Nakayama and Kuwahara1999), due to the size of the periodic cell and the assumption of periodicity, in fact simulates turbulence within the pores. The same applies to Kuwahara et al. (Reference Kuwahara, Kameyama, Yamashita and Nakayama1998).
The second class of models deals primarily with macroscopic turbulence in porous media. Representative models are those developed by Lee & Howell (Reference Lee and Howell1991), Prescott & Incropera (Reference Prescott and Incropera1995) and Antohe & Lage (Reference Antohe and Lage1997). Macroscopic turbulence models have also been used to simulate flow in a porous matrix represented by a periodic array of square cylinders (Kazerooni & Hannani Reference Kazerooni and Hannani2009; Kundu, Kumar & Mishra Reference Kundu, Kumar and Mishra2014).
Finally, many turbulence models attempt to simulate both pore-scale turbulence and large-scale turbulence. Representative models are those developed by de Lemos and colleagues, see de Lemos & Pedras (Reference de Lemos and Pedras2000, Reference de Lemos and Pedras2001), Pedras & de Lemos (Reference Pedras and de Lemos2000, Reference Pedras and de Lemos2001a ,Reference Pedras and de Lemos b ,Reference Pedras and de Lemos c , Reference Pedras and de Lemos2003), Rocamora & de Lemos (Reference Rocamora and de Lemos2000), de Lemos & Rocamora (Reference de Lemos and Rocamora2002), de Lemos & Braga (Reference de Lemos and Braga2003), de Lemos & Mesquita (Reference de Lemos and Mesquita2003), Silva & de Lemos (Reference Silva and de Lemos2003) and de Lemos & Tofaneli (Reference de Lemos and Tofaneli2004).
The crucial question about the presence of macroscopic turbulence in porous media cannot be addressed by Reynolds-averaged Navier–Stokes (RANS) equations and not even by large-eddy simulation (LES), since these approaches involve turbulence modelling which implicitly or explicitly involves presupposition about the size of turbulent eddies. The only way to answer this question without ambiguity is to refer to experiments or to direct numerical simulation (DNS) solutions, which resolve turbulent flow accounting for all scales down to the Kolmogorov scale. Since measurements within the porous matrix are more than challenging, DNS solutions appear to be the best alternative.
In this paper we present results of extensive DNS investigations of the flow through a generic porous matrix (GPM) described and discussed in § 2.
2. The porous matrix
2.1. The REV for turbulent flow
In order to define an REV we need to determine the smallest subvolume of a porous matrix that shows the same flow behaviour as the flow behaviour that exists in the whole matrix. In the introduction it was argued that the REV is of the order of the pore size when the flow is laminar (a low Reynolds number) and the matrix is geometrically regular on the pore size. We called this REV-L and in addition introduced a representative elementary volume REV-T. The REV-T is for a turbulent flow; it must be larger than the REV-L if macroscopic turbulent eddies exist with sizes much larger than the pore size.
By carefully selecting the size of REV-T, we avoid possible suppression of large-scale turbulence caused by the periodicity of our model. This limitation is discussed in Nield (Reference Nield2001), who pointed out that by simulating flow in a periodic cell one may a priori rule out global eddies. We avoided this problem by making our REV-T sufficiently large.
The main questions (assuming a regular porous matrix) are as follows.
-
(i) What is the size of REV-T?
-
(ii) Is REV-T much larger than REV-L in size, i.e. are there macroscopic turbulent eddies in porous media?
2.2. A GPM for a DNS analysis
In order to investigate the size of turbulent eddies in porous media, we designed a GPM. We used the following three assumptions.
-
(i) The matrix may have a regular structure since the size of turbulent eddies will not be affected too much by irregularity of the matrix.
-
(ii) The matrix may be geometrically two-dimensional. This is because the turbulent flow will be three-dimensional anyway, irrespective of whether the solid matrix is two- or three-dimensional.
-
(iii) The porosity in our model is taken to be relatively high (0.78–0.94), since smaller porosity will only result in stronger suppression of any possible macroscopic turbulence. Thus, by selecting a porous matrix with a high porosity we are not risking the suppression of any macroscopic turbulence that might occur otherwise, i.e. for low porosity.
Figure 1 shows our GPM built from a large number of rectangular bars that were arranged periodically to form a porous medium. For this geometry, the porosity
 ${\it\varphi}$
is defined as
${\it\varphi}$
is defined as
 $$\begin{eqnarray}{\it\varphi}=1-\frac{1}{2}\left(\frac{d}{s}\right)^{2},\end{eqnarray}$$
where
 $s$
is the pore size and
$s$
is the pore size and
 $d$
is the elementary bar size (see figure 1). The permeability of the GPM can be evaluated using correlations presented in Dullien (Reference Dullien1992). For our GPM, a larger porosity corresponds to a larger permeability. Since the permeability can be expressed in terms of geometrical parameters of the porous matrix, in our analysis we only specify the pore size and porosity.
$d$
is the elementary bar size (see figure 1). The permeability of the GPM can be evaluated using correlations presented in Dullien (Reference Dullien1992). For our GPM, a larger porosity corresponds to a larger permeability. Since the permeability can be expressed in terms of geometrical parameters of the porous matrix, in our analysis we only specify the pore size and porosity.

Figure 1. The GPM with the representative elementary volumes REV-L and REV-T (REV-T occupies the whole area shown in figure 1). Here, ‘
 $u_{m}$
’ is the mean flow velocity, ‘
$u_{m}$
’ is the mean flow velocity, ‘
 $N_{x_{1}}$
’ is the size of the REV-T in the ‘
$N_{x_{1}}$
’ is the size of the REV-T in the ‘
 $x_{1}$
’ direction (in pore sizes), and ‘
$x_{1}$
’ direction (in pore sizes), and ‘
 $N_{x_{2}}$
’ is the size of the REV-T in the ‘
$N_{x_{2}}$
’ is the size of the REV-T in the ‘
 $x_{2}$
’ direction.
$x_{2}$
’ direction.
Within this regular geometric structure a representative volume REV-L is of size
 $2s$
while the size of REV-T is yet unknown. A strategy to find the REV-T size was as follows. We started with an REV-T that included a large number of elementary bars, calculated the turbulent flow in that domain and then reduced the number of bars systematically. As long as the results in a smaller domain were the same as the corresponding results in a larger domain, a further reduction was appropriate.
$2s$
while the size of REV-T is yet unknown. A strategy to find the REV-T size was as follows. We started with an REV-T that included a large number of elementary bars, calculated the turbulent flow in that domain and then reduced the number of bars systematically. As long as the results in a smaller domain were the same as the corresponding results in a larger domain, a further reduction was appropriate.
3. Direct numerical simulation calculations in a porous medium
3.1. Preliminary remarks
The only way to completely avoid turbulence modelling in computational fluid dynamics (CFD) solutions is to directly simulate the fluid flow, accounting for all relevant length and time scales. This approach is known as DNS; see Moin & Mahesh (Reference Moin and Mahesh1998) for a general introduction. Due to the enormous computational resources required (cpu time and storage capacity), only certain benchmark cases (see Ma, Karamanos & Karniadakis (Reference Ma, Karamanos and Karniadakis2000), Parnaudeau et al. (Reference Parnaudeau, Carlier, Heitz and Lamballais2008) and Afgan et al. (Reference Afgan, Kahil, Benhamadouche and Sagaut2011)) or special fundamental problems (Kis Reference Kis2011; Jin & Herwig Reference Jin and Herwig2013, Reference Jin and Herwig2014) can be handled by this method.
3.2. Direct numerical simulation methods
Two different methods which complement and verify each other were applied in this study to look for possible macroscopic turbulence in porous media. They are
-
(i) an FVM which directly solves the Navier–Stokes equations;
-
(ii) an LBM which determines the particle distribution; this method indirectly corresponds to solving the Navier–Stokes equations.
Both methods have been tested against each other in Jin, Uth & Herwig (Reference Jin, Uth and Herwig2015) for the problem of a turbulent flow along a rough wall. In Jin et al. (Reference Jin, Uth and Herwig2015) wall roughness was simulated by positioning two-dimensional bars on an otherwise smooth wall, creating a geometry that is similar to the porous medium design shown in figure 1.
3.2.1. The FVM
The governing equations to be solved for an incompressible flow of a Newtonian fluid with an FVM are the Navier–Stokes equations. We non-dimensionalized these equations with
 $d$
and
$d$
and
 $u_{m}$
and used the Einstein summation convention. In Cartesian coordinates these equations read (Herwig Reference Herwig2002)
$u_{m}$
and used the Einstein summation convention. In Cartesian coordinates these equations read (Herwig Reference Herwig2002)
 $$\begin{eqnarray}\displaystyle & \displaystyle \frac{\partial u_{i}}{\partial x_{i}}=0, & \displaystyle\end{eqnarray}$$
 $$\begin{eqnarray}\displaystyle & \displaystyle \frac{\partial u_{i}}{\partial t}+\frac{\partial (u_{i}u_{j})}{\partial x_{j}}=-\frac{\partial p}{\partial x_{i}}+\frac{1}{\mathit{Re}}\frac{\partial ^{2}u_{i}}{\partial x_{j}^{2}}+g_{i}. & \displaystyle\end{eqnarray}$$
 $$\begin{eqnarray}\mathit{Re}=\frac{u_{m}d}{{\it\nu}},\end{eqnarray}$$
where
 $u_{m}$
and
$u_{m}$
and
 $d$
are defined in figure 1 and
$d$
are defined in figure 1 and
 ${\it\nu}$
is the kinematic viscosity of the fluid.
${\it\nu}$
is the kinematic viscosity of the fluid.
Equations (3.1)–(3.3) were solved in a three-dimensional computational domain, the cross-section of which is the REV-T (see figure 1), and which extends in the third direction by a length
 $L_{3}$
, see the discussion of this in § 4.3. We used periodic boundary conditions on all boundaries of our computational domain since REV-T is an arbitrary cutout with respect to the whole porous matrix. By periodic boundary conditions we mean that all flow quantities (except the pressure in the flow direction) are equal on opposing boundaries of the REV-T.
$L_{3}$
, see the discussion of this in § 4.3. We used periodic boundary conditions on all boundaries of our computational domain since REV-T is an arbitrary cutout with respect to the whole porous matrix. By periodic boundary conditions we mean that all flow quantities (except the pressure in the flow direction) are equal on opposing boundaries of the REV-T.
In (3.2)
 $g_{i}$
is a prescribed pressure gradient which ensures a particular flow rate. The solution of (3.1)–(3.3) was advanced in time with the second-order implicit backward Euler method. To compute the derivatives of the velocity, the variables at the interfaces of the grid cells were obtained with linear interpolation. A second-order central difference scheme was used for spatial discretization. The pressure at the new time level was determined by the Poisson equation. The velocity was corrected by the pressure-implicit scheme with splitting of operators (PISO) pressure–velocity coupling.
$g_{i}$
is a prescribed pressure gradient which ensures a particular flow rate. The solution of (3.1)–(3.3) was advanced in time with the second-order implicit backward Euler method. To compute the derivatives of the velocity, the variables at the interfaces of the grid cells were obtained with linear interpolation. A second-order central difference scheme was used for spatial discretization. The pressure at the new time level was determined by the Poisson equation. The velocity was corrected by the pressure-implicit scheme with splitting of operators (PISO) pressure–velocity coupling.
3.2.2. The LBM
This method statistically models the propagation and interaction of particles and thus simulates the flow. For small Mach numbers, the macroscopic velocities that then emerge are solutions of the Navier–Stokes equations.
The basic equation for the LBM is a discretized version of the Boltzmann equation for the particle distribution function
 $f({\bf\xi},\boldsymbol{x},t)$
, which reads (see Aidun & Clausen Reference Aidun and Clausen2009)
$f({\bf\xi},\boldsymbol{x},t)$
, which reads (see Aidun & Clausen Reference Aidun and Clausen2009)
 $$\begin{eqnarray}{\bf\xi}\frac{\partial f}{\partial \boldsymbol{x}}+\frac{\partial f}{\partial t}={\it\Theta}.\end{eqnarray}$$
Here,
 $f({\bf\xi},\boldsymbol{x},t)$
is the probability to find a particle with velocity
$f({\bf\xi},\boldsymbol{x},t)$
is the probability to find a particle with velocity
 ${\bf\xi}$
at a position
${\bf\xi}$
at a position
 $\boldsymbol{x}$
at a time
$\boldsymbol{x}$
at a time
 $t$
. The function
$t$
. The function
 $f$
can be modified either by the motion of particles or by their collisions, which are determined by the collision operator
$f$
can be modified either by the motion of particles or by their collisions, which are determined by the collision operator
 ${\it\Theta}$
in (3.4).
${\it\Theta}$
in (3.4).
The lattice Boltzmann equation is a discretized form of the Boltzmann equation that emerges after a discretization of velocity, space and time. For an isotropic fluid the space can best be discretized by a uniform Cartesian grid. Velocity and time have to be discretized such that a particle travels from one grid point to a neighbouring grid point exactly in one time step. Different macroscopic velocities now correspond to different probability distributions of the particle velocities. A standard grid for modelling three-dimensional motions of this kind, shown in figure 2, is called a D3Q19 grid (Succi Reference Succi2001) (D3: three-dimensional; Q19: 19 discrete velocities).

Figure 2. Grid structure and velocities with the D3Q19 discretization.
A crucial aspect in deriving the lattice Boltzmann equation is how to treat the collision operator
 ${\it\Theta}$
in (3.4). A well-established approximation method is that by Bhatnagar, Gross and Kook (BGK) (Bhatnagar, Gross & Krook Reference Bhatnagar, Gross and Krook1954) which models collisions as a relaxation to an equilibrium distribution function
${\it\Theta}$
in (3.4). A well-established approximation method is that by Bhatnagar, Gross and Kook (BGK) (Bhatnagar, Gross & Krook Reference Bhatnagar, Gross and Krook1954) which models collisions as a relaxation to an equilibrium distribution function
 $f_{i}^{eq}$
. With this approximation the lattice Boltzmann equation reads
$f_{i}^{eq}$
. With this approximation the lattice Boltzmann equation reads
 $$\begin{eqnarray}f_{i}(\boldsymbol{x}+{\bf\xi}_{i}{\rm\Delta}t,t+{\rm\Delta}t)-f_{i}(\boldsymbol{x},t)=-\frac{1}{{\it\tau}}(\,f_{i}(\boldsymbol{x},t)-f_{i}^{eq}(\boldsymbol{x},t)),\end{eqnarray}$$
 ${\it\tau}$
is a relaxation time related to the fluid viscosity. The left-hand side of this equation represents the propagation of particles while the right-hand side describes the collisions. With an algorithm that executes these two steps, the collision step can be calculated after a propagation step on every grid point (Jin et al.
Reference Jin, Uth and Herwig2015).
${\it\tau}$
is a relaxation time related to the fluid viscosity. The left-hand side of this equation represents the propagation of particles while the right-hand side describes the collisions. With an algorithm that executes these two steps, the collision step can be calculated after a propagation step on every grid point (Jin et al.
Reference Jin, Uth and Herwig2015).
3.3. Accuracy of DNS methods
Direct numerical simulation solutions need numerical grids that are fine enough to resolve the smallest scales involved. Quite generally these smallest scales are of the order of the Kolmogorov scale:
 $$\begin{eqnarray}{\it\eta}=\frac{{\it\nu}^{3/4}}{{\it\varepsilon}^{1/4}},\end{eqnarray}$$
where
 ${\it\nu}$
is the kinematic viscosity of the fluid and
${\it\nu}$
is the kinematic viscosity of the fluid and
 ${\it\varepsilon}$
is the local dissipation rate of the turbulent kinetic energy. This scale strongly depends on the Reynolds number (roughly
${\it\varepsilon}$
is the local dissipation rate of the turbulent kinetic energy. This scale strongly depends on the Reynolds number (roughly
 ${\it\eta}\sim \mathit{Re}^{-3/4}$
) so that DNS solutions quite generally are restricted to moderate Reynolds numbers.
${\it\eta}\sim \mathit{Re}^{-3/4}$
) so that DNS solutions quite generally are restricted to moderate Reynolds numbers.
According to these considerations a perfect DNS solution would comply with the condition
 ${\rm\Delta}x_{i}/{\it\eta}\leqslant 1$
, where
${\rm\Delta}x_{i}/{\it\eta}\leqslant 1$
, where
 ${\rm\Delta}x_{i}~(i=1,2,3)$
are the step sizes in the three dimensions of the solution domain. This, however, can hardly be achieved, especially very close to the solid walls where the local dissipation rate
${\rm\Delta}x_{i}~(i=1,2,3)$
are the step sizes in the three dimensions of the solution domain. This, however, can hardly be achieved, especially very close to the solid walls where the local dissipation rate
 ${\it\varepsilon}$
is very large. One should also keep in mind that the Kolmogorov condition is a local statement about the numerical resolution. When
${\it\varepsilon}$
is very large. One should also keep in mind that the Kolmogorov condition is a local statement about the numerical resolution. When
 ${\rm\Delta}x_{i}/{\it\eta}\leqslant 1$
cannot be met locally it is hard to say how this affects the solution further away or in the whole domain.
${\rm\Delta}x_{i}/{\it\eta}\leqslant 1$
cannot be met locally it is hard to say how this affects the solution further away or in the whole domain.
As an alternative measure of the overall accuracy of our solutions we introduced a quantity
 ${\it\Delta}$
, called the accuracy measure, which we defined as
${\it\Delta}$
, called the accuracy measure, which we defined as
 $$\begin{eqnarray}{\it\Delta}=\frac{g_{p}-g_{s}}{g_{p}}.\end{eqnarray}$$
This was based on the following considerations. In fully developed flows, such as that through our GPM, the pressure gradient
 $g_{i}$
in (3.2) can be determined in two ways, either by evaluating the pressure in two opposing cross-sections (we denoted this pressure gradient by
$g_{i}$
in (3.2) can be determined in two ways, either by evaluating the pressure in two opposing cross-sections (we denoted this pressure gradient by
 $g_{p}$
) or by integrating the dissipation of mechanical energy between them,
$g_{p}$
) or by integrating the dissipation of mechanical energy between them,
 $$\begin{eqnarray}g_{s}=\frac{2}{V_{0}\,\mathit{Re}}\int _{V}s_{ij}s_{ij}\text{d}v,\end{eqnarray}$$
where the non-dimensionalized strain rate is defined by
 $s_{ij}=(\partial u_{i}/\partial x_{j}+\partial u_{j}/\partial x_{i})/2$
and
$s_{ij}=(\partial u_{i}/\partial x_{j}+\partial u_{j}/\partial x_{i})/2$
and
 $V_{0}$
is the volume of the computational domain.
$V_{0}$
is the volume of the computational domain.
For a perfect DNS solution the accuracy measure
 ${\it\Delta}$
would be zero since in such a case
${\it\Delta}$
would be zero since in such a case
 $g_{p}=g_{s}$
. In real DNS
$g_{p}=g_{s}$
. In real DNS
 $g_{s}$
will always be smaller than
$g_{s}$
will always be smaller than
 $g_{p}$
since not all scales are resolved and certain local dissipation effects are missing. For example, the
$g_{p}$
since not all scales are resolved and certain local dissipation effects are missing. For example, the
 ${\it\Delta}$
values are 0.1 %–1.5 % for the DNS results for a flow in a channel with smooth walls while they are 7 %–10 % for more complicated turbulent flows such as a flow in a channel with rough walls (see Jin & Herwig Reference Jin and Herwig2013, Reference Jin and Herwig2014).
${\it\Delta}$
values are 0.1 %–1.5 % for the DNS results for a flow in a channel with smooth walls while they are 7 %–10 % for more complicated turbulent flows such as a flow in a channel with rough walls (see Jin & Herwig Reference Jin and Herwig2013, Reference Jin and Herwig2014).
For reasons explained later we start with low-resolution results, testing various parameter variations in § 4, and then move on to high-resolution results in § 5. Low and high resolution are determined with respect to the accuracy measure
 ${\it\Delta}$
: low-resolution results are those with
${\it\Delta}$
: low-resolution results are those with
 ${\it\Delta}$
well above 10 % while high-resolution results have
${\it\Delta}$
well above 10 % while high-resolution results have
 ${\it\Delta}$
values well below 10 %.
${\it\Delta}$
values well below 10 %.
4. Low-resolution results
Since the main question in our study is whether large-scale turbulence occurs in porous medium flows, we (as a first step) determine the size of the REV-T with low-resolution DNS results. These solutions are obtained with numerical grids with step sizes
 ${\rm\Delta}x_{i}$
, for which
${\rm\Delta}x_{i}$
, for which
 ${\rm\Delta}x_{i}/{\it\eta}$
is larger than one in an appreciable part of the solution domain close to the walls and for which
${\rm\Delta}x_{i}/{\it\eta}$
is larger than one in an appreciable part of the solution domain close to the walls and for which
 ${\it\Delta}$
, defined by (3.7), is well above 10 %. The underlying assumption is that the large-scale motion is not critically influenced by missing small scales. This assumption is supported by the generally small backscatter (energy transfer from small to large scales) in turbulent flows but nevertheless will be verified with the final solutions based on high-resolution results.
${\it\Delta}$
, defined by (3.7), is well above 10 %. The underlying assumption is that the large-scale motion is not critically influenced by missing small scales. This assumption is supported by the generally small backscatter (energy transfer from small to large scales) in turbulent flows but nevertheless will be verified with the final solutions based on high-resolution results.
4.1. Test cases
 $1$
–
$4$
$1$
–
$4$


Taking into account the requirements with respect to the REV-T as well as the available computer resources we selected test cases 1–4 with parameter values according to table 1. We choose the obstacle size
 $d$
as the length scale and refer all geometric parameters to
$d$
as the length scale and refer all geometric parameters to
 $d$
. Thus we do not fix the actual pore size but determine non-dimensional results. These results can be interpreted as different cases by assigning different values to the length
$d$
. Thus we do not fix the actual pore size but determine non-dimensional results. These results can be interpreted as different cases by assigning different values to the length
 $d$
, for example
$d$
, for example
 $d=1~\text{mm}$
or
$d=1~\text{mm}$
or
 $d=0.1~\text{mm}$
. All values are possible as long as the Navier–Stokes equations (which are solved in the incompressible limit assuming no slip at the solid boundaries) are an adequate theoretical model for the flow.
$d=0.1~\text{mm}$
. All values are possible as long as the Navier–Stokes equations (which are solved in the incompressible limit assuming no slip at the solid boundaries) are an adequate theoretical model for the flow.

Figure 3. Flow field details in one REV-L element shown by isosurfaces
 $Q\cdot d^{2}/u_{m}^{2}=10$
, colour coded with the instantaneous non-dimensional vertical velocity
$Q\cdot d^{2}/u_{m}^{2}=10$
, colour coded with the instantaneous non-dimensional vertical velocity
 $u_{2}$
. (a) Test case 1, FVM; (b) test case 4, LBM.
$u_{2}$
. (a) Test case 1, FVM; (b) test case 4, LBM.
Table 1. Parameters of the test cases 1–4 (1–3: FVM; 4: LBM). Here,
 $d$
is the size of the bars, see figure 1,
$d$
is the size of the bars, see figure 1,
 $\mathit{Re}=u_{m}d/{\it\nu}=500$
,
$\mathit{Re}=u_{m}d/{\it\nu}=500$
,
 $s/d=2$
,
$s/d=2$
,
 ${\it\varphi}=0.88$
for all cases.
${\it\varphi}=0.88$
for all cases.

Figure 3 shows a turbulent flow structure in a part of the solution domain. Surfaces of constant values
 $Q\cdot d^{2}/u_{m}^{2}=10$
shown in this figure represent the vortex structure. The quantity
$Q\cdot d^{2}/u_{m}^{2}=10$
shown in this figure represent the vortex structure. The quantity
 $Q$
is the second invariant of the instantaneous velocity gradient tensor, which is defined by
$Q$
is the second invariant of the instantaneous velocity gradient tensor, which is defined by
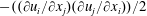 $-((\partial u_{i}/\partial x_{j})(\partial u_{j}/\partial x_{i}))/2$
for an incompressible flow. Figure 3 shows that for this value of
$-((\partial u_{i}/\partial x_{j})(\partial u_{j}/\partial x_{i}))/2$
for an incompressible flow. Figure 3 shows that for this value of
 $Q$
no large-scale structures can be identified; this also holds for larger
$Q$
no large-scale structures can be identified; this also holds for larger
 $Q$
values. Some of the turbulent structures may reach into neighbouring pores but they never extend far into the porous matrix. It should be noted that in figure 3 we show the same case (
$Q$
values. Some of the turbulent structures may reach into neighbouring pores but they never extend far into the porous matrix. It should be noted that in figure 3 we show the same case (
 $s/d=2$
and
$s/d=2$
and
 $\mathit{Re}=500$
) solved by the two DNS methods. Due to the relatively high resolution away from the walls the LBM results show more details of the small-scale structures compared with the FVM solution. Further details of the test case solutions are discussed in § 6 below.
$\mathit{Re}=500$
) solved by the two DNS methods. Due to the relatively high resolution away from the walls the LBM results show more details of the small-scale structures compared with the FVM solution. Further details of the test case solutions are discussed in § 6 below.

Figure 4. Two-point correlation
 $R_{11}/u_{m}^{2}$
in the computational domain for test case 1. The correlation point
$R_{11}/u_{m}^{2}$
in the computational domain for test case 1. The correlation point
 $\boldsymbol{x}_{0}$
is marked by the cross in the middle.
$\boldsymbol{x}_{0}$
is marked by the cross in the middle.
4.2. Two-point correlations
One way to detect turbulent structures and analyse their scales is to determine two-point correlations in the flow field. By this technique one looks at two quantities of the same kind in the flow field which are a certain distance
 $\boldsymbol{r}$
apart. When these quantities are subject to fluctuations (as in a turbulent flow), their fluctuations with respect to the corresponding time mean value
$\boldsymbol{r}$
apart. When these quantities are subject to fluctuations (as in a turbulent flow), their fluctuations with respect to the corresponding time mean value
 $\langle \cdots \rangle$
will have positive and negative values alike.
$\langle \cdots \rangle$
will have positive and negative values alike.
When
 $a$
is such a quantity, we write
$a$
is such a quantity, we write
 $a=\langle a\rangle +a^{\prime }$
with
$a=\langle a\rangle +a^{\prime }$
with
 $\langle a^{\prime }\rangle =0$
as a consequence of the splitting into time mean and fluctuating parts. When two such fluctuating quantities
$\langle a^{\prime }\rangle =0$
as a consequence of the splitting into time mean and fluctuating parts. When two such fluctuating quantities
 $a_{1}$
and
$a_{1}$
and
 $a_{2}$
are considered, we have
$a_{2}$
are considered, we have
 $\langle a_{1}^{\prime }\rangle =0$
and
$\langle a_{1}^{\prime }\rangle =0$
and
 $\langle a_{2}^{\prime }\rangle =0$
, but it is an open question how
$\langle a_{2}^{\prime }\rangle =0$
, but it is an open question how
 $\langle a_{1}^{\prime }a_{2}^{\prime }\rangle$
would behave. When
$\langle a_{1}^{\prime }a_{2}^{\prime }\rangle$
would behave. When
 $a_{1}$
and
$a_{1}$
and
 $a_{2}$
are totally uncorrelated, the chances for
$a_{2}$
are totally uncorrelated, the chances for
 $a_{1}^{\prime }a_{2}^{\prime }$
to be positive or negative are the same and thus
$a_{1}^{\prime }a_{2}^{\prime }$
to be positive or negative are the same and thus
 $\langle a_{1}^{\prime }a_{2}^{\prime }\rangle =0$
. When, however, a physical correlation of whatever kind exists, there will be a non-zero value of
$\langle a_{1}^{\prime }a_{2}^{\prime }\rangle =0$
. When, however, a physical correlation of whatever kind exists, there will be a non-zero value of
 $\langle a_{1}^{\prime }a_{2}^{\prime }\rangle$
indicating this correlation.
$\langle a_{1}^{\prime }a_{2}^{\prime }\rangle$
indicating this correlation.
The two-point correlation between the quantities
 $a_{i}^{\prime }(\boldsymbol{x})$
and
$a_{i}^{\prime }(\boldsymbol{x})$
and
 $a_{j}^{\prime }(\boldsymbol{x}_{0}+\boldsymbol{r})$
at a certain time
$a_{j}^{\prime }(\boldsymbol{x}_{0}+\boldsymbol{r})$
at a certain time
 $t$
is called a two-point one-time autocovariance (Pope Reference Pope2000) and it is defined as
$t$
is called a two-point one-time autocovariance (Pope Reference Pope2000) and it is defined as
 $$\begin{eqnarray}R_{ij}(\boldsymbol{r},\boldsymbol{x}_{0})=\langle a_{i}^{\prime }(\boldsymbol{x},t)a_{j}^{\prime }(\boldsymbol{x}_{0}+\boldsymbol{r},t)\rangle .\end{eqnarray}$$
When
 $u_{1}^{\prime }(\boldsymbol{x}_{0},t)$
and
$u_{1}^{\prime }(\boldsymbol{x}_{0},t)$
and
 $u_{1}^{\prime }(\boldsymbol{x}_{0}+\boldsymbol{r},t)$
are correlated, we have
$u_{1}^{\prime }(\boldsymbol{x}_{0}+\boldsymbol{r},t)$
are correlated, we have
 $$\begin{eqnarray}R_{11}(\boldsymbol{r},\boldsymbol{x}_{0})=\langle u_{1}^{\prime }(\boldsymbol{x}_{0},t)u_{1}^{\prime }(\boldsymbol{x}_{0}+\boldsymbol{r},t)\rangle .\end{eqnarray}$$
Figure 4 shows such correlation for test case 1 (see table 1) at
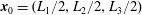 $\boldsymbol{x}_{0}=(L_{1}/2,L_{2}/2,L_{3}/2)$
, i.e. in the middle of the computational domain with
$\boldsymbol{x}_{0}=(L_{1}/2,L_{2}/2,L_{3}/2)$
, i.e. in the middle of the computational domain with
 $\boldsymbol{r}$
covering the whole (
$\boldsymbol{r}$
covering the whole (
 $x_{1},x_{2}$
) plane. From the colour coding it is evident that there is a strong correlation next to the point
$x_{1},x_{2}$
) plane. From the colour coding it is evident that there is a strong correlation next to the point
 $\boldsymbol{x}_{0}$
. However, there are also non-zero correlations around each obstacle irrespective of the distance to the correlation point
$\boldsymbol{x}_{0}$
. However, there are also non-zero correlations around each obstacle irrespective of the distance to the correlation point
 $\boldsymbol{x}_{0}$
. These correlations obviously appear due to the fact that a locally similar unsteady flow occurs around each of the individual obstacles. The appearance of these correlations is not due to the interaction with turbulent structures at
$\boldsymbol{x}_{0}$
. These correlations obviously appear due to the fact that a locally similar unsteady flow occurs around each of the individual obstacles. The appearance of these correlations is not due to the interaction with turbulent structures at
 $\boldsymbol{x}_{0}$
. Figure 3 shows that small turbulent structures build up around each obstacle, being confined to the pore of origin or its immediate vicinity. Thus, these small structures may affect the neighbouring pores but not those further away. Correlations in the far field are related to an almost two-dimensional vortex shedding blurred by turbulence, which occurs at all bars simultaneously. Figure 3(a,b) shows how such a vortex is formed all along the top bar. A similar kind of two-dimensional vortex shedding would also be found in laminar flow and, thus, we call the part of the two-point correlation that is not caused by turbulence a non-turbulent correlation.
$\boldsymbol{x}_{0}$
. Figure 3 shows that small turbulent structures build up around each obstacle, being confined to the pore of origin or its immediate vicinity. Thus, these small structures may affect the neighbouring pores but not those further away. Correlations in the far field are related to an almost two-dimensional vortex shedding blurred by turbulence, which occurs at all bars simultaneously. Figure 3(a,b) shows how such a vortex is formed all along the top bar. A similar kind of two-dimensional vortex shedding would also be found in laminar flow and, thus, we call the part of the two-point correlation that is not caused by turbulence a non-turbulent correlation.
The problem now is to distinguish the non-turbulent correlation from the true turbulent correlation that we are interested in. For this purpose we introduced a two-point lateral correlation, which for
 $u_{1}^{\prime }(\boldsymbol{x}_{0},t)$
and
$u_{1}^{\prime }(\boldsymbol{x}_{0},t)$
and
 $u_{1}^{\prime }(\boldsymbol{x}_{0}+\boldsymbol{r},t)$
, for example, is defined as
$u_{1}^{\prime }(\boldsymbol{x}_{0}+\boldsymbol{r},t)$
, for example, is defined as
 $$\begin{eqnarray}\tilde{R}_{11}(r_{3},\boldsymbol{r},\boldsymbol{x}_{0})=\langle u_{1}^{\prime }(\boldsymbol{x}_{0},t)u_{1}^{\prime }(\boldsymbol{x}_{0}+\boldsymbol{r}+r_{3}\boldsymbol{e}_{3},t)\rangle ,\end{eqnarray}$$
where
 $\boldsymbol{e}_{3}$
is the unit vector in the
$\boldsymbol{e}_{3}$
is the unit vector in the
 $x_{3}$
direction and
$x_{3}$
direction and
 $\boldsymbol{r}$
is a vector within the
$\boldsymbol{r}$
is a vector within the
 $(x_{1},x_{2})$
plane. Since it turned out that the non-turbulent correlation in the regular porous medium of our test cases is the same on all levels
$(x_{1},x_{2})$
plane. Since it turned out that the non-turbulent correlation in the regular porous medium of our test cases is the same on all levels
 $r_{3}$
, we can subtract
$r_{3}$
, we can subtract
 $\tilde{R}_{11}$
from
$\tilde{R}_{11}$
from
 $R_{11}$
and obtain the turbulent correlation providing that
$R_{11}$
and obtain the turbulent correlation providing that
 $r_{3}$
is sufficiently large. ‘Sufficiently large’ here means that the two correlation planes are sufficiently far apart so that there will be no correlation due to large-scale turbulent structures between them. Then
$r_{3}$
is sufficiently large. ‘Sufficiently large’ here means that the two correlation planes are sufficiently far apart so that there will be no correlation due to large-scale turbulent structures between them. Then
 $\tilde{R}_{11}(r_{3},\boldsymbol{r},\boldsymbol{x}_{0})$
according to (4.3) is the non-turbulent correlation.
$\tilde{R}_{11}(r_{3},\boldsymbol{r},\boldsymbol{x}_{0})$
according to (4.3) is the non-turbulent correlation.
Figure 5 shows
 $(R_{11}-\tilde{R}_{11})$
distributions for increasing values of
$(R_{11}-\tilde{R}_{11})$
distributions for increasing values of
 $r_{3}$
. Once
$r_{3}$
. Once
 $r_{3}$
is sufficiently large (here for
$r_{3}$
is sufficiently large (here for
 $r_{3}\geqslant 1.5d$
), there is no change in
$r_{3}\geqslant 1.5d$
), there is no change in
 $(R_{11}-\tilde{R}_{11})$
any more because then
$(R_{11}-\tilde{R}_{11})$
any more because then
 $r_{3}$
exceeds the length scale of the largest turbulent interactions. What is left is the turbulent correlation:
$r_{3}$
exceeds the length scale of the largest turbulent interactions. What is left is the turbulent correlation:
 $$\begin{eqnarray}\hat{R}_{11}(\boldsymbol{r},\boldsymbol{x}_{0})=R_{11}(\boldsymbol{r},\boldsymbol{x}_{0})-\tilde{R}_{11}(r_{3}>r_{3c},\boldsymbol{r},\boldsymbol{x}_{0}),\end{eqnarray}$$
where
 $r_{3c}$
is the critical value of
$r_{3c}$
is the critical value of
 $r_{3}$
up to which there is an influence of large-scale structures.
$r_{3}$
up to which there is an influence of large-scale structures.

Figure 5. Plots of
 $(R_{11}-\tilde{R}_{11})/u_{m}^{2}$
for different
$(R_{11}-\tilde{R}_{11})/u_{m}^{2}$
for different
 $r_{3}$
in the computational domain for test case 1 (
$r_{3}$
in the computational domain for test case 1 (
 $\mathit{Re}=500$
,
$\mathit{Re}=500$
,
 $s/d=2$
). The correlation point
$s/d=2$
). The correlation point
 $\boldsymbol{x}_{0}$
is marked by the cross in the middle. The zoomed contours inside the frame of figure 5(d) are shown in figure 6. (a)
$\boldsymbol{x}_{0}$
is marked by the cross in the middle. The zoomed contours inside the frame of figure 5(d) are shown in figure 6. (a)
 $r_{3}=0.2d$
; (b)
$r_{3}=0.2d$
; (b)
 $r_{3}=0.5d$
; (c)
$r_{3}=0.5d$
; (c)
 $r_{3}=1.5d$
; (d)
$r_{3}=1.5d$
; (d)
 $r_{3}=5d=L_{3}/2$
.
$r_{3}=5d=L_{3}/2$
.
In § 6.1 we will show
 $R_{ij}$
and
$R_{ij}$
and
 $\tilde{R}_{ij}$
for high-resolution data, demonstrating that their difference (which is denoted by
$\tilde{R}_{ij}$
for high-resolution data, demonstrating that their difference (which is denoted by
 $\hat{R}_{ij}$
) is non-zero only where turbulent correlations occur.
$\hat{R}_{ij}$
) is non-zero only where turbulent correlations occur.
Figure 6 shows three points within the flow field which are correlation points, with the point
 $\boldsymbol{x}_{0}$
of figures 4 and 5 being one of them. The (similar) isosurfaces
$\boldsymbol{x}_{0}$
of figures 4 and 5 being one of them. The (similar) isosurfaces
 $\hat{R}_{11}$
around these points show that the non-zero correlation extension is of the same order of magnitude (with
$\hat{R}_{11}$
around these points show that the non-zero correlation extension is of the same order of magnitude (with
 $\boldsymbol{x}_{0}$
having the largest area around it occupied by the same non-zero correlation values). This suggests that the point
$\boldsymbol{x}_{0}$
having the largest area around it occupied by the same non-zero correlation values). This suggests that the point
 $\boldsymbol{x}_{0}$
used thus far can indeed be taken as a representative correlation point.
$\boldsymbol{x}_{0}$
used thus far can indeed be taken as a representative correlation point.

Figure 6. Isosurfaces of
 $\hat{R}_{11}/u_{m}^{2}$
at three points; decreasing values for increasing distance from the correlation points, see the colour coding.
$\hat{R}_{11}/u_{m}^{2}$
at three points; decreasing values for increasing distance from the correlation points, see the colour coding.
4.3. Parameter variations
The low-resolution results obtained thus far were for the pore size
 $s/d=2$
and the Reynolds number
$s/d=2$
and the Reynolds number
 $\mathit{Re}=500$
. Both parameters should be varied systematically in order to determine their influence. We did this according to table 2, introducing the case labelling A–F.
$\mathit{Re}=500$
. Both parameters should be varied systematically in order to determine their influence. We did this according to table 2, introducing the case labelling A–F.
Table 2. Cases A–F for different pore sizes and Reynolds numbers. The test cases in table 1 all belong to case A.

So far case A has been determined in terms of low-resolution results; see table 1 for the four test cases of this category. In table 3 low-resolution solutions are shown for cases B–E, determined by the FVM approach. So far only the accuracy measures
 ${\it\Delta}$
are given. Details of the solutions will be discussed in § 6 below. Case F with the highest Reynolds number will be calculated only with high resolution after the trends of parameter influences for the five cases A–E have been determined.
${\it\Delta}$
are given. Details of the solutions will be discussed in § 6 below. Case F with the highest Reynolds number will be calculated only with high resolution after the trends of parameter influences for the five cases A–E have been determined.
Table 3. Cases B–E, low resolution (FVM).

4.4. Size determination for REV-T
As argued at the beginning of § 4, the minimum size of the REV-T can be determined from the low-resolution results and then used for the high-resolution calculations. On analysing the solutions obtained so far and especially looking at figure 5 it is evident that in all three directions only a few pore sizes
 $s$
are needed in order to define a solution domain large enough to avoid the suppression of large-scale turbulent structures. For further clarification, figure 7 shows the two-point correlations
$s$
are needed in order to define a solution domain large enough to avoid the suppression of large-scale turbulent structures. For further clarification, figure 7 shows the two-point correlations
 $R_{11}$
,
$R_{11}$
,
 $R_{22}$
and
$R_{22}$
and
 $R_{33}$
according to (4.1) of the three velocity fluctuation components
$R_{33}$
according to (4.1) of the three velocity fluctuation components
 $u_{1}^{\prime }$
,
$u_{1}^{\prime }$
,
 $u_{2}^{\prime }$
and
$u_{2}^{\prime }$
and
 $u_{3}^{\prime }$
in a plane
$u_{3}^{\prime }$
in a plane
 $x_{1}=L_{1}/2$
, for test case 1 in table 1. While
$x_{1}=L_{1}/2$
, for test case 1 in table 1. While
 $R_{11}$
and
$R_{11}$
and
 $R_{22}$
show correlations for velocities perpendicular to the bars of the porous matrix (and thus show a repeating pattern),
$R_{22}$
show correlations for velocities perpendicular to the bars of the porous matrix (and thus show a repeating pattern),
 $R_{33}$
is the correlation of a velocity component along the bars.
$R_{33}$
is the correlation of a velocity component along the bars.

Figure 7. Two-point correlations in the plane
 $x_{1}=L_{1}/2$
for test case 1, see table 1: (a)
$x_{1}=L_{1}/2$
for test case 1, see table 1: (a)
 $R_{11}/u_{m}^{2}$
; (b)
$R_{11}/u_{m}^{2}$
; (b)
 $R_{22}/u_{m}^{2}$
; (c)
$R_{22}/u_{m}^{2}$
; (c)
 $R_{33}/u_{m}^{2}$
.
$R_{33}/u_{m}^{2}$
.
In all three directions the limited range of the non-zero correlation values is clearly visible. Since the periodic boundary conditions on the domain boundaries are an unphysical constraint in the numerical solution process, we choose minimum solution domain sizes conservatively, to be ‘on the safe side’. Thus,
 $L_{3}/d$
can be set to a rather low value (
$L_{3}/d$
can be set to a rather low value (
 $L_{3}/d=4$
) for all subsequent calculations, see figure 7(a), where a
$L_{3}/d=4$
) for all subsequent calculations, see figure 7(a), where a
 $4d$
spacing is indicated by the two vertical lines. This is in accordance with a suggestion by Afgan et al. (Reference Afgan, Kahil, Benhamadouche and Sagaut2011), who also set
$4d$
spacing is indicated by the two vertical lines. This is in accordance with a suggestion by Afgan et al. (Reference Afgan, Kahil, Benhamadouche and Sagaut2011), who also set
 $L_{3}/d=4$
for simulations of a flow around a single cylinder or around two parallel cylinders. In the other two directions high-resolution results will be determined with
$L_{3}/d=4$
for simulations of a flow around a single cylinder or around two parallel cylinders. In the other two directions high-resolution results will be determined with
 $L_{1}/s=6$
and
$L_{1}/s=6$
and
 $L_{2}/s=4$
.
$L_{2}/s=4$
.
5. High-resolution results
In table 4 parameters and pressure gradient results of all high-resolution solutions are given, including the mesh resolution and accuracy measures for the FVM and LBM approaches respectively.
Table 4. Cases A–F, high resolution.

The domain size for all cases is such that
 $L_{1}/s=6$
and
$L_{1}/s=6$
and
 $L_{2}/s=4$
, so that for all cases there are 12 bars in the solution domain. Not all cases have been calculated with both methods; those for higher Reynolds numbers have been determined either by the FVM or by the LBM approach due to limited computer resources. Here, 36–123 million grid points were used in the FVM cases while 100–384 million grid points were used in the LBM cases. All calculations were performed at the North Germany Supercomputing Alliance (HLRN/Norddeutscher Verbund zur Förderung des Hoch- und Höchstleistungsrechnens) with 480 processors of the Cray XC30. The CPU time (processor number
$L_{2}/s=4$
, so that for all cases there are 12 bars in the solution domain. Not all cases have been calculated with both methods; those for higher Reynolds numbers have been determined either by the FVM or by the LBM approach due to limited computer resources. Here, 36–123 million grid points were used in the FVM cases while 100–384 million grid points were used in the LBM cases. All calculations were performed at the North Germany Supercomputing Alliance (HLRN/Norddeutscher Verbund zur Förderung des Hoch- und Höchstleistungsrechnens) with 480 processors of the Cray XC30. The CPU time (processor number
 $\times$
computing time) for one test case in table 4 varied between 25 000 and 58 000 h. More details with respect to the mesh resolution, time step and other computational details are given in appendix A.
$\times$
computing time) for one test case in table 4 varied between 25 000 and 58 000 h. More details with respect to the mesh resolution, time step and other computational details are given in appendix A.
The accuracy measure
 ${\it\Delta}$
shows values
${\it\Delta}$
shows values
 ${<}10\,\%$
, which has been set as the criterion for high-resolution results, see the end of § 3.3. The only exception from this rule is case C/FVM with
${<}10\,\%$
, which has been set as the criterion for high-resolution results, see the end of § 3.3. The only exception from this rule is case C/FVM with
 ${\it\Delta}=11.1\,\%$
. Since this is the case with the lowest value of
${\it\Delta}=11.1\,\%$
. Since this is the case with the lowest value of
 $s/d$
, the solution domain has the highest portion of near-wall areas. This is where DNS solutions cannot always meet the Kolmogorov condition
$s/d$
, the solution domain has the highest portion of near-wall areas. This is where DNS solutions cannot always meet the Kolmogorov condition
 ${\rm\Delta}x_{i}/{\it\eta}<1$
, so that more small-scale motions are missing in the integration of the local entropy generation (which leads to
${\rm\Delta}x_{i}/{\it\eta}<1$
, so that more small-scale motions are missing in the integration of the local entropy generation (which leads to
 $g_{s}$
) than in the other cases in table 4.
$g_{s}$
) than in the other cases in table 4.
Details of the solutions given in table 4 will be used in § 6. As an example, one snapshot of the instantaneous flow field in a part of the solution domain for case F with
 $\mathit{Re}=1000$
is shown in figure 8. The vortical structures are identified by the isosurfaces of
$\mathit{Re}=1000$
is shown in figure 8. The vortical structures are identified by the isosurfaces of
 $Q$
, now with
$Q$
, now with
 $Q\cdot d^{2}/u_{m}^{2}=1$
. Most of the large vortices have the same length scale as the pore size
$Q\cdot d^{2}/u_{m}^{2}=1$
. Most of the large vortices have the same length scale as the pore size
 $s$
(figure 8). The vortices in one REV-L element may have a slight influence only on the neighbouring elements.
$s$
(figure 8). The vortices in one REV-L element may have a slight influence only on the neighbouring elements.

Figure 8. Snapshot of parts of the flow field in two REV-L elements, case F (
 $\mathit{Re}=1000$
,
$\mathit{Re}=1000$
,
 $s/d=2$
), isosurfaces
$s/d=2$
), isosurfaces
 $Q\cdot d^{2}/u_{m}^{2}=1$
, colour coding with the instantaneous vertical velocity
$Q\cdot d^{2}/u_{m}^{2}=1$
, colour coding with the instantaneous vertical velocity
 $u_{2}$
.
$u_{2}$
.
6. Discussion of the results
All results obtained in this study will now be discussed with respect to the following two crucial questions.
-
(i) Is there macroscopic turbulence in porous media?
-
(ii) Can low-resolution DNS results be used to answer fundamental questions (like the one above)?
We will give a direct answer to the first question and indirectly address the second one. Both questions will be addressed by considering three aspects of the turbulent flow through porous media in the following three subsections.
6.1. Two-point turbulent correlations
Two-point correlations
 $\hat{R}_{ii}=R_{ii}-\tilde{R}_{ii}$
as a generalization of the two-point correlation
$\hat{R}_{ii}=R_{ii}-\tilde{R}_{ii}$
as a generalization of the two-point correlation
 $\hat{R}_{11}=R_{11}-\tilde{R}_{11}$
(see (4.4)) are characteristic quantities with respect to the range of impact of turbulent structures referred to a certain point
$\hat{R}_{11}=R_{11}-\tilde{R}_{11}$
(see (4.4)) are characteristic quantities with respect to the range of impact of turbulent structures referred to a certain point
 $\boldsymbol{x}_{0}$
in the flow field. So far they have been shown by colour coding in figures 5 and 7. A more accurate presentation will be given from now on in terms of
$\boldsymbol{x}_{0}$
in the flow field. So far they have been shown by colour coding in figures 5 and 7. A more accurate presentation will be given from now on in terms of
 $\hat{R}_{ii}$
distributions along a certain line in the flow field. According to their definitions (see (4.2) and (4.3) which define
$\hat{R}_{ii}$
distributions along a certain line in the flow field. According to their definitions (see (4.2) and (4.3) which define
 $R_{11}$
and
$R_{11}$
and
 $\tilde{R}_{11}$
respectively), the two correlations
$\tilde{R}_{11}$
respectively), the two correlations
 $R_{ii}$
and
$R_{ii}$
and
 $\tilde{R}_{ii}$
will differ from each other only when there are turbulent correlations in addition to the non-turbulent correlations. This means that when turbulent correlations vanish at large distances from the correlation point,
$\tilde{R}_{ii}$
will differ from each other only when there are turbulent correlations in addition to the non-turbulent correlations. This means that when turbulent correlations vanish at large distances from the correlation point,
 $R_{ii}$
and
$R_{ii}$
and
 $\tilde{R}_{ii}$
become equal. Figure 9 shows three two-point correlations,
$\tilde{R}_{ii}$
become equal. Figure 9 shows three two-point correlations,
 $R_{11}$
,
$R_{11}$
,
 $R_{22}$
and
$R_{22}$
and
 $R_{33}$
, as well as the corresponding two-point non-turbulent correlations,
$R_{33}$
, as well as the corresponding two-point non-turbulent correlations,
 $\tilde{R}_{11}$
,
$\tilde{R}_{11}$
,
 $\tilde{R}_{22}$
and
$\tilde{R}_{22}$
and
 $\tilde{R}_{33}$
, in both directions (see figure 9
a–c for the streamwise direction and figure 9
d–f for the transverse
$\tilde{R}_{33}$
, in both directions (see figure 9
a–c for the streamwise direction and figure 9
d–f for the transverse
 $x_{2}$
direction). Outside one pore size
$x_{2}$
direction). Outside one pore size
 $R_{ii}$
and
$R_{ii}$
and
 $\tilde{R}_{ii}$
are virtually equal, which in figures 10–13 for
$\tilde{R}_{ii}$
are virtually equal, which in figures 10–13 for
 $\hat{R}_{ii}=R_{ii}-\tilde{R}_{ii}$
leads to zero values of
$\hat{R}_{ii}=R_{ii}-\tilde{R}_{ii}$
leads to zero values of
 $\hat{R}_{ii}$
for distances greater than
$\hat{R}_{ii}$
for distances greater than
 $s$
away from the correlation point.
$s$
away from the correlation point.

Figure 9. Two-point and non-turbulent two-point correlations in the streamwise direction (a–c) and transverse
 $x_{2}$
direction (d–f). The reference point is in the centre of the solution domain (
$x_{2}$
direction (d–f). The reference point is in the centre of the solution domain (
 $x_{10}$
,
$x_{10}$
,
 $x_{20}$
),
$x_{20}$
),
 $\mathit{Re}=500$
,
$\mathit{Re}=500$
,
 $s/d=2$
, high-resolution LBM results. Here, —— indicates two-point correlations; – – – indicates non-turbulent two-point correlations.
$s/d=2$
, high-resolution LBM results. Here, —— indicates two-point correlations; – – – indicates non-turbulent two-point correlations.

Figure 10. Turbulent two-point correlations in the streamwise direction (a–c) and transverse
 $x_{2}$
direction (e–f). The reference point is in the centre of the solution domain (
$x_{2}$
direction (e–f). The reference point is in the centre of the solution domain (
 $x_{10},x_{20}$
), the domain size is
$x_{10},x_{20}$
), the domain size is
 $6s\times 4s\times 4d$
,
$6s\times 4s\times 4d$
,
 $\mathit{Re}=500$
,
$\mathit{Re}=500$
,
 $s/d=2$
. Here, —— indicates high-resolution FVM results, case A, see table 4; – – – indicates low-resolution FVM results, test case 2, see table 1; – ⋅ – ⋅ – indicates high-resolution LBM results, case A, see table 4.
$s/d=2$
. Here, —— indicates high-resolution FVM results, case A, see table 4; – – – indicates low-resolution FVM results, test case 2, see table 1; – ⋅ – ⋅ – indicates high-resolution LBM results, case A, see table 4.

Figure 11. Turbulent two-point correlations in the streamwise direction (a–c) and transverse
 $x_{2}$
direction (e–f). The reference point is in the centre of the solution domain (
$x_{2}$
direction (e–f). The reference point is in the centre of the solution domain (
 $x_{10},x_{20}$
),
$x_{10},x_{20}$
),
 $\mathit{Re}=500$
,
$\mathit{Re}=500$
,
 $s/d=2$
, low-resolution FVM results. Various line types indicate different domain size
$s/d=2$
, low-resolution FVM results. Various line types indicate different domain size
 $L_{1}\times L_{2}\times L_{3}$
. Here, —— indicates
$L_{1}\times L_{2}\times L_{3}$
. Here, —— indicates
 $20d\times 20d\times 10d$
, – – – indicates
$20d\times 20d\times 10d$
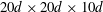
, – – – indicates
 $12d\times 8d\times 4d$
and - - - - - indicates
$12d\times 8d\times 4d$
and - - - - - indicates
 $12d\times 4d\times 4d$
, i.e. test cases 1–3 respectively (table 1); – ⋅ – ⋅ – indicates
$12d\times 4d\times 4d$
, i.e. test cases 1–3 respectively (table 1); – ⋅ – ⋅ – indicates
 $8d\times 8d\times 4d$
and — ⋅ ⋅ — indicates
$8d\times 8d\times 4d$
and — ⋅ ⋅ — indicates
 $4d\times 4d\times 4d$
.
$4d\times 4d\times 4d$
.

Figure 12. Turbulent two-point correlations in the streamwise direction (a–c) and transverse
 $x_{2}$
direction (e–f). The reference point is in the centre of the solution domain (
$x_{2}$
direction (e–f). The reference point is in the centre of the solution domain (
 $x_{10},x_{20}$
), pore size variations,
$x_{10},x_{20}$
), pore size variations,
 $\mathit{Re}=500$
, high-resolution FVM results. Here, —— indicates
$\mathit{Re}=500$
, high-resolution FVM results. Here, —— indicates
 $s/d=1.5$
(
$s/d=1.5$
(
 ${\it\varphi}=0.78$
, case C/FVM), – – – indicates
${\it\varphi}=0.78$
, case C/FVM), – – – indicates
 $s/d=2$
(
$s/d=2$
(
 ${\it\varphi}=0.88$
, case A/FVM) and – ⋅ – ⋅ – indicates
${\it\varphi}=0.88$
, case A/FVM) and – ⋅ – ⋅ – indicates
 $s/d=3$
(
$s/d=3$
(
 ${\it\varphi}=0.94$
, case B/FVM).
${\it\varphi}=0.94$
, case B/FVM).

Figure 13. Turbulent two-point correlations in the streamwise direction (a–c) and transverse
 $x_{2}$
direction (e–f). The reference point is in the centre of the solution domain (
$x_{2}$
direction (e–f). The reference point is in the centre of the solution domain (
 $x_{10},x_{20}$
), Reynolds number variations,
$x_{10},x_{20}$
), Reynolds number variations,
 $s/d=2$
, high-resolution FVM results. Here, —— indicates
$s/d=2$
, high-resolution FVM results. Here, —— indicates
 $\mathit{Re}=500$
(case A/FVM), – – – indicates
$\mathit{Re}=500$
(case A/FVM), – – – indicates
 $\mathit{Re}=600$
(case D/FVM) and – ⋅ – ⋅ – indicates
$\mathit{Re}=600$
(case D/FVM) and – ⋅ – ⋅ – indicates
 $\mathit{Re}=700$
(case E/FVM).
$\mathit{Re}=700$
(case E/FVM).
In figure 10 we show that the typical correlations
 $\hat{R}_{ii}$
in the streamwise direction (
$\hat{R}_{ii}$
in the streamwise direction (
 $x_{1}$
direction) and in the transverse direction (
$x_{1}$
direction) and in the transverse direction (
 $x_{2}$
direction) are very similar, at least with respect to the range of non-zero values. They all are virtually zero beyond
$x_{2}$
direction) are very similar, at least with respect to the range of non-zero values. They all are virtually zero beyond
 $|(x_{i}-x_{i0})|/s>1$
, i.e. they drop to zero over a length of one pore scale
$|(x_{i}-x_{i0})|/s>1$
, i.e. they drop to zero over a length of one pore scale
 $s$
, indicating that the largest turbulent structures are of that size. Small non-zero values may occur when some turbulent structures reach into neighbouring pores.
$s$
, indicating that the largest turbulent structures are of that size. Small non-zero values may occur when some turbulent structures reach into neighbouring pores.
Figure 11 shows
 $\hat{R}_{ii}$
for the same parameter values,
$\hat{R}_{ii}$
for the same parameter values,
 $\mathit{Re}=500$
and
$\mathit{Re}=500$
and
 $s/d=2$
, but for different sizes of the solution domain. They are those of the test cases 1–3, see table 1, and in addition two cases with even smaller domain sizes (
$s/d=2$
, but for different sizes of the solution domain. They are those of the test cases 1–3, see table 1, and in addition two cases with even smaller domain sizes (
 $8d\times 8d\times 4d$
and
$8d\times 8d\times 4d$
and
 $4d\times 4d\times 4d$
). For all five cases the
$4d\times 4d\times 4d$
). For all five cases the
 $\hat{R}_{ii}$
distributions are very similar, which confirms our assumption of being on the safe side with our choice of the domain size for the high-resolution cases A–F in table 4.
$\hat{R}_{ii}$
distributions are very similar, which confirms our assumption of being on the safe side with our choice of the domain size for the high-resolution cases A–F in table 4.
Figure 12 shows the effect of a variation of the pore size (or porosity), while figure 13 shows the effect of a Reynolds number variation. Variations of either parameter only marginally influence the
 $\hat{R}_{ii}$
distributions. With an increasing pore size
$\hat{R}_{ii}$
distributions. With an increasing pore size
 $s$
(or porosity
$s$
(or porosity
 ${\it\varphi}$
), the distributions of
${\it\varphi}$
), the distributions of
 $\hat{R}_{22}$
and
$\hat{R}_{22}$
and
 $\hat{R}_{33}$
in the
$\hat{R}_{33}$
in the
 $x_{1}$
direction become slightly wider. However, their non-zero values are still only found in the REV-L domain, which means that
$x_{1}$
direction become slightly wider. However, their non-zero values are still only found in the REV-L domain, which means that
 $|x_{1}-x_{10}|\leqslant s$
(see figure 12
b,c). Altogether, the two-point correlations indicate that the scales of the turbulent structures are of the pore size
$|x_{1}-x_{10}|\leqslant s$
(see figure 12
b,c). Altogether, the two-point correlations indicate that the scales of the turbulent structures are of the pore size
 $s$
.
$s$
.
6.2. Integral length scales
Another way to quantify the size of large eddies is to determine their integral length scales. These length scales are defined as longitudinal, transverse and spanwise lengths
 $L_{ii}$
, similar to the definitions in Pope (Reference Pope2000) for homogeneous and isotropic turbulent flows:
$L_{ii}$
, similar to the definitions in Pope (Reference Pope2000) for homogeneous and isotropic turbulent flows:
 $$\begin{eqnarray}\displaystyle & \displaystyle L_{11}=\int _{-\infty }^{\infty }\hat{R}_{11}(r_{1}\boldsymbol{e}_{1},\boldsymbol{x}_{0})/\hat{u} _{1}^{\prime 2}(\boldsymbol{x}_{0})\text{d}r_{1}, & \displaystyle\end{eqnarray}$$
 $$\begin{eqnarray}\displaystyle & \displaystyle L_{22}=\int _{-\infty }^{\infty }\hat{R}_{22}(r_{1}\boldsymbol{e}_{1},\boldsymbol{x}_{0})/\hat{u} _{2}^{\prime 2}(\boldsymbol{x}_{0})\text{d}r_{1}, & \displaystyle\end{eqnarray}$$
 $$\begin{eqnarray}\displaystyle & \displaystyle L_{33}=\int _{-\infty }^{\infty }\hat{R}_{33}(r_{1}\boldsymbol{e}_{1},\boldsymbol{x}_{0})/\hat{u} _{3}^{\prime 2}(r_{0})\text{d}x_{1}, & \displaystyle\end{eqnarray}$$
 $\hat{u} _{i}^{\prime }(\boldsymbol{x}_{0})$
is the root-mean-square (r.m.s.) turbulent velocity component, which can be calculated as
$\hat{u} _{i}^{\prime }(\boldsymbol{x}_{0})$
is the root-mean-square (r.m.s.) turbulent velocity component, which can be calculated as  $$\begin{eqnarray}\hat{u} _{i}^{\prime }(\boldsymbol{x}_{0})=\hat{R}_{ii}(0,\boldsymbol{x}_{0})^{1/2}.\end{eqnarray}$$
We use these definitions despite the fact that the flow through porous media is not one with isotropic and homogeneous turbulence. However, since we are only interested in the order of magnitude of these length scales (pore or domain size), we assumed that the
 $L_{ii}$
length scales obtained from (6.1)–(6.3) are of the same order of magnitude as the corresponding length scales of the non-isotropic turbulence prevailing in porous medium flows.
$L_{ii}$
length scales obtained from (6.1)–(6.3) are of the same order of magnitude as the corresponding length scales of the non-isotropic turbulence prevailing in porous medium flows.
Table 5 gives length scale values for all cases A–F from table 4 (high-resolution results), non-dimensionalized with the pore scale
 $s$
. The length scale
$s$
. The length scale
 $L_{11}/s$
is larger than the other two length scales for all the cases. As the pore size
$L_{11}/s$
is larger than the other two length scales for all the cases. As the pore size
 $s$
is increased from
$s$
is increased from
 $1.5d$
to
$1.5d$
to
 $3d$
(or the porosity
$3d$
(or the porosity
 ${\it\varphi}$
is increased from 0.78 to 0.94), the values of
${\it\varphi}$
is increased from 0.78 to 0.94), the values of
 $L_{22}/s$
and
$L_{22}/s$
and
 $L_{33}/s$
increase moderately, but they are still smaller than 1 (see these values for cases B/FVM and C/FVM in table 5). Altogether, the integral length scale data again indicate that the scales of the turbulent structures are of the pore size
$L_{33}/s$
increase moderately, but they are still smaller than 1 (see these values for cases B/FVM and C/FVM in table 5). Altogether, the integral length scale data again indicate that the scales of the turbulent structures are of the pore size
 $s$
.
$s$
.

6.3. Energy spectra and their premultiplied form
For sufficiently high Reynolds numbers energy spectra have been derived by Kolmogorov (Reference Kolmogorov1941) under the assumption of locally homogeneous and isotropic turbulence being statistically in equilibrium. They are
 $$\begin{eqnarray}\hat{E}_{ii}(\boldsymbol{x}_{0},k_{1})=\frac{1}{{\rm\pi}}\int _{-\infty }^{\infty }\hat{R}_{ii}(x_{1}\boldsymbol{e}_{1},\,\boldsymbol{x}_{0})\exp (-\text{i}k_{1}x_{1})\text{d}x_{1}.\end{eqnarray}$$
Again, as an approximation, we use this definition, although the flow through porous media is not one with isotropic and homogeneous turbulence. Figure 14 shows these spectra for the low Reynolds number
 $\mathit{Re}=500$
and
$\mathit{Re}=500$
and
 $s/d=2$
for three solutions. An indication of a sufficiently high Reynolds number is a distinct inertia range with a slope of
$s/d=2$
for three solutions. An indication of a sufficiently high Reynolds number is a distinct inertia range with a slope of
 $-5/3$
, shown by the straight lines in figure 14. Figure 15(a–c) shows that this region becomes more pronounced for larger Reynolds numbers, when
$-5/3$
, shown by the straight lines in figure 14. Figure 15(a–c) shows that this region becomes more pronounced for larger Reynolds numbers, when
 $\mathit{Re}$
is increased from 500 to 1000.
$\mathit{Re}$
is increased from 500 to 1000.

Figure 14. Energy spectra of the turbulent motions obtained from (6.5) for different cases,
 $\mathit{Re}=500$
,
$\mathit{Re}=500$
,
 $s/d=2$
:
$s/d=2$
:
 $\circ$
 $\circ$
 $\circ$
 $\circ$
 $\circ$
 $\circ$
, high-resolution FVM results, case A (table 4);
$\circ$
, high-resolution FVM results, case A (table 4);
 $\times \!\times \!\times \!\times \!\times \!\times$
, low-resolution FVM results, case 2 (table 1);
$\times \!\times \!\times \!\times \!\times \!\times$
, low-resolution FVM results, case 2 (table 1);
 $+\!+\!+\!+\!+\!+$
, high-resolution LBM results, case A (table 4).
$+\!+\!+\!+\!+\!+$
, high-resolution LBM results, case A (table 4).

Figure 15. Energy spectra of the turbulent motions according to (6.5) for increasing Reynolds numbers;
 $s/d=2$
, high-resolution results. (a–c) Energy spectra; (d–f) premultiplied energy spectra;
$s/d=2$
, high-resolution results. (a–c) Energy spectra; (d–f) premultiplied energy spectra;
 $+\!+\!+\!+\!+\!+$
,
$+\!+\!+\!+\!+\!+$
,
 $\mathit{Re}=500$
(case A/LBM);
$\mathit{Re}=500$
(case A/LBM);
 $\times \!\times \!\times \!\times \!\times \!\times$
,
$\times \!\times \!\times \!\times \!\times \!\times$
,
 $\mathit{Re}=700$
(case E/FVM);
$\mathit{Re}=700$
(case E/FVM);
 $\circ$
 $\circ$
 $\circ$
 $\circ$
 $\circ$
 $\circ$
,
$\circ$
,
 $\mathit{Re}=1000$
(case F/LBM).
$\mathit{Re}=1000$
(case F/LBM).
The energy spectra in figure 15(a–c) are multiplied by
 $k_{1}s$
and plotted on semi-logarithmic axes in figure 15(d–f); these are also called premultiplied energy spectra. For pipe/channel flows, Jimenez (Reference Jimenez1998) suggests the use of this type of plot to identify the
$k_{1}s$
and plotted on semi-logarithmic axes in figure 15(d–f); these are also called premultiplied energy spectra. For pipe/channel flows, Jimenez (Reference Jimenez1998) suggests the use of this type of plot to identify the
 $k_{1}^{-1}$
range, in which
$k_{1}^{-1}$
range, in which
 $k_{1}\hat{E}_{11}\approx \text{constant}$
. Guala, Hommema & Adrian (Reference Guala, Hommema and Adrian2006) and Balakumar & Adrian (Reference Balakumar and Adrian2007) indicate that two peaks in the
$k_{1}\hat{E}_{11}\approx \text{constant}$
. Guala, Hommema & Adrian (Reference Guala, Hommema and Adrian2006) and Balakumar & Adrian (Reference Balakumar and Adrian2007) indicate that two peaks in the
 $k_{1}^{-1}$
range represent the very-large-scale motions (VLSMs) which have the maximum wavelength and the large-scale motions (LSM) which have the minimum wavelength.
$k_{1}^{-1}$
range represent the very-large-scale motions (VLSMs) which have the maximum wavelength and the large-scale motions (LSM) which have the minimum wavelength.
In our study, a region of
 $k_{1}\hat{E}_{11}\approx \text{constant}$
can also be found (see figure 15
d), which may indicate the range of large-scale turbulent motions. The peak of
$k_{1}\hat{E}_{11}\approx \text{constant}$
can also be found (see figure 15
d), which may indicate the range of large-scale turbulent motions. The peak of
 $k_{1}\hat{E}_{11}$
with the maximum wavelength of
$k_{1}\hat{E}_{11}$
with the maximum wavelength of
 ${\rm\Lambda}=2{\rm\pi}/k_{1}\approx 2s$
(the corresponding wavenumber
${\rm\Lambda}=2{\rm\pi}/k_{1}\approx 2s$
(the corresponding wavenumber
 $k_{1}\approx 3/s$
), which is the same as the size of an REV-L element. With increasing Reynolds number, the energy carried by large-scale motions becomes lower, suggesting that the large-scale turbulence motions are even less important at larger
$k_{1}\approx 3/s$
), which is the same as the size of an REV-L element. With increasing Reynolds number, the energy carried by large-scale motions becomes lower, suggesting that the large-scale turbulence motions are even less important at larger
 $\mathit{Re}$
. The maximum wavelengths corresponding to the peaks for
$\mathit{Re}$
. The maximum wavelengths corresponding to the peaks for
 $k_{1}\hat{E}_{22}$
and
$k_{1}\hat{E}_{22}$
and
 $k_{1}\hat{E}_{33}$
are approximately
$k_{1}\hat{E}_{33}$
are approximately
 $1.25s$
.
$1.25s$
.
The effects of the pore size
 $s$
(or porosity
$s$
(or porosity
 ${\it\varphi}$
) on the energy spectra and the premultiplied energy spectra are shown in figure 16. Similar inertia ranges can be observed in all three test cases (see figure 16
a–c). As the pore size
${\it\varphi}$
) on the energy spectra and the premultiplied energy spectra are shown in figure 16. Similar inertia ranges can be observed in all three test cases (see figure 16
a–c). As the pore size
 $s$
is increased from
$s$
is increased from
 $1.5d$
to
$1.5d$
to
 $3d$
(or porosity
$3d$
(or porosity
 ${\it\varphi}$
is increased from 0.78 to 0.94), the maximum wavelengths corresponding to the peaks for
${\it\varphi}$
is increased from 0.78 to 0.94), the maximum wavelengths corresponding to the peaks for
 $k_{1}\hat{E}_{11}$
,
$k_{1}\hat{E}_{11}$
,
 $k_{1}\hat{E}_{22}$
and
$k_{1}\hat{E}_{22}$
and
 $k_{1}\hat{E}_{33}$
are slightly increased (see figure 16
d–f), but they never exceed the size of an REV-L element,
$k_{1}\hat{E}_{33}$
are slightly increased (see figure 16
d–f), but they never exceed the size of an REV-L element,
 $2s$
. Altogether, the energy spectra data support the previous findings that turbulent structures are of the pore size scale
$2s$
. Altogether, the energy spectra data support the previous findings that turbulent structures are of the pore size scale
 $s$
.
$s$
.

Figure 16. Energy spectra of the turbulent motions according to (6.5) for different pore sizes;
 $\mathit{Re}=500$
, high-resolution results. (a–c) Energy spectra; (d–f) premultiplied energy spectra;
$\mathit{Re}=500$
, high-resolution results. (a–c) Energy spectra; (d–f) premultiplied energy spectra;
 $\times \!\times \!\times \!\times \!\times \!\times$
,
$\times \!\times \!\times \!\times \!\times \!\times$
,
 $s/d=1.5$
(
$s/d=1.5$
(
 ${\it\varphi}=0.78$
, case A/FVM);
${\it\varphi}=0.78$
, case A/FVM);
 $+\!+\!+\!+\!+\!+$
,
$+\!+\!+\!+\!+\!+$
,
 $s/d=2$
(
$s/d=2$
(
 ${\it\varphi}=0.88$
, case A/LBM);
${\it\varphi}=0.88$
, case A/LBM);
 $\circ$
 $\circ$
 $\circ$
 $\circ$
 $\circ$
 $\circ$
,
$\circ$
,
 $s/d=3$
(
$s/d=3$
(
 ${\it\varphi}=0.94$
, case FVM).
${\it\varphi}=0.94$
, case FVM).
7. Conclusions
We believe that the results obtained in this study can provide the answer to the question of whether or not macroscopic turbulence exists in porous media, even though a special generic matrix was defined and used in all calculations. The underlying assumption is that there is no fundamental qualitatively different flow behaviour when the porous matrix is changed from two-dimensional regular to three-dimensional irregular geometry. As we have shown, the pore size restricts the size of turbulent structures even in a two-dimensional matrix unrestricted in the third dimension. We expect that a three-dimensional matrix will not weaken or even eliminate these restrictions on the size of turbulent structures. Irregularities in pore sizes and shapes may lead to locally different restrictions but not to their disappearance as a whole. Our porous matrix is not very tortuous; its tortuosity is close to unity. However, we expect that increasing tortuosity will further dampen any possible macroscopic turbulence.
The analysis of all DNS data obtained in this study shows that the sizes of turbulent structures do not extend far beyond the pore scale. This agrees with the prediction made in Nield (Reference Nield1991) and asserted in Nield & Bejan (Reference Nield and Bejan1992, p. 8). We further found that certain turbulent structures may have a slight impact on immediately neighbouring pores. This impact, however, decays further away so that no large-scale structures prevail. This statement is in accordance with all two-point correlation data (see figures 5 and 10–13), all approximate integral length scale data (see table 5) and all energy spectrum data (see figure 14). This general finding is visualized by the snapshot in figure 8 showing turbulent structures of various sizes, all of them limited in their extension to values well beyond the pore scale
 $s$
.
$s$
.
Our low- and high-resolution DNS results also show that missing the turbulent fine scales due to an insufficient numerical resolution nevertheless allows conclusions about the large turbulent scales. Obviously, turbulent backscatter is weak so that, for example, the two-point correlations for the case A/FVM with the accuracy measure
 ${\it\Delta}=5.3\,\%$
are similar to those of the test case 2 with
${\it\Delta}=5.3\,\%$
are similar to those of the test case 2 with
 ${\it\Delta}=38\,\%$
, as can be seen in figure 10. Details such as the high-wavenumber energy content, however, are very sensitive to the fine-scale resolution, as can be seen in figure 14 comparing low- and high-resolution energy spectrum data.
${\it\Delta}=38\,\%$
, as can be seen in figure 10. Details such as the high-wavenumber energy content, however, are very sensitive to the fine-scale resolution, as can be seen in figure 14 comparing low- and high-resolution energy spectrum data.
Future studies should address increase of the Reynolds number beyond 1000, which was the maximum Reynolds number used in our study. The periodicity and two-dimensionality of the solid matrix used in this research should also be relaxed. Porous media with larger tortuosity could also be considered.
Table 6. Details of the mesh resolution for the FVM cases:
 $(\dots )_{w}$
, near the wall;
$(\dots )_{w}$
, near the wall;
 $(\dots )_{c}$
, near the centre of an REV-L. ‘
$(\dots )_{c}$
, near the centre of an REV-L. ‘
 ${\rm\Delta}x_{3}$
’ was uniformly distributed.
${\rm\Delta}x_{3}$
’ was uniformly distributed.

Acknowledgements
The authors gratefully acknowledge the support of this study by the DFG (Deutsche Forschungsgemeinschaft) and the HLRN (North-German Supercomputing Alliance). All the parallel computations in the present study were performed at the HLRN. A.V.K. acknowledges with gratitude the support of the Alexander von Humboldt Foundation through the Humboldt Research Award.
Appendix A
The meshes for the FVM cases are body fitted and are concentrated near the wall, while they are uniformly distributed for the LBM cases. More details, such as the ratios of the cell size
 ${\rm\Delta}x_{i}$
to the obstacle size
${\rm\Delta}x_{i}$
to the obstacle size
 $d$
near the wall and near the channel centre, are given in table 6.
$d$
near the wall and near the channel centre, are given in table 6.
Two kinds of initial conditions have been tested in our study. The first one is the uniform velocity field plus a sinusoidal perturbation which has the form
 $$\begin{eqnarray}u_{i}(x_{j})=u_{m}+A_{1i}\sin ({\it\varphi}_{1i}x_{j})+A_{2i}\sin ({\it\varphi}_{2i}x_{j})+A_{3i}\sin ({\it\varphi}_{3i}x_{j})+A_{4i}\sin ({\it\varphi}_{4i}x_{j}),\end{eqnarray}$$
where
 $u_{m}$
is the mean velocity shown in figure 1. Here,
$u_{m}$
is the mean velocity shown in figure 1. Here,
 $A_{ki}$
and
$A_{ki}$
and
 ${\it\varphi}_{ki}$
are parameters of an artificial perturbation. The second type of initial condition is an interpolation of the initial field from another fully developed turbulent flow. Our numerical simulations show that the statistical results of the fully developed flow field are not influenced by the initial field.
${\it\varphi}_{ki}$
are parameters of an artificial perturbation. The second type of initial condition is an interpolation of the initial field from another fully developed turbulent flow. Our numerical simulations show that the statistical results of the fully developed flow field are not influenced by the initial field.
The time steps for the LBM cases are 0.000625 non-dimensional time units for
 $\mathit{Re}=500$
(test cases A–C) and 0.0003 non-dimensional time units for
$\mathit{Re}=500$
(test cases A–C) and 0.0003 non-dimensional time units for
 $\mathit{Re}=1000$
(test case F). Here, the time is normalized by
$\mathit{Re}=1000$
(test case F). Here, the time is normalized by
 $d/u_{m}$
. A larger time step (
$d/u_{m}$
. A larger time step (
 ${\rm\Delta}t=0.01$
) is used in our FVM cases since an implicit backward Euler method is employed for time marching. The test cases were computed until the statistical values, such as the turbulent two-point correlations, did not change with time any more. This process usually needs the computation of 250 wash-out cycles in one REV-L element, which is 1000 time units in case A, for example.
${\rm\Delta}t=0.01$
) is used in our FVM cases since an implicit backward Euler method is employed for time marching. The test cases were computed until the statistical values, such as the turbulent two-point correlations, did not change with time any more. This process usually needs the computation of 250 wash-out cycles in one REV-L element, which is 1000 time units in case A, for example.


