How does partisan affiliation influence evaluations of “in-name-only” candidates? Political scientists have long engaged with the question of how partisan affiliation structures candidate evaluations (Campbell et al., Reference Campbell, Converse, Miller and Stokes1960; Greene, Reference Greene1999; Green et al., Reference Green, Palmquist and Schickler2002). The consensus from this literature is that if a voter is a member of the same political party as a candidate, she is more likely to vote for that candidate. In this view, partisan identity straightforwardly predicts candidate evaluation. However, what happens when a candidate’s policy positions conflict with their partisan identification?
The relationship between shared partisanship and candidate evaluations may be less straightforward than previously thought in the case of “in-name-only” candidates. Social psychological research on prototypicality perceptions (e.g., how representative an individual is of group norms and values) suggests that group members punish less representative, non-prototypical members (Kleef et al., Reference Kleef2007; Steinel et al., Reference Steinel, Van Kleef, Van Knippenberg, Hogg, Homan and Moffitt2010). Relatedly, political science research suggests that under some conditions, when candidates defy party platform, they are punished (Arceneaux, Reference Arceneaux2008).
In this article, I integrate research on the psychology of group prototypes (Hais et al., Reference Hais, Hogg and Duck1997; Hogg, Reference Hogg2001) with research on party identification (Fiorina, Reference Fiorina1976; Huddy et al., Reference Huddy, Mason and Aarøe2015; Rahn, Reference Rahn1993) to explain how citizens evaluate ideologically “impure” candidates. Because candidates frequently level the RINO and DINO charge at ideologically more moderate opponents particularly in primary season,Footnote 1 it is important to evaluate whether and to what extent the “otherness” criticism implicit in the “RINO–DINO” charge hurts candidates electorally.
I anticipate that individuals will be less likely to vote for and feel warm toward a prototype-defying copartisan candidate. However, it is unclear how identity strength conditions severity of punishment. To the extent that party membership reflects instrumental concerns over policy outcomes (Fiorina, Reference Fiorina1976), it might be that strong partisans evaluate prototype-violating copartisans negatively. Alternatively, it might be that the psychological pull of group attachment overrides concerns over ideological purity (Huddy et al., Reference Huddy, Mason and Aarøe2015).
To test these competing predictions, I examined data from an experimental module on the 2014 Cooperative Congressional Election Study (CCES). Specifically, I presented respondents with a series of issue stances of a hypothetical candidate. I manipulated the candidate’s party affiliation and prototypicality, reversing the candidate’s position on four of seven policy issues to mirror those of the outparty. I subsequently assessed respondents’ prototype perceptions, candidate affect, and vote intentions. I present evidence that (a) partisans negatively evaluate non-prototypical copartisans, (b) strength of partisan affiliation is not consistently related to degree of punishment, and (c) non-prototypicality creates convergence in candidate support among Republicans and Democrats.
In what follows, I first survey the psychological literature on prototypicality and the political science scholarship on party identification. I proceed to discuss survey design, methodology, and my empirical results. I conclude by considering the implications of my findings for future research.
PARTY PROTOTYPES AND GROUP IDENTIFICATION
Former Senator Jim Webb (D – Virginia), a candidate in the 2016 Democratic Party presidential primary, withdrew from the race in October 2015. In the press conference in which he announced his exit, Senator Webb noted, “I fully accept that my views on many issues are not compatible with the power structure and base of the Democratic Party. For this reason I am withdrawing from any consideration of being the Democratic Party’s nominee for the presidency” (Gass and Strauss, Reference Gass and Strauss2015). In national public opinion polls, Webb failed to attract appreciable support among registered Democrats and likely-Democratic voters (Kiley, Reference Kiley2015). Conversely, Donald Trump (R) was a candidate for the 2016 Republican Party presidential primary who secured the party’s nomination and eventually the presidency, despite occasionally deviating from conservative orthodoxy. Noting his own departure from mainstream conservative ideology, then-candidate Trump remarked in an interview, “This is the Republican Party, it’s not called the Conservative Party” (Shapiro, Reference Shapiro2016).
These distinct narratives of electoral failure and success raise questions about the electoral cost of ideological purity and the weight voters give ideological considerations in an increasingly ideologically sorted political landscape. How are perceptions of ideological purity formed, who cares about ideological purity, and does ideological impurity influence candidate support?
Social-categorization theory posits that when an individual becomes a member of a group, she develops prototype perceptions of the ingroup (Smith and Zarate, Reference Smith and Zarate1990; Schmitt and Branscombe, Reference Schmitt and Branscombe2001). As Hogg states, “The process of social categorization perceptually segments the social world into ingroups and outgroups that are cognitively represented as prototypes. These prototypes are context specific, multidimensional fuzzy sets of attributes that define and prescribe attitudes, feelings, and behaviors that characterize one group and distinguish it from other groups” (187: Reference Hogg2001). A group member who is a pure prototype perfectly embodies the values and norms central to the social construction of the group (Smith and Zarate, Reference Smith and Zarate1990).
When individuals join groups, they become more likely to detect prototype violations (Hogg and Terry, Reference Hogg and Terry2000). Ingroup prototype violators are often punished, whereas ingroup prototype exemplars are often rewarded with leadership positions, influence, and obedience (Hogg, Reference Hogg2001; Hogg and Reid, Reference Hogg and Reid2006). Group members thus have strong incentives to conform to group prototypes.
While multiple factors contribute to partisans’ perceptions of prototypicality such as performance evaluations and group alliances (Conover and Feldman, Reference Conover and Feldman1989; Rahn, Reference Rahn1993), perhaps the most important factor is ideology. As Republicans and Democrats have become increasingly ideologically sorted (Levendusky, Reference Levendusky2009), ideological consistency has emerged as an important litmus test partisans use to assess the “Republican-ness” and “Democratic-ness” of inparty candidates. A 2017 Morning Consult/Politico poll found that 51% of Trump voters indicated they wanted their party’s next presidential candidate to be more conservative, and that 48% of Clinton voters indicated they wanted their party’s next presidential candidate to be more liberal (Yokley, Reference Yokley2017).
Partisans only conditionally value ideological purity, however. Rahn (Reference Rahn1993), for instance, demonstrated that when presented with party cues alongside policy information about a candidate, individuals ignored the policy information (even when the information violated party stereotypes), preferring to use party heuristics to guide their evaluations (though see also Boudreau and MacKenzie, Reference Boudreau and MacKenzie2014). More recently, Arceneaux (Reference Arceneaux2008) demonstrated that politically aware citizens punish prototype-violators, suggesting that for the vast majority of the politically unaware electorate (Carpini and Keeter, Reference Carpini and Keeter1996), ideological impurity is of little evaluative consequence. Additionally, a candidate’s ideological inconsistency may not matter when the inconsistency exists over issues of low salience (Arceneaux, Reference Arceneaux2008; Ciuk and Yost, Reference Ciuk and Yost2016).
However, the importance of ideology to partisans also depends on the meaning of partisanship. The instrumental model of partisanship suggests that party affiliation and ideology are mutually-reinforcing. Individuals join political parties because they believe the party values their policy preferences (Fiorina, Reference Fiorina1976). In this view, non-prototypicality among copartisans should be punished more severely as inparty identification increases. Conversely, the expressive model of partisanship holds that party membership is motivated less by reasoned ideological considerations and more by motivational and affective needs for group affiliation (Baumeister and Leary, Reference Baumeister and Leary1995; Green et al., Reference Green, Palmquist and Schickler2002; Huddy et al., Reference Huddy, Mason and Aarøe2015; Kinder and Kalmoe, Reference Kinder and Kalmoe2017). In this view, affect toward party often precedes the construction of issue positions, and the simple act of belonging to a group generates enduring ingroup biases (Turner, Reference Turner and Tajfel1978).
These competing models of partisanship generate competing predictions about the degree to which strong copartisans punish prototype violations. The instrumental model suggests that ideological impurity should be most severely punished by strong partisans given increasing alignment between partisan and ideological identities (Mason, Reference Mason2015). Alternatively, the expressive model suggests that affective attachment to the party and the desire for the ingroup to win blunts the influence of ideological considerations on candidate evaluation, and thus that non-prototypicality is not perceived as particularly damaging among stronger copartisans (Iyengar and Westwood, Reference Iyengar and Westwood2015). In this article, I aim to contribute to this debate by analyzing whether strength of inparty identification predicts increased punishment of non-prototypical copartisans.
METHODS
To assess how party affiliation strength conditions support for non-prototypical candidates, I conducted an online survey experiment as part of the 2014 Cooperative Congressional Election Study (CCES) administered by YouGov/Polimetrix. In addition to Common Content questions administered to 30,000 respondents, 1,000 respondents participated in Florida State University’s team module. The CCES uses YouGov/Polimetrix’s matched random sample methodology to select representative samples from non-randomly selected respondent pools (Ansolabehere, Reference Ansolabehere2009).
To examine whether party affiliation structures evaluations of non-prototypical candidates, I manipulated the partisanship and policy positions of a hypothetical candidate. I randomly assigned respondents to one of four conditions: Republican Prototypical Candidate (Condition 1), Republican Non-Prototypical Candidate (Condition 2), Democratic Prototypical Candidate (Condition 3), and Democratic Non-Prototypical Candidate (Condition 4). Randomization into conditions worked as intended.Footnote 2 In the two non-prototypical candidate conditions, I reversed the candidate’s issue stances on four out of seven issues. The four issues selected for reversal were support for government run healthcare, support for abortion rights, support for school vouchers, and support for gay marriage (for full text of the manipulation, see Appendix G). Reversing the candidate’s position on four of the seven issues produced a candidate who nominally was a Republican or Democrat yet who overall expressed issue positions more consistent with the outparty’s platform. I selected these four issues because they were relatively salient issues on the public agenda in 2014. Additionally, I did not reverse all seven candidate issue positions, because I wanted the candidate to mirror the more realistic degree of ideological divergence observed in real-world examples of RINOs and DINOs.
To measure prototype perceptions, I asked respondents, “How similar do you think [Republican/Democrat] Louis Harrison’s views are to those of most [Republicans/Democrats]?” Answers to this question were coded on a scale of 1–7 (1 = very dissimilar; 7 = very similar). Respondents, on average, were able to detect prototype violations. In the prototypical-candidate conditions, respondents reported significantly higher prototype perceptions (M C1 = 5.19 and M C3 = 5.16) than respondents in the non-prototypical-candidate conditions (M C2 = 3.50 and M C4 = 3.71) (t = 12.29, p < 0.01; t = 9.98, p < 0.01). To measure vote propensity, I asked respondents, “How likely are you to vote for [Republican/Democrat] Louis Harrison?” (1 = “Very Unlikely”; 7 =“Very Likely”). To measure affective evaluations, I used a feeling thermometer scale (0 = cold feelings/negative affect; 100 = warm feelings/positive affect).
FINDINGS
First, it is important to assess whether perceptions of prototypicality vary by identity strength and political knowledge. Theoretically, strong copartisans and the politically knowledgeable should be well-equipped to detect prototype violations because they have greater familiarity with ingroup norms and greater knowledge of the policy positions of the major parties. However, the extremity of the policy reversal and the salience of the issues reversed in the treatment may reduce the likelihood that identity strength or political knowledge predicts violation detection. To assess whether identity strength predicts the detection of prototype-violations, I regress prototype perceptions on party identification, condition, and the interaction of party identification and condition.Footnote 3 Marginal effect plots for the Republican and Democrat candidate conditions are presented in Figures 1 and 2, respectively.Footnote 4
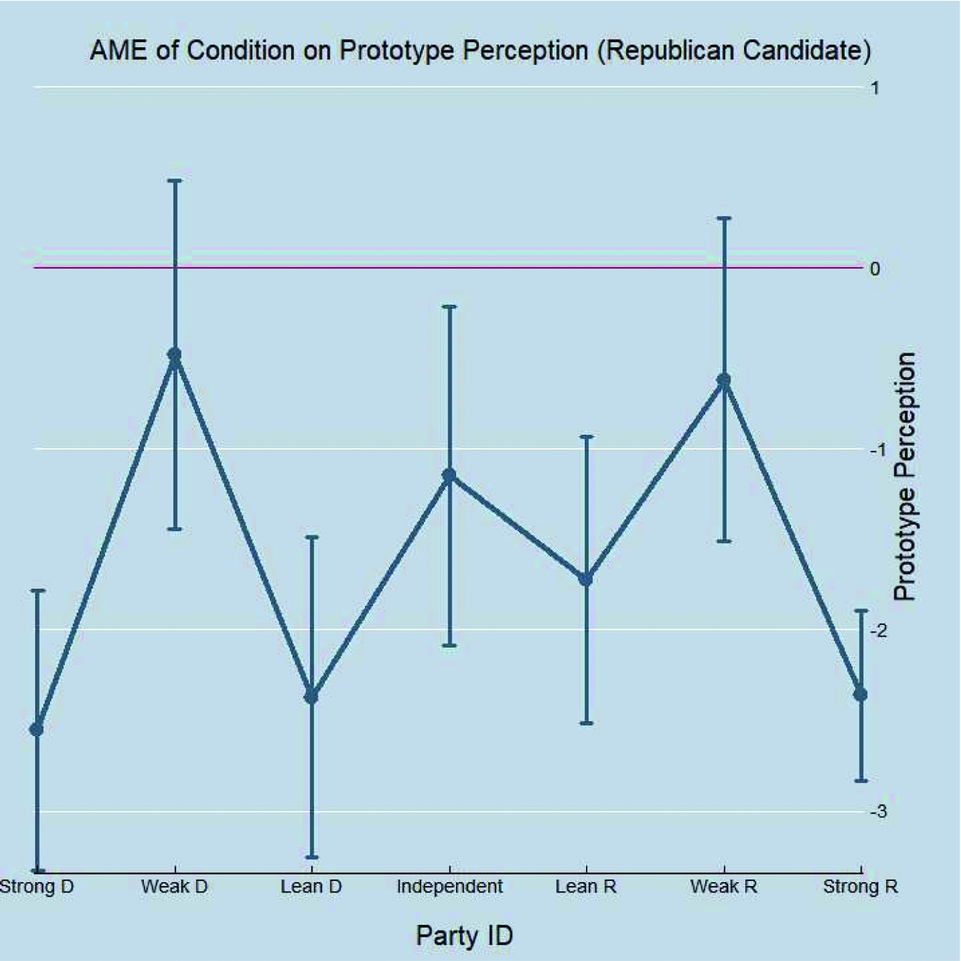
Figure 1 Average Marginal Effect of Condition on Prototype Perception. Marginal effect of party identification and condition on prototypicality perception with 95% confidence intervals for Republican candidate. Marginal effects were estimated by regressing prototypicality perceptions on the PID scale, condition, and the pairwise interaction of PID × condition. Condition 1 = Prototypical Republican. Condition 2 = Non-Prototypical Republican.
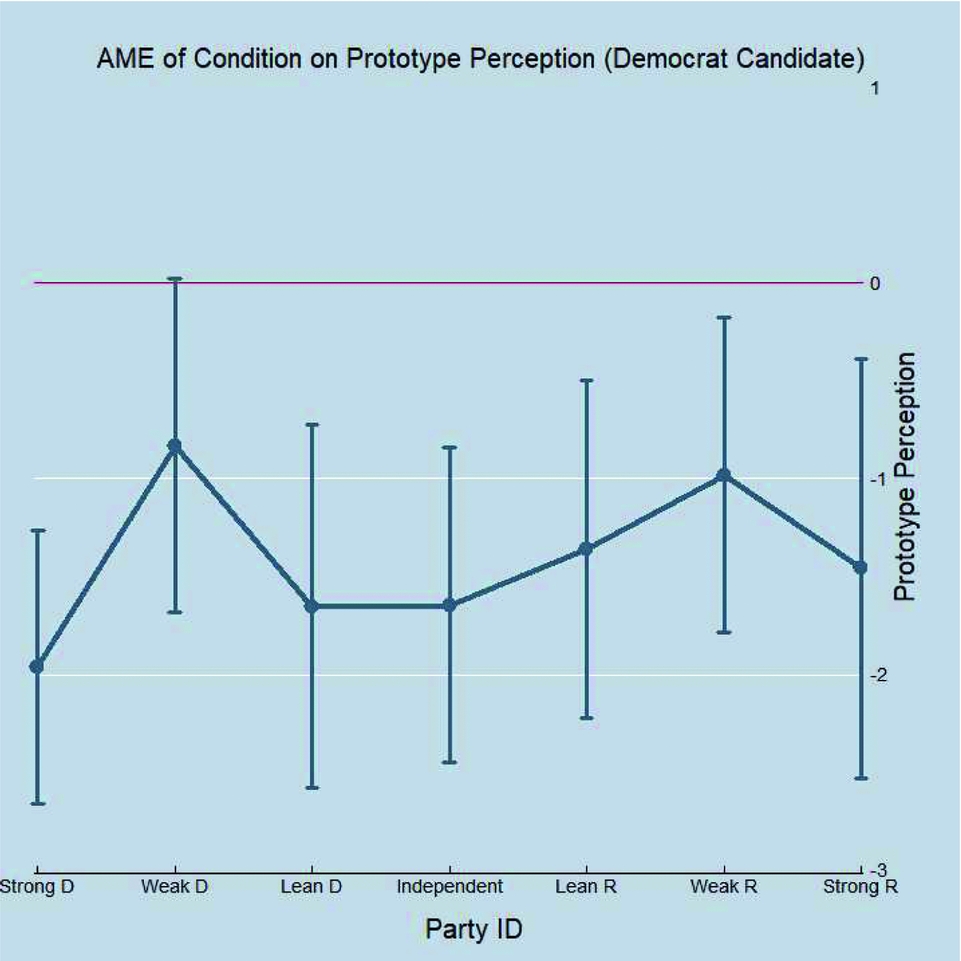
Figure 2 Average Marginal Effect of Condition on Prototype Perception. Marginal effect of party identification and condition on prototypicality perception with 95% confidence intervals for Democrat candidate. Marginal effects were estimated by regressing prototypicality perceptions on the PID scale, condition, and the pairwise interaction of PID × condition. Condition 3 = Prototypical Democrat. Condition 4 = Non-Prototypical Democrat.
Similarly, to assess whether political knowledge predicts the ability to detect prototype violations, I regress prototype perceptions on the 4-item political knowledge scale, condition, and the interaction of political knowledge and condition. Marginal effect plots for the Republican and Democrat candidate conditions are presented below in Figures 3 and 4, respectively.

Figure 3 Average Marginal Effect of Political Knowledge on Prototype Perception. Marginal effect of political knowledge and condition on prototypicality perception with 95% confidence intervals. The political knowledge index is a summative scale of four questions, coded 0 if the incorrect answer was given and coded 1 if the correct answer was given. Scale values range from 0 (low political knowledge) to 4 (high political knowledge). Marginal effects were estimated by regressing the political knowledge scale, condition, and the pairwise interaction of political knowledge × condition on prototypicality perceptions. Condition 1 = Prototypical Republican. Condition 2 = Non-Prototypical Republican.

Figure 4 Average Marginal Effect of Political Knowledge on Prototype Perception. Marginal effect of political knowledge and condition on prototypicality perception with 95% confidence intervals. The political knowledge index is a summative scale of four questions, coded 0 if the incorrect answer was given and coded 1 if the correct answer was given. Scale values range from 0 (low political knowledge) to 4 (high political knowledge). Marginal effects were estimated by regressing the political knowledge scale, condition, and the pairwise interaction of political knowledge × condition on prototypicality perceptions. Condition 3 = Prototypical Democrat. Condition 4 = Non-Prototypical Democrat.
If respondents detect prototype violations, then the marginal effect of non-prototypicality should be negative. Figures 1 and 2 show this is generally the case—partisans of both parties are able to detect prototype violations. Weak identifiers from both parties, however, do not perceive significant differences in prototypicality in the Republican candidate conditions. From Figure 3, I find evidence that high-knowledge respondents (M C2 = 2.53, s.e. = 0.37) were better able to detect prototype violations than low-knowledge respondents (M C2 = 4.10, s.e. = 0.56) (F = 1.15, p < 0.02). Interestingly, in the Democratic candidate conditions, a non-monotonicity exists in the relationship between political knowledge and prototype perceptions. High-knowledge respondents in Condition 3 perceived the prototypical Democratic candidate to be decidedly non-representative (M C3 = 3.87, s.e. = 0.46).Footnote 5 High-knowledge respondents were able to correctly detect the non-representativeness of the candidate in Condition 4, however (M C4 = 3.87, s.e. = 0.32).
In order to estimate the effect of prototypicality on evaluation across party identification, Figures 5 and 6 plot the average treatment effect (ATE) of non-prototypicality on the likelihood of voting for the Republican and Democratic candidates respectively.
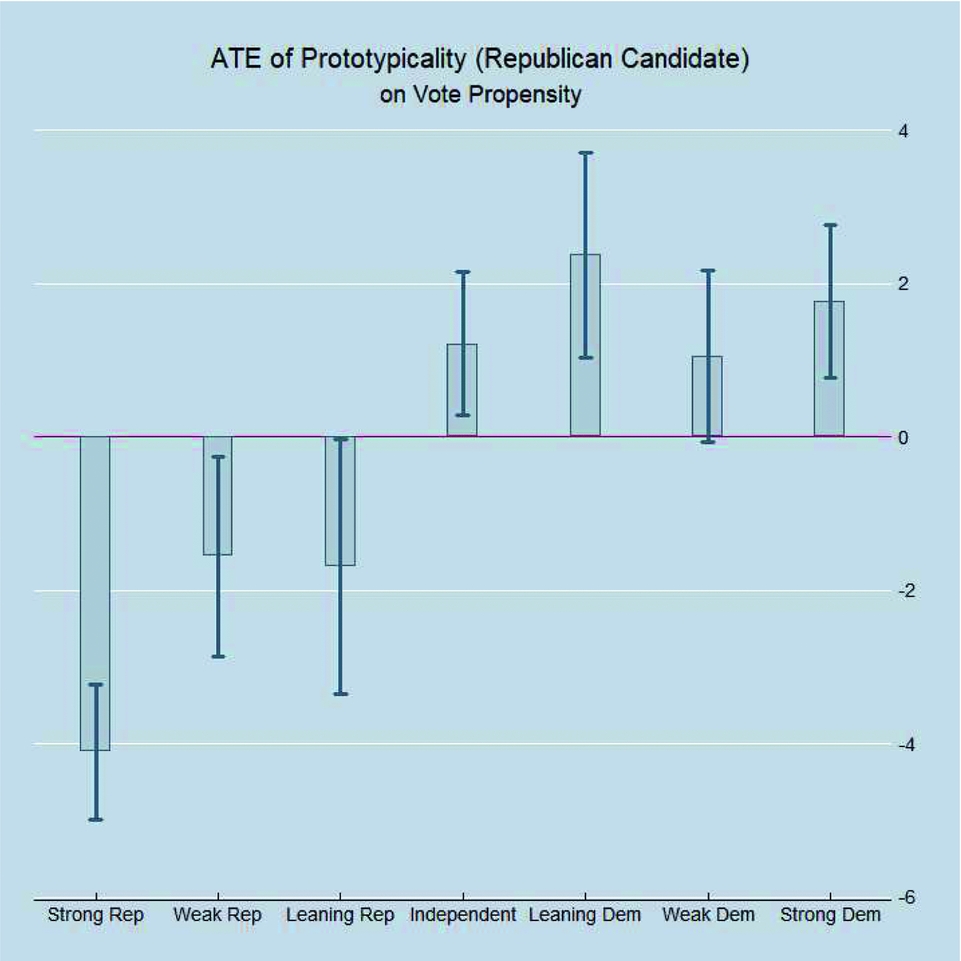
Figure 5 ATE of Prototype and PID on Vote for Republican Candidate. Average treatment effect of party identification and prototypicality condition on vote propensity with 95% confidence intervals for the Republican candidate. ATEs were estimated by regressing the vote propensity score on the PID scale, condition, and the pairwise interaction of PID × condition. Condition 1 = Prototypical Republican. Condition 2 = Non-Prototypical Republican.
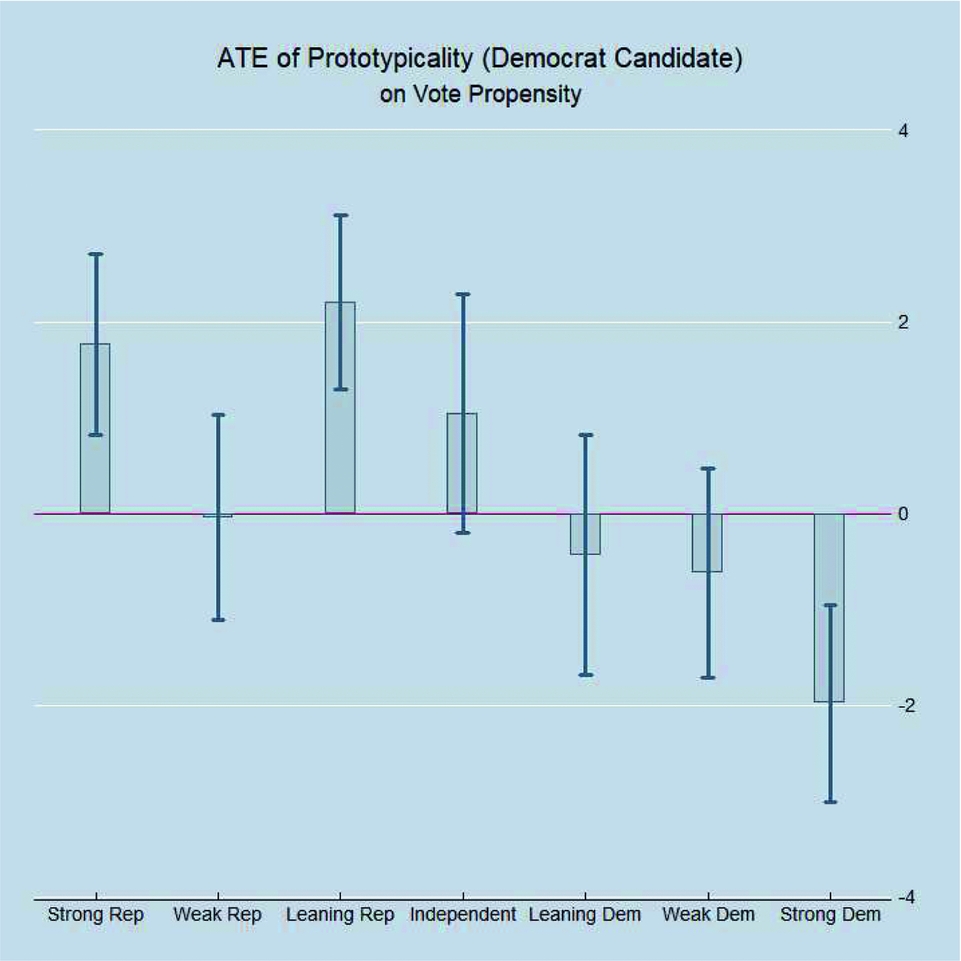
Figure 6 ATE of Prototype and PID on Vote for Democrat Candidate. Average treatment effect of party identification and prototypicality condition on vote propensity with 95% confidence intervals for the Democratic candidate. ATEs were estimated by regressing the vote propensity score on the PID scale, condition, and the pairwise interaction of PID × condition. Condition 3 = Prototypical Democrat. Condition 4 = Non-Prototypical Democrat.
Figure 5 reveals that Strong Republicans (ATE = −4.10, s.e. = 0.45) punish prototype-violating Republican candidates significantly more than Weak Republicans (ATE = −1.55, s.e. = 0.66), but not significantly more than Leaning Republicans (ATE = −1.69, s.e. = 0.84). Moreover, Independents and most Democrats —with the exception of Weak Democrats—rewarded Republican non-prototypicality. Figure 6 reveals that Strong Democrats significantly punish prototype violations (ATE = −1.98, s.e. = 0.52). However, the magnitude of their punishment is statistically comparable to levels of punishment among Weak and Leaning Democrats.
The discussion so far has largely centered on the effect of prototype violation on punishment between conditions, and not on differences among partisans within conditions. To visualize these differences, Figures 7 and 8 plot the adjusted predictions of party identification on vote propensity in the Republican and Democrat candidate conditions, respectively.
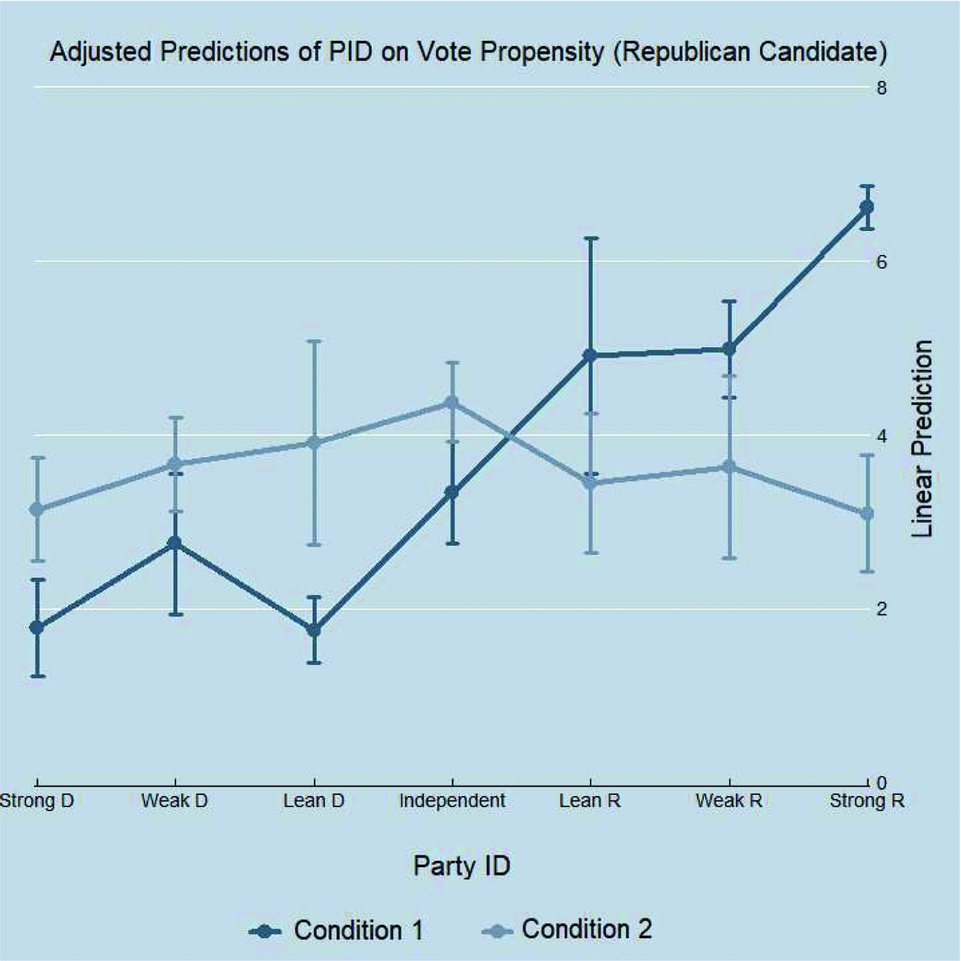
Figure 7 Adjusted Predictions of PID on Vote Propensity for Republican Candidate. Mean of vote propensity by party identification and condition with 95% confidence intervals for the Republican candidate. Adjusted predictions were estimated by regressing the feeling thermometer score on the PID scale, condition, and the pairwise interaction of PID × condition. Condition 1 = Prototypical Republican. Condition 2 = Non-Prototypical Republican.
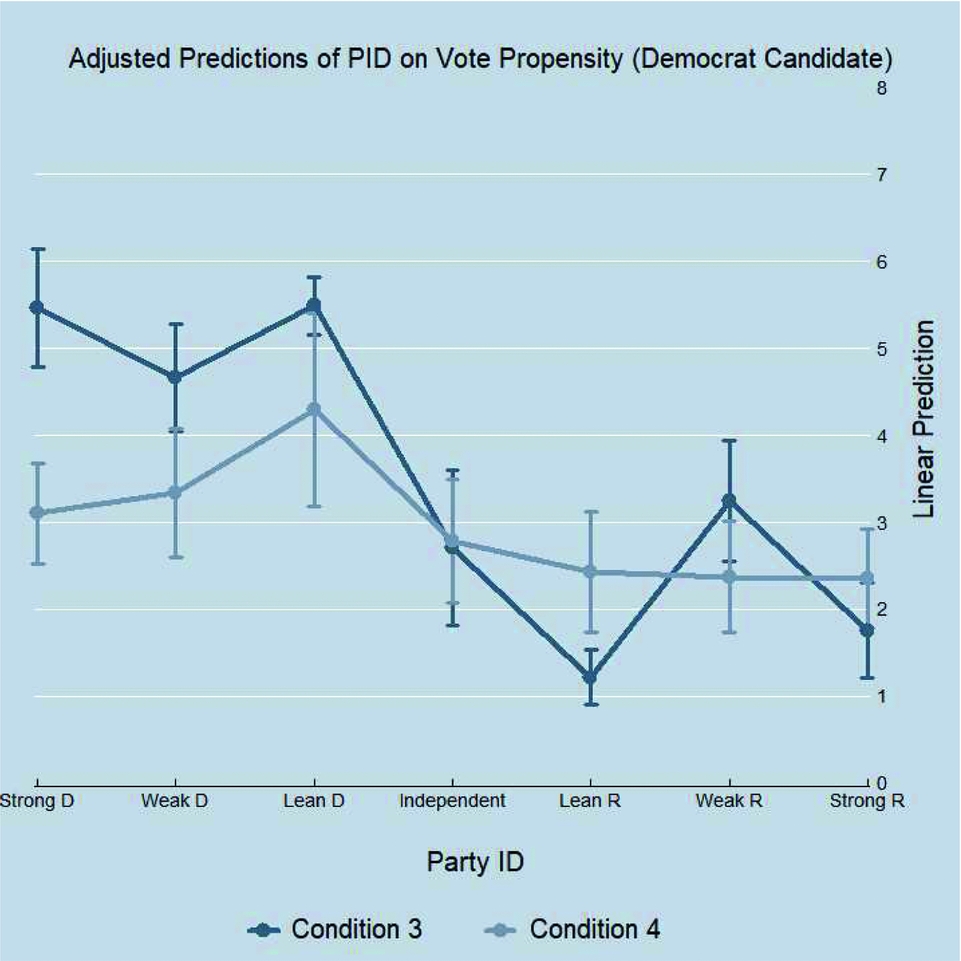
Figure 8 Adjusted Predictions of PID on Vote Propensity for Democrat Candidate. Mean of vote propensity by party identification and condition with 95% confidence intervals for the Democratic candidate. Adjusted predictions were estimated by regressing the feeling thermometer score on the PID scale, condition, and the pairwise interaction of PID × condition. Condition 3 = Prototypical Democrat. Condition 4 = Non-Prototypical Democrat.
Figures 7 and 8 reveal that prototype violations produce convergence in vote propensity across all levels of partisan affiliation. There are not significant differences in vote propensities by party affiliation when evaluating either non-typical Republican or Democratic candidates.
Turning now to affective evaluations, Figure 9 reveals that non-prototypicality significantly depresses the positive affect Strong Republicans feel toward the Republican candidate (ATE = −51.99, s.e. = 6.34). Further, while Strong Republicans punish deviation significantly more than Weak Republicans (ATE = −17.68, s.e. = 10.01), they are statistically as punitive as Leaning Republicans (ATE = −38.03, s.e. = 9.39). This tendency—for leaners to be as punitive as strong partisans—is consistent with previous research that shows that leaners have become more ideological and are often simply closeted partisans (Petrocik, Reference Petrocik2009; Pew Research Center, 2014). In contrast, the ATE plot in Figure 10 reveals that non-prototypicality has little effect on affect among Strong Democrats (ATE = −11.32, s.e. = 8.81). Indeed, there are not significant differences in the ATE of non-prototypicality on affect between Strong, Weak, and Leaning Democrats. One potential explanation is that Republicans are more likely than Democrats to perceive loyalty to the ingroup as an important moral trait (Graham et al., Reference Graham, Haidt and Nosek2009). Ceteris paribus, Republicans may be more likely to punish copartisans for perceived ideological disloyalty.
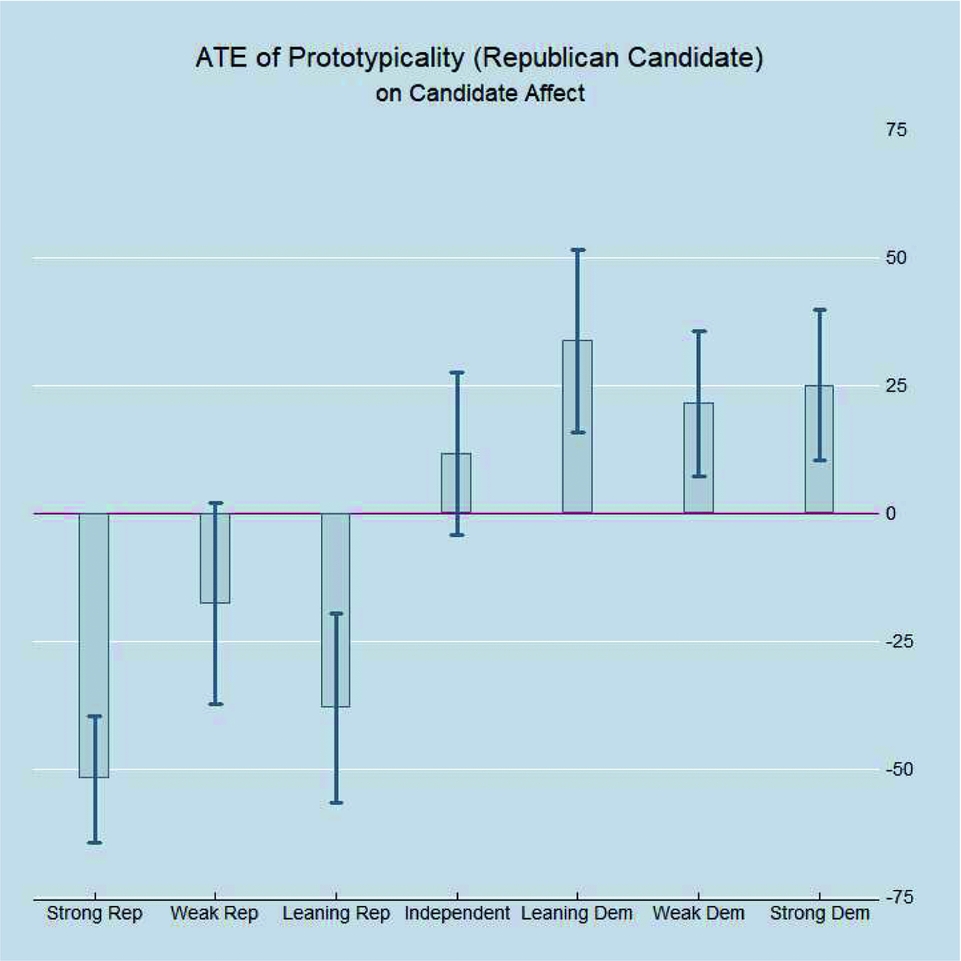
Figure 9 ATE of Prototype and PID on Affect Toward Republican Candidate. Average treatment effect of party identification and prototypicality condition on candidate affect with 95% confidence intervals for the Republican candidate. ATEs were estimated by regressing the feeling thermometer score on the PID scale, condition, and the pairwise interaction of PID × condition. Condition 1 = Prototypical Republican. Condition 2 = Non-Prototypical Republican.
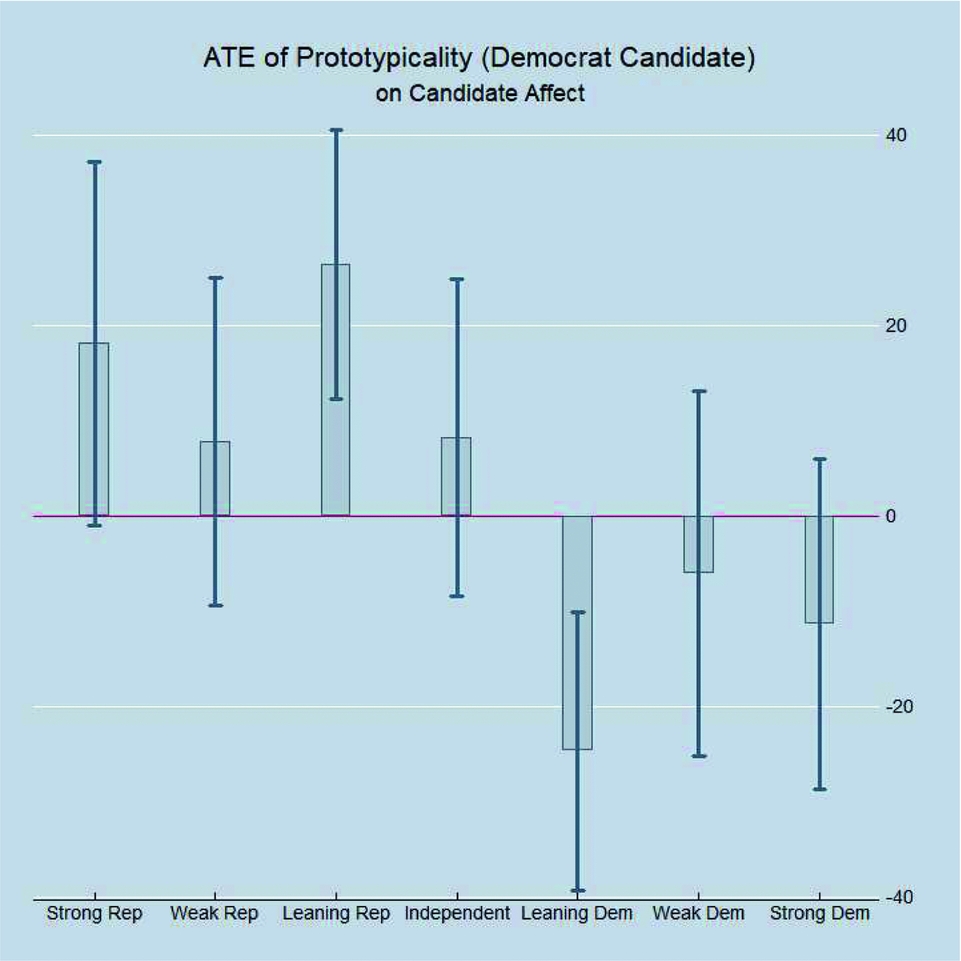
Figure 10 ATE of Prototype and PID on Affect Toward Democrat Candidate. Average treatment effect of party identification and prototypicality condition on candidate affect with 95% confidence intervals for the Democratic candidate. ATEs were estimated by regressing the feeling thermometer scores on the PID scale, condition, and the pairwise interaction of PID × condition. Condition 3 = Prototypical Democrat. Condition 4 = Non-Prototypical Democrat.
Finally, Figures 11 and 12 reveal that prototype violations produce convergence in affective evaluations of the candidates. There are not significant differences in affect across party affiliation when evaluating non-prototypical candidates. It thus appears that copartisans use information about a candidate’s issue stances to construct their evaluations of RINO and DINO candidates and care relatively little about the party cue.
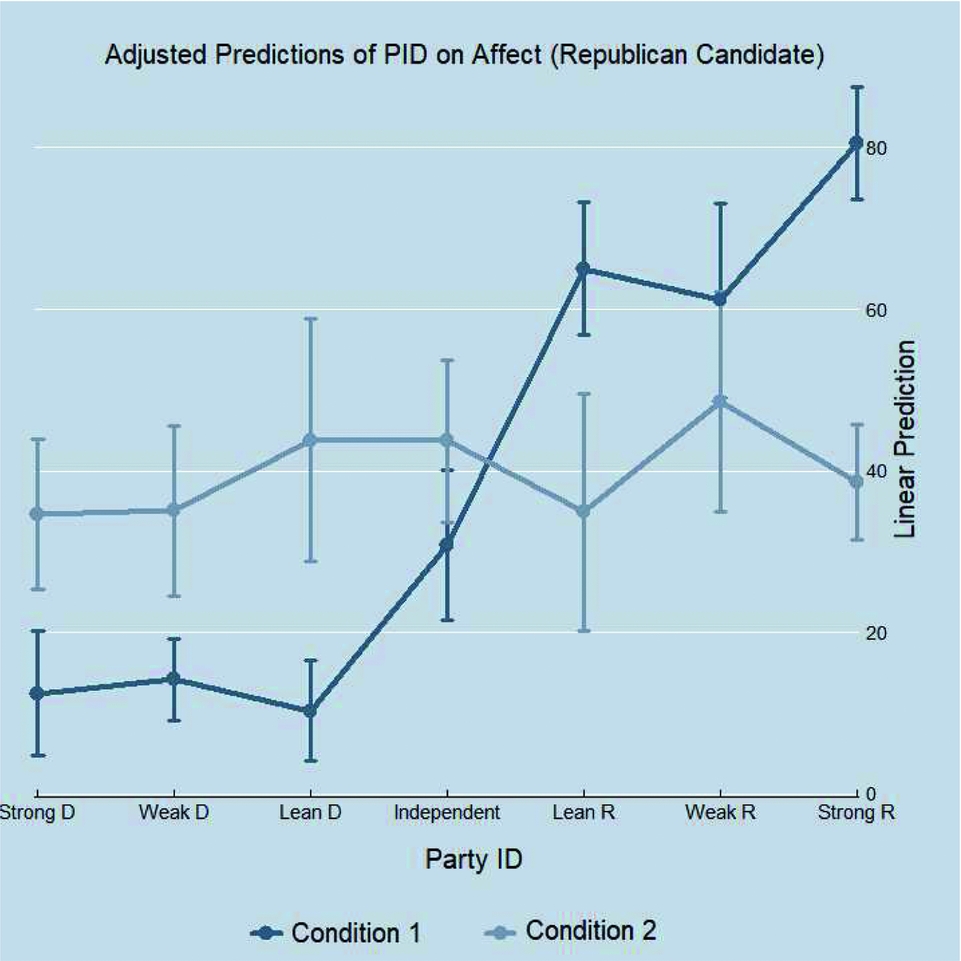
Figure 11 Adjusted Predictions of PID on Affect for Republican Candidate. Mean of candidate affect by party identification and condition with 95% confidence intervals for the Republican candidate. ATEs were estimated by regressing the feeling thermometer score on the PID scale, condition, and the pairwise interaction of PID × condition. Condition 1 = Prototypical Republican. Condition 2 = Non-Prototypical Republican.
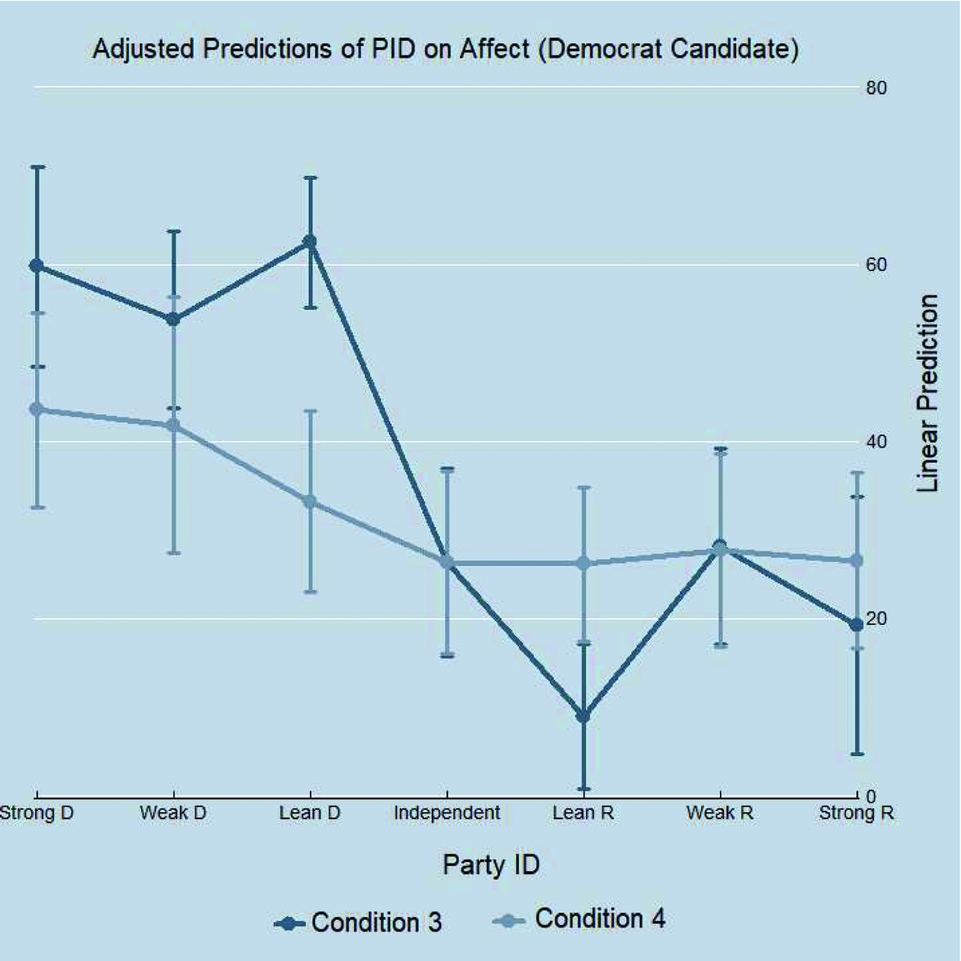
Figure 12 Adjusted Predictions of PID on Affect for Democrat Candidate. Mean of candidate affect by party identification and condition with 95% confidence intervals for the Democratic candidate. ATEs were estimated by regressing the feeling thermometer score on the PID scale, condition, and the pairwise interaction of PID × condition. Condition 3 = Prototypical Democrat. Condition 4 = Non-Prototypical Democrat.
DISCUSSION
The results of this experiment shed new light on the identity dynamics that structure candidate evaluation. I present evidence that “in-name-only” candidates are rebuked by copartisans for ideological impurity. Importantly, while party affiliation predicts punishment of ideologically impure candidates, as inparty identification increases, punishment for impurity does not monotonically increase. Additionally, prototype violations generate convergence in candidate evaluations—Republicans and Democrats evaluate prototype-defying candidates similarly.
Some limitations of the present design suggest fruitful avenues for future research. In this study, I present subjects with an artificially simple decision-environment. It seems reasonable to suggest that candidate evaluations are reference-dependent, sensitive to the degree of prototypicality, the total number of candidates fielded, the level of prototypicality of these candidates, and electability considerations. Future research should explore how variations in candidate attributes and electorate composition shape candidate evaluation as instrumental and expressive considerations may become more salient in different contexts. Moreover, while I argued that policy preferences are an important component of prototype perceptions, other factors also influence these perceptions. Future work should explore the relative importance of ideology over other factors in generating partisan prototypes.
With these caveats in mind, the results of this study provide preliminary evidence that nominal partisan affiliation is insufficient to save “in-name-only” candidates from the rebuke of fellow copartisans. Though increasingly rare in an increasingly sorted ideological universe, candidates who profess nominal allegiance to a party but who endorse issue positions inconsistent with its platform, risk punishment by their base.
APPENDIX A: DISTRIBUTION OF RESPONDENTS ACROSS EXPERIMENTAL CONDITIONS
Table A1 Participant Frequencies by Condition

APPENDIX B: COVARIATE DESCRIPTIVE STATISTICS
Table B1 Summary Statistics

APPENDIX C: COVARIATE DESCRIPTIVE STATISTICS BY CONDITION
Table C1 Means and Standard Deviations

APPENDIX D: PROTOTYPICALITY PERCEPTIONS BY PARTY IDENTIFICATION AND CONDITION
Table D1 Prototypicality Perceptions by Party ID and Condition

APPENDIX E: PROTOTYPE PERCEPTIONS BY POLITICAL KNOWLEDGE AND CONDITION
Table E1 Prototypicality Perceptions by Political Knowledge and Condition

APPENDIX F: ASSESSING COVARIATE BALANCE
I assess covariate balance through use of a multinomial logit model in which treatment assignment is the dependent variable. I use Condition 2 as the base condition. I present the results of this model in Figure 5. No variables achieve statistical significance at conventional levels, suggesting that randomization worked as intended.
Table F1 Estimation Results : Covariate Balance

APPENDIX G: VIGNETTE TEXT
G1: Condition 1
Imagine that Republican Louis Harrison is running for office in your district. The following are his views on a variety of policy issues:
• Economy: “I believe that free markets and individual achievement are the primary factors behind economic prosperity.”
• Health Care: “I oppose a government-run single-payer health care system.”
• Abortion: “I am pro-life and oppose elective abortion on religious and moral grounds.”
• Gun Control: “I support gun ownership rights. I oppose laws regulating guns.”
• Affirmative Action: “I oppose affirmative action for women and minority groups.”
• Vouchers: “I support school choice through charter schools and school vouchers for private schools.”
• Same-Sex Marriage: “I oppose same-sex marriage.”’
G2: Condition 2
Imagine that Republican Louis Harrison is running for office in your district. The following are his views on a variety of policy issues:
• Economy: “I believe that free markets and individual achievement are the primary factors behind economic prosperity.”
• Health Care: “I support a government-run single-payer health care system.”
• Abortion: “I am pro-choice and do not oppose elective abortion for moral reasons.”
• Gun Control: “I support gun ownership rights. I oppose laws regulating guns.”
• Affirmative Action: “I oppose affirmative action for women and minority groups.”
• Vouchers: “I do not support school choice through charter schools and school vouchers for private schools.”
• Same-Sex Marriage: “I support same-sex marriage.”
G3: Condition 3
Imagine that Democrat Louis Harrison is running for office in your district. The following are his views on a variety of policy issues:
• Economy: “I believe government intervention is necessary to reduce economic inequality.”
• Health Care: “I support a government-run single-payer health care system.”
• Abortion: “I am pro-choice and support elective abortion for moral reasons.”
• Gun Control: “I do not support gun ownership rights. I support stricter gun control laws.”
• Affirmative Action: “I support affirmative action for women and minority groups.”
• Vouchers: “I do not support school choice through charter schools and school vouchers for private schools.”
• Same-Sex Marriage: “I support same-sex marriage.”
G4: Condition 4
Imagine that Democrat Louis Harrison is running for office in your district. The following are his views on a variety of policy issues:
• Economy: “I believe government intervention is necessary to reduce economic inequality.”
• Health Care: “I oppose a government-run single-payer health care system.”
• Abortion: “I am pro-life and do not support elective abortion for moral reasons.”
• Gun Control: “I do not support gun ownership rights. I support stricter gun control laws.”
• Affirmative Action: “I support affirmative action for women and minorities.”
• Vouchers: “I support school choice through charter schools and school vouchers for private schools.”
• Same-Sex Marriage: “I oppose same-sex marriage.”


