I. INTRODUCTION
The high range resolution of a radar system makes it possible to get information about a target shape and its geometrical dimensions. That may be used for the target identification [Reference Cuomo, Piou and Mayhan1]. It is known that the radar short pulse response from the target may be described as a superposition of responses diffracted from point scatterers [Reference Rihaczek and Hershkowitz2]. Information about the space positioning of the most powerful target scatterers may be used for determination of the target shape and dimensions. According to the geometrical theory of electromagnetic back-scattering, any object having primitive shape such as sphere, cone, edge, and so on can be described by a single point-scatterer located on its surface at the equivalent phase center [Reference Chen and Ling3]. Each man-made target in the X-band can be represented as a superposition of these primitive elements. Finally, any man-made object could be uniquely described by a spatially distributed point-scatterer model.
Responses from separate point scatterers may be considered as their individual reflected signals [Reference Konovaluk, Kuznetsov and Baev4]. However, the distance between the scattering centers may be far lesser than the radar range resolution, which considerably complicates the target recognition directly from its radar range profile. The implementation of the complex radar image technology requires a coherent-pulse radar mode. The main reason for using complex imaging technology for wideband radar systems consists in necessary image resolution improvement. This paper treats coherent X-band radar emitting a wideband signal in the form of a sequence of short pulses without chirp modulation. Pulse duration needs to be short enough to obtain the range profile with predefined range resolution. In addition, it was assumed that radar is equipped with the non-scanning antenna system having a beam width much larger than the target angular dimension [Reference Konovaluk, Kuznetsov and Baev5].
The cross-range resolution of a radar target image is proportional to the minimum discriminable difference between Doppler frequencies shifts due to cross-range motion of equivalent scatterers. In order to improve the cross-range resolution, the observation dwell time should be increased [Reference Gorbunova and Kuznetsov6]. However, it should be taken into account that the motion of a target point scatterer could be considered as rectilinear and uniform only during a short dwell-time observation interval. Therefore, Doppler spectrum smearing is caused by variation of the radial speed component due to the observation time increase.
II. RADAR IMAGE MODEL
The complex envelope of the radar signal reflected from P-point scatterers of a moving target can be expressed as
 $$\dot x\lpar t\rpar =\sum\limits_{p=1}^P {\dot{A}_p \cdot \dot{s}\lsqb t - \tau _p \lpar t\rpar \rsqb }=\sum\limits_{p=1}^P {\dot{A}_p \cdot \dot{s}\lsqb t - 2\rho _p \lpar t\rpar /c\rsqb }\comma$$
where  $\dot{s}\lpar t\rpar =\sum\nolimits_{n=0}^{N - 1} {\dot{s}_0 \lpar t - n\, T\rpar } $ is the complex envelope of the signal composed of N radar transmitted pulses
  $\dot{s}_{0} \lpar t\rpar $; T is the interpulse interval;
  $\dot{A}_p $ is the complex amplitude of the signal reflected from the p-th scatterer; τp (t) is the round-trip delay proportional to the time-varying distance ρp (t) between the radar and the p-th scatterer; c is the speed of electromagnetic wave propagation.
Radial velocity for each target scatterer could be approximately assumed as a constant for a short observation time ΔT = N T. Hence, it can be represented as:
 $$v_p \lpar t\rpar =d\rho _p \lpar t\rpar /dt \cong v_{0p}\comma \; \quad p= 1\comma \; 2\comma \; \ldots\comma \; P.$$
Doppler frequency shift for the p-th scatterer is determined by the expression:
 $$f_{Dp}=2f_0 v_{0p} /c\comma$$
where f 0 is the carrier frequency.
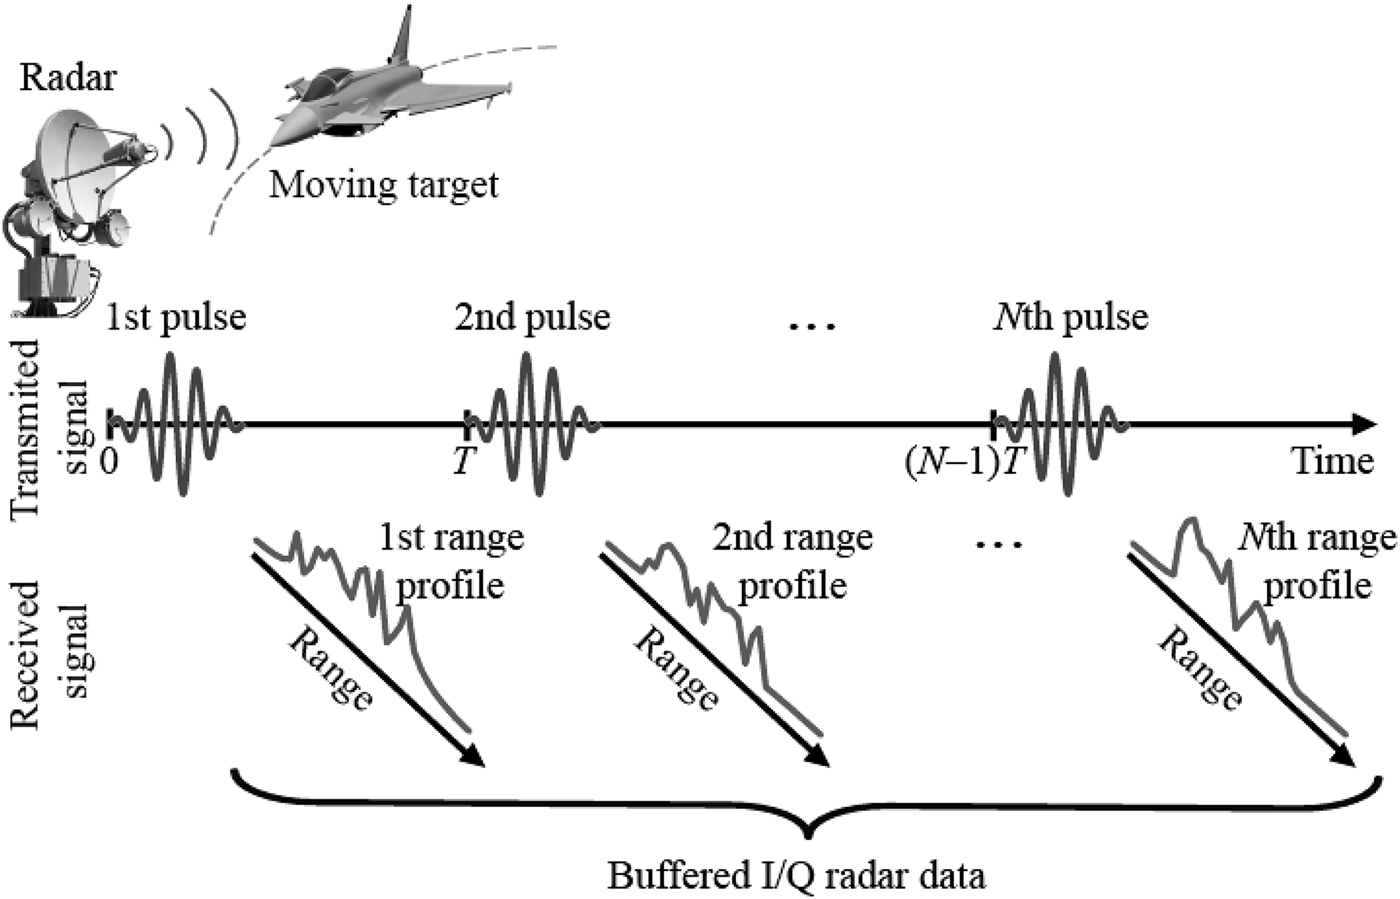
Figure 1 shows the scheme of the radar emitting coherent-pulse train and received radar signal in the form of range profile moduli. Each range profile is composed of in-phase and quadrature (I/Q) components as a result of quadrature detection of the received radar signal.

Fig. 1. Functional concept of inverse synthetic aperture radar.
The model of the digitized received radar signal can be expressed as follows:
 $${\dot y\lsqb k\rsqb =\sum\limits_{p=1}^P {\dot{A}_p \cdot \dot{s}\lsqb k\, \Delta t - \tau _p \lpar k\, \Delta t\rpar \rsqb }+\dot{w}\lsqb k\rsqb \comma \; \quad k=0\comma \; 1\comma \; 2\comma \; \ldots\comma \; }$$
where Δt is the time sampling interval;  $\dot{w}\lsqb k\rsqb $ is a complex additive Gaussian noise in the radar receiver bandwidth.
Spectrum of M signal samples  $\dot{y}\lsqb k\rsqb $ could be processed on each interpulse interval T = M Δt:
 $$\dot{Y}_M \lsqb m\rsqb =\sum\limits_{k=0}^{M - 1} {\dot{y}\lsqb k\rsqb \cdot \exp \lpar \!- j\, \phi _m \, k\rpar }\comma$$
where ϕm = 2πm/M, m = 0, 1, …, M−1 are discrete normalized frequencies in pulse bandwidth limited by the sampling frequency 1/Δt.
This spectrum could be described by the product of radar pulse spectrum  $\dot{S}_{0M} \lsqb m\rsqb $ and the superposition of exponential terms corresponding to complex amplitudes of point-scatterer models in frequency domain:
 $$\dot{Y}_M \lsqb m\rsqb =\dot{S}_{0\, M} \lsqb m\rsqb \cdot \left[{\sum\limits_{p=1}^P {\dot{A}_p \cdot \exp \left({\displaystyle{{ - j\phi _m \tau _{0p} } \over {\Delta t}}} \right)} } \right]+\dot{W}_M \lsqb m\rsqb \comma$$
where  $\tau _{0p}=2\rho _{0p} /c \comma \; \dot{W}_M \lsqb m\rsqb$ is the Fourier transform of noise complex envelope
  $\dot{w}\lsqb k\rsqb $.
Doppler cross-spectrum of a moving target could be obtained by using the discrete Fourier transform of N-time domain signal samples with (M·Δt) sampling interval during N·T dwell time:
 $$Y_N \lsqb \nu \rsqb =\sum\limits_{k=0}^{N \cdot M - 1} {\dot{y}\lsqb k\rsqb \cdot \exp \lpar \!\!-\! j\psi _\nu \, k\rpar }\comma$$
where ψν = 2πν/N,ν = 0, 1, …, N − 1 are discrete normalized frequencies in coherent signal bandwidth limited by 1/T.
Doppler spectrum could be represented as a set of harmonics with frequencies determined by cross-range shifts of target point scatterers:
 $$\eqalign{Y_N \lsqb \nu \rsqb &\cong \sum\limits_{n=0}^{N - 1} \left[\sum\limits_{p=1}^P \dot{A}_p \cdot \exp \lpar j\, 2 \pi \, f_{Dp} \, n\, T\rpar \right]\cr &\quad \cdot \exp \lpar - j\psi _\nu \, n\rpar +\dot{W}_N \lsqb \nu \rsqb \comma}$$
where  $\dot{W}_N \lsqb \nu \rsqb $ is the Fourier transform of the noise complex envelope
  $\dot{w}\lsqb k\rsqb $.
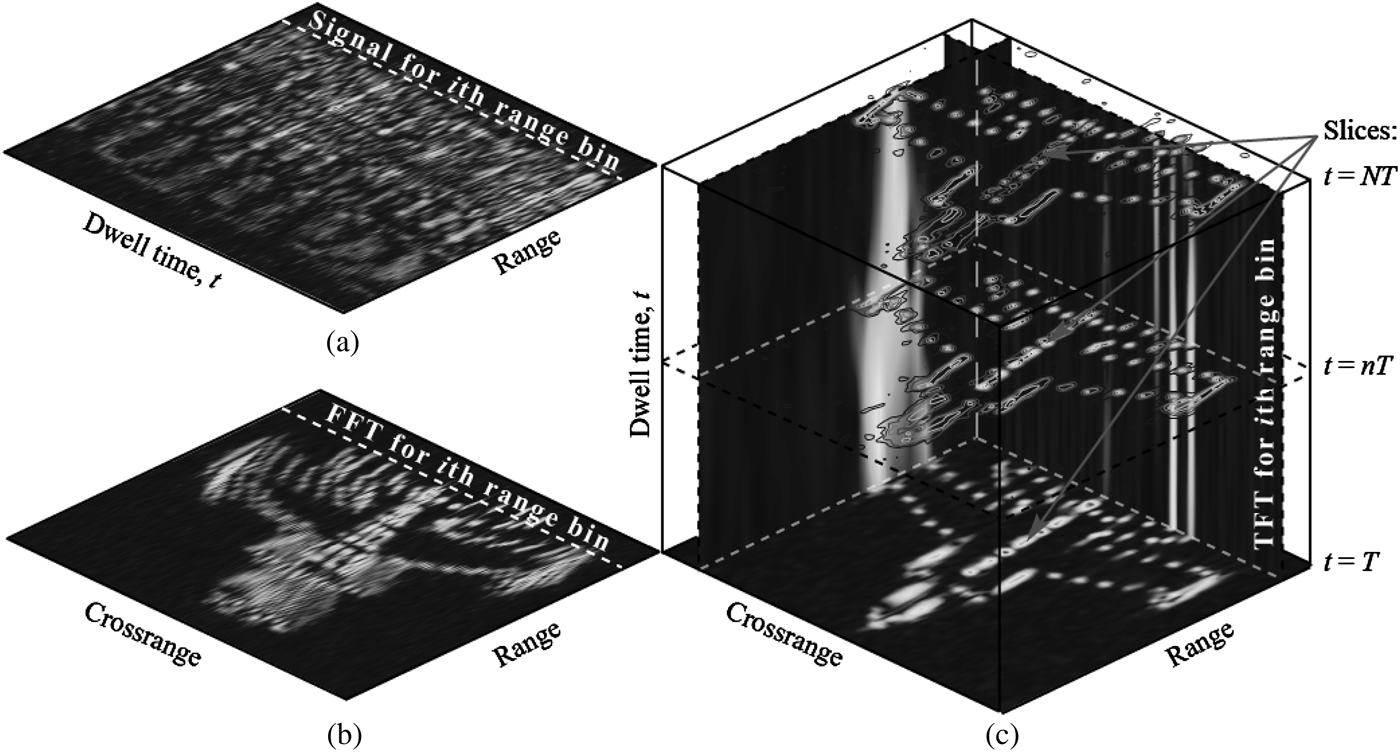
Sampled data  $\dot{y}\lsqb k\rsqb $ obtained during N T dwell time could be buffered into the two-dimensional (2D) structure with M rows and N columns as follows: each column represents corresponding range profile contains M samples linked with certain single pulse (see Fig. 2(a)). The 2D structured samples of the received signal can be expressed as:
 $$\eqalign{\dot{y}_{M \times N} \lsqb m\comma \; n\rsqb &= \dot{y}\lsqb m - n\, M\rsqb \comma \; \quad n=0\comma \; 1\comma \; \ldots\comma \; N - 1\comma \; \cr m&=0\comma \; 1\comma \; \ldots\comma \; M - 1.}$$
Fig. 2. Buffered ISAR data (a), ISAR image based on FFT (b), and ISAR 3D time-frequency image (c).
The individual cross-range slice of the radar image can be formed by the fast Fourier transform (FFT) of corresponding m-th data row (see Fig. 2(b)):
 $$\dot{z}\lpar r_m\comma \; h_\nu \rpar =\dot{z}_{M \times N} \lsqb m\comma \; \nu \rsqb =\sum\limits_{n=0}^{N - 1} {\dot{y}_{N \times M} \lsqb m\comma \; n\rsqb \cdot \exp \lpar \!- \!j\psi _\nu \, n\rpar }.$$
In order to enhance resolution of inverse synthesis aperture radar (ISAR) image, several methods can be applied. One of the algorithms is based on time-frequency transform (TFT) of radar data along dwell time. This algorithm was named as joint time frequency (JTF) analysis [Reference Chen and Ling3]. Each TFT of a range bin data sequence is inherently a 2D signal. Their transforms are collected into an array along the range axis. The resulting three-dimensional (3D) image could be synthesized along discrete dwell time, range, and cross-range axes by transforming obtained 2D slices into a 3D array. Fig. 2(b) shows that FFT algorithm produces image blurring due to the rotation of the target. On the contrary, JTF analysis makes it possible to observe the time history of target motion. This can be represented as the moving picture with slices of 3D array instead of frames.
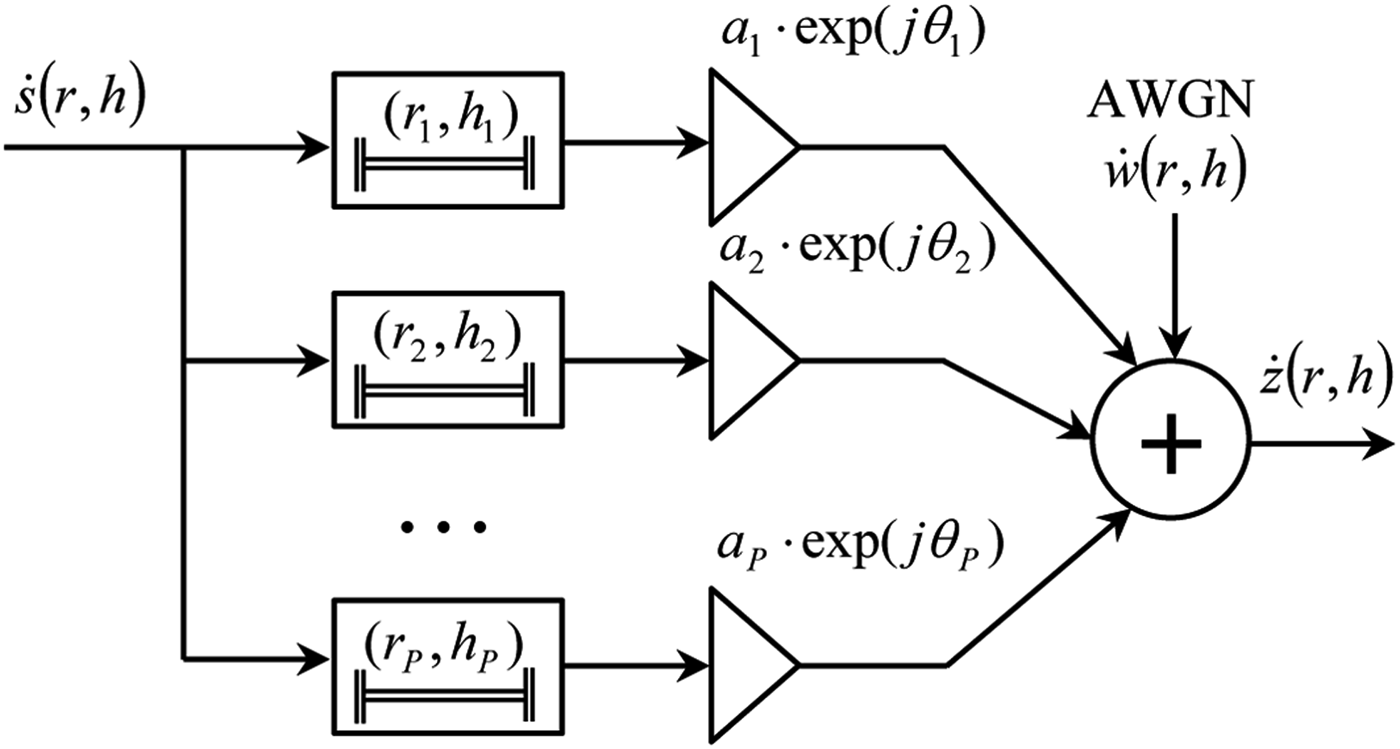
The backscattering of the radar target can be represented as a superposition of responses from its point scatterers [Reference Cuomo, Piou and Mayhan1]. Thus, calculated radar image is a surface in r and h coordinate planes. This 2D function can be described as a convolution of point spread function (PSF)  $\dot{s}\lpar r\comma \; h\rpar $and 2D impulse responses of the transversal filter (see Fig. 3):
 $$\dot{z}\lpar r\comma \; h\rpar =\dot{c}\lpar r\comma \; h\rpar\, {\ast}\, \dot{s}\lpar r\comma \; h\rpar +\dot{w}\lpar r\comma \; h\rpar \comma$$
where  $\dot{c}\lpar r\comma \; h\rpar $ is an unknown impulse response of the radar target portrait defined in a limited region of 2D radar image spectrum. It could be approximately represented as a superposition of responses from P effective point-scatterers:
 $$\dot{c}\lpar r\comma \; h\rpar = \sum\limits_{p = 1}^P a_p \cdot {\rm exp}\lpar j\theta _p \rpar \cdot \delta \lpar r - r_p\comma \; h - h_p \rpar \comma$$
where a p and θ p are amplitude and initial phase of the signal reflected from the p-th scatterer with (r p, h p) coordinates in an image plane;  $\dot{w}\lpar r\comma \; h\rpar $ is a complex envelope of the Gaussian noise.
Fig. 3. 2D Finite impulse response filter.
The radar range profile of the target contains information about its length under observation along the line of sight and locations of scatterer projections on this axis. The range resolution is determined by duration of a single pulse τ:
 $$\Delta_r = \displaystyle{2\, \tau \over c}.$$
In the case of a rotating target, Doppler shifts of scattering centers would be different. Doppler resolution is inversely proportional to ΔT dwell time. Doppler shift is proportional to the cross-range of a scattering center with scaling factor related to the radar wavelength () and inversely proportional to the target rotation rate Ω. Thus, cross-range resolution is determined as follows:
 $$\Delta_h = \displaystyle{\lambda \, \Delta_{f_D} \over 2\, \Omega} = \displaystyle{\lambda \over 2\, \Omega \, \Delta T}\comma$$
where  $\Delta_{f_D}$ is the Doppler resolution.
III. RADAR IMAGE POST-PROCESSING
According to the traditional approach [Reference Rihaczek and Hershkowitz2], a radar image can be processed by using inverse filtering, which makes it possible to improve image resolution and obtain target radar portrait written down as follows:
 $$\dot{u}\lpar r\comma \; h\rpar = \dot{z}\lpar r\comma \; h\rpar\, \ast\, \dot{g}\lpar r\comma \; h\rpar \comma$$
where  $\dot{g}\lpar r\comma \; h\rpar $ is the impulse response of the inverse filter satisfying the condition of mean-square error minimum criterion:
 $$\varepsilon=\vint_D {\left\vert {\dot{u}\lpar r\comma \; h\rpar - \dot{c}\lpar r\comma \; h\rpar } \right\vert } ^2 dr\, dh\comma$$
within a limited image region D where the target is located spatially. This approach results in the well-known Wiener filtering algorithm. The frequency response of the inverse filter could be written down as follows:
 $$\dot{G}\lpar f_r\comma \; f_h \rpar = \displaystyle{\dot{S}^{\ast} \lpar f_r\comma \; f_h \rpar \over \dot{S}\lpar f_r\comma \; f_h \rpar \cdot \dot{S}^{\ast} \lpar f_r\comma \; f_h \rpar + \alpha}\comma$$
where  $\dot{S}\lpar f_r\comma \; f_h\rpar $ is the 2D Fourier transform of PSF
  $\dot{s}\lpar r\comma \; h\rpar $, α is a regularization parameter depending on inverse signal-to-noise ratio, f r and f h are spatial image frequencies.
The unknown parameter α can be estimated using singular value decomposition of the radar image. The radar image can be divided into two subspaces. Significant singular values correspond to the signal subspace and remaining singular values correspond to the noise subspace. The sum of singular value squares forms the trace of the covariance matrix which also corresponds to the energy of 2D image. Thus, noise-to-signal ratio can be estimated as the ratio of noise and signal energies in corresponding subspaces. The algorithm of such discrimination can be implemented by the ranging of the difference values between adjacent singular values in descending order. The first maximum of this difference would correspond to the boundary between subspaces.
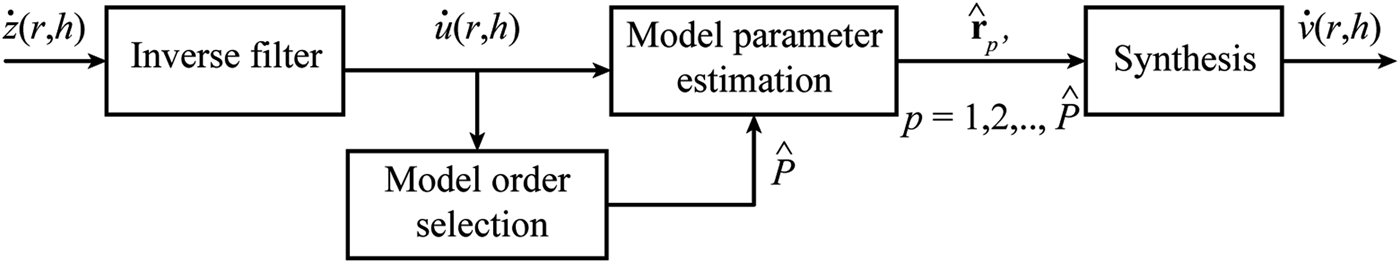
The diagram of the next step of the enhanced post-processing algorithm is shown in Fig. 4. The model parameter estimation should be implemented assuming the target as a set of point-scatterers.
Fig. 4. Diagram of the radar image post-processing algorithm.
First of all, one should select the model order P and then estimate vector of parameters rp = [a p, θ p, r p, h p]T for each scatterer. This algorithm implements the parametric identification of the inverse filter model based on its output image. The algorithm uses information criterion for model order selection [Reference Konovaluk, Kuznetsov and Baev4] and 2D Matrix Pencil method for parameter estimation [Reference Konovaluk, Kuznetsov and Baev5].
General form of any information criterion looks as follows:
 $$K\lpar p\rpar =- 2\ln L\lpar {\rm \dot U}\comma \; {\bf r}_1\comma \; {\bf r}_2\comma \; \ldots\comma \; {\bf r}_p \rpar +k_{\bf r} \cdot F\lpar p\comma \; N \times M\rpar \comma$$
where  $\ln L\lpar {\rm \dot U}\comma \; {\bf r}_1\comma \; {\bf r}_2\comma \; \ldots\comma \; {\bf r}_p \rpar $ is the maximum of the likelihood function;
  ${\rm \dot U}$ is data matrix formed using 2D spectrum of
  $\dot{u}\lpar r\comma \; h\rpar $;
  $F\lpar p\comma \; N \times M\rpar $ is the risk function; p is the current value of the model order; k r is the number of (k r = 4) assessed independent parameters. Maximum-likelihood estimate
  $\hat P$ is determined from the condition:
 $$\hat P=\arg \mathop {\min }\limits_p \lcub K\lpar p\rpar \rcub .$$
 Matrix pencil [Reference Sarkar and Pereira7] can be written down using two Hankel matrices  ${\rm \dot U}_1$ and
  ${\rm \dot U}_2$ obtained from
  ${\rm \dot U}$ by exclusion of the first and the last columns, respectively
 $${\bf \dot M}={\rm \dot U}_2 -{\lambda} \cdot {\rm \dot U}_1={\bf Q}_L \cdot {\bf A} \cdot \left({{\bf Q} - {\lambda} \cdot {\bf I}} \right)\cdot {\bf Q}_R\comma$$
where  ${\rm \dot U}_1={\bf Q}_L \cdot {\bf A} \cdot {\bf Q}_R $,
  $\; {\rm \dot U}_2={\bf Q}_L \cdot {\bf A} \cdot {\bf Q} \cdot {\bf Q}_R $,
  ${\bf Q}={\rm diag}\left({\dot q_1 \dot q_2 \; \; \ldots \; \; \dot q_P } \right)$,
  ${\bf A}={\rm diag}\left({\dot a_1 \; \; \dot a_2 \; \; \ldots \; \; \dot a_P } \right)$ are matrices with reduced rank
  $\hat{P}$ obtained basing on singular value decomposition. Eigenvalues of matrix pencil are related to scatterer coordinates by non-linear argument function
 $$\lcub \hat{r}_p\comma \; \hat h_p \rcub =- \displaystyle{{\arg \dot q_p } \over {2\pi }}.$$
The vector of complex amplitudes can be obtained using a pseudo-inversion of the matrix
 $$\eqalign{{\bf \hat{\dot a}} &= \lsqb \matrix{\hat{a}_1 \cdot e^{j\hat{\theta}_1} & \hat{a}_2 \cdot e^{j\hat{\theta}_2} & \ldots &\hat{a}_P \cdot e^{j\hat \theta_P}}\rsqb ^T \cr &= \left({\bf Q}^H \cdot {\bf Q} \right)^{ - 1}\, \cdot \,{\bf Q}^H \cdot {\rm \dot U}.}$$
In order to obtain the super-resolution effect, the synthesized image of the multi-point target could be expressed as
 $$\dot{v}\lpar x\comma \; y\rpar =\sum\limits_{p=1}^{\hat P} {\hat a_p \cdot \exp \lpar j\hat \theta_p\rpar \cdot s_{\Lambda} \lpar r - \hat{r}_p\comma \; h - \hat{h}_p\rpar }\comma$$
where s Λ(r, h) is narrowed PSF
 $$s_{\Lambda} \lpar r\comma \; h\rpar =s\lpar \Lambda _r \cdot r\comma \; \Lambda _h \cdot h\rpar \comma \; \Lambda _r\gt 1\comma \; \Lambda _h\gt 1 .$$
 $\hat P$ is the selected model order and
  $\hat{\bf r}_p=\lsqb \hat a_p\comma \; \hat \theta _p\comma \; \hat{r}_p\comma \; \hat h_p \rsqb ^T $ is the assessed vector of parameters for the p-th scatterer.
IV. SIMULATION RESULTS
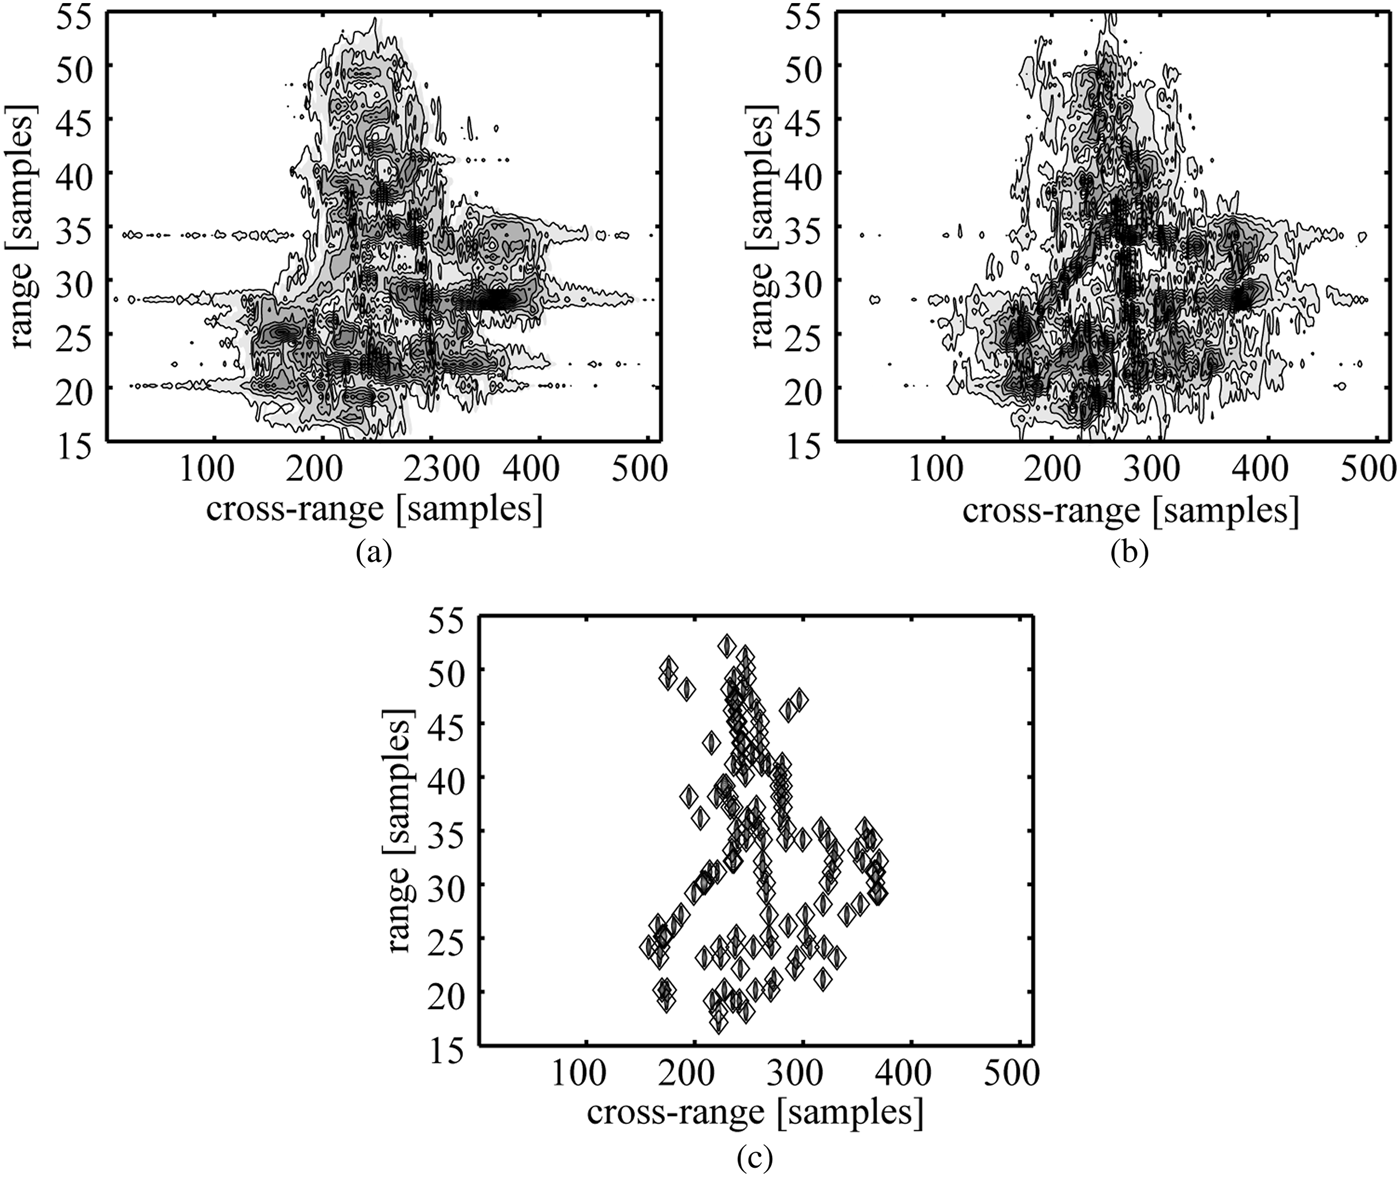
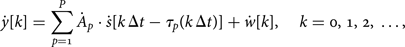
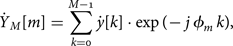
In the following example, ISAR simulated data were used for the radar image post-processing algorithm. Processing of initial data has been implemented using the complex radar image of MiG-25 aircraft [Reference Munoz-Ferreras and Perez-Martinez8]. Radar image of a MiG-25 was simulated using about 100 scatterers. Coherent time interval was equal to 2 s. The carrier frequency was 9 GHz and pulse repetition frequency was 15 kHz. Number of range samples was equal to 64.
Figure 5(a) shows contour maps of the simulated aircraft ISAR image, blurred, and noised by complex AWGN with signal-to-noise ratio SNR = 15 dB. Performance of Wiener deconvolution algorithm using designed filter based on the known PSF is shown in Fig. 5(b). Radar image as a decomposition of scatterer responses was obtained by parametric identification procedure applied to inverse filter model. It is shown in Fig. 5(c).
Fig. 5. Simulated aircraft ISAR image (a) with blurring and additive white Gaussian noise (SNR = 15 dB), Wiener filtering deconvolution of image (b), and decomposition of scatterer responses (marked with diamonds) obtained by parametric identification (c).
Shown contour maps demonstrate radar image deblurring and improving of image resolution thanks to denoizing achieved by the combined approach of image post-processing algorithm based on parametric and non-parametric methods of image processing.
V. CONCLUSION
This paper suggests joint inverse filtering and parametric identification for post-processing algorithm of a complex radar image. In order to get the significant improvement of radar image resolution using image-processing algorithm, one should be aware of a prior information about radar image PSF. A radar target portrait is reconstructed as the model assuming superposition of the individual partial responses from target point scatterers. This information was used for parametric and non-parametric procedures of radar image post-processing algorithm that was used for identification of target geometric form. The above-given simulation example demonstrates the improvement of radar image quality made for assumed movement of the radar target.
 Maxim Konovalyuk received his Dipl.-Ing. and Ph.D. degrees from the Moscow Aviation Institute (National Research University), Russia, in 2008, and 2011, respectively, all in Radio-Frequency Engineering. He has been working at Moscow Aviation Institute since 2006. He is currently an Associate Professor at the Theoretical Radio Engineering Department. His main research interests are system identification, signal processing, electromagnetic compatibility, and spectral analysis.
 Anastasia Gorbunova received her Diploma in 2011 from the Moscow Aviation Institute (National Research University) in Radio-Frequency Engineering. She became a postgraduate student in 2011 at the Moscow Aviation Institute. She is currently an Assistant Professor at the Theoretical Radio Engineering Department and is active in the preparing the thesis in subject of the stochastic near-field measurements and processing. Her main research interests are stochastic electromagnetic fields, near-field measurements, signal processing, and system identification.
 Andrey Baev received his Dipl.-Ing. and Ph.D. degrees from the Moscow Aviation Institute (State University of Technology), Russia, in 1999, and 2002, respectively, all in Radio-Frequency Engineering. He has been working at the Theoretical Radio Engineering Department at Moscow Aviation Institute since 1996. He now holds a Head of Research and Development Department. His main research interests are system identification, signal processing, electromagnetic compatibility, and spectral analysis.
 Yury Kuznetsov received his Dipl.-Ing., Ph.D. and D.Sc. degrees in 1974, 1981, and 2005, respectively, all in Radio-Frequency Engineering at Moscow Aviation Institute (National Research University), all in Radio-Frequency Engineering. From 2001 until now he is a Professor and the Head of the Theoretical Radio Engineering Department at Moscow Aviation Institute. He has authored more than 150 research articles and his current research interests include system identification, signal processing, electromagnetic compatibility, stochastic electromagnetic fields, and spectral analysis.