


1. Introduction
It is well known that intense acoustic tones are generated by the impingement of jets on a plate. Such tones were observed experimentally for high subsonic jets by many researchers, including Powell (Reference Powell1953), Neuwerth (Reference Neuwerth1974), Preisser (Reference Preisser1979), Ho & Nosseir (Reference Ho and Nosseir1981) and Nosseir & Ho (Reference Nosseir and Ho1982). In these studies, a staging phenomenon of the main tone frequency was measured when the nozzle-to-plate distance increases, which has led Powell (Reference Powell1953) to explain the tone generation by a feedback mechanism between the turbulent structures convected downstream from the nozzle to the plate and the acoustic waves propagating upstream from the plate to the nozzle. Similar feedback loops were noticed for supersonic impinging jets as well. For ideally-expanded supersonic jets, the establishment of these loops has been studied experimentally by Norum (Reference Norum1991) and numerically by Gojon, Bogey & Marsden (Reference Gojon, Bogey and Marsden2016) and Bogey & Gojon (Reference Bogey and Gojon2017). For underexpanded jets, the loops have been visualised in the experimental works of Henderson, Bridges & Wernet (Reference Henderson, Bridges and Wernet2005), Risborg & Soria (Reference Risborg and Soria2009), Buchmann et al. (Reference Buchmann, Mitchell, Ingvorsen, Honnery and Soria2011) and Mitchell, Honnery & Soria (Reference Mitchell, Honnery and Soria2012), and in the simulations of Dauptain, Gicquel & Moreau (Reference Dauptain, Gicquel and Moreau2012) and Gojon & Bogey (Reference Gojon and Bogey2017a). The upstream waves closing the feedback loop have also been analysed in several studies. In their aeroacoustic feedback model, Ho & Nosseir (Reference Ho and Nosseir1981) assumed that they are free-stream acoustic waves propagating outside of the jet. However, they were later identified as guided jet waves propagating mostly inside the jet, as suggested in the theoretical work of Tam & Ahuja (Reference Tam and Ahuja1990) for round jets and Tam & Norum (Reference Tam and Norum1992) for planar jets. These guided jet waves are defined by dispersion relations and classified in modes depending on their radial and azimuthal structures. In particular, their properties allow us to explain the frequencies and the axisymmetric or helical nature of the feedback tones, as highlighted in Gojon et al. (Reference Gojon, Bogey and Marsden2016), Gojon & Bogey (Reference Gojon and Bogey2017a), Bogey & Gojon (Reference Bogey and Gojon2017) and Jaunet et al. (Reference Jaunet, Mancinelli, Jordan, Towne, Edgington-Mitchell, Lehnasch and Girard2019) for subsonic and supersonic impinging jets. They are involved in other resonance phenomena: for example, in screech generation mechanism, as studied by Gojon & Bogey (Reference Gojon and Bogey2017b), Edgington-Mitchell et al. (Reference Edgington-Mitchell, Jaunet, Jordan, Towne, Soria and Honnery2018), Mancinelli et al. (Reference Mancinelli, Jaunet, Jordan and Towne2019) and Edgington-Mitchell (Reference Edgington-Mitchell2019); or in jet–plate interactions, as investigated by Jordan et al. (Reference Jordan, Jaunet, Towne, Cavalieri, Colonius, Schmidt and Agarwal2018) and Tam & Chandramouli (Reference Tam and Chandramouli2020). The guided jet waves also play a role in the generation of acoustic tones near the nozzle (Towne et al. Reference Towne, Cavalieri, Jordan, Colonius, Schmidt, Jaunet and Brès2017; Brès et al. Reference Brès, Jordan, Jaunet, Le Rallic, Cavalieri, Towne, Lele, Colonius and Schmidt2018; Bogey Reference Bogey2021b) and in the upstream acoustic far field (Bogey Reference Bogey2021b) of free jets. Using a vortex-sheet model, Towne et al. (Reference Towne, Cavalieri, Jordan, Colonius, Schmidt, Jaunet and Brès2017) have shown that within restricted frequency bands, both downstream- and upstream-propagating guided jet waves can exist for Mach numbers between 0.82 and 1, and can interact with each other. The near-nozzle tones in both experiments and simulations are located in these bands. In a recent study, Bogey (Reference Bogey2021a) investigated numerically the generation of these tones for jets at Mach numbers varying between 0.5 and 2. The tone properties, in terms of frequency, intensity, azimuthal structure, width and prominence, were detailed. They were shown not to vary strongly around Mach numbers of 0.82 and 1. In particular, over the whole Mach number range, the peak frequencies lie within the frequency bands of the free-stream upstream-propagating guided jet waves, and the peak levels follow the typical scaling laws of jet noise. Very recently, Bogey (Reference Bogey2021b) has shown using data from both experiments and simulations that the near-nozzle tones propagate in the far field in the upstream direction.
Jets impinging on a plate with a hole have been the subject of fewer studies than jets impinging on a flat plate. For subsonic jets, tones similar to those obtained for a non-perforated plate were first observed by Sondhauss (Reference Sondhauss1854) and Rayleigh (Reference Rayleigh1945), and they were referred to as hole tones. In the same way as without a hole, they are generated by a feedback mechanism between the hole edges and the nozzle. Indeed, the same staging phenomenon of the tone frequency as the nozzle-to-plate distance increases was revealed by several experiments, such as those of Chanaud & Powell (Reference Chanaud and Powell1965) and Vinoth & Rathakrishnan (Reference Vinoth and Rathakrishnan2011). Hole tone generation has been studied over a wide range of Mach numbers. For instance, Langthjem & Nakano (Reference Langthjem and Nakano2005) and Matsuura & Nakano (Reference Matsuura and Nakano2012) simulated a jet at a Mach number of 0.03 impinging on a plate with a hole located one nozzle diameter from the jet exit. Meganathan & Vakili (Reference Meganathan and Vakili2006) explored experimentally the effects of the jet velocity on the hole tone frequencies for Mach numbers varying from 0.2 up to 0.8. They noticed frequencies staging with the jet velocity, suggesting again a feedback mechanism. High subsonic and supersonic jets were considered in the experimental works of Umeda, Maeda & Ishii (Reference Umeda, Maeda and Ishii1988) and Umeda & Ishii (Reference Umeda and Ishii1993). Umeda et al. (Reference Umeda, Maeda and Ishii1988) notably visualised the feedback loop between the hole edges and the nozzle for jets at Mach numbers of 0.94 and 1.54 using shadowgraphy. They also noted a tonal radiation at the feedback frequency downstream of the plate. More recently, jets impinging on a plate with a hole have been studied numerically for a Mach number of 3.7 by Kawai et al. (Reference Kawai, Tsutsumi, Takaki and Fujii2007) and Tsutsumi et al. (Reference Tsutsumi, Takaki, Ikaida and Terashima2015) and for a Mach number of 3.1 by Troyes et al. (Reference Troyes, Vuillot, Langenais and Lambaré2019) and Varé & Bogey (Reference Varé and Bogey2021), with the aim of modelling a rocket launch, during which the supersonic gas jets exhausted by the engines impinge on the launch area and are canalised in a trench dug under the rocket. No feedback loop was found for these high Mach numbers. Concerning the effects of the hole diameter on the feedback loop, Vinoth & Rathakrishnan (Reference Vinoth and Rathakrishnan2011) compared the flow and pressure fields of two jets at a Mach number of 0.8 impinging on a flat plate and on a plate with a hole of same diameter as the nozzle. The two jets generate tones at similar frequencies, suggesting little effect of the hole on the feedback mechanism. In the same way, for a Mach number of 0.94, Umeda et al. (Reference Umeda, Maeda and Ishii1988) remarked no significant changes in the frequencies of the tones for hole diameters varying from 1.8 up to 2.4 nozzle diameters.
Despite the preceding studies, several questions remain about the influence of the size of the hole on the feedback properties. In particular, the effects of the hole diameter on the tone intensities need to be carefully described. As the hole diameter increases, these intensities are expected to decrease, due to weaker interactions between the jet turbulent structures and the plate. To the best of the authors’ knowledge, this hypothesis has not been confirmed yet. It is also unclear whether the broadband acoustic levels depend on the hole diameter. Furthermore, it is interesting to study a jet passing through a perforated plate with no impingement of the jet turbulent structures on the plate. For such a jet, the interactions between the flow and the plate are weaker than for the cases with a small hole, which could lead to a less pronounced aeroacoustic resonance, and hence differences in the sound generation mechanisms. Finally, the tonal radiation downstream of the plate pointed out by Umeda et al. (Reference Umeda, Maeda and Ishii1988) has not been examined thoroughly. The noise sources generating this radiation, which may be related to the feedback mechanism, have not been identified clearly.
In the present work, the generation of hole tones is investigated by performing the large-eddy simulations (LES) of four subsonic round jets impinging on a plate with and without a hole. The jets are at a Mach number of 0.9 and a Reynolds number of  $10^{5}$, and are initially highly disturbed. They impinge on a plate located at a distance
  $L=6r_0$ from the nozzle exit, where
  $r_0$ is the jet radius. Three of the plates have holes of diameters
  $h=2r_0$,
  $3r_0$ and
  $4.4r_0$, whereas the fourth plate has no hole. The nozzle-to-plate distance is the same as that in the experiments of Umeda et al. (Reference Umeda, Maeda and Ishii1988), in which the establishment of a feedback loop between the nozzle and the plate was observed. The hole diameters are chosen to study noise generation mechanisms for different interactions between the jet and the plate. Indeed, for
  $h=2r_0$ and
  $3r_0$, the jet impinges on the hole edges, whereas for
  $h=4.4r_0$, it passes through the hole without being distorted. The first objective of this study is to investigate the influence of the hole and its size on the tone generation. For that purpose, the characteristics of the jet flow and acoustic fields will be detailed, and compared with those obtained for a free jet with the same exit conditions (Bogey Reference Bogey2018, Reference Bogey2021a). In particular, pressure spectra will be computed in order to highlight the tonal frequencies. The contributions of the first two azimuthal modes will also be examined in order to identify the oscillation modes of the jets. The second aim of this work is to study the upstream part of the feedback loops establishing between the nozzle and the plate, which can be related, given previous works (Tam & Ahuja Reference Tam and Ahuja1990; Gojon et al. Reference Gojon, Bogey and Marsden2016; Bogey & Gojon Reference Bogey and Gojon2017), to the free-stream upstream-travelling guided jet waves. The production of these waves at the plate and their upstream propagation, as well as their role in generating new instability waves in the jet mixing layers when hitting the nozzle lips, will be revealed by calculating two-dimensional space–time correlations and frequency–wavenumber spectra of the pressure fluctuations in the jet shear layers. Finally, the nature of the noise sources will be investigated by separating the sound components linked to the flow turbulence and those related to the forces exerted by the flow on the plate. To this end, Curle's analogy will be employed to evaluate the contributions of the variations of the pressure on the plate to the pressure field.
The paper is organized as follows. The jet parameters and numerical methods used in the LES are documented in § 2. In § 3, the results of the simulations are presented. In particular, vorticity and pressure snapshots, mean and turbulent flow fields and pressure spectra are shown. The properties of the tones emerging in the spectra are analysed and compared with the results of aeroacoustic feedback models. Two-dimensional space–time correlations and frequency–wavenumber spectra of the pressure fluctuations in the mixing layer are provided. An acoustic analogy is then used to study the nature of the noise sources. Finally, concluding remarks are given in § 4.
2. Parameters
2.1. Jet parameters
The jets computed in this work have a Mach number  $M=u_j/c_0$ of 0.9 and a Reynolds number
  $Re_D = u_jD/\nu$ of
  $10^{5}$, where
  $u_j$ is the jet velocity,
  $D$ is the nozzle diameter, and
  $\nu$ is the air kinematic viscosity. They exhaust from a cylindrical nozzle of radius
  $r_0$, at ambient temperature and pressure
  $T_0=293$ K and
  $p_0=10^{5}$ Pa. They impinge on a plate located at
  $L=6r_0$ downstream of the nozzle exit, with a width
  $e=0.4r_0$. In one case, the plate has no hole, whereas three other ones have holes of diameters
  $h=2r_0$,
  $3r_0$ and
  $4.4r_0$. The four cases are referred to as jetnohole, jetsmallhole, jetmediumhole and jetlargehole, respectively. The nozzle-to-plate distance, the plate width and the hole diameter
  $h=4.4r_0$ are the same as in the experiments of Umeda et al. (Reference Umeda, Maeda and Ishii1988). At the nozzle inlet, a Blasius laminar boundary-layer profile with a boundary-layer thickness
  $\delta =0.15r_0$ is imposed for the velocity. Vortical disturbances non-correlated in the azimuthal direction are added in the boundary layer at
  $z=-r_0$ to create velocity fluctuations at the nozzle exit, following a procedure described in Bogey, Marsden & Bailly (Reference Bogey, Marsden and Bailly2011b). Their amplitude is the same as in the free jet at
  $M=0.9$ in Bogey (Reference Bogey2018, Reference Bogey2021a) to reach a peak turbulence intensity of 9 % at the nozzle exit. The profiles of mean and root-mean-square (r.m.s.) axial velocities thus obtained at the nozzle exit are represented in figure 1. In figure 1(a), the mean velocity profiles are very similar for the four jets and are close to the Blasius laminar boundary-layer profile imposed at the inlet. As for the turbulent intensities in figure 1(b), they reach a peak of
  $9\,\%$ for the four jets, as in the corresponding free jet.

Figure 1. Nozzle-exit radial profiles of (a) mean axial velocity  $\langle u_z \rangle$ and (b) axial turbulence intensity
  $\langle u_z'u_z' \rangle ^{1/2}/u_j$ for jetnohole (black solid line), jetsmallhole (red solid line), jetmediumhole (blue solid line), jetlarge hole (green solid line) and the free jet (dashed line).
2.2. Numerical and computational parameters
The numerical framework of this study is similar to that of recent simulations of free jets (Bogey Reference Bogey2021a) and supersonic impinging jets (Gojon et al. Reference Gojon, Bogey and Marsden2016; Bogey & Gojon Reference Bogey and Gojon2017). The unsteady compressible Navier–Stokes equations are solved in cylindrical coordinates  $(r,\theta,z)$ using an OpenMP based in-house solver. The time integration is performed using a six-stage Runge–Kutta algorithm (Berland et al. Reference Berland, Bogey, Marsden and Bailly2007), and the spatial derivatives are evaluated with an eleven-point low-dissipation and low-dispersion finite-difference scheme (Bogey & Bailly Reference Bogey and Bailly2004). At the end of each time step, a selective filtering is applied in order to remove grid-to-grid oscillations (Berland et al. Reference Berland, Bogey, Marsden and Bailly2007). This filter enables us to dissipate kinetic turbulent energy near the grid cut-off frequency, as a subgrid-scale model (Bogey & Bailly Reference Bogey and Bailly2006; Fauconnier, Bogey & Dick Reference Fauconnier, Bogey and Dick2013; Kremer & Bogey Reference Kremer and Bogey2015). Solid and adiabatic wall conditions are imposed on the nozzle and plate walls. The radiation boundary conditions of Tam & Dong (Reference Tam and Dong1996) are implemented at the lateral and radial boundaries of the computational domain. In these zones, they are combined with sponge zones using grid stretching and Laplacian filtering to avoid significant numerical reflections (Bogey & Bailly Reference Bogey and Bailly2002). The singularity at
  $r=0$ is treated by applying the method of Mohseni & Colonius (Reference Mohseni and Colonius2000). The first point close to the axis is thus located at
  $r=\Delta r/2$, where
  $\Delta r$ is the radial mesh size near the jet axis. The effective azimuthal resolution near the origin of the polar coordinates is reduced down to
  $2{\rm \pi} /16$ in order to increase the admissible time step of the simulation (Bogey, De Cacqueray & Bailly Reference Bogey, De Cacqueray and Bailly2011a).
The mesh grids used for the four simulations contain between 540 million and 1.4 billion points, as reported in table 1. They extend out to  $r=15r_0$ in the radial direction, and down to
  $z=6r_0$ and
  $z=40r_0$ in the axial direction for the flat and perforated plates, respectively. The radial mesh spacing, represented in figure 2(a), is equal to
  $\Delta r=0.014r_0$ on the jet centreline and decreases down to
  $\Delta r = 0.0036r_0$ at
  $r=r_0$ in the shear layers. It then increases to reach a maximum value of
  $\Delta r_{max}= 0.075r_0$ for
  $r> 6.2r_0$, which allows a Strouhal number
  $St=fD/u_j$ of 5.9 to be obtained for an acoustic wave with five points per wavelength. In the azimuthal direction, the grid is uniform and
  $N_\theta =1024$ points are used. The axial mesh spacing
  $\Delta z$, presented in figure 2(b), is minimal and is equal to
  $\Delta z=0.0072r_0$ at the nozzle exit. It increases and reaches
  $\Delta z = 0.012r_0$ between
  $z=2r_0$ and
  $z=4r_0$. Farther downstream, the axial mesh spacing is reduced to
  $\Delta z= 0.0072r_0$ near the plate at
  $z=6r_0$, as at the nozzle exit. Downstream of the plate, it increases to
  $\Delta z= 0.05r_0$ at
  $z=40r_0$. The extremum values of the mesh spacings and the stretching rates in both axial and radial directions are the same as in the study of Bogey (Reference Bogey2018), where a grid convergency study was performed for the free jet with the same ejection conditions. The simulation time after the transient period is equal to
  $500r_0/u_j$ for all jets. During the simulations, density, velocities and pressure along the jet axis at
  $r=0$, along the lip line at
  $r=r_0$, on the surface at
  $r=15r_0$, on the hole edges at
  $r=h/2$, and at
  $z=-2r_0$,
  $z=0$, on the faces of the plate at
  $z=L$ and
  $z=L+e$, and at
  $z=40r_0$, are recorded at a sampling frequency corresponding to a Strouhal number
  $St=12.8$. Density, velocity components and pressure at the azimuthal angles
  $\theta =0$, 90
 $^{\circ }$, 180
 $^{\circ }$ and 270
 $^{\circ }$ are also saved at a frequency twice smaller than for the signals at constant
  $r$ and
  $z$. In addition, the azimuthal Fourier coefficients of the density, pressure and velocity fields are computed up to the mode
  $n_\theta =4$ for
  $0\leqslant r\leqslant 15r_0$ and
  $0\leqslant z\leqslant 40r_0$. The spectra presented in the next sections are calculated from these recordings, and they are averaged in the azimuthal direction, when possible.
Table 1. Mesh parameters: numbers of points  $N_r$,
  $N_\theta$ and
  $N_z$ in the radial, azimuthal and axial directions, and total number of points.


Figure 2. Variations of (a) radial and (b) axial mesh spacings; red solid lines give the positions of the upstream and downstream faces of the plate.
3. Results
3.1. Snapshots
Snapshots of the vorticity norm obtained down to  $z=10r_0$ for the impinging jets and the free jet are represented in figure 3. Supplementary movies 1 and 2 available at https://doi.org/10.1017/jfm.2022.47 are also provided for jetnohole and jetmediumhole, respectively. For all jets, the mixing layers are highly disturbed near the nozzle exit. Farther downstream, they thicken with the axial distance because of the development of large-scale vortical structures. For jetnohole, jetsmallhole and jetmediumhole, in figures 3(a–c), these structures impinge on the plate. A wall jet is then created, as the entire jet flow, or only a part of it, is diverted in the radial direction. For the perforated plates, indeed, a significant part of the jet flow passes through the hole. The flow fields near the impingement region are dominated by large distorted structures, which are particularly visible between
  $z=4r_0$ and
  $z=6r_0$. Downstream of the plate, coherent structures can also be seen in the flow. This is the case for instance around
  $z=8r_0$ in figure 3(c). For jetlargehole, in figure 3(d), the mixing layers do not appear affected significantly by the plate. On the contrary, their development in the axial direction seems very similar to that for the free jet in figure 3(e).

Figure 3. Snapshots in the  $(z,r)$ plane of the vorticity norm for (a) jetnohole, (b) jetsmallhole, (c) jetmediumhole, (d) jetlargehole and (e) the free jet. The colour scales range from 0 up to
  $15u_j/r_0$, from white to red.
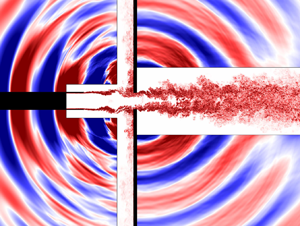
Snapshots of the vorticity norm and of the pressure fluctuations obtained in a whole  $(z,r)$-section are given in figure 4. In figures 4(b–d), downstream of the plates with a hole, the shear layers develop down to the end of the potential cores, as for the free jet in figure 4(e). In the pressure fields, for jetnohole, jetsmallhole and jetmediumhole, strong acoustic waves are generated by the impingement of the jet turbulent structures on the plate. Periodically separated wavefronts are observed, indicating a tonal radiation upstream of the plate, but also downstream for jetsmallhole and jetmediumhole. The amplitudes of the waves are of the order of
  $0.01p_0$, which is much higher than the amplitude obtained in the pressure field of the free jet, typically
  $0.001p_0$. In the upstream direction, the waves are slightly stronger for jetsmallhole than for jetmediumhole, but also, more surprisingly, for jetsmallhole than for jetnohole. Moreover, for jetsmallhole and jetmediumhole, the amplitude of the pressure waves appear to be stronger in the upstream region than in the radial direction, which is not the case for jetnohole. Therefore, the acoustic radiations are visibly more directive in the two first cases with a perforated plate than for the no-hole case. For jetlargehole, in figure 4(d), the acoustic waves show a less organised pattern. An acoustic radiation originating from the hole can, however, be detected upstream and downstream of the plate. A phase jump of the pressure waves is noted across the plate, producing an acoustic pattern similar to that emitted by installed jets (Nogueira, Cavalieri & Jordan Reference Nogueira, Cavalieri and Jordan2017). The sound radiation seems to be caused by the scattering of the jet aerodynamic pressure fluctuations by the hole edges. The pressure waves thus generated are four times weaker than those produced by the other impinging jets. Despite this, they are approximately twice as strong as the mixing noise acoustic components radiated by the free jet in figure 4(e), namely low-frequency components in the downstream direction and high-frequency components for large radiation angles. For the latter jet, the sound radiation is very directive in the downstream direction, contrary to that of the jets impinging on a perforated plate.

Figure 4. Snapshots in the  $(z,r)$-plane of the vorticity norm in the flow and of the fluctuating pressure outside for (a) jetnohole, (b) jetsmallhole, (c) jetmediumhole, (d) jetlargehole, and (e) the free jet. The colour scales range from 0 up to
  $7u_j/r_0$ for the vorticity norm, from white to red, and between (a–c)
  $\pm 0.01p_0$, (d)
  ${\pm }0.0025p_0$ and (e)
  ${\pm }0.001p_0$ for the pressure, from blue to red.
3.2. Flow field
The mean density fields of the jets are represented in figure 5. In all cases, density is lowest in the shear layers. Furthermore, except for jetlargehole and the free jet, compression cells are visible inside the jets. For jetnohole, in figure 5(a), three compression cells are found. The first is located near  $z=2r_0$, and the second is between
  $z=3r_0$ and
  $z=4r_0$. The third, and most intense, cell corresponds to the impingement area, and extends from
  $z=4.5r_0$ down to the plate in the axial direction, and up to
  $r=1.8r_0$ on the plate in the radial direction. Similar compression cells have been found using Schlieren imaging in the experiments of Neuwerth (Reference Neuwerth1974) for a jet at a Mach number of 0.9 impinging on a plate located six nozzle radii from the nozzle exit. For jetsmallhole, in figure 5(b), the mean density field displays three compression zones upstream of the impingement zone. Density in these zones is stronger than that for jetnohole, which causes a more pronounced radial expansion of the jet between
  $z=3r_0$ and
  $z=4.5r_0$. Density is highest near the hole in the impingement area, extending only between
  $z=5.7r_0$ and
  $z=6.4r_0$, and up to
  $r=1.4r_0$ in the radial direction, in this case. Downstream of the plate, density in the potential core is constant and equal to the ambient density. The mean density field for jetmediumhole, in figure 5(c), looks like that of jetsmallhole. Density in the cells is, however, slightly lower, and the compression zone near the plate is smaller, and does not reach the hole edges in that case. Downstream of the plate, weak compression cells can be seen down to the end of the potential core. Finally, for jetlargehole, in figure 5(d), the mean density field resembles that of the free jet shown in figure 5(e). In particular, contrary to the other impinging jets, density in the jet potential core is close to the ambient density both upstream and downstream of the plate.

Figure 5. Mean density fields in the  $(z,r)$-plane for (a) jetnohole, (b) jetsmallhole, (c) jetmediumhole, (d) jetlargehole and (e) the free jet. The colour scale ranges from
  $0.95\rho _0$ up to
  $1.05\rho _0$, from blue to red.
The axial variations of the jet mass flow rate  $m$ – normalized by its value
  $m_0={\rm \pi} r_0^{2}\rho _0u_j$ at the nozzle exit – upstream of the plate are represented in figure 6(a). For jetnohole, the jet mass flow rate first increases, reaches
  $m=1.4m_0$ at
  $z=5.1r_0$, and then falls to zero on the plate. For jetsmallhole and jetmediumhole, it grows up to
  $m=1.38m_0$ at
  $z=5.1r_0$ in the first case, and
  $m=1.39m_0$ at
  $z=5.5r_0$ in the second case, and then decreases down to non-zero values on the plate, due to the passing of a part of the jet flow through the hole. For these two jets, the mass flow rate is higher than that for jetnohole between
  $z=2r_0$ and
  $z=5r_0$. The hole in the plate therefore leads to a stronger entrainment of the fluid surrounding the jet. Finally, for jetlargehole and the free jet, the mass flow rates are very close and increase roughly linearly, in agreement with the experiments of Ricou & Spalding (Reference Ricou and Spalding1961). They are lower than those for the other jets.

Figure 6. Variations of (a) the jet mass flow rate  $m$ in the axial direction, and (b) the mass flow rate of the wall jet
  $m_{WJ}$ in the radial direction for jetnohole (black solid line), jetsmallhole (red solid line), jetmediumhole (blue solid line), jetlargehole (green solid line) and the free jet (dashed line).
The mass flow rates of the wall jets for jetnohole, jetsmallhole and jetmediumhole are shown in figure 6(b). For jetnohole, the mass flow rate increases near the impingement area, reaches a value of  $1.4m_0$ at
  $r=1.8r_0$, and then does not vary much down to
  $r=3r_0$. Farther from the axis, it grows nearly linearly, as the wall jet approaches self-similarity. This self-similarity is typical of wall jets; refer to the work of Poreh, Tsuei & Cermak (Reference Poreh, Tsuei and Cermak1967), Launder & Rodi (Reference Launder and Rodi1983) or Van Hout, Rinsky & Grobman (Reference Van Hout, Rinsky and Grobman2018), for instance. For jetsmallhole, the mass flow rate of the wall jet also grows continuously with the radial distance, but is lower than for jetnohole, which can be explained by the fact that due to the hole in the plate, only a fraction of the jet flow is diverted in the wall jet. For jetmediumhole, the mass flow rate is still reduced compared with jetsmallhole, because of the larger hole diameter.
The profiles of centreline mean axial velocity in the impinging jets between the nozzle and the plate are presented in figure 7(a). The centreline velocity decreases down to zero at  $z=6r_0$ on the plate for jetnohole, but remains close to
  $u_j$ for the other three impinging jets. Small oscillations are, however, visible between
  $z=2r_0$ and
  $z=6r_0$ for jetsmallhole and jetmediumhole. They can be linked to the compression cells observed in the density fields in these cases. Such oscillations do not appear for jetlargehole.

Figure 7. Variations of (a) mean axial velocity  $\langle u_z \rangle /u_j$ at
  $r=0$, (b) shear-layer momentum thickness
  $\delta _\theta /r_0$ in the axial direction, and (c) the maximum mean radial velocity
  $\langle u_r \rangle$ in the wall jet for jetnohole (black solid line), jetsmallhole (red solid line), jetmediumhole (blue solid line), jetlargehole (green solid line) and the free jet (dashed line).
The variations of the jet shear-layer momentum thickness  $\delta _\theta$ are represented in figure 7(b). For jetlargehole, the shear-layer spreading is the same as for the free jet. The shear layers of the three other jets for which the mixing-layer turbulent structures impinge, fully or partially, on the plate, develop more rapidly. More precisely, they are thinner between
  $z=0$ and
  $z=4.5r_0$, and much thicker for
  $z\geqslant 4.5r_0$ for jetnohole than for the two other jets. The difference near the plate can be attributed to the stronger wall jet in the case with a non-perforated plate.
The profiles of maximum radial velocity in the wall jets are plotted in figure 7(c). For jetnohole, the maximum velocity increases in the impingement region, where the jet flow is diverted into the radial direction, up to  $0.87u_j$ at
  $r=2r_0$. For
  $r\geqslant 2r_0$, the wall jet then spreads cylindrically, causing a decrease of the velocity as
  $r^{-1}$. For jetsmallhole and jetmediumhole, the velocities also first grow in the impingement zone and then decay farther from this zone. They are, however, lower as the hole diameter is larger, leading to peak values of only
  $0.48u_j$ for jetsmallhole and
  $0.11u_j$ for jetmediumhole.
The r.m.s. values of axial velocity fluctuations estimated at  $r=r_0$ along the nozzle-lip line are displayed in figure 8(a) between
  $z=0$ and
  $z=6r_0$. For the impinging jets, they are very similar to those in the free jet down to
  $z=2r_0$. For jetnohole, they fall down to zero on the plate. For jetsmallhole and jetmediumhole, they also decrease between
  $z=2r_0$ and
  $z=4r_0$, but increase farther downstream. Finally, for jetlargehole, they grow continuously and are slightly higher than those for the free jet.

Figure 8. Variations of (a) axial turbulence intensity  $\langle u_z'u_z' \rangle ^{1/2}/u_j$ at
  $r=r_0$, and (b) maximal radial turbulence intensity
  $\langle u_r'u_r'\rangle ^{1/2}/u_j$ in the wall jet for jetnohole (black solid line), jetsmallhole (red solid line), jetmediumhole (blue solid line), jetlargehole (green solid line) and the free jet (dashed line).
Finally, the maximum values of radial turbulence intensity in the wall jets are depicted in figure 8(b). For jetnohole, the turbulent intensity shows a local maximum at  $r=r_0$. It then increases up to
  $0.2u_j$ at
  $r=4r_0$, and decreases farther from the jet axis. For jetsmallhole and jetmediumhole, the turbulent levels are lower, and reach maximum values of
  $0.15u_j$ at
  $r=2r_0$ and of
  $0.10u_j$ on the hole edges at
  $r=1.5r_0$, respectively. The wall jets are therefore weaker in these two cases, as expected.
The spectra of the radial velocity fluctuations computed near the nozzle lip, at  $r=r_0$ and
  $z=0.4r_0$, for the impinging and free jets are represented in figure 9 as a function of the Strouhal number. The contributions of the first two azimuthal modes are also shown. For all jets, a broadband hump is observed for both modes around a Strouhal number
  $St=1.7$, which is close to the frequency
  $St_\theta =f\delta _\theta /u_j=0.016$ predicted for the Kelvin–Helmholtz instability waves using linear stability analysis (Michalke Reference Michalke1984). For the impinging jets, in addition, tones also emerge in the spectra, at similar frequencies but with levels depending on the presence and diameter of a hole in the plate. The tones are strong for jetnohole, jetsmallhole and jetmediumhole, but much weaker for jetlargehole. In the first case, in figures 9(a–c), very intense tones are found for the axisymmetric mode at
  $St=0.41$ for jetnohole, and
  $St=0.40$ for the two other jets, and at their harmonic frequencies. A small peak also appears for
  $n_\theta =1$ around
  $St=0.7$. For both modes, the frequencies of the dominant tones are lower than those expected for the most-amplified Kelvin–Helmholtz instability waves. These results suggest that the tones are due to aeroacoustic feedback loops establishing between the nozzle and the plate, i.e. that the jet shear layers are forced by the acoustic waves propagating in the upstream direction closing the loops. These feedback loops and upstream-travelling waves will be investigated later. For jetlargehole, in figure 9(d), a peak can also be seen at
  $St=0.40$ for
  $n_\theta =0$. However, the peak has a much smaller amplitude than the dominant tones for the other impinging jets, and does not appear in the spectrum of the full velocity signal, indicating a weaker aeroacoustic resonance in this case.

Figure 9. Power spectral densities (PSD) of radial velocity fluctuations  $u_r'$ obtained at
  $r=r_0$ and
  $z=0.4r_0$ for (a) jetnohole, (b) jetsmallhole, (c) jetmediumhole, (d) jetlargehole, and (e) the free jet. Black solid line, full signal; red solid line,
  $n_\theta =0$; blue solid line,
  $n_\theta =1$; dashed line,
  $St_\theta =f\delta _\theta /u_j=0.016$.
The spectra of radial velocity fluctuations computed farther downstream in the jet shear layer, at  $r=r_0$ and
  $z=r_0$,
  $5r_0$,
  $7r_0$ and
  $12r_0$, are shown in figure 10. At
  $z=r_0$ downstream of the nozzle, in figure 10(a), the spectra are very similar to those obtained at
  $z=0.4r_0$. Tones are found at
  $St\simeq 0.40$ and harmonic frequencies for jetnohole, jetsmallhole and jetmediumhole, but not for jetlargehole. At
  $z=5r_0$, just upstream of the plate, in figure 10(b), tones appear in the spectra only for the first three impinging jets as previously. Compared with the tones at
  $z=r_0$, they have the same frequencies, but they emerge more sharply. Downstream of the plate, in figures 10(c,d), peaks are still found in the velocity spectra for jetsmallhole and jetmediumhole, but not for jetlargehole. Close to the plate, at
  $z=7r_0$, in figure 10(c), tones emerge strongly at
  $St=0.4$ and
  $St=0.8$ for jetsmallhole, and at
  $St=0.4$ for jetmediumhole, whereas farther downstream, at
  $z=12r_0$, in figure 10(d), only a weak tone is observed at
  $St=0.4$ for these two jets. Therefore, the presence of aeroacoustic feedback loops upstream of the plate affects the jet flow development downstream of the plate. This is particularly the case in the vicinity of the plate, which explains the formation of large coherent structures in this region in the vorticity fields of figures 3(b,c).

Figure 10. Power spectral densities of radial velocity fluctuations  $u_r'$ obtained at
  $r=r_0$ and (a)
  $z=r_0$, (b)
  $z=5r_0$, (c)
  $z=7r_0$, and (d)
  $z=12r_0$ for jetnohole (black solid line), jetsmallhole (red solid line), jetmediumhole (blue solid line), jetlargehole (green solid line) and the free jet (dashed line).
3.3. Pressure field
3.3.1. Overall sound pressure levels
The isocontours of the overall sound pressure levels obtained in the  $(z,r)$-section for the five jets are represented in figures 11(a–e). Upstream of the plate, for all impinging jets, the isolines form a lobe oriented in the upstream direction and enclosing the plate centre, suggesting a link with the sound waves created in the impingement area. For jetnohole, in figure 11(a), a second lobe can be seen close to the plate. It extends in the radial direction and may be due to noise components radiated in the wall jet, which is most developed for this jet. Downstream of the plate, for jetsmallhole and jetmediumhole, in figures 11(b,c), the isolines appear as a lobe centred on the hole, highlighting an acoustic radiation from this region. For jetlargehole, in figure 11(d), the shape of the isolines is different from that for the two previous jets, and they look like the isocontours obtained for the free jet in figure 11(e). Jet mixing noise components therefore seem to be most significant downstream. Concerning the acoustic levels, upstream of the plate, they are overall highest for jetnohole and they decrease as the hole gets larger. Downstream of the plate, a similar trend is noticed, with the highest levels for the smallest hole and lowest levels for the free jet.

Figure 11. Overall sound pressure levels (OASPL) in the  $(z,r)$-plane for (a) jetnohole, (b) jetsmallhole, (c) jetmediumhole, (d) jetlargehole, and (e) the free jet. The levels are separated by increments of 3 dB.
3.3.2. Pressure spectra
The pressure spectra obtained for the four impinging jets near the nozzle and downstream of the plate, when possible, are plotted in figure 12 as a function of the Strouhal number, together with the spectra for the free jet.

Figure 12. Sound pressure levels (SPL) at (a)  $z=0$ and
  $r=1.5r_0$, and (b)
  ${z=12r_0}$ and
  $r=15r_0$, as functions of the Strouhal number
  $St=fD/u_j$ for jetnohole (black solid line), jetsmallhole (red solid line), jetmediumhole (blue solid line), jetlargehole (green solid line) and the free jet (dashed line).
Near the nozzle, at  $z=0$ and
  $r=1.5r_0$, in figure 12(a), several intense tones emerge for jetnohole, jetsmallhole and jetmediumhole at very similar frequencies, regardless of the presence of a hole in the plate and its size. The dominant tone is located at a Strouhal number
  $St=0.41$ for jetnohole, and
  $St=0.40$ for jetsmallhole and jetmediumhole. In the three cases, it is 25–30 dB greater than the broadband noise level. Secondary tones, not harmonics of the dominant tones, appear at
  $St=0.69$ for jetnohole,
  $St=0.64$ for jetsmallhole, and
  $St=0.60$ for jetmediumhole. For jetlargehole, a tonal peak is also found at a Strouhal number of 0.40. However, the acoustic levels are much weaker than for the other impinging jets, and are reduced by 20–55 dB compared with jetnohole. They are even close to the levels estimated for the free jet for Strouhal numbers higher than 0.7, and only 10–15 dB higher for lower frequencies. Tonal peaks can also be noted in the spectra for the free jet, at frequencies comparable to those of the tones for the impinging jets, namely
  $St=0.41$, 0.70, 1.0, 1.30 and 1.63 (Bogey Reference Bogey2021a).
For the impinging jets, the tones can be assumed to be generated by feedback mechanisms between the nozzle and the plate (Powell Reference Powell1953), consisting of two steps. During the first step, coherent structures are convected in the shear layer to the plate, where their impingement produces acoustic waves. During the second step, these waves propagate upstream to the nozzle, where they excite the shear-layer instability waves, creating new coherent structures and closing the feedback loop. A model was proposed by Ho & Nosseir (Reference Ho and Nosseir1981) to predict the frequencies of such a loop. It was built by considering the feedback period as the sum of two characteristic times. The first is the time of convection of the flow structures from the nozzle to the plate, and the second is the time of propagation of the acoustic waves in the upstream direction at the ambient speed of sound  $c_0$. The feedback frequency
  $f$ can thus be predicted by
 \begin{equation} f = \frac{N u_c}{L(1+M_c)}, \end{equation}
where  $N$ is an integer,
  $u_c$ is the mean convection velocity and
  $M_c=u_c/c_0$ is the convection Mach number. The integer
  $N$ represents the order of the feedback mode and corresponds to the number of coherent structures between the nozzle and the plate. The velocity
  $u_c$, computed for all the jets in this study, is close to the classical approximation
  $(2/3) \times u_j$. The feedback frequencies given by the model for
  $N=3$ and
  $N=5$ using this value for the convection velocity are equal to
  $St=0.42$ and 0.69, respectively. The first value is in good agreement with the Strouhal numbers of 0.40 and 0.41 of the dominant tones emerging in the spectra. The second frequency value is close or equal to the Strouhal numbers of the tones at
  $St=0.60$,
  $0.64$ and
  $0.69$ in the spectra of jetnohole, jetsmallhole and jetmediumhole. These results support the establishment of feedback loops at the tone frequencies. For the free jet, the tonal peaks in the spectra are due to the presence of guided jet waves, as documented by Towne et al. (Reference Towne, Cavalieri, Jordan, Colonius, Schmidt, Jaunet and Brès2017) and Schmidt et al. (Reference Schmidt, Towne, Colonius, Cavalieri, Jordan and Brès2017), and discussed very recently by Bogey (Reference Bogey2021a). These waves will be examined in § 3.4.2. Interestingly, the feedback tones for the impinging jets and the peaks for the free jets emerge at very similar frequencies. The feedback frequencies therefore appear to be determined mainly by the properties of the upstream-propagating guided jet waves. Regarding the tone intensities, the feedback loops produce strong tones for hole diameters
  $h\leqslant 3r_0$ and much weaker tones for
  $h=4.4r_0$, when the flow structures do not impinge on a solid surface.
The pressure spectra computed at  $z=12r_0$ and
  $r=15r_0$ downstream of the plate are represented in figure 12(b). For jetsmallhole and jetmediumhole, intense tones emerge at
  $St=0.40$ and harmonic frequencies, corresponding to the tone frequencies obtained upstream of the plate. For jetlargehole, no tones are found, but a hump emerging by about 10 dB of the broadband noise is observed for
  $St\leqslant 0.7$. This low-frequency hump resembles that noticed for installed jets by Lawrence, Azarpeyvand & Self (Reference Lawrence, Azarpeyvand and Self2011), supporting the idea that the scattering of the jet pressure by the plate contributes strongly to the noise radiated by jetlargehole. Regarding the sound levels, they are reduced by 5–30 dB with respect to the previous impinging jets. Compared with those for the free jet, they are 10 dB stronger for
  $St\leqslant 0.7$, and similar for
  $St\geqslant 0.7$.
For the four impinging jets, the contributions of the first two azimuthal modes to the pressure spectra at  $z=0$ and
  $r=1.5r_0$ are represented in figure 13 as a function of the Strouhal number. They are compared with the results obtained for the free jet, plotted with dashed lines. In figure 13(a), for jetnohole, the tones at
  $St=0.41$, 0.82 and 1.20 are related to the axisymmetric mode, whereas the tone at
  $St=0.68$ is associated with the first helical mode. This result is in agreement with the experimental work of Panickar & Raman (Reference Panickar and Raman2007), revealing the coexistence of an axisymmetric mode and a helical instability mode for impinging jets at a Mach number higher than 0.89. The peaks at
  $St=0.41$ and
  $St=0.70$ for the free jet are also linked to the modes
  $n_\theta =0$ and
  $n_\theta =1$, respectively, as for jetnohole. Therefore, the impingement of the jet on the plate does not change the azimuthal structure of the jet flow oscillations at a given frequency. In figures 13(b) and 13(c), the spectra for jetsmallhole and jetmediumhole are very similar to those for jetnohole in figure 13(a). The dominant tones at
  $St=0.40$ and higher harmonics emerge for
  $n_\theta =0$, whereas the tones at
  $St=0.65$ for jetsmallhole and
  $St=0.60$ for jetmediumhole occur for
  $n_\theta =1$. Thus the hole in the plate does not affect the axisymmetric or helical nature of the tones. Finally, for jetlargehole, in figure 13(d), the tonal peak around
  $St=0.40$ emerges for
  $n_\theta =0$, as for the other jets.

Figure 13. Sound pressure levels (SPL) at  $z=0$ and
  $r=1.5r_0$ for (a) jetnohole, (b) jetsmallhole, (c) jetmediumhole, and (d) jetlargehole, for the azimuthal modes for the azimuthal modes
  $n_{\theta}=0$ (red solid line),
  $n_{\theta} = 1$ (blue solid line) and SPL for the free jet for
  $n_{\theta}=0$ (red dashed line) and
  $n_{\theta}=1$ (blue dashed line).
The Strouhal numbers of the tones emerging at  $z=0$ and
  $r=1.5r_0$ for
  $n_\theta =0$ and
  $1$ are represented in figure 14 as functions of the hole diameter
  $h/r_0$, with
  $h/r_0=\infty$ corresponding to the free jet case. The frequencies predicted for aeroacoustic feedback loops by the model of Ho & Nosseir (Reference Ho and Nosseir1981) are also drawn using grey lines. For all impinging jets, four tones are found at similar Strouhal numbers, namely
  $St=0.40$ and 1.20 for
  $n_\theta =0$ in figure 14(a), and around
  $St=0.7$ and 1.3 for
  $n_\theta =1$ in figure 14(b), near the lines obtained using
  $N=3$, 5, 7 and 9 in the feedback loop model. The tonal frequencies for
  $n_\theta =0$ do not vary with the hole diameter, whereas those for
  $n_\theta =1$ change slightly, for unclear reasons. It can be noted that for the free jet, the near-nozzle peaks, attributed to the upstream-propagating guided jet modes (Towne et al. Reference Towne, Cavalieri, Jordan, Colonius, Schmidt, Jaunet and Brès2017; Brès et al. Reference Brès, Jordan, Jaunet, Le Rallic, Cavalieri, Towne, Lele, Colonius and Schmidt2018; Bogey Reference Bogey2021a), also appear at the four frequencies mentioned above. These results further support a link between the feedback loops and these modes. Finally, for
  $n_\theta =0$, additional tones are observed, namely two tones at
  $St=0.80$ and 1.20 for
  $h\leqslant 3r_0$, which are the harmonics of the first tone at
  $St=0.40$, and a tone at
  $St=0.60$ for
  $h=4.4r_0$.

Figure 14. Strouhal numbers of the tones as functions of the hole diameter for (a)  $n_\theta =0$, and (b)
  $n_\theta =1$. Thin grey lines: frequencies obtained from equation (3.1) for increasing values of N.
The levels of the dominant tones at  $z=0$ are represented in figure 15 as functions of the hole diameter for the modes
  $n_\theta =0$ and
  $n_\theta =1$. Two radial positions,
  $r=1.5r_0$ and
  $15r_0$, are considered, and only the tones emerging by more than 3 dB from the broadband levels are displayed. For
  $n_\theta =0$ in figure 15(a), near the nozzle, the level of the dominant tone is strong for
  $h\leqslant 3r_0$, reaching a peak of 180 dB for
  $h=2r_0$. The amplitudes of the tone for jetsmallhole and jetmediumhole are slightly higher than for jetnohole. For
  $h=4.4r_0$, the tone level is reduced drastically by about 40 dB. This can be explained by the fact that for
  $h\leqslant 3r_0$, the upstream sound waves are created by the impingement of the jet turbulent structures on the plate, whereas for
  $h=4.4r_0$, they are produced by the scattering of the jet pressure fluctuations by the plate. In the latter case, the tone level is still 15 dB higher than that for the free jet. Farther away from the jet axis, at
  $r=15r_0$, the tone levels are highest for jetnohole and decrease monotonously with the hole diameter, contrary to the levels of the near-nozzle tones. This is expected given the different directivities of the jets highlighted in figure 4. For
  $n_\theta =1$, in figure 15(b), the level of the dominant near-nozzle tone also decreases continuously with the hole diameter. It is reduced by 5 dB between
  $h=0$ and
  $1.5r_0$, then by 15 dB for
  $h=4.4r_0$, tending towards the level for the free jet.

Figure 15. Dominant tone levels at  $z=0$ and
  $r=1.5r_0$ (small circles) and
  $r=15r_0$ (red triangles) as functions of the hole diameter for (a)
  $n_\theta =0$, and (b)
  $n_\theta =1$.
3.4. Investigation of the feedback loop
3.4.1. Visualisation of the feedback loop
In order to visualise the feedback loop, two-dimensional spatial correlations of the jet pressure fields are computed in a  $(z,r)$-section. The pressure fluctuations
  $p'$ at a reference point
  $(z_1,r_1)$ at time
  $t$ are correlated with the fluctuations of pressure in the
  $(z,r)$-section at time
  $t+\delta t$, defining the dimensionless coefficient
  $\mathcal {R}$ as
 \begin{equation} \mathcal{R}(r,z,\delta t)=\frac{\langle p'(r_1,z_1,t)\,p'(r,z,t+\delta t) \rangle}{\langle p'^{2}(r_1,z_1,t)\rangle^{1/2}\langle p'^{2}(r,z,t)\rangle^{1/2} }, \end{equation}
where  $\delta t$ is the time delay between the signals, and
  $\langle \cdot \rangle$ denotes time averaging. In this way, the structures and time variations of the waves correlated with the pressure fluctuations at the reference point are extracted. This method has notably been used to investigate noise generation in free jets at a Mach number of 0.9 in a recent work (Bogey Reference Bogey2019).
In the present study, due to the presence of tones emerging by more than 20 dB in the sound spectra, associated mainly with the mode  $n_\theta =0$, the pressure signals are strongly correlated. Therefore, links between the pressure at a reference point and flow structures cannot be clearly evidenced by computing correlations from the full signals or from the axisymmetric mode. However, the tones are much less emerging for the mode
  $n_\theta =1$. Correlations calculated for this mode are consequently shown in what follows.
The coefficients  $\mathcal {R}$ are first evaluated for
  $n_\theta =1$ for the four impinging jets for a reference point placed near the jet nozzle at
  $z_1=0$ and
  $r_1=1.5r_0$, in order to examine specifically the characteristics of the upstream acoustic radiation. Similar results are obtained for jetnohole, jetsmallhole and jetmediumhole. The correlations for the latter jet are represented in figure 16, for time delays
  $\delta t$ varying from
  $-15r_0/u_j$ to
  $6r_0/u_j$. They can also be seen in supplementary movie 3. For
  $\delta t=-15r_0/u_j$ and
  $-12r_0/u_j$, in figures 16(a,b), the correlation levels are highest around the shear layers of the jet, at
  $z\simeq 2.5r_0$ for
  $\delta t=-15r_0/u_j$, and
  $z\simeq 4r_0$ for
  $\delta t=-12r_0/u_j$. They are linked to flow coherent structures convected in the jet flow direction, which constitute the downstream part of the feedback mechanism. For
  $\delta t=-9r_0/u_j$ and
  $-6r_0/u_j$, in figures 16(c,d), the correlation levels increase and they are strongest near the hole, as the flow structures impinge on the hole edges. For
  $\delta t=-3r_0/u_j$, in figure 16(e), the correlation levels are greater than 0.5, which is significantly higher than the levels for the previous time delays. A curved region of strong positive correlations, in red, is aligned with a circle centred on the hole edge, at
  $z=L$ and
  $r=1.5r_0$. It can be related to an acoustic wave produced by the jet impingement on the plate, which forms the upstream part of the feedback loop. The correlations are significant outside but also inside the jet. The propagation of an upstream wave travelling at the ambient sound velocity in the jet column is thus highlighted, as noticed for supersonic impinging jets by Bogey & Gojon (Reference Bogey and Gojon2017). This wave is related to the guided jet waves studied later, in § 3.4.2. For
  $\delta t=0$, in figure 16(f), the correlation level is equal to 1 at the point
  $(z_1,r_1)$, as expected. Moreover, as for the previous time delay, the acoustic wavefront has a circular shape, and the correlations are strong both in the jet flow and near pressure fields. For later time delays
  $\delta t=3r_0/u_j$ and
  $6r_0/u_j$, in figures 16(g,h), the correlation levels are lower than 0.2, except for two regions. The first is due to the upstream propagation of the acoustic waves. The second is found around the shear layers at
  $z=r_0$ for
  $\delta t=3r_0/u_j$ and at
  $z=3r_0$ for
  $\delta t=6r_0/u_j$, revealing the generation and convection of a new coherent structure in the flow, and thus the downstream part of a new feedback cycle.

Figure 16. Correlations  $\mathcal {R}$ of
  $p'(r=1.5r_0,z=0,t)$ with
  $p'(r,z,t+\delta t)$ for
  $n_\theta =1$ for (a)
  $\delta t=-15r_0/u_j$, (b)
  $\delta t=-12r_0/u_j$, (c)
  $\delta t=-9r_0/u_j$, (d)
  $\delta t=-6r_0/u_j$, (e)
  $\delta t=-3r_0/u_j$, (f)
  $\delta t=0$, (g)
  $\delta t=3r_0/u_j$, and (h)
  $\delta t=6r_0/u_j$, for jetmediumhole. Thin black line: circle centred on (
 $z=L$,
  $r=1.5r_0$). The colour scale ranges between
  ${\pm }1$, from blue to red.
The correlations  $\mathcal {R}$ obtained for jetlargehole are displayed in figure 17 and in supplementary movie 4 for time delays
  $\delta t$ varying from
  $-15r_0/u_j$ to
  $6r_0/u_j$. For
  $\delta t=-15r_0/u_j$, in figure 17(a), the correlations are weak, with levels lower than 0.3. They are stronger for
  ${\delta t=-12r_0/u_j}$, in figure 17(b), exhibiting a wavepacket structure with four lobes around the shear layer at
  $z\simeq 3r_0$. Later, the wavepacket structure is convected down to the plate, as in figure 17(c) for
  $\delta t=-9r_0/u_j$, for instance. It is then scattered by the hole edges for
  $\delta t=-9r_0/u_j$ and
  $-6r_0/u_j$, in figures 17(c,d). The scattering of the aerodynamic pressure fluctuations generates acoustic waves, causing high correlation levels upstream and downstream of the plate for
  ${\delta t=-3r_0/u_j}$, aligned with a circle centred on the hole edge in figure 17(e). Upstream, in particular, the waves propagate up to the reference point in figure 17(f). As for jetmediumhole, non-negligible correlation levels are also found inside the jet, indicating the propagation of an upstream wave at the sound speed in the jet potential core. This wave belongs to the guided jet modes described in § 3.4.2. Afterwards, the correlation levels finally decrease. Spots of significant correlations are nevertheless found near the shear layers at
  $z\simeq r_0$ for
  $\delta t=3r_0/u_j$ in figure 17(g), and at
  $z\simeq 4r_0$ for
  $\delta t=6r_0/u_j$ in figure 17(h). They can be attributed to a flow coherent structure convected downstream, initiating a new feedback cycle, as mentioned above for jetmediumhole.

Figure 17. Correlations  $\mathcal {R}$ of
  $p'(r=1.5r_0,z=0,t)$ with
  $p'(r,z,t+\delta t)$ for
  $n_\theta =1$ for (a)
  $\delta t=-15r_0/u_j$, (b)
  $\delta t=-12r_0/u_j$, (c)
  $\delta t=-9r_0/u_j$, (d)
  $\delta t=-6r_0/u_j$, (e)
  $\delta t=-3r_0/u_j$, (f)
  $\delta t=0$, (g)
  $\delta t=3r_0/u_j$, and (h)
  $\delta t=6r_0/u_j$, for jetlargehole. Thin black line: circle centred on (
 $z=L$,
  $r=2.2r_0$). The colour scale ranges between
  $\pm 1$, from blue to red.
Two-dimensional spatial correlations are also computed for  $n_\theta =1$ for a reference point located at
  $z=2L$ and
  $r=15r_0$ to shed light on the sound generation downstream of the plate. The results obtained for jetmediumhole and jetlargehole are represented in figures 18 and 19, respectively, for the time delays
  $\delta t=-15r_0/u_j$,
  $-10r_0/u_j$ and
  $-5r_0/u_j$. For
  $\delta t=-15r_0/u_j$, weak correlations are found for jetmediumhole near the hole in figure 18(a). The correlations for jetlargehole in figure 19(a) are stronger and reveal a wavepacket structure just outside of the jet shear layers upstream of the plate. Later, for
  $\delta t=-10r_0/u_j$ and then for
  $\delta t=-5r_0/u_j$, curved regions of correlation levels higher than 0.6 and centred on the hole edge are observed for both jets in figures 18(b,c) and 19(b,c). Therefore, the sound waves radiated downstream of the plate are related to phenomena occurring close to the hole edge. These phenomena can be of different natures depending on the hole diameter, and consist of the interactions of the hole edge with the vortical structures passing through the hole for jetmediumhole, and with the jet aerodynamic pressure waves, surrounding the flow structures, for jetlargehole.

Figure 18. Correlations  $\mathcal {R}$ of
  $p'(r=15r_0,z=12r_0,t)$ with
  $p'(r,z,t+\delta t)$ for
  $n_\theta =1$ for (a)
  $\delta t=-15r_0/u_j$, (b)
  $\delta t=-10r_0/u_j$, and (c)
  $\delta t=-5r_0/u_j$, for jetmediumhole. Thin black line: circle centred on (
 $z=L$,
  $r=1.5r_0$). The colour scale ranges between
  $\pm 1$, from blue to red.

Figure 19. Correlations  $\mathcal {R}$ of
  $p'(r=15r_0,z=12r_0,t)$ with
  $p'(r,z,t+\delta t)$ for
  $n_\theta =1$ for (a)
  $\delta t=-15r_0/u_j$, (b)
  $\delta t=-10r_0/u_j$, and (c)
  $\delta t=-5r_0/u_j$, for jetlargehole. Thin black line: circle centred on (
 $z=L$,
  $r=2.2r_0$). The colour scale ranges between
  $\pm 1$, from blue to red.
3.4.2. Guided jet modes
In order to discuss the nature of the upstream-travelling waves closing the feedback loops in the impinging jets, frequency–wavenumber spectra have been computed as recently in Bogey (Reference Bogey2021a). They are calculated from the pressure fluctuations in the jet shear layer at  $r=r_0$ between
  $z=0$ and
  $z=4r_0$ for jetnohole and jetsmallhole, and between
  $z=0$ and
  $z=10r_0$ for the other jets for the two first azimuthal modes
  $n_\theta =0$ and
  $1$. The spectra obtained for jetmediumhole, jetlargehole and the free jet are represented in figure 20 as functions of
  $k$ and
  $St$, for negative wavenumbers. The results for jetnohole and jetsmallhole are not shown, but they look like those for jetmediumhole. The dispersion curves of the guided jet waves given by a vortex-sheet model (Tam & Ahuja Reference Tam and Ahuja1990) are also displayed using red lines. Finally, the tone frequencies emerging in the LES pressure spectra in § 3.3.2 are indicated by red triangles placed at
  $k=0$.

Figure 20. Frequency–wavenumber spectra of the pressure fluctuations at  $r=r_0$ for (a,d) jetmediumhole, (b,e) jetlargehole, and (c,f) the free jet, for (a–c)
  $n_\theta =0$ and (d–f)
  $n_\theta =1$. Red solid line, dispersion curves; red asterisks, lower limits of the guided jet modes for a vortex-sheet model; red triangles, LES tone frequencies; dashed line,
  $k=-\omega /c_0$. The greyscale levels spread over 25 dB.
The dispersion curves start on the sonic line  $k=-\omega /c_0$. Farther from this line, as the wavenumber increases, in absolute value, the frequency of the waves increases up to a local maximum, then it is reduced down to a local minimum and finally increases again. Three kinds of waves can be defined, depending on their positions on the dispersion curves, as proposed by Towne et al. (Reference Towne, Cavalieri, Jordan, Colonius, Schmidt, Jaunet and Brès2017). The waves between the sonic line and the local maximum have a negative group velocity
  $v_g={\rm d}\omega /{\rm d}k$ and a support outside the jet. They can be referred to as upstream-travelling free-stream waves. In the other cases, the waves are entirely confined in the jet. They propagate downstream for the waves between the two local extremum frequencies on the curves, and upstream otherwise. They will be denominated as downstream- and upstream-propagating duct-like waves, respectively. For jetmediumhole, in figures 20(a,d), lines of high energy extending over the whole range of wavenumbers are found at the Strouhal numbers of the tones in the LES sound spectra. Except for the tone at
  $St=1.20$ for
  $n_\theta =0$, they intersect the dispersion curves of the guided jet waves predicted by the vortex-sheet model, in regions where the waves are the upstream-travelling free-stream ones. Therefore, these waves are likely to close the feedback loops generating the tones. As for the tone at
  $St=1.20$, it can be expected to result from nonlinear effects between the two tones at
  $St=0.40$ and
  $St=0.80$. For jetlargehole, in figures 20(b,e), no lines are visible at the Strouhal numbers of the tones, contrary to jetmediumhole, which is most probably due to the quite weak tones in this case where the hole diameter is the largest. Curved bands are, however, observed clearly near the dispersion curves of the guided jet waves for the vortex-sheet model. They are very similar to those found for the free jet in figures 20(c,f). On these bands, the intensity is high near the line
  $k=-\omega /c_0$, decreases farther from it, and is negligible for low wavenumbers. These variations of the intensity can be explained by the fact that the guided jet waves close to the line
  $k=-\omega /c_0$ are free-stream waves, whereas those far from the line are duct-like waves (Tam & Ahuja Reference Tam and Ahuja1990; Towne et al. Reference Towne, Cavalieri, Jordan, Colonius, Schmidt, Jaunet and Brès2017). Concerning the LES tones, their frequencies lie in the frequency bands of the free-stream upstream-propagating modes, highlighting again the role of these waves in the feedback loops. Moreover, as seen previously in figure 14, the tone frequencies do not vary much with the hole diameter. Despite different noise generation mechanisms – namely the scattering of the jet pressure for jetlargehole and vortical structures impinging on the plate for the other jets – they seem to be determined mainly by the frequency of the free-stream upstream-propagating guided jet waves. The tone frequencies are also close to those produced by jet-flap interactions at the same Mach number (Jordan et al. Reference Jordan, Jaunet, Towne, Cavalieri, Colonius, Schmidt and Agarwal2018), supporting again the idea that they are influenced weakly by the nature of the interactions between the jet and the plate.
To visualise both the downstream and the upstream parts of the feedback loops, the frequency–wavenumber spectrum obtained for the tonal case jetmediumhole for  $n_\theta =0$ is presented in figure 21 for negative but also positive wavenumbers. The lines found at the tone frequencies for
  $k\leqslant 0$ extend for
  $k\geqslant 0$. In the latter region, the strongest levels are close to the line
  $k=\omega /u_c$, with
  $u_c=(2/3) \times u_j$. Therefore, the downstream component of the feedback loops consists of flow structures convected in the jet mixing layers at the velocity
  $u_c$, as expected. These structures develop at the tone frequencies, due to the forcing of the shear layers near the nozzle lips at these frequencies, evidenced in the velocity spectra of figure 9.

Figure 21. Frequency–wavenumber spectrum of the pressure fluctuations at  $r=r_0$ for jetmediumhole for
  $n_\theta =0$. Red solid line, dispersion curves; red asterisks, lower limits of the guided jet modes for a vortex-sheet model; red triangles, LES tone frequencies; dashed black line,
  $k=-\omega /c_0$; red dashed line,
  $k=\omega /u_c$. The greyscale levels spread over 25 dB.
3.5. Noise source investigation using Curle's analogy
3.5.1. Curle's analogy
The noise radiated by flows interacting with rigid bodies can be investigated using acoustic analogies. In particular, an analogy in which the noise generated by such flows consists of two components was proposed by Curle (Reference Curle1955). The first component is the aerodynamic noise produced by the flow turbulence, whereas the second, dominant at low Mach numbers, is related to the forces exerted on the solid bodies. This type of analogy allows the separation between the direct sound field, linked to the first component, and the reflected and scattered ones, associated with the second component. It has been applied to various flows. For example, it has allowed Gloerfelt, Bailly & Juvé (Reference Gloerfelt, Bailly and Juvé2003) to investigate the noise generated by a cavity flow at a Mach number of 0.7 and Gloerfelt et al. (Reference Gloerfelt, Pérot, Bailly and Juvé2005) to study the sound radiated by the flow around a cylinder at a Mach number of 0.12. In the first work, the authors showed that the pressure far field predicted by the analogy is close to that obtained by a direct numerical simulation. In an older study, Curle's analogy was employed by Preisser (Reference Preisser1979) to correlate the far field noise with the pressure on the plate for subsonic impinging jets.
For the present impinging jets, the term of Curle's analogy associated with the variations of pressure on the solid surfaces is considered to evaluate the acoustic field upstream and downstream of the plate. The amplitude of the pressure fluctuations due to this contribution is given by
 \begin{equation} p'(\boldsymbol{x},t)=\frac{1}{4{\rm \pi}}\,\frac{\partial}{\partial x_i} \int_S \frac{1}{R}\,P_i \left(\boldsymbol{y},t-\frac{R}{c_0} \right) {\rm d}S(\boldsymbol{y}) , \end{equation}
where  $R=|\boldsymbol {x}-\boldsymbol {y}|$ is the distance between a source on the plate and the observer, and
  $P_i=(p\delta _{ij}-\tau _{ij})l_j$ is the force per unit area exerted on the fluid by the plate in the direction
  $x_i$, with
  $\tau _{ij}$ the viscous stress tensor and
  $l_j$ the coordinates of the outward normal from the fluid. Here, the pressure normal to the plate is assumed to be dominant compared with the shear stresses, as in the work of Preisser (Reference Preisser1979). Under this assumption and by considering that the observer is in the acoustic far field, (3.3) can be simplified as
 \begin{equation} p'(\boldsymbol{x},t)=\frac{1}{4{\rm \pi} c_0}\,\frac{\partial}{\partial t}\int_S \frac{x_i-y_i}{R^{2}}\,p\left( \boldsymbol{y},t-\frac{R}{c_0} \right)l_i\,{\rm d}S(\boldsymbol{y}), \end{equation}
where the time derivative is evaluated using fourth-order centred finite differences. Equation (3.4) will be used to estimate the fluctuations of pressure both upstream and downstream of the plate. It may be noted that these fluctuations can also be evaluated using an analytical Green's function designed for a perforated plate, such as in the work of Howe (Reference Howe1979). This approach has not been carried out in the present work.
To examine the source terms in (3.4), the pressure spectra obtained on the plate at  $z=L$ and
  $r=3r_0$ are displayed in figure 22 for the four impinging jets. The levels are highest for jetnohole, and they decrease with the hole diameter. For jetnohole, jetsmallhole and jetmediumhole, tones are found at a Strouhal number of 0.4 and its harmonic frequencies, while for jetlargehole, a hump emerging by about 15 dB from the broadband levels is observed for frequencies lower than
  $St=0.7$. In all cases, the spectra look like those near the nozzle in figure 12, suggesting that the spectral content of the sound waves computed using the analogy will be similar to that of the LES sound fields. The resemblance between the pressure spectra on the plate and those in the acoustic field has also been noted for supersonic impinging jets in the numerical study of Gojon & Bogey (Reference Gojon and Bogey2018).

Figure 22. Pressure spectra on the plate at  $z=L$ and
  $r=3r_0$ for jetnohole (black solid line), jetsmallhole (red solid line), jetmediumhole (blue solid line) and jetlargehole (green solid line).
3.5.2. Acoustic field upstream of the plate
The pressure fields obtained upstream of the plate using equation (3.4) for the four impinging jets are represented in figures 23(a–d). For all jets, periodic waves originating from the plate are observed. They look like the acoustic waves propagating in the LES pressure fields, given in figures 23(e–h), as expected. In the two cases, for  $r\geqslant 5r_0$, the levels of fluctuating pressure are close and the wavefronts are located at similar positions. In particular, the sound waves radiated in the radial direction are well reproduced using the analogy for jetsmallhole and jetmediumhole, in figures 23(b,f) and 23(c,g). Therefore, the surface term of Curle's analogy is able to predict an acoustic radiation consistent with the LES results, verifying the validity of the analogy for the present study. Close to the jet flow, for
  $r\leqslant 5r_0$, some discrepancies, such as a phase shift, can be seen between the pressure waves obtained from the analogy and the LES. However, the comparison between the two pressure fields is not fully relevant here due to the fact that (3.4) is reliable only in the far field.

Figure 23. Pressure fields obtained upstream of the plate (a–d) using equation (3.4), and (e–h) from LES, for (a,e) jetnohole, (b,f) jetsmallhole, (c,g) jetmediumhole, and (d,h) jetlargehole. The colour scales range between (a–c,e–g)  $\pm 0.01 p_0$, and (d,h)
  $\pm 0.0025 p_0$, from blue to red.
The acoustic spectra computed near the nozzle at  $z=0$ and
  $r=1.5r_0$ using equation (3.4) are compared with the LES spectra in figure 24. For the four impinging jets, good agreement is found. In particular, the effects of the hole and its size are well reproduced. For jetnohole, jetsmallhole and jetmediumhole, in figures 24(a–c), the spectra obtained from the analogy and the LES exhibit tones at the same frequencies, including the dominant tone at
  $St=0.40 - 0.41$ and its harmonics, unsurprisingly given the frequency contents of the pressure spectra on the plate. However, the tone levels do not match perfectly. For instance, the dominant tones are 4–10 dB stronger in the LES than using the acoustic analogy. These discrepancies may be related to the noise radiation of aerodynamic phenomena such as the distortion of the vortical structures near the plate, not taken into account using the analogy. As for the broadband levels obtained using the analogy, for jetsmallhole and jetmediumhole, they are similar to those of the LES, with differences lower than 3 dB. For jetnohole, they are close to the LES levels for
  $St>1$, but they are about 5 dB lower for
  $St<1$. This result suggests that in this case, the contribution of the pressure fluctuations on the plate to the broadband noise is dominant at high frequencies.

Figure 24. Sound pressure levels obtained at  $z=0$ and
  $r=1.5r_0$ from LES (black solid line) and using equation (3.4) (red solid line) for (a) jetnohole, (b) jetsmallhole, (c) jetmediumhole, and (d) jetlargehole, as functions of the Strouhal number.
For jetlargehole, in figure 24(d), the spectra from the analogy and the LES exhibit peaks at  $St=0.40$ with comparable amplitude. Around the peaks, for
  $St<0.8$, the levels obtained using the analogy are close to those of the LES with discrepancies lower than 3 dB, implying that the scattering of the jet aerodynamic pressure by the perforated plate is the main noise source. For
  $St>0.8$, the levels are about 15 dB lower using the analogy than in the LES, suggesting that the high-frequency noise components are related to the flow turbulence. It can also be noted that the LES spectrum contains weak peaks for
  $0.8 \leqslant St \leqslant 3$ due to the presence of upstream-travelling guided jet waves (Towne et al. Reference Towne, Cavalieri, Jordan, Colonius, Schmidt, Jaunet and Brès2017; Bogey Reference Bogey2021a), as mentioned previously, in § 3.3.2. Naturally, these peaks are missing in the spectrum determined using Curle's analogy.
As mentioned in § 3.5.1, the reflected and scattered sound fields are related to the surface term of Curle's analogy, whereas the direct sound field consists of the jet mixing noise and sound components linked to the flow distortion near the plate. With the aim of evaluating more precisely these two contributions to the pressure field, the sound levels estimated at  $z=0$ using Curle's analogy for jetsmallhole and jetlargehole are shown in figure 25, together with the levels obtained by the LES and for the free jet. The results for jetnohole and jetmediumhole, similar to those for jetsmallhole, are not represented, for brevity. In all cases, the sound levels from the analogy and the LES decrease with the radial distance. For jetsmallhole, in figure 25(a), close to the nozzle, the results from the LES and the analogy exhibit discrepancies. Compared with the levels in the LES, for
  $r\leqslant 3r_0$, the levels predicted by the analogy are lower, with differences up to 9 dB, whereas for
  $3r_0\leqslant r \leqslant 8r_0$, they are higher, with a maximum discrepancy of 4 dB. These differences may be due to the neglect of the aerodynamic noise sources in the analogy, especially those related to the impact of the jet mixing layers on the plate. Farther from the axis, for
  $r\geqslant 8r_0$, the levels given by the analogy are close to those from the LES, with less than 2 dB of differences. The present results highlight a significant contribution of the fluctuations of pressure on the plate to the noise radiated upstream. For jetlargehole, in figure 25(b), the levels obtained using the analogy are similar to those from the LES, showing differences lower than 3 dB. This good agreement suggests that the upstream-propagating sound waves are produced mainly by the scattering of the jet pressure fluctuations by the plate.

Figure 25. Overall sound pressure levels (OASPL) obtained at  $z=0$ from LES (black solid lines) and using equation (3.4) (red solid lines) for (a) jetsmallhole, and (b) jetlargehole. Blue dashed line, levels for the free jet.
3.5.3. Acoustic field downstream of the plate
The pressure fields obtained downstream of the plate using Curle's analogy for the three jets impinging on a perforated plate are represented in figures 26(a–c). In all cases, periodic and almost circular pressure waves are found to originate from the hole in the plates. Their wavelengths and magnitudes are similar to those of the sound waves propagating in the LES fields, shown in figures 26(d–f). Therefore, the variations of pressure on the plate by the jet flow generate the main part of the downstream acoustic radiation for  $z\leqslant 20r_0$. However, the shapes of the wavefronts are slightly different, especially close to the jet flow. These differences may be due to the refraction of sound waves by the flow, not predicted by the analogy.

Figure 26. Pressure fields obtained downstream of the plate (a–c) using equation (3.4), and (d–f) from LES, for (a,d) jetsmallhole, (b,e) jetmediumhole, and (c,f) jetlargehole. The colour scales range between (a,b,d,e)  ${\pm }0.01 p_0$, and (c,f)
  ${\pm }0.0025 p_0$, from blue to red.
The pressure spectra calculated at  $z=12r_0$ and
  $r=15r_0$ using the analogy are plotted in figure 27. They are very similar to those obtained from the LES. For jetsmallhole and jetmediumhole, in figures 27(a,b), they display peaks at the dominant feedback frequency
  $St=0.40$ and its harmonic frequencies. For the two first peaks for jetsmallhole and the first peak for jetmediumhole, the levels are close to the LES levels, with differences lower than 4 dB. Furthermore, the broadband levels determined using the analogy and the LES do not differ by more than 3 dB. Therefore, the acoustic radiation downstream of the plate seems to be produced mainly by the pressure fluctuations on the plate due to the flow impingement. Discrepancies can, however, be noted. Indeed, for the third and fourth tones for jetsmallhole, and for the second and third tones for jetmediumhole, the levels evaluated using the analogy do not agree well with the LES results. Therefore, these tones may be due to noise generation mechanisms not taken into account by Curle's analogy, such as the interactions of turbulent structures just downstream of the plate. Finally, for jetlargehole, in figure 27(c), the spectrum predicted at
  $z=12r_0$ and
  $r=15r_0$ using the analogy is close to that of the LES, with very good agreement for
  $St<0.6$ and discrepancies lower than 3 dB for higher frequencies. The sound waves reaching the point at
  $z=12r_0$ and
  $r=15r_0$ thus appear to be generated mainly by the scattering of the jet pressure waves by the hole edge, and not by the turbulent jet developing past the hole.

Figure 27. Sound pressure levels obtained at  $z=12r_0$ and
  $r=15r_0$ from LES (black solid line) and using equation (3.4) (red solid line) for (a) jetsmallhole, (b) jetmediumhole, and (c) jetlargehole, as functions of the Strouhal number.
To quantify more accurately the contribution of the scattered sound waves to the downstream pressure field, the sound levels obtained at  $r=15r_0$ for
  $z\geqslant 10r_0$ using the analogy for jetsmallhole and jetlargehole are displayed in figure 28. They are compared with the levels for the LES and for the free jet. The results for jetmediumhole, not shown here, look like those for jetsmallhole. For jetsmallhole, in figure 28(a), the levels from the analogy do not vary much with the axial distance, and are approximately equal to 140 dB. They are close to those of the LES down to
  $z=22r_0$, with less than 2 dB of discrepancies. Farther downstream, the LES levels decrease to 130 dB at
  $z=40r_0$. This reduction may be due to the refraction of the sound waves by the jet flow, neglected in the analogy. For jetlargehole, in figure 28(b), the levels in the LES are almost constant and close to 122 dB, while those for the analogy are lower and decrease with the axial distance. For
  $z\leqslant 15r_0$, the analogy provides levels lower by less than 3 dB than the LES levels, which suggests that most of the noise in this region is produced by the waves scattered by the plate. Farther downstream, the discrepancy increases to 9 dB at
  $z=40r_0$. Therefore, far from the plate, the sound radiation does not seem to be due substantially to the interactions between the jet and the plate. In particular, for
  $z\geqslant 30r_0$, the LES levels are similar to those for the free jet, implying that the jet mixing noise is the main noise component for low radiation angles.

Figure 28. Overall sound pressure levels obtained downstream of the plate at  $r=15r_0$ from LES (black solid line) and using equation (3.4) (red solid line) for (a) jetsmallhole, and (b) jetlargehole. Blue dashed line, levels for the free jet.
4. Conclusion
In this paper, the production of tones by a round jet at a Mach number of 0.9 impinging on a plate with and without a hole of varying diameter  $h$ has been investigated using compressible large-eddy simulations. For all plate geometries, tones emerge in the pressure spectra. Their frequencies are found to be nearly independent of the presence and of the size of the hole in the plate, in agreement with the frequencies expected for aeroacoustic feedback loops establishing between the nozzle lips and the plate, involving turbulent structures convected downstream by the jet flow and acoustic waves travelling upstream. The latter waves, moreover, appear to belong to the family of the free-stream upstream-propagating guided waves of the jet, allowing us to explain the azimuthal structure of the jet oscillation mode at each tone frequency. Regarding the tone intensities, they decrease when the hole in the plate is larger, weakly when the hole diameter increases from
  $h=2r_0$ to
  $h=3r_0$, but very strongly between
  $h=3r_0$ and
  $h=4.4r_0$. The reason for that is shown to be the different mechanisms producing the acoustic waves closing the feedback loops. Indeed, these waves are generated directly by the impingement of the jet flow structures on the plate for the two smallest holes, but by the scattering of the jet aerodynamic pressure fluctuations by the plate for the largest hole, leading to much weaker tones in that case. These results emphasise the importance of the nature of the interactions between the jet flow and the plate in producing strongly emerging acoustic tones. Finally, an acoustic analogy based on the variations of the pressure on the plate has also been used to study the nature of the dominant noise sources. It provides results in good agreement with the LES, showing the significant contribution of the pressure fluctuations on the plate to the pressure field. In the future, it could be interesting to examine whether the present phenomena observed for a high-subsonic jet will also be obtained for supersonic jets impinging on a perforated plate. In particular, this may not be the case for impinging rocket jets, for which no acoustic tones have been reported in the literature.
Supplementary movies
Supplementary movies are available at https://doi.org/10.1017/jfm.2022.47.
Acknowledgements
This work was financed by ArianeGroup and the DGA (Direction Générale de l'Armement) and by the IRICE IJES project RA0014963 (Installed Jet Effect Simulator, FEDER-FSE Rhône-Alpes). It was granted access to the HPC resources of PMCS2I (Pôle de Modélisation et de Calcul en Sciences de l'Ingénieur et de l'Information) of Ecole Centrale de Lyon, PSMN (Pôle Scientifique de Modélisation Numérique) of ENS de Lyon and P2CHPD (Pôle de Calcul Hautes Performances Dédiés) of Université Lyon I, members of FLMSN (Fédération Lyonnaise de Modélisation et Sciences Numériques), partner of EQUIPEX EQUIP@MESO, and to the resources of TGCC (Très Grand Centre de calcul du CEA) under the allocation 2020-2a0204 made by GENCI (Grand Equipement National de Calcul Intensif). It was performed within the framework of the Labex CeLyA of Université de Lyon, operated by the French National Research Agency (grant no. ANR-10-LABX-0060/ANR-16-IDEX-0005).
Declaration of interests
The authors report no conflict of interest.


