


INTRODUCTION
A growing body of research has demonstrated that increases in the local minority population under certain conditions can lead to backlash of many varieties, including perceptions of cultural threat (Newman Reference Newman2013) and voting patterns (Enos Reference Enos2017; Maggio Reference Maggio2021; Newman et al., Reference Newman, Shah and Collingwood2018). However, whether this backlash, usually concentrated among Whites (but see Marrow Reference Marrow2011, Stuesse Reference Stuesse, Lacy and Odem2009), translates into a perception of racial backlash among the minority group undergoing rapid growth has received less attention. This is important to consider given that local anti-immigrant attitudes, for instance, do not always translate into actual perceptions of discrimination (Hopkins et al., Reference Hopkins, Mummolo, Esses, Kaiser, Marrow and McDermott2016), for various reasons. However, research on hate crimes has indeed found a relationship between local demographic change and these extreme racist events (Grattet Reference Grattet2009; Green et al., Reference Green, Strolovitch and Wong1998; Lyons Reference Lyons2008; Stacey et al., Reference Stacey, Carbone-López and Rosenfeld2011), particularly in areas with relatively few minority residents, indicating that increases in the racial/ethnic minority population may generate backlash that has serious consequences.
Might similar findings emerge for the relationship between demographic change and feelings of racism that are a regular part of minority life in the United States (Chou and Feagin, Reference Chou and Feagin2008; Deitch et al., Reference Deitch, Barsky, Butz, Chan, Brief and Bradley2003; Feagin Reference Feagin1991; Pérez et al., Reference Pérez, Fortuna and Alegria2008; Swim et al., Reference Swim, Hyers, Cohen, Fitzgerald and Bylsma2003)? Several studies have suggested that this may be the case (Blalock Reference Blalock1956; Jiménez Reference Jiménez2010; Tuan Reference Tuan1998). Notably, Eric Stewart and colleagues (Reference Stewart, Baumer, Brunson and Simons2009) find that perceptions of police discrimination among a sample of Black youths are higher in neighborhoods that are predominantly White but undergoing an increase in the Black population. But contemporary research systematically examining the relationship between Black, Hispanic, and Asian growth and overall perceptions of racism is lacking. More generally, research has found the impact of other contextual factors to be mixed in terms of perceptions of discrimination (Almeida et al., Reference Almeida, Biello, Pedraza, Wintner and Viruell-Fuentes2016; Camacho et al., Reference Camacho, Allen and Quinn2019; Dailey et al., Reference Dailey, Kasl, Holford, Lewis and Jones2010; Ebert and Ovink, Reference Ebert and Ovink2014; English et al., Reference English, Lambert, Evans and Zonderman2014; Gay Reference Gay2004; Hopkins et al., Reference Hopkins, Mummolo, Esses, Kaiser, Marrow and McDermott2016; Hunt et al., Reference Hunt, Wise, Jipguep, Cozier and Rosenberg2007; McDermott Reference McDermott2011; Stewart et al., Reference Stewart, Baumer, Brunson and Simons2009; Welch et al., Reference Welch, Sigelman, Bledsoe and Combs2001).Footnote 1 There are reasons to believe, however, that demographic change may be a particularly important contextual factor in its impact on perceptions of racism.
This study examines various individual and contextual predictors of perceptions of “racial problems” for Black, Hispanic, and Asian respondents, with a specific focus on how these perceptions change in places where the numbers for each of these groups are increasing rapidly. I examine this with standard OLS, ordered logistic, and multinomial logistic regressions as well as regressions that account for selection into treatment, keeping in mind that where certain groups grow is not random and may be related to perceptions of racism. I dig deeper into these results by looking at variation by pre-existing racial/ethnic demographics, education, and nativity.
I find that growth in the Black and Hispanic populations at the county level predicts a decrease in the likelihood that Black and Hispanic respondents, respectively, believe that racial problems are rare and/or isolated (though other negative racism-related understandings/attitudes are not necessarily heightened in these rapidly changing settings). I interpret these results around racial problems as an increase in perceptions of racism and/or racial conflict. This holds in OLS models, ordered logistic models, multinomial logistic models, and models accounting for selection into treatment. The same cannot be said for Asians, a group that may receive a relatively more positive reception from Whites (Pew Research Center 2015) or may be growing in places more amendable to increasing diversity. Additionally, I find this relationship to be concentrated among Blacks and Hispanics without at least four-year degrees. Due to sample size limitations, I am only able to examine subsamples by nativity for Hispanics. I find that both U.S.-born and foreign-born Hispanics perceive more racial problems in rapidly changing counties. Though the coefficient magnitudes are larger for foreign-born Hispanics, there is substantial overlap between point estimates and 95% confidence intervals for the two subsamples, leaving some ambiguity about this result. I also find that the relationship between Hispanic growth and perceptions of racial problems appears to be more pronounced in “new destination” counties, those that were more predominantly White (and less Hispanic) to begin with. Alternatively, counties with higher initial White populations (and lower initial Black populations) show no statistically significant relationship between Black growth and perceptions of racial problems for Blacks, highlighting distinct dynamics for each racial/ethnic group. Overall, it is clear that local demographic change is an important and under-examined predictor of racism-related outcomes for minorities in the United States.
RESEARCH EXAMINING BACKLASH TO DEMOGRAPHIC CHANGE
Racial/ethnic context has long been a key variable in research related to racial attitudes, prejudice, and discrimination. The work of Valdimer Orlando Key, Jr. (Reference Key1949) and Hubert M. Blalock (Reference Blalock1967) were instrumental in putting forth the idea that the presence of a large minority group can generate threat in ways that may increase prejudice, discrimination, and firmer maintenance of racial hierarchy. Gordon Allport (Reference Allport1954) provided an alternative framework whereby increased contact between disparate groups under certain conditions can generate goodwill and diminish prejudice. Although this group contact framework has found empirical support (Pettigrew and Tropp, Reference Pettigrew and Tropp2006), segregation between racial groups may prevent meaningful contact, perhaps allowing group threat to dominate (Enos Reference Enos2017). Subsequently, Blalock’s framework has found support over the years, particularly when examining places with large African American populations (Enos Reference Enos2016; Fossett and Kiecolt, Reference Fossett and Kiecolt1989; Glaser Reference Glaser1994; Taylor Reference Taylor1998), though perhaps more ambiguously for places with large Hispanic and Asian populations (Dixon and Rosenbaum, Reference Dixon and Rosenbaum2004; Fox Reference Fox2004; Taylor Reference Taylor1998).
Regardless, one of the major concerns in this literature is selection bias, whereby people with more or less positive views on racial diversity or towards a particular racial group may select in and out of places based on the local racial demographics. Relatedly, various scholars have argued that the current racial makeup of one’s city or neighborhood may in part be a reflection of these preferences, and rapid changes to this makeup may be a better predictor of racial backlash as these changes may upset one’s orientation to the racial climate. This research can still suffer from selection bias as people flee places due to racial demographic change, but across a relatively short time frame this research hopes to capture backlash before these patterns can fully take root. Subsequently, various researchers in the U.S. context have examined the relationship between racial/ethnic demographic change and backlash, mostly among Whites, again rooted in some classic works (Allport Reference Allport1954; Blalock Reference Blalock1956; Williams Reference Williams1947). For instance, Benjamin J. Newman (Reference Newman2013) finds a pronounced impact of Hispanic growth in “new destinations” on perceptions of cultural threat among Whites. Various authors have found increased Trump voting/support in places undergoing rapid Hispanic growth (Enos Reference Enos2017; Maggio Reference Maggio2021; Newman et al., Reference Newman, Shah and Collingwood2018).
SHIFTING THE FOCUS
The contemporary research described above focuses on the impact of racial/ethnic demographic change on the attitudes and behaviors of Whites. It may seem intuitive that backlash among Whites would result in some negative outcomes for racial/ethnic minorities themselves, but there are reasons to be cautious about this assumption. Daniel J. Hopkins and colleagues (Reference Hopkins, Mummolo, Esses, Kaiser, Marrow and McDermott2016), for instance, find a lack of geographic variation in perceptions of discrimination among immigrants, positing that although “local demographics shape residents’ social and political attitudes, they might not meaningfully influence how they interact with their neighbors” (p. 16). Potential explanations include the possibility that “Immigrants might not perceive discrimination if the actions of the native-born are either individually or collectively ambiguous, subject to multiple interpretations, or invisible to the native-born themselves” (Hopkins et al., Reference Hopkins, Mummolo, Esses, Kaiser, Marrow and McDermott2016, p. 16; Gaertner and Dovidio Reference Gaertner, Dovidio, Dovidio and Gaertner1986; Marrow Reference Marrow2011; Sears Reference Sears1983). Regardless, various studies have demonstrated a relationship between demographic change and experiences of hate crimes, indicating that backlash to demographic change has genuine and serious impacts for racial minorities. Donald P. Green and colleagues (Reference Green, Strolovitch and Wong1998) and Christopher J. Lyons (Reference Lyons2008) find that local growth in the African American population predicts increased hate crimes against this group in predominantly White areas. This might be intuitive for any scholar of Black history, given the violent reaction of Whites to Black population growth in various cities during the Great Migration (Wilkerson Reference Wilkerson2010),Footnote 2 but the growth of Hispanic and Asian populations in the post-1965 period has been relevant in hate crime research as well (Green et al., Reference Green, Strolovitch and Wong1998; Stacey et al., Reference Stacey, Carbone-López and Rosenfeld2011).
Perhaps the most compelling framework from these studies is the “defended neighborhood hypothesis,” whereby the likelihood of hate crimes is determined by “the interaction…between white homogeneity and the rate at which that homogeneity is being eroded” (Green et al., Reference Green, Strolovitch and Wong1998, p. 376). It should be noted that non-Whites may also attempt to defend against the erosion of their numerical advantage as new groups enter (Marrow Reference Marrow2011). The erosion aspect is the focus of this study, though I also examine how the effect of this erosion differs depending on the pre-existing racial/ethnic context. According to Green and colleagues (Reference Green, Strolovitch and Wong1998), “The literature on defended neighborhoods may be interpreted as a rapprochement between symbolic and realistic perspectives: while emphasizing the importance of nonmaterial values (such as preserving a way of life), ethnographers trace conflict over neighborhood territory to the onset of racial integration” (p. 376; Rieder Reference Rieder1985; Suttles Reference Suttles1972). The status in and “ownership” over a community for Whites may appear threatened as minority numbers increase, thus resulting in a backlash that can lead to a violent “defense” of said community.
Outside of hate crimes, Stewart and colleagues (Reference Stewart, Baumer, Brunson and Simons2009) address demographic change and perceptions of racial discrimination by police, their results in line with a “defended neighborhood” interpretation. On the qualitative side, Tomás Jiménez (Reference Jiménez2010) interviews later-generation Mexican-Americans in places that have had recent Mexican immigration and finds some evidence of heightened feelings of racism tied to backlash against these new influxes, with the U.S.-born respondents being “mistaken” for or “lumped in” with immigrants playing a role. Mia Tuan (Reference Tuan1998) identifies comparable feelings for Asians in California in places with increasing Asian migration. This study aims to determine if similar findings can be applied broadly to perceptions of racial problems using a national survey.
BLACK, HISPANIC, AND ASIAN GROWTH
There are various reasons to expect differential outcomes depending on the racial/ethnic group in question. African Americans are, by most accounts, the racial group most discriminated against in the United States, both historically and today (Kendi Reference Kendi2017). This is evidenced, for instance, by research on socioeconomic statistics and incarceration rates that indicate high levels of Black disadvantage (McIntosh et al., Reference McIntosh, Moss, Nunn and Shambaugh2020; Western and Pettit, Reference Western and Pettit2010), as well as high segregation rates (Iceland Reference Iceland2009), which indicate great social distance from Whites. More directly related to this study, large Black populations in a particular locality have consistently shown evidence of generating backlash among Whites (Enos Reference Enos2016; Fossett and Kiecolt, Reference Fossett and Kiecolt1989; Glaser Reference Glaser1994; Taylor Reference Taylor1998), while this has been less clear for large Hispanic and Asian populations (Dixon and Rosenbaum, Reference Dixon and Rosenbaum2004; Fox Reference Fox2004; Taylor Reference Taylor1998). Among the two major recent immigrant-origin groups, Hispanics and Asians, various research has demonstrated or implied a preference for Asian migration (Ha Reference Ha2010; Pew Research Center 2015). This may be related to the skill-based preference afforded to higher education migrants, on average (Hainmueller and Hiscox, Reference Hainmueller and Hiscox2010; Hainmueller et al., Reference Hainmueller, Hiscox and Margalit2015), though this likely ignores the class heterogeneity among the Asian population (Zong and Batalova, Reference Zong and Batalova2016), as well as the lack of a class-based preference afforded to African and Middle Eastern immigrants, for instance (Pew Research Center 2015). Regardless, all of the above assessments have caveats. Latinx demographic growth has been stigmatized in a way that may trigger a stronger backlash than African American growth (Chavez Reference Chavez2008). Perceptions of discrimination for Asians varies widely by ethnic group and how discrimination is defined (Ramakrishnan et al., Reference Ramakrishnan, Wong, Lee and Lee2017). Anti-Blackness may already be so great that local demographic patterns make little difference. The analyses in the current study will address these questions directly.
PRE-EXISTING RACIAL/ETHNIC CONTEXT, EDUCATION, AND NATIVITY
In line with the defended neighborhoods hypothesis, places with less of a minority population to begin with may be particularly susceptible to backlash, as they have much invested in the racial status quo. Newman (Reference Newman2013) finds evidence of this by demonstrating that backlash to Hispanic growth among Whites is particularly strong in places with little pre-existing Hispanic population. Whether this might translate to increased perceptions of discrimination or racism is less clear (Ebert and Ovink Reference Ebert and Ovink2014), but seems plausible. Alternatively, demographic change may follow a “tipping point” model, whereby demographic change will not generate backlash, and possibly discrimination, against a particular group until they reach a certain percentage of the population (or the White proportion decreases to a certain level), at which point they may begin to be viewed as a numerical threat (Schelling Reference Schelling and Pascal1972).Footnote 3
Education is another division that may be important. Those with college educations may not only have more contact with Whites, but also a great amount to lose in terms of access to mainstream economic and social life. This may lead to greater perceptions of racism during times of rapid demographic change. However, minorities with lower levels of education may be viewed as threats—economically, fiscally, or culturally—in a way that middle class minorities may not (Hainmueller and Hiscox, Reference Hainmueller and Hiscox2010; Hainmueller et al., Reference Hainmueller, Hiscox and Margalit2015; Rieder Reference Rieder1985), thus increasing backlash and discrimination against these groups in rapidly changing settings.
I also examine nativity, though only for Hispanics due to sample size constraints. On the one hand, foreign-born Hispanics may be targeted for discrimination and racism due to their accent, Spanish language usage, and/or lack of documentation (Pew Research Center 2007). Alternatively, because U.S.-born Hispanics may feel more connected to the U.S mainstream and have strong American identities (Telles and Sue, Reference Telles and Sue2019), they may be more jarred by discrimination driven by changes in ethnic makeup (Schildkraut Reference Schildkraut2005), thus heightening their perceptions of racism. This is not to mention the fact that, as fluent English speakers with higher levels of cultural awareness, they may be more attuned to an uptick in racism as well. A recent survey found the highest perceptions of discrimination for second generation Hispanics, followed by the foreign-born, and then the third generation (Lopez et al., Reference Lopez, Gonzalez-Barrera and Krogstad2018). But perceptions of racial problems may tell a different story.
DATA
I incorporate several datasets for the purposes of this study. The outcome and most of the covariates come from the 2016 Cooperative Congressional Election Study (CCES) (Ansolabehere and Schaffner, Reference Ansolabehere and Schaffner2017). This national survey has sizeable samples of each minority group, several racism-related questions, and information about county of residence. I choose county of residence due to past research demonstrating it as a relevant unit for respondents to notice demographic change (Newman and Velez, Reference Newman and Velez2014). From there, I merge in data from the 2000 Census and the 2010–2014 American Community Survey (ACS) as prepared by Social Explorer (U.S. Census Bureau 2001; 2015) in order to calculate the percentage point growth in Black, Hispanic, and Asian populations from 2000 to 2010–2014, just prior to the 2016 CCES survey. I choose percentage point growth for my main treatment variable in accordance with previous literature in this area (Hopkins Reference Hopkins2010; Newman Reference Newman2013) but examine percentage growth as well. I also use several other variables from the 2000 Census and 2010–2014 ACS. Lastly, I merge in 2016 Presidential Election data to provide a sense of the political climate at the county level around the time of the 2016 CCES survey (Leip Reference Leip2017).
OUTCOMES
As stated above, the primary outcome for this study is related to perceptions of racial problems (DeSante and Smith, Reference DeSante and Smith2017), measured by response to the following:
“Racial problems in the U.S. are rare, isolated situations:
-
1. Strongly disagree
-
2. Somewhat disagree
-
3. Neither agree nor disagree
-
4. Somewhat agree
-
5. Strongly agree”
If the score on this variable decreases as a result of demographic change and respondents show less agreement that racial problems are rare and/or isolated, I primarily interpret this as an increase in perceived racism, though it could indicate a more generalized perception of racial conflict. It should be noted that this variable may capture individual-level perceptions of racial problems or perceptions of racial problems for the group as whole. Thus, this outcome does not rely on respondents directly experiencing racism themselves. It may not even rely on observing it happening to others, but might also capture the “feeling” of racism that is often reported by racial minorities (Chou and Feagin, Reference Chou and Feagin2008), or a general understanding that racism is pervasive.
I also examine additional outcomes in the CCES, all racism-related, to determine if demographic change impacts other aspects of racial experiences for minority groups. These outcomes also use a five-point agreement/disagreement scale:
-
• “White people in the U.S. have certain advantages because of the color of their skin.”
-
• “I am angry that racism exists.”
-
• “I often find myself fearful of people of other races.”
On the one hand, we may expect all of these outcomes to be similarly impacted by demographic change and any subsequent backlash. On the other hand, it is also possible that perceptions of racism may increase in response to these social processes without any subsequent increase in recognition of White privilege, anger that racism exists, or fear of other races. Because these questions capture different aspects of racism/racial issues, their relationship to demographic change may be different. For example, Peggy McIntosh (Reference McIntosh1989) describes White privilege as the “invisible knapsack,” something that is crucial in understanding a racialized society but may not be especially visible to Whites or something that they want to acknowledge. Given this, it seems plausible that White privilege may not be “ramped up” in a situation of acute racial backlash, but instead may continue to function as part of the racial landscape. Additionally, the idea of being angry that racism exists is fairly ubiquitous among Blacks, Hispanics, and Asians, with very few respondents disagreeing with this statementFootnote 4 (see Table A in the appendix). It is possible that demographic change and racial backlash could increase awareness of racism without having much impact on anger that racism exists since racism already generates substantial anger among racial/ethnic minorities. Fear of other races may be the most likely of these three outcomes to be impacted by demographic change given that demographic change, under certain circumstances, may lead to an increase in the likelihood of hate crimes occurring (Grattet Reference Grattet2009; Green et al., Reference Green, Strolovitch and Wong1998; Lyons Reference Lyons2008; Stacey et al., Reference Stacey, Carbone-López and Rosenfeld2011). However, unless an individual or someone they know is the victim of a hate crime or such an incident receives a great amount of attention in the community, media, or political sphere, it may not result in increased fear of other races. Given evidence of underreporting of hate crimes (Pezzella et al., Reference Pezzella, Fetzer and Keller2019), it is a distinct possibility that many hate crimes may go relatively unnoticed. Alternatively, hate crimes can receive a great amount of attention and fear may follow (Perry Reference Perry, Hall, Corb and Grieve2014). However, more generally, it is not necessarily the case that increased perceptions of racism tied to demographic change will result in an increase in actual fear of other races. While all four of the outcomes above show some correlation, they are not so highly correlated among Blacks, Hispanics, and Asians that they could be considered to capture precisely the same concept (see Table B in the appendix).
METHODOLOGY
I first examine these outcomes using OLS regressions, with standard errors clustered by county since I include county-level contextual predictors in addition to individual-level ones. The main predictor is the growth of the non-Hispanic Black, Hispanic, and non-Hispanic Asian populations for subsamples of these respondent groups, operationalized both as continuous variables for percentage point growth and binary variables where “1” is respondents in counties in the top quartile of percentage point growth, and “0” is everyone else. The goal here is to identify potential non-linear effects but also to have a comparable analysis to selection models, which require a categorical treatment variable. Although this is the primary predictor, I also look at the relevance of other contextual and individual-level variables in predicting perceptions of racial problems. Overall, the county-level contextual variables account for the fact that racist and/or xenophobic attitudes may vary by the characteristics of the local population. These include percent of the given racial/ethnic minority group, percent non-Hispanic White, population density, median household income, and percent age twenty-five or higher with a BA+, all in 2010–2014. I additionally look at median household income change and percent age twenty-five or higher with a BA+ change from 2000 to 2010–2014. I also analyze Trump voting in 2016. I include a predictor for region of residence, given that the sample sizes for some states are too small to use state of residence. At the individual-level, I use variables that may lead someone to perceive greater or fewer racial problems. This is not necessarily to say that these characteristics lead to experiencing greater or fewer racial problems, though they may, but also that they might impact one’s knowledge and understanding of racial problems. These include education, family income, employment status, assessments of the national economy, nativity/immigrant generation, gender, birth year, union membership, having children under eighteen, marital status, length of residence in one’s current home, and length of residence in one’s current city. The research around these variables and their relationship to perceptions of racism/discrimination will be discussed along with the OLS regression results. Lastly, given that other population trends will be correlated with the demographic change variables mentioned above, I control for all other population growth at the county-level from 2000 to 2010–2014. In other words, the analysis of Black respondents controls for non-Black population growth, the analysis of Hispanic respondents controls for non-Hispanic population growth, and the analysis of Asian respondents controls for non-Asian population growth.
After analyzing these variables in OLS models, I analyze multinomial logistic models to address the results from the OLS models in more detail. For instance, does demographic change lead minority respondents to strong disagreement that racism is rare, or does it lead them to more neutrality on the topic, for instance? I will then move to models accounting for selection into treatment. Where Blacks, Hispanics, and Asians increase their population is not random, and is likely related to perceptions of racial problems. For instance, if minorities select into areas that are known to be progressive in terms of racial attitudes, perhaps more Democratic areas, the effect of demographic change on perceptions of racism could be underestimated by OLS regressions. If they select into areas where racial consciousness is quite high, perhaps areas with a higher minority population, the effect could be overestimated by OLS regressions. Therefore, I use two techniques that account for this selection into treatment: augmented inverse-probability-weighting (AIPW) and inverse-probability-weighted regression adjustment (IPWRA). These techniques weight cases according to the inverse probability of selection into treatment, based on a separate model, with the goal of making the characteristics predicting selection into treatment more similar for the treatment and control groups. Here, “treatment” cases are respondents living in counties in the top quartile of percentage point growth of their racial/ethnic group from 2000 to 2010–2014, since these methods require a categorical treatment variable. Once the characteristics are “balanced,” we can be more confident that any relationship between the treatment and outcome is the result of the treatment variable itself, rather than the different characteristics of the treatment and control counties. AIPW and IPWRA achieve this slightly differently (Huber and Drukker, Reference Huber and Drukker2015; StataCorp 2013), so I use both for a robust analysis. Cases with very high or low likelihoods of selection into treatment are excluded in order to maintain stable estimators (overlap assumption), thus reducing the sample sizes for all analyses (StataCorp 2013).
This technique is also applied to the additional subsamples. The models predicting selection into treatment use county-level variables including the percent of the respondent group, percent voting for Bush, median household income, population size, and population density, all in 2000. They also include median household income growth from 2000 to 2010–2014 and region of residence for the respondent. I use the variables from the OLS regressions as controls, except that I control for percent of the respondent group in 2000 instead of 2010–2014 as the best predictor of demographic change, given that the year 2000 is the beginning of the growth period.
Lastly, I use selection models to examine potential racial backlash for non-Hispanic Whites. Although such backlash to demographic change has been identified in various studies (Enos Reference Enos2017; Grattet Reference Grattet2009; Green et al.,Reference Green, Strolovitch and Wong1998; Lyons Reference Lyons2008; Maggio Reference Maggio2021; Newman et al., Reference Newman, Shah and Collingwood2018), I will specifically determine if demographic change impacts White racial attitudes in the CCES, again using the four racism-related outcomes, that may then be tied to increased perceptions of racism among minority groups. I subdivide these analyses by education given that past research has shown this to be an important predictor of racial attitudes (Wodtke Reference Wodtke2012), as well as by the pre-existing racial/ethnic demographics at the county-level, which has shown to be important in predicting backlash to demographic change (Grattet Reference Grattet2009; Green et al.,Reference Green, Strolovitch and Wong1998; Lyons Reference Lyons2008; Newman Reference Newman2013; Stewart et al., Reference Stewart, Baumer, Brunson and Simons2009).
DESCRIPTIVE STATISTICS
Table 1 provides a breakdown of the responses to the main question in this study: agreement or disagreement that racial problems are rare and/or isolated, by racial/ethnic group, with CCES survey weights applied. One advantage of the CCES is that, unlike many other surveys, there is information not only about nativity but also immigrant generation. Therefore, I also examine the breakdown of responses by nativity and immigrant generation. Among the U.S.-born, the “second generation” are those with at least one foreign-born parent, and the “third+ generation” are those without any foreign-born parents.
Table 1. Agreement that racial problems are rare and/or isolated by race/ethnicity, nativity, and immigrant generation (survey weighted)

Source: Cooperative Congressional Election Study 2016
Note: The generational totals do not add up to the overall total because of missing information on generation for a small number of respondents.
Firstly, it is very clear that Black respondents are much less likely to think racial problems are rare and/or isolated. Over 50% of Blacks strongly disagree with this statement, compared to 34.2% of Hispanics, and 29.8% of Asians. This accords with prior research showing that Blacks are, generally speaking, the most conscious of racism (Horowitz et al., Reference Horowitz, Brown and Cox2019). Alternatively, all of these groups are unlikely to strongly agree that racial problems are rare and/or isolated. Hispanics are a bit more likely than Asians to strongly disagree that racial problems are rare/isolated, except in the third generation and higher. For all racial/ethnic groups, the foreign-born demonstrate lower perceptions of racial problems than the full sample. This could partially be explained by the tendency of some immigrants to attribute discrimination to xenophobia instead of racism (Marrow Reference Marrow2011), the distinct understanding of racism among those born in the United States compared to those coming from places where issues of racism may be considered differently (Roth Reference Roth and Hall2008), and/or the optimism of immigrant parents that their children can achieve success through hard work, despite racism (Louie Reference Louie2012). Black respondents in the third+ generation are the most likely to strongly disagree that racial problems are rare/isolated of any group, once again highlighting the unique position of African Americans, most with ancestry dating back to slavery, in regard to the racial system of the United States. Blacks are also the most likely to strongly disagree that racial problems are rare/isolated within all generational groupings, likely demonstrating that anti-Blackness has a strong impact regardless of generational status (Sall Reference Sall2019). Interestingly, however, compared to Hispanics and Asians, there are a higher percentage of Blacks that strongly agree that racial problems are rare/isolated among the foreign-born and second generation, though this perception is fairly rare overall, especially among the U.S.-born. More about these relationships will be revealed in the OLS regressions.
RESULTS
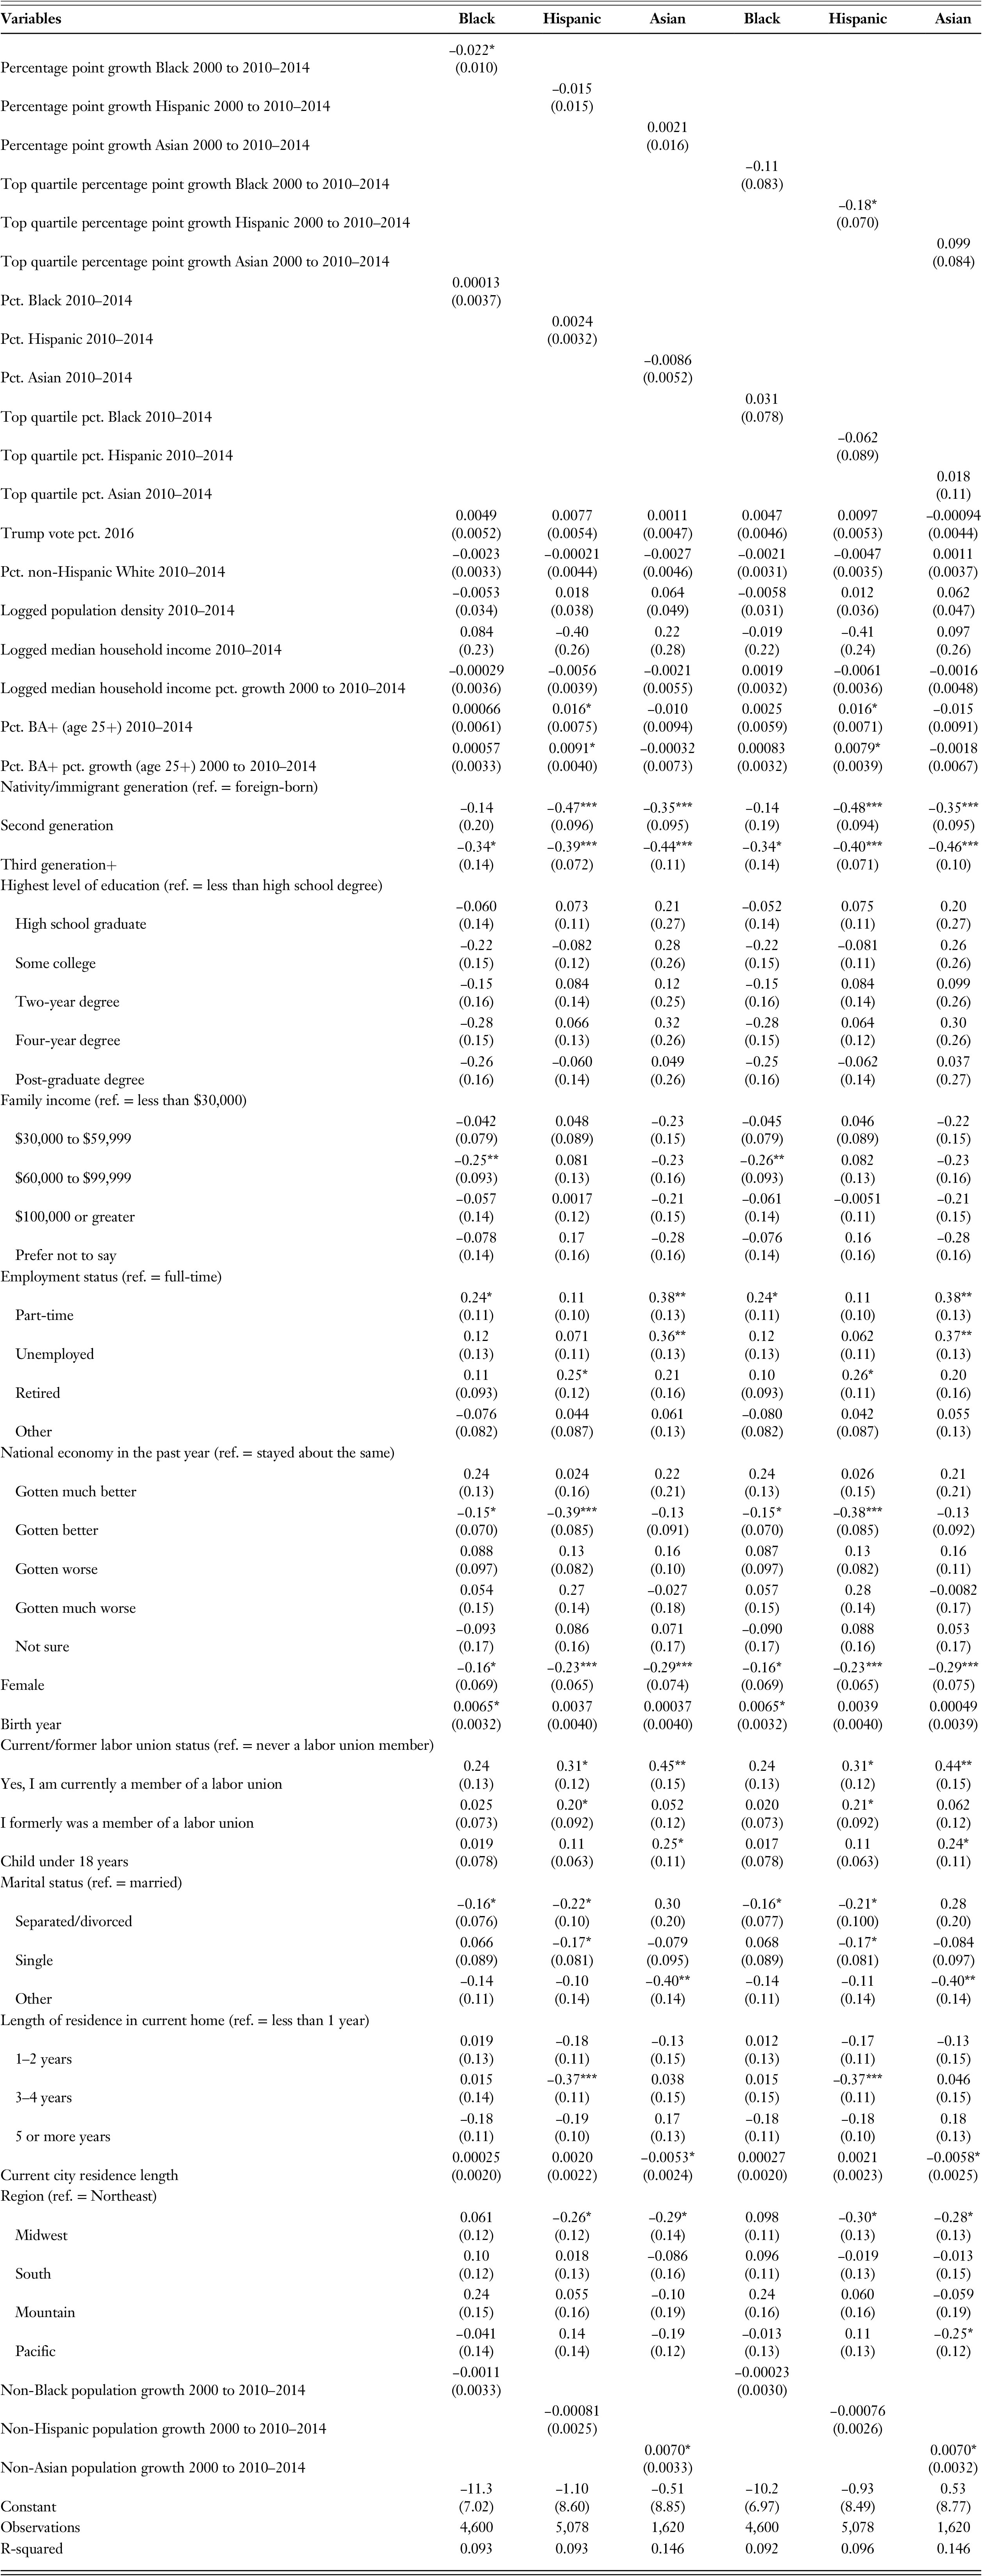
Table 2 displays OLS regressions predicting perceptions that racial problems are rare/isolated for each racial/ethnic group. A higher coefficient indicates stronger agreement that racial problems are rare/isolated (lower perception of racial problems), but I will often simply refer to lower/higher perceptions of racial problems for simplicity. Statistical significance is reported at the 5%, 1%, and .1% levels.
Table 2. OLS regressions predicting agreement that racial problems are rare/isolated with county-level demographic change and various other county-level and individual-level variables
Robust standard errors in parentheses
*** p<0.001, ** p<0.01, * p<0.05
Sources: Cooperative Congressional Election Study 2016, U.S. Census 2000, American Community Survey 2010–2014, Election Atlas
Firstly, there is evidence that demographic change at the county level is impactful for perceptions of racial problems among Blacks and Hispanics, though not among Asians. For Blacks, percentage point growth in the Black population from 2000 to 2010–2014 predicts a decrease in agreement that racial problems are rare/isolated. For Hispanics, living in a county in the top quartile of Hispanic percentage point growth from 2000 to 2010–2014 predicts the same pattern. This provides initial evidence that perceptions of racial problems among Blacks and Hispanics, though not Asians, are in fact stronger in places that are undergoing rapid demographic change. The selection models will go further to interrogate this issue, as well as explore the magnitudes in more detail. It should be noted that these relationships are similar when using ordered logistic regressions (not displayed). I also analyze an alternative specification where growth of the various groups is defined as percentage, not percentage point growth, and find no statistically significant results (not displayed).
It should also be noted that the result for Hispanic growth replicates for the top 40% and 30% of growth but becomes non-significant when examining the top 20% of growth. This is perhaps because places with very high levels of Hispanic percentage point growth have higher Hispanic populations to start with, and these places may be less susceptible to demographic backlash. Indeed, in an interaction analysis not presented, being in a county in the top 20% of Hispanic growth is associated with increased perceptions of racism in counties with lower Hispanic populations in 2000, but not in those with higher Hispanic populations in 2000 (interaction p-value = 0.145). Regardless, as described briefly below, the continuous version of Hispanic percentage point growth is predictive of increased perceptions of racism in the multinomial logistic regression model (p-value = 0.084).
In terms of the other contextual variables, there is no evidence that minorities living in places with higher (or lower) population percentages of their group in 2010–2014 more (or less) strongly perceive racial problems. This confirms the hypothesis that demographic change rather than group size is the key variable in understanding racial backlash and the ensuing rise in perceptions of racial problems. Additionally, most of the other county-level contextual variables do not demonstrate any statistically significant relationship with perceived racial problems for any of the groups. The exception is county-level education, where a higher percent and higher growth in the percent of the population with a bachelor’s degree (age twenty-five and higher) predicts decreased perceptions of racial problems among Hispanics, perhaps due to the perception that college educated populations have more progressive racial attitudes (Wodtke Reference Wodtke2012). In an analysis not presented, I break down the county-level income and education variables by race/ethnicity (White, Black, Hispanic, and Asian), and mostly do not find statistically significant results.Footnote 5 The exception is that Asian income growth predicts decreased perceptions of racial problems for Asians, perhaps suggesting that Asian income growth is not viewed as a threat, and instead may be positively received (Kurotani Reference Kurotani, Peacock, Watson and Matthews2005). There are also few differences based on region of residence, though there is some evidence that Hispanics and Asians in the Midwest have higher perceptions of racial problems compared to the Northeast, as do Asians in the Pacific region in one of the models. As stated in the literature review, past research has found that context has a mixed record in its impact on perceived discrimination (Almeida et al., Reference Almeida, Biello, Pedraza, Wintner and Viruell-Fuentes2016; Camacho et al., Reference Camacho, Allen and Quinn2019; Dailey et al., Reference Dailey, Kasl, Holford, Lewis and Jones2010; Ebert and Ovink, Reference Ebert and Ovink2014; English et al., Reference English, Lambert, Evans and Zonderman2014; Gay Reference Gay2004; Hopkins et al., Reference Hopkins, Mummolo, Esses, Kaiser, Marrow and McDermott2016; Hunt et al., Reference Hunt, Wise, Jipguep, Cozier and Rosenberg2007; McDermott Reference McDermott2011; Stewart et al., Reference Stewart, Baumer, Brunson and Simons2009; Welch et al., Reference Welch, Sigelman, Bledsoe and Combs2001).
There are various statistically significant relationships for the individual-level variables. Confirming the descriptive analysis from Table 1, the U.S.-born have higher perceptions of racial problems, though the difference between foreign-born and second generation Blacks is not statistically significant. Highly educated Black respondents have higher perceptions of racial problems, though these results are not quite statistically significant at the 5% level.Footnote 6 This is in line with other research demonstrating that Blacks who have been exposed to more information about racial injustice and/or have been exposed to more Whites in a higher education setting or certain workplaces may be more aware of racial discrimination (Dailey et al., Reference Dailey, Kasl, Holford, Lewis and Jones2010; Welch et al., Reference Welch, Sigelman, Bledsoe and Combs2001). In terms of family income, Black respondents in families earning $60,000 to $99,999 show higher perceptions of racial problems compared to the lowest earners. There are no other statistically significant relationships for this variable, though those in the top bracket of Asian income also show higher perceptions of racism at p-values close to statistical significance (p-values = 0.073, 0.078). Black and Asian part-time workers show lower perceptions of racism compared to full-time workers, as do unemployed Asians and retired Hispanics, perhaps indicating increased exposure to racism with regular time spent in the workplace (Wingfield Reference Wingfield2007; but see Ebert and Ovink, Reference Ebert and Ovink2014; Pew Research Center 2007). For assessments of the national economy, there are some statistically significant results for Blacks and Hispanics, but there is no clear pattern to determine if negative or positive assessments are more linked to higher or lower perceptions of racism. Although minority men are often more likely to perceive discrimination (Benner and Graham, Reference Benner and Graham2011; Ebert and Ovink, Reference Ebert and Ovink2014; English et al., Reference English, Lambert, Evans and Zonderman2014; Pérez et al., Reference Pérez, Fortuna and Alegria2008; Stewart et al., Reference Stewart, Baumer, Brunson and Simons2009; Welch et al., Reference Welch, Sigelman, Bledsoe and Combs2001; but see Pachter et al., Reference Pachter, Szalacha, Bernstein and Coll2010), it appears that minority women actually show higher perceptions of racial problems in this case, which may reflect the uniquely marginalized position of minority women in the United States (Crenshaw Reference Crenshaw1990). Black respondents born more recently show lower perceptions of racial problems, which may be a function of their distance from the pre-Civil Rights Era, or simply that younger people have had less opportunity to experience and identify racism (English et al., Reference English, Lambert, Evans and Zonderman2014; Welch et al., Reference Welch, Sigelman, Bledsoe and Combs2001). Hispanic and Asian labor union members have lower perceptions of racial problems, perhaps due to the increasing contemporary efforts of unions to organize across racial lines and address racial issues (Frymer and Grumbach, Reference Frymer and Grumbach2021). Blacks show similar results to Asians that do not quite reach statistical significance (p-values = 0.066, 0.063). Asians with children under eighteen have lower perceptions of racial problems, as do Hispanics at close to statistically significant levels (p-values = 0.074, 0.070). Blacks and Hispanics who are separated or divorced, Hispanics who are single, and Asians who are widowed or in domestic partnershipsFootnote 7 show evidence of higher perceptions of racial problems.Footnote 8 These results perhaps support the notion that those with less normative family forms may perceive more racism, which accords with Whites’ framing of these family forms among minorities as “deviant” (Bryant and Coleman, Reference Bryant and Coleman1988). The relationship between length of residence in one’s home and perceived racial problems is ambiguous for Hispanics and not statistically significant for others, but Asians who are longer-term residents in their city have higher perceptions of racial problems.
Focusing further on the primary statistically significant results in Table 2, those related to Black and Hispanic demographic change, I re-analyze using multinomial logistic regressions in Table 3. I analyze the relationship between Black percentage point growth and perceptions of racial problems, as well as the top quartile of Hispanic percentage point growth and perceptions of racial problems, again controlling for all factors from Table 2 (though these controls are not displayed for simplicity). The purpose is to determine which categories of the primary outcome are most likely to be impacted by demographic change, alternating what serves as the baseline category.
Table 3. Multinomial logistic regressions predicting agreement that racial problems are rare/isolated with county-level demographic change, 2000 to 2010–2014

Robust standard errors in parentheses
*** p<0.001, ** p<0.01, * p<0.05
Sources: Cooperative Congressional Election Study 2016, U.S. Census 2000, American Community Survey 2010–2014, Election Atlas
Note: These models include the same control variables as those presented in Table 2.
The important point in Table 3 is illustrated most clearly in the furthest right column, where the base category is “strongly agree.” Black respondents living in counties with relatively higher Black growth are more likely to “somewhat disagree” and “strongly disagree” that racial problems are rare/isolated. Hispanic respondents in counties in the top quartile of Hispanic growth are more likely to “strongly disagree” that racial problems are rare/isolated. A comparable result emerges when using a continuous measure of Hispanic percentage point growth (not displayed). Using the “margins” command in Stata, I find that moving from the twenty-fifth to the seventy-fifth percentile of Black growth estimates a 4.5% increase in the number of Black respondents strongly disagreeing that racism is rare, while this number is 6.6% for Hispanic growth and Hispanic respondents. These results provide evidence that rapid demographic growth is associated with increased disagreement that racial problems are rare, not simply more neutral perceptions or weaker agreement that racial problems are rare, though these are also true in the case of Black respondents. This suggests a heightened sense of racial problems in these rapidly changing counties.
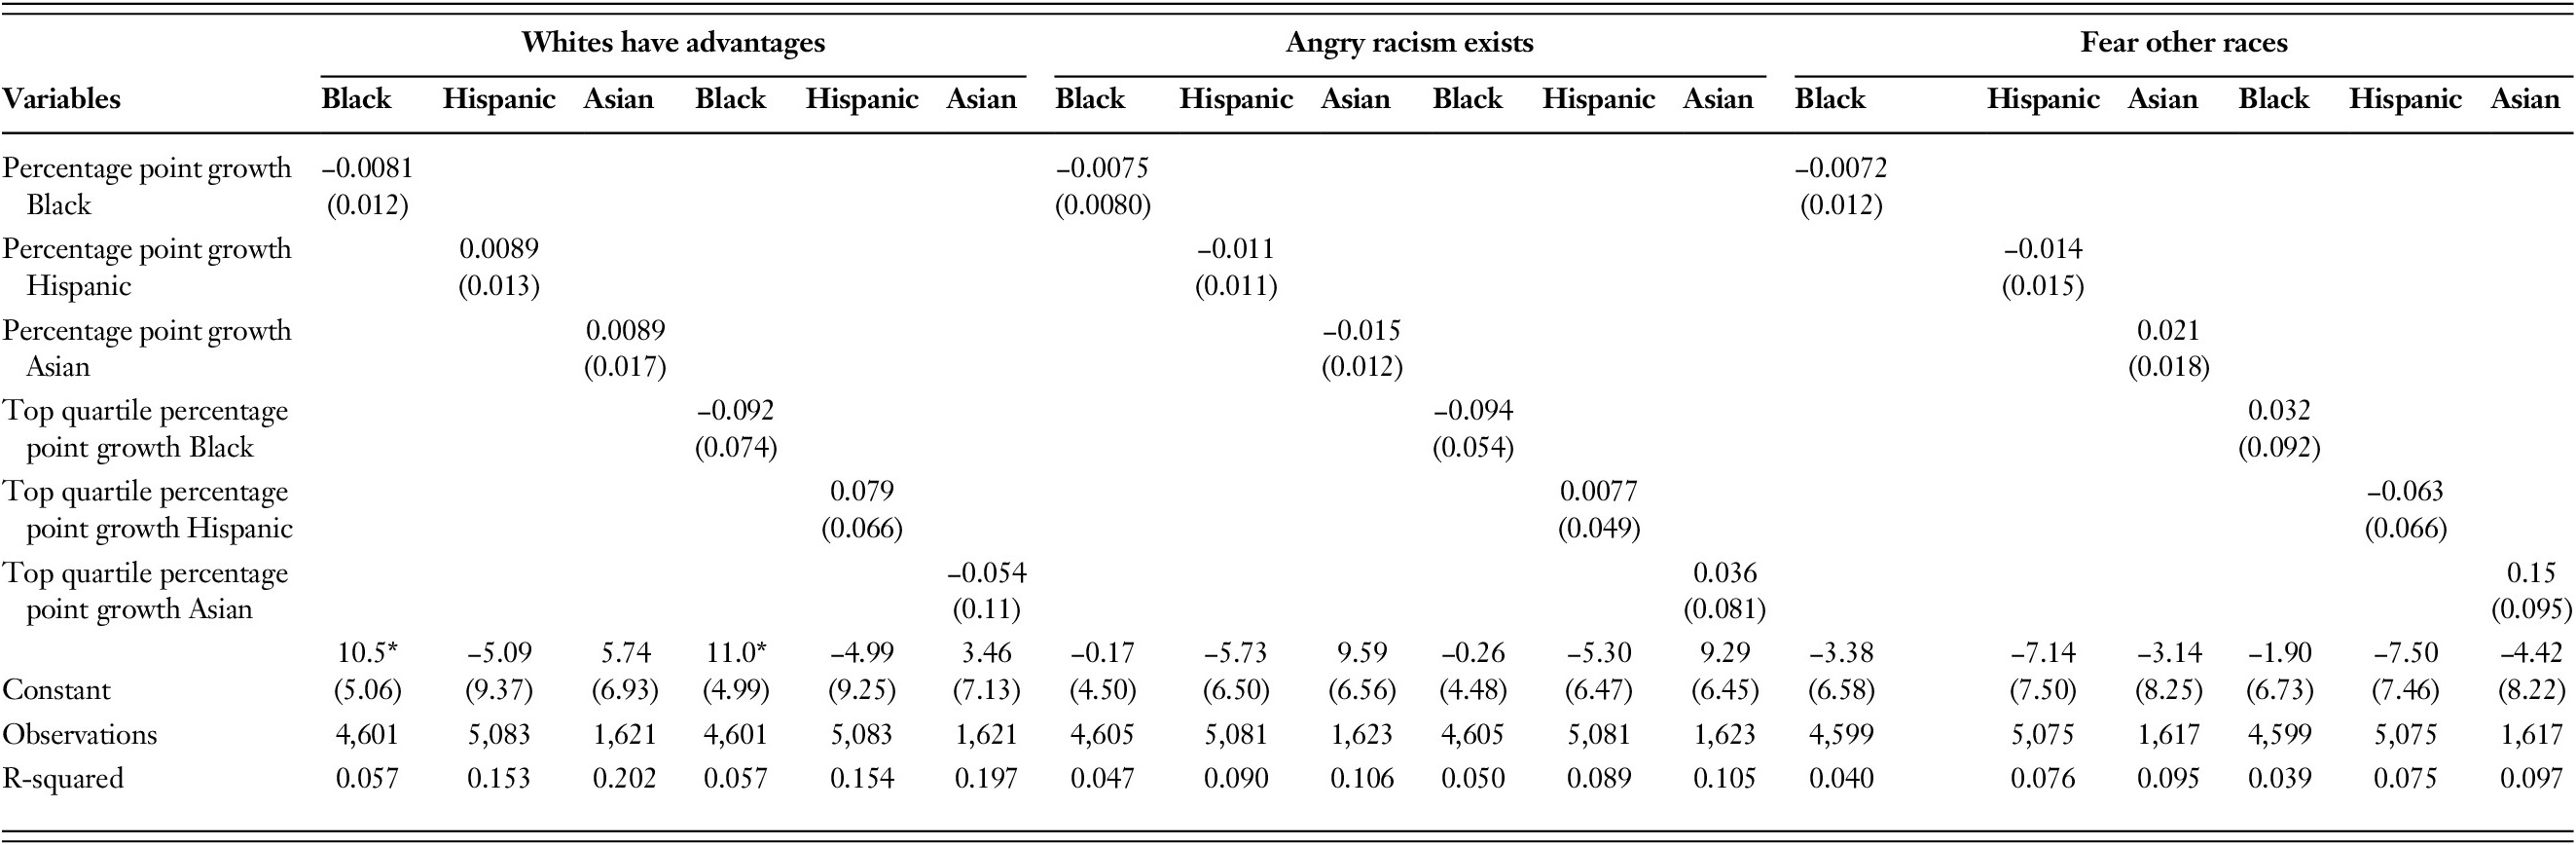
I now return to OLS regressions to determine if demographic change is predictive of any of the other racism-related outcomes. Table 4 displays these results, again controlling for the same factors as in Tables 2 and 3, though not displaying these controls.
Table 4. OLS regressions predicting various racism-related outcomes with county-level demographic change, 2000 to 2010–2014
Robust standard errors in parentheses
*** p<0.001, ** p<0.01, * p<0.05
Sources: Cooperative Congressional Election Study 2016, U.S. Census 2000, American Community Survey 2010–2014, Election Atlas
Notes: These models include the same control variables as those presented in Table 2. Sample sizes within a respondent group across outcomes differ due to small amounts of missing data for the outcomes.
I find no statistically significant results to demonstrate that demographic growth of Blacks, Hispanics, or Asians is predictive of perceptions of White advantages, fear of other racial groups, or anger that racism exists for these groups. This provides initial evidence that the relationship between Black and Hispanic demographic change and perceptions of racial problems are unique to this outcome. This will be explored and discussed further with the selection models.
INVERSE-PROBABILITY-WEIGHTED MODELS
I now move on to the selection models in an effort to determine if the demographic change variables still show a statistically significant relationship with perceptions of racial problems when the “high growth” and “low growth” counties are more similar in terms of characteristics predicting selection into “high growth.” Table C in the appendix shows the likelihood of selection into treatment for treatment and control counties before and after applying the inverse probability weights. This demonstrates that there is a great improvement in balance after applying the weights, thus allowing for greater isolation of the impact of the demographic change variables. It should be noted that a simplified model predicting high Hispanic growth with only percent Hispanic in 2000, median household income in 2000, and region of residence achieves a better balance between the treatment and control groups (less than a percentage point difference in the likelihood of treatment), and results in similar findings to those presented in the main analysis in Table 5.
Table 5. AIPW and IPWRA models predicting agreement that racial problems are rare/isolated, 2000 to 2010–2014

*** p<0.001, ** p<0.01, * p<0.05
Sources: Cooperative Congressional Election Study 2016, U.S. Census 2000, American Community Survey 2010–2014, Election Atlas
Note: These models include the same control variables as those presented in Table 2 except racial/ethnic group percentages are measured in 2000.
Table 5 presents the primary results for the AIPW and IPWRA models. For the sake of interpretability, I present the coefficients as percentage increases or decreases from the control group mean of the dependent variable.
The AIPW and IPWRA results accord with what was revealed in the OLS models in Table 2. After accounting for selection into treatment, high growth of the Black and Hispanic population at the county-level predicts higher perceptions of racial problems. Specifically, Black growth in the top quartile predicts a decrease for Blacks on the five-point scale of agreement with seeing racial problems as rare/isolated by 5.4% for the AIPW model and 6.7% for the IPWRA model. Hispanic growth in the top quartile predicts a decrease for Hispanics by 5.4% in the AIPW model and 6.1% in the IPWRA model. Again, there are no statistically significant results for Asian growth, suggesting that Black and Hispanic growth have a unique relationship with perceptions of racial problems. Ultimately, this provides further evidence that local Black and Hispanic growth may result in an increase in perceptions of racism for these groups. Additionally, from analyses not presented, there is no evidence of a “secondary transfer effect” (Pettigrew Reference Pettigrew2009) of demographic change on perceptions of racism.Footnote 9 In other words, local Hispanic growth does not increase Black perceptions of racism, and local Black growth does not increase Hispanic perceptions of racism. This suggests that, if there is a backlash to demographic change, it falls most directly on the group that is rapidly growing in its local population share.
In terms of the different results observed above, might some of them be accounted for by the growth rates of the different groups, or where they are growing? In other words, a group may be most likely to inspire backlash if they are growing very rapidly in places that might be primed for backlash, such as places with high White populations (Grattet Reference Grattet2009; Green et al.,Reference Green, Strolovitch and Wong1998; Lyons Reference Lyons2008; Newman Reference Newman2013; Stewart et al., Reference Stewart, Baumer, Brunson and Simons2009).Footnote 10 Table 6 compares growth rates of the various racial/ethnic groups for the treatment and control counties and Table 7 compares various contextual and individual-level characteristics for the sample of counties in which these groups are growing rapidly. Each of these analyses are weighted with the inverse probability weights in order to best replicate the conditions from the analysis in Table 5.
Table 6. Average percentage point growth, treatment vs. control counties (inverse probability weighted and limited to primary analysis samples only)

Sources: Cooperative Congressional Election Study 2016, U.S. Census 2000, American Community Survey 2010–2014, Election Atlas
Table 7. Average estimated descriptive statistics for "high growth" counties, inverse probability weighted and limited to analysis sample

Sources: Cooperative Congressional Election Study 2016, U.S. Census 2000, American Community Survey 2010–2014, Election Atlas
There are, indeed, growth rate differences between the groups. On average, the treatment group counties show 7.68 percentage points of growth for Hispanics, 4.05 for Blacks, and 3.64 for Asians. Perhaps more importantly, there are differences in the gap between the treatment and control counties in terms of mean growth rates. This gap is 4.26 percentage points for Blacks, 4.27 for Hispanics, and 2.58 for Asians. Could the fact that Hispanics and Blacks appear at the top of both of these lists, rather than a uniquely negative reception, account for the results in Table 5? Perhaps, but it is important to note that Blacks also perceive more racial problems in higher growth counties when growth is operationalized as a continuous variable, as is shown in Table 2, including when I restrict the sample to make the range of growth rates for Blacks and Asians more similar (not displayed).
What about the context of reception? It is fairly clear from Table 7 that Asian population growth is occurring in counties that may be less susceptible to backlash than the counties where the other groups are growing. These counties are less conservative in terms of Bush voting in 2000, are denser, and are much more highly educated. Also, notably, Blacks are entering more predominantly White counties than either Hispanics or Asians. Regardless, the fact that Asians may be entering relatively hospitable environments overall is an underexplored aspect of their relatively positive reception in the United States and should be explored more deeply by future research.
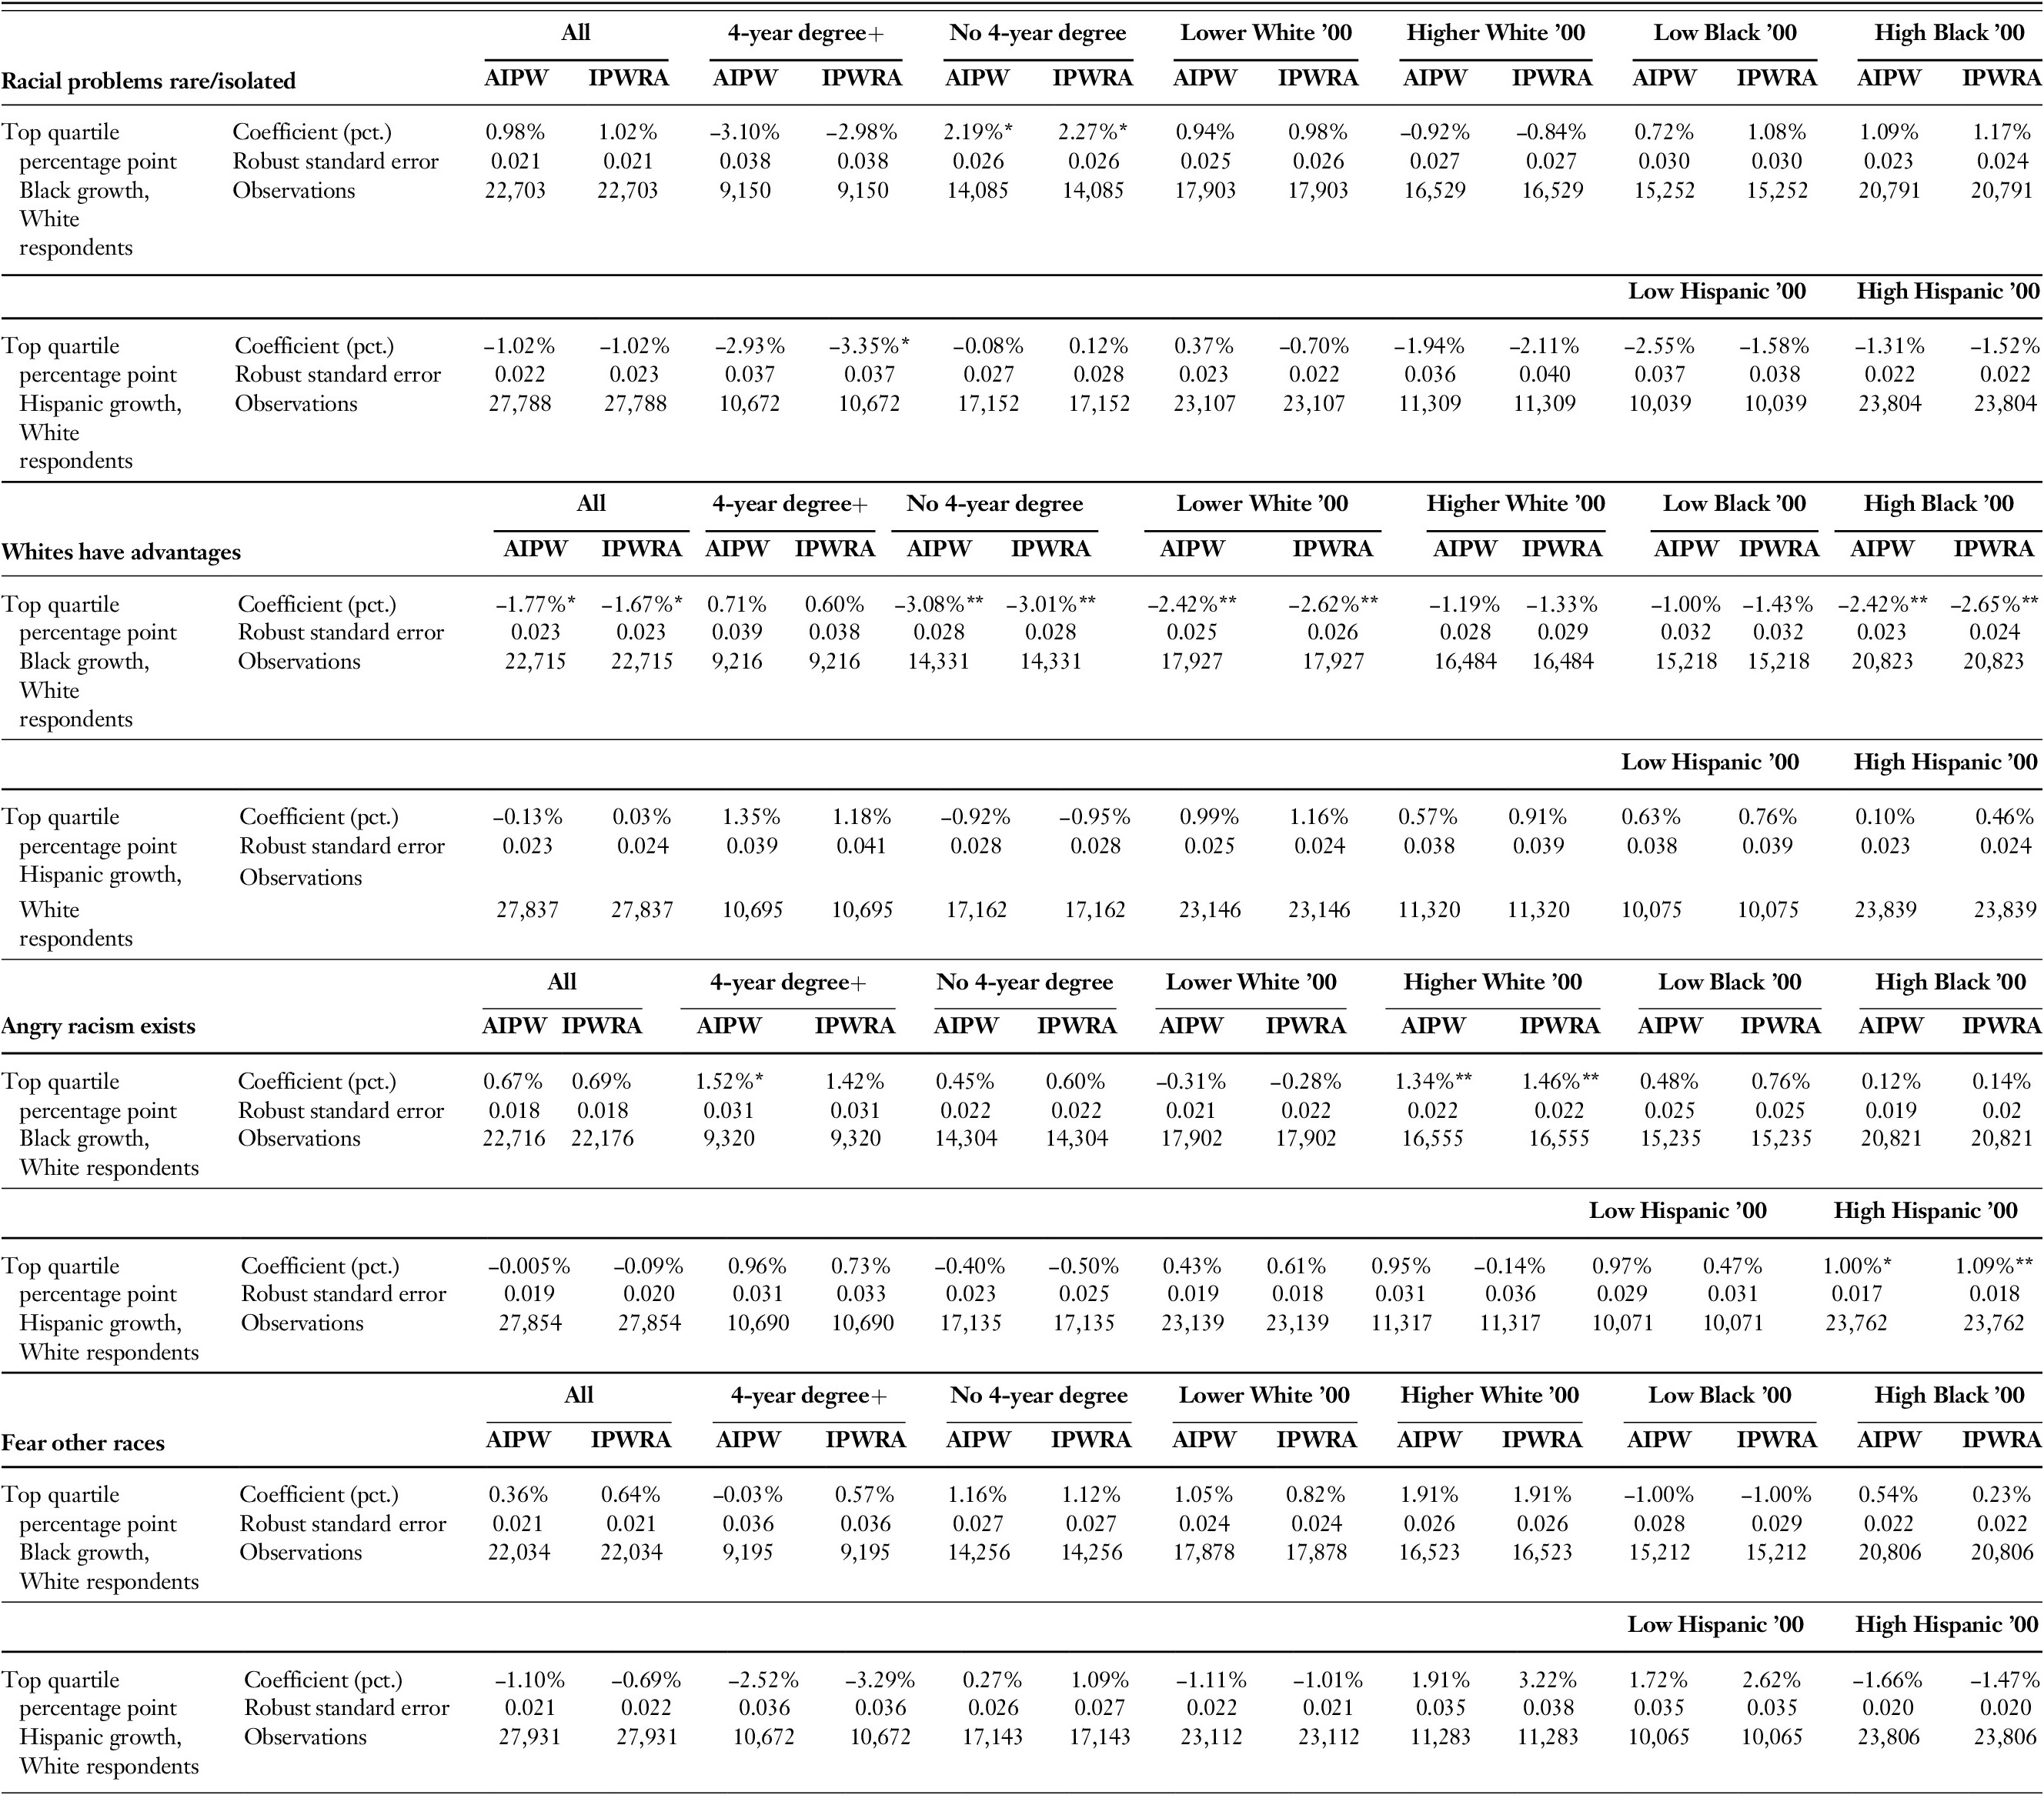
I now look at various subsamples for Blacks and Hispanics, though not Asians due to sample size constraints, with results displayed in Table 8.Footnote 11 Specifically, I look at places with higher and lower White populations in 2000 by excluding the bottom and top quartile of percent White, respectively, at the county level.Footnote 12 I also compare those with and without a four-year degree or higher. Lastly, I compare U.S.-born and foreign-born populations, but can only do so for Hispanic respondents due to sample size limitations for Blacks.
Table 8. AIPW and IPWRA models predicting agreement that racial problems are rare/isolated for various subsamples, 2000 to 2010–2014

*** p<0.001, ** p<0.01, * p<0.05
Sources: Cooperative Congressional Election Study 2016, U.S. Census 2000, American Community Survey 2010–2014, Election Atlas
Note: These models include the same control variables as those presented in Table 2 except racial/ethnic group percentages are measured in 2000.
Firstly, I show that Hispanic population growth likely demonstrates an especially strong relationship with perceptions of racial problems in places that were more predominantly White in 2000. Specifically, top quartile Hispanic growth predicts a 11.4% or 15.1% decrease in the scale for perceiving racial problems as rare/isolated, depending on the model, compared to 6.4% in the counties that were less predominantly White in 2000. The coefficient estimates for the respective subsamples do not overlap with the 95% confidence intervals of the other subsample except in one out of four cases, providing decent evidence that the strength of the relationship is indeed different when comparing these subsamples. This suggests, as other studies have (Green et al., Reference Green, Strolovitch and Wong1998; Newman Reference Newman2013), that Hispanic growth may be most likely to generate backlash in places with little previous racial/ethnic diversity. Alternatively, I find no statistically significant results for Black growth in places with higher White populations in 2000 (and in fact the signs are positive) but do in places with lower White populations in 2000. This contradicts the “defended neighborhood hypothesis,” but is in line with some research showing that Whites may embrace or tolerate diversity in the form of a sizeable Black population to a point, but as this “tipping point” is being passed by Black growth, this tolerance may decrease (Schelling Reference Schelling and Pascal1972). Another possibility is that the recognition of racism as a function of backlash is heightened in counties with a higher Black population, and thus a stronger co-racial community to raise awareness of racism, particularly for a racial group with a high consciousness of racism in general (Horowitz et al., Reference Horowitz, Brown and Cox2019). Alternative models (not displayed) examining low Hispanic/Black counties in 2000 as opposed to high White counties and high Hispanic/Black counties in 2000 as opposed to low White counties show similar patterns.
For the comparison by education level, we see that Blacks and Hispanics with at least a four-year degree perceive no greater or fewer racial problems in places undergoing rapid demographic change. Alternatively, those without a four-year degree show higher perceptions of racial problems in rapidly changing counties. Similar results hold when the samples are limited to those born before 1992 so that respondents are at least age twenty-five or so, allowing time for them to have obtained a degree. Therefore, I provide evidence that those with lower education, who may also be more economically vulnerable, are likely to bear the brunt of racism and/or racial conflict related to demographic change.
Lastly, Hispanic growth predicts a statistically significant increase in the perception of racial problems for U.S.-born and foreign-born Hispanics. However, the magnitudes (decrease on the scale) for the foreign-born population are larger, 12.0% or 10.1% depending on the model, compared to 6.2% or 8.1% for the U.S.-born. This falls in line with research showing discriminatory targeting of foreign-born Hispanics in particular (Hosoda et al., Reference Hosoda, Nguyen and Stone-Romero2012). This is in contrast, though, with the higher perceptions of racial problems for U.S.-born Hispanics demonstrated in the current study, but also in contrast to the theory that U.S.-born Hispanics may be more impacted by discrimination as a threat to their proximity to the U.S. “mainstream” (Schildkraut Reference Schildkraut2005). However, there is overlap between these subsamples in terms of the coefficient estimates and the 95% confidence intervals in three out of four cases, so the conclusion of these findings is somewhat ambiguous.
There is some concern that the correlation of these various subsamples may play a role in the results in Table 8. However, as shown in Table D of the appendix, the correlations between these variables are not particularly strong. This table is divided into the Black and Hispanic subsamples and show correlations for all ages as well as only those approximately age twenty-five plus. This provides evidence that the individual results presented in Table 8 are likely each worth interpreting on their own.
I now test whether the results from Table 5 hold when including controls for the other racism-related variables of this study. I also again analyze these racism-related variables as outcomes, controlling for the other three racism-related variables. These results are displayed in Table 9.
Table 9. AIPW and IPWRA models predicting various “racism-related” variables, controlling for all other racism-related variables, 2000 to 2010–2014

*** p<0.001, ** p<0.01, * p<0.05
Sources: Cooperative Congressional Election Study 2016, U.S. Census 2000, American Community Survey 2010–2014, Election Atlas
Note: These models include the same control variables as those presented in Table 2 except racial/ethnic group percentages are measured in 2000 and controls for the other racism-related variables are added.
Firstly, Black and Hispanic growth continue to predict less agreement that racism is rare/isolated after controlling for the other racism-related variables. Alternatively, for Black respondents, there is no evidence of increased perceptions of White advantages, anger that racism exists, or fear of other races in high Black growth counties. In fact, there is evidence of the reverse for the first two of these outcomes (1–2%). Alternatively, there is some evidence of increased acknowledgement of White advantages for Hispanics as a result of high Hispanic growth. Hispanic growth does not, however, appear to impact anger that racism exists or fear of other races. Overall, the relationship between demographic change and increased perceptions of racial problems may not apply to increased perceptions of White privilege (at least for Blacks), increased anger that racism exists, or increased fear of other races, highlighted by the results in Table 9 as well as the null results in Table 4.
Lastly, in Table 10, I ask whether it is possible to directly reveal racial backlash among Whites in the CCES using the racism-related outcomes. I subdivide these analyses by education and pre-existing racial/ethnic demographics at the county level.
Table 10. AIPW and IPWRA models predicting measures of racial conservatism for various groups of non-Hispanic Whites, 2000 to 2010–2014
*** p<0.001, ** p<0.01, * p<0.05
Sources: Cooperative Congressional Election Study 2016, U.S. Census 2000, American Community Survey 2010–2014, Election Atlas
Note: These models include the same control variables as those presented in Table 2 except racial/ethnic group percentages are measured in 2000.
There is some evidence of backlash to Black growth among non-Hispanic Whites in the CCES, with increased belief that racism is rare/isolated tied to Black growth for Whites with lower levels of education, and decreased acknowledgement of White privilege among Whites overall and in particular Whites with lower levels of education and Whites living in counties with lower White/higher Black percentages in 2000. Black growth actually predicts increased anger that racism exists for Whites with higher levels of educationFootnote 13 and Whites living in more highly White counties in 2000. Hispanic growth shows no evidence of backlash and predicts decreased belief that racism is rare among Whites with higher levels of educationFootnote 14 and greater anger that racism exists in counties with higher Hispanic populations as of 2000. These patterns provide some evidence of what we might expect based on the literature review and certain results from the current study. For instance, evidence of backlash to Black growth is more likely to appear among Whites with lower levels of education and in areas with a larger Black population to begin with (the “tipping point” model). Evidence of liberalization is linked with Black and Hispanic growth among Whites with higher levels of education and with Hispanic growth in “established” Hispanic destinations.
Overall, these results leave open the possibility that demographic change is simply increasing awareness of racism, particularly for Hispanics, perhaps through the awareness-raising impact of a larger co-racial/co-ethnic community (Camacho et al., Reference Camacho, Allen and Quinn2019), rather than increasing perceptions of racism as a result of backlash to this demographic change. However, it is worth noting that percent Hispanic (and Black) did not demonstrate a statistically significant relationship with perceptions of racism in Table 2, calling into question this “awareness” hypothesis. Additionally, there is a substantial body of evidence linking demographic change to threat perceptions through other metrics such as hate crimes and political outcomes (Enos Reference Enos2017; Green et al.,Reference Green, Strolovitch and Wong1998; Lyons Reference Lyons2008; Newman et al., Reference Newman, Shah and Collingwood2018). My article “Demographic Change and the 2016 Presidential Election” (2021) identifies backlash to Hispanic population growth in the CCES, in terms of increased voting for Donald Trump among Whites, implying that the expression of demographic threat may manifest itself in support for a candidate perceived to be against such demographic change. My 2016 election study provides evidence of backlash to racial/ethnic change using the same dataset as the current study, thus suggesting that the increased perceptions of racial problems in rapidly changing counties that is observed in the current study is at least plausibly linked to a backlash response to demographic threat.
CONCLUSION
The evidence presented in the current study provides a strong argument for continuing to bring context into the conversation around perceptions of racism. Despite mixed evidence of the importance of context in the related literature, and a lack of evidence that most contextual factors are predictive of perceptions of racial problems in the current study, rapid demographic change predicts increased perceptions of racial problems for both Black and Hispanic respondents in the CCES. Specifically, as Black and Hispanic populations at the county-level grow, Black and Hispanic respondents, respectively, are in less agreement with the notion that racial problems are rare and/or isolated. This is in contrast to high Asian growth, which predicts no such change in perceptions. This could indicate a lack of negative reaction to Asian growth specifically or could have to do with the context of places where Asians are rapidly increasing their numbers, among other possibilities. Further research should reckon with these potential interpretations.
Regardless, the results for Black and Hispanic growth fit within a framework whereby rapid demographic change upsets the status quo and may result in backlash of many varieties, including anti-immigrant sentiments, conservative political turns, or even hate crimes. Whether this backlash results in increased perceptions of racism has been unclear, but the current study provides evidence in support of this idea. However, this is not necessarily the case for all racism-related outcomes, highlighting a limitation.
For Hispanics, perceptions of racial problems are likely heightened in places where the White population proportion has been greater (and the Hispanic proportion has been lower), providing support for the “defended neighborhood hypothesis” and justifying a particular concern with backlash in so-called “new destinations” in the United States (Jones Reference Jones2019). Interestingly, however, I find the opposite results for high Black growth, which particularly predicts increased perceptions of racial problems in places where the White population was relatively low and the Black population was relatively high in 2000. This perhaps highlights the distinct experience of these two groups, one made up of a large percentage of immigrants and currently entering regions of the country with little history of immigration (Massey Reference Massey2008), the other a group largely with deep ancestral roots in the United States and having undergone its own mass migration earlier in the twentieth century (Wilkerson Reference Wilkerson2010). A relatively high concentration of Black respondents may aid in the perceptions of racial backlash, particularly given the high consciousness of racism for the group on the whole (Horowitz et al., Reference Horowitz, Brown and Cox2019). Regardless, I also find some commonality of experience in the sense that both Blacks and Hispanics without four-year degrees are more likely to report increases in perceived racial problems in places undergoing rapid demographic change, while the more educated of these groups may have shielded themselves through their higher socioeconomic status, despite the fact that they may be more likely to encounter Whites. For Hispanics, both the U.S.-born and foreign-born show evidence of increased perceptions of racial problems as a result of rapid demographic change. The magnitude is greater for the foreign-born, though there is less certainty that this difference is statistically meaningful.
For Hispanic growth in particular, it is not clear that demographic change has negatively impacted racial attitudes in the CCES, highlighting another limitation, but other evidence of backlash to demographic change abounds (Enos Reference Enos2017; Green et al.,Reference Green, Strolovitch and Wong1998; Lyons Reference Lyons2008; Newman Reference Newman2013; Newman et al., Reference Newman, Shah and Collingwood2018), including in the CCES (Maggio Reference Maggio2021). Regardless, it is worth noting that White racial attitudes in the United States more generally did not necessarily become more conservative over the period studied in this analysis, and by some measures have undergone a liberalization in recent times (McElwee Reference McElwee2018; Pew Research Center 2017), known colloquially as the “Great Awokening” (Yglesias Reference Yglesias2019; but see Baldassarri and Park, Reference Baldassarri and Park2020; Bobo et al., Reference Bobo, Charles, Krysan, Simmons and Marsden2012). The current study does not necessarily suggest that demographic change will substantially disrupt this trend, but simply that as rapid demographic change occurs in various places around the country, increased perceptions of racism may follow. One line of thinking around the election of Donald Trump, for instance, is that while racism has not clearly increased in the United States, there is evidence that it was mobilized in the service of Trump’s 2016 campaign (Sides Reference Sides2017). Similarly, while certain racial attitudes may be liberalizing, the activation of racism in rapidly changing places may be relevant to the experience of racial/ethnic minorities. Researchers and policymakers would do well to consider this when studying not only new immigrant destinations, but “old destinations” for African Americans, namely the American South (Frey Reference Frey2004). In other words, there is no one story of racism in the United States, but a complex racial system that will be impacted by various factors, including local disruptions to the racial status quo.
ACKNOWLEDGEMENTS
I would like to thank Maria Abascal, Richard Alba, Phillip Kasinitz, and Mary Clare Lennon for their feedback in writing this article.
APPENDIX
Table A. Agreement on various racism-related questions by race/ethnicity (survey weighted)

Source: Cooperative Congressional Election Study 2016
Note: Sample sizes differ within respondent groups due to small amounts of missing data.
Table B. Correlations between various racism-related outcomes

Source: Cooperative Congressional Election Study 2016
Table C. Mean likelihood of selection into “high growth” for respondents in treatment and control counties with and without inverse probability weights (IPW) applied, primary analysis samples only

Sources: Cooperative Congressional Election Study 2016, U.S. Census 2000, American Community Survey 2010–2014, Election Atlas
Table D. Correlations between contextual and individual characteristics for Black and Hispanic respondents

Sources: Cooperative Congressional Election Study 2016, U.S. Census 2000


