


Introduction
The first astrobiological mission specially designed to detect life on Mars, the Viking missions, reported controversial results. Considering the amount of UV radiation bathing the surface of the planet, the resulting oxidative conditions and the lack of adequate atmospheric protection, scientific community thought life to be unlikely. Other important planetary body of astrobiological interest is the Jupiter's Moon Europa. The necessity of the Europa surface exploration comes from the idea of a water ocean existing in its interior. Life needs several requirements for its establishment but, the only sine qua non element is the water, taking into account our experience on Earth extreme ecosystems. Recently reported data from space missions (Mars Global Surveyor, Mars Odyssey, Mars Express and Mars Exploration Rover Opportunity) gave us a more habitable picture of Mars with some clues about the possible existence of water, at least in the past.
Life in Extreme Environments (LEXEN) is an emerging area with tremendous potential. The science of such environments has enormous relevance for our knowledge of the diversity and environmental limits of life and the novel strategies employed for survival and growth. Such studies are essential in understanding how life established on the early Earth and in assessing the possibilities of life on other planetary bodies. With the aim of improving coordination of LEXEN research (Project full title: Coordination Action for Research Activities on life in Extreme Environments, EC Grant agreement no. 211700) Work Programme (FP6 European Frame Programme) started being funded by the European Commission in 2009. This programme identified a need for better coordination of LEXEN research.
Among CAREX objectives there are several focused on establishing interaction, coordinate activities and promote a community identity for European research in LEXEN. For affording these very ambitious objectives, there is no better way than a real scientific campaign between scientists from different fields of expertise all together in a field trip. With this idea in mind, CAREX designed the Task 3.1, which was called ‘Field Procedures Intercomparisons’. With this aim on the scope, one of the main CAREX objectives is to coordinate research interdisciplinary integrated actions as campaigns for studying extreme field sites with multidisciplinary international scientist teams. Establishing this community will encourage greater interdisciplinarity and increasing knowledge of extreme environments from very different points of view. This activity was planned to develop field trips, the first of them was organized for a scientific campaign in Rio Tinto (South-west Spain), which is the aim of this paper. This field visits were thought to be organized in order to provide an opportunity in each case for up to 20 selected participants to interact in a field setting to demonstrate the use of selected technologies, compare methodologies, exchange research experiences and help promote harmonization of techniques and methodologies. Field work should focus on developing and evaluating new technologies of common use across LEXEN research including remote-sensing devices and field analysis of ecosystem level processes very focused on astrobiological techniques in the Rio Tinto particular case.
One Mars analogue site of particular interest is Río Tinto. The Río Tinto river is very well studied using ‘traditional’ molecular approaches, i.e. primer-based amplification. Further analysis as a Mars analogue site using primer-free amplification methods will provide a more unbiased view of the microbial communities present, while the use of methodologies to address nucleic acids that deviate from life currently known on Earth may lead to ground-breaking discoveries. From Río Tinto, we can obtain a wide variety of soil samples in order to test innovative molecular biology techniques since the analogies with Martian soil are quite evident and also this field site is the ideal place for testing technologies from the multidisciplinary point of view as we have planned to do during the CAREX experience.
The Tinto River (Huelva, southwestern Spain) is an extreme environment with a constant acidic pH (mean 2.3), a high concentration of heavy metals and a remarkable level of microbial diversity (bacteria, archaea, photosynthetic and heterotrophic protists, yeast and filamentous fungi) (Amaral-Zettler et al. Reference Amaral-Zettler, Gómez, Zettler, Keenan, Amils and Sogin2002). The extreme conditions found in the river are the direct consequence of the active metabolism of chemolithotrophic micro-organisms thriving in the rich polymetallic sulfides present in high concentration in the Iberian Pyritic Belt. Primary production in the river is driven mainly by oxygenic photosynthesis (protists and cyanobacteria), although an important part is also due to the activity of chemolithotrophic prokaryotes. Conventional and molecular ecology techniques were used to study the microbial ecology of the Tinto system. The results of both methods agreed. Although sulfur metabolism plays an important role in the system, iron seems to be the key element in this habitat. Iron is not only an important substrate for the rich population of iron oxidizing prokaryotes but also an electron acceptor for anaerobic respiration in the anoxic parts of the river. It is also responsible for the maintenance of a constant acidic pH (probably critical for biodiversity) and for radiation protection. Laminar iron stromatolitic formations can be found along the river. These structures are related to massive laminated bio-induced iron formations found at different elevations above the current river. The isotopic dating of these formations leads to the conclusion that the Tinto River corresponds to a natural system and not to an industrial, contaminated site. The high concentration of ferric iron and sulfates, products of the metabolism of pyrite, generate a collection of minerals, mainly gypsum, jarosite, goethite and haematites, all of which have been detected in different regions of Mars (Fernandez-Remolar et al. Reference Fernandez-Remolar, Gómez-Elvira, Gómez, Sebastián, Martín, Manfredi, Torres, González Kesler and Amils2004). The salt precipitation patterns can contribute to biomineralization processes, which could be of special interest for organics but also life preservation on environmental harsh conditions (Gómez et al. Reference Gómez, Mateo-Marti, Prieto-Ballesteros, Gago and Amils2010). These ‘oases’ for organics and/or life forms are of special astrobiological interest and should attract our attention in other planets and we should be looking for it during rover exploration missions.
This kind of approach we are presenting here needs to be afforded by interdisciplinary groups of specialist. Here, we report an interdisciplinary field analogue campaign conducted in the framework of CAREX FP7 EC programme with the participation of geologists, biologists, paleontologists and engineers. Two days of campaign rendered interesting results due to the collaboration of different specialists. From RAMAN spectrometry to Mossbauer analysis as well as molecular ecology, techniques were applied on the same samples. A geomicrobiological model of this habitat encompassing most of the geological, physical, chemical and biological variables has been developed making the extreme environment a well-studied field site ideal for CAREX interdisciplinary campaign. Molecular ecology techniques as well as analytical tools such as Mössbauer, Raman and X-Ray diffraction techniques developed for space missions were used in its localization and study during the field campaign.
An international open call was open for instrument participation. The scope of the experience was: extreme environments as techniques and tools testing field sites and protocols definition. Twenty persons were expected to take part in the workshop with ten instruments as much for the field day expedition. During the first day ten plenary talks were scheduled for presenting the instruments and the work to be developed during the field experiment by the PIs of each instrument.
After the open call to the community, several proposals were accepted and invited:
-Mössbauer: AK Klingelhöfer, Institut für Anorganische und Analytische Chemie, Johannes-Gutenberg-Universität.
-ExoMars Raman: F. Rull. Valladolid University and Spanish Astrobiology Center (CAB).
-SOLID (Signs of Life Detection System): V. Parro and M. Garcia, CAB.
-InXitu XTERRA: P. Sarrazin. inXitu Inc.
-Vent Sampler: A. Behar, C. Stam, K. Venkateswaran, NASA.
-FluoCam – J. Kviderova. Institute of Botany. Czech Republic.
-Raman: Bernard Foing, Pooja Mahapatra and Susana Direito ESA-ESTEC and Lulea University of Technology.
Methods and instruments
Rio Tinto field campaign was established for being held during 3 days, designed as a workshop with one-day field work during the second day. The first day was devoted to instruments presentations and planned work during the Río Tinto experience. A very important point was focused on the multidisciplinary analysis of the same samples. A sampling committee composed by a biologists and geologists were nominated in order to get relevant samples for analysis. The second day was devoted to the field campaign itself with sampling and instrument testing on the field. During the third day, results obtained during the second day were presented and a discussions meeting took place for the analysis of the results and data integration.
The field station chosen for the experience is called Anabel's garden in the source area of Rio Tinto (Fig. 1).

Fig. 1. Google view of the source area of Rio Tinto. Anabel's garden station was the selected area for developing the CAREX field campaign.
The samples were collected in Anabel's Garden area, where green and brown algal mats were observed (Fig. 2). Also 3.2 dam and its wall with reddish, brown and yellow precipitates, Lynx pond and river water were included as sample stations. More than 18 samples were taken (Table 1) in order to conduct analysis with all the techniques focused on the same samples for the integration of results. The species composition was determined on the field using a light microscope. Some samples were composed of green and brown mats and were collected in shadow and in full sunlight for further community composition analysis. Some others were precipitates with different colours (yellow, brown, etc.). Table 1 presents a summary and brief description of the samples.

Fig. 2. The green and brown mats collected in Anabel's garden spring.
Table 1. Summary of samples analysed during the campaign. Codename, nick name and description of samples and the place where they were taken are included in the table. Only scientific analyses of four samples are included in the paper for simplification of results presentation

A brief description of each instrument is presented in Methods and instruments. These techniques are useful portable instruments for LEXEN research on the field.
FluorCam – a non-invasive assessment of the physiological status of photosynthetic (micro)organisms
The variable chlorophyll a fluorescence measurement is a common method in plant physiology for rapid and non-invasive assessment of the physiological status of cyanobacteria, algae and plants (see e.g. Bohlar-Nordenkampf et al. Reference Bohlar-Nordenkampf, Long, Baker, Öquist, Schreiber and Lechner1989; Maxwell & Johnson, Reference Maxwell and Johnson2000; Rohácek, Reference Rohácek2002 for a review and detailed description of the used protocols). The measurements can be performed in individual algal cells as well as in intact plant by various instruments.
The light energy absorbed by a photosynthetic organism can be either used for photochemistry, heat dissipation or emitted as fluorescence. The fluorescence signal is relatively weak, approximately 1% of absorbed energy, and originates from photosystem II (∼95% of the signal). When the photochemical processes are blocked (e.g. in strong light or by herbicide action), the absorbed energy can be transformed either into heat or the fluorescence. In this case, the fluorescence signal is stronger (∼5% of the absorbed energy). If a defined sequence of defined light pulses is applied and the fluorescence signal is recorded, the several parameters reflecting the actual physiological status can be calculated.
Before the measurement, the sample is dark adapted for at least 15 minutes (for multiturnover flashes). The very weak pulses of light (measurement pulses) are applied, so the photochemical processes cannot be initiated. All reaction centres are able to accept a photon (open reaction centres) and the fluorescence signal is the lowest (F 0, the minimum fluorescence yield). Then a strong light pulse (saturation pulse) lasting approximately 1 s (multiple-turnover – the photochemical reactions occur several times in one reaction centre) or approximately 30 μs (single-turnover – the photochemical reactions occur only once in one reaction centre) is applied. All reaction centres absorb a photon and the charge separation occurs. At that moment, the reaction centres are not able to absorb another photon (closed reaction centres) and the fluorescence signal is the highest (F M, maximum fluorescence yield). From these parameters, the basic parameter maximum quantum yield (F V/F M) is calculated. The value of the F V/F M is approximately 0.83 for non-stressed higher plants, 0.6–0.7 for algae and approximately 0.5 for cyanobacteria and its decrease indicates some stress conditions. When background light (actinic light) is switched on, a dynamic equilibrium between closed and opened reaction centres is established. By applying saturation pulses during the actinic light phase, the actual quantum yield (ΦPSII) is determined, and the amount of energy used in photochemical processes (photochemical quenching (qP)) and in non-photochemical ones (non-photochemical quenching (NPQ)) can be calculated. In stress condition, the NPQ increases (Fig. 3).

Fig. 3. Time course of the fluorescence protocol. AL, actinic light; F 0, minimum fluorescence in darkness; F M, maximum fluorescence in darkness; F M΄, maximum fluorescence in light; F S, steady-state fluorescence in light; SP, saturation pulse.
The variable chlorophyll fluorescence measurements were performed by a fluorescence imaging camera (FluorCam, Photon Systems Instruments, Czech Republic; Nedbal et al. Reference Nedbal, Soukupová, Kaftan, Whitmarsh and Trtílek2000). The samples were collected before the measurement and their dark adaptation lasted 30 minutes. The time course of a measurement is shown in Fig. 8. The measurement light was set below 1 μmol m−2 s−1. The actinic light was set to 100 μmol m−2 s−1 and the saturation pulse of 2000 μmol m−2 s−1 lasted 800 milliseconds. Three drops of the mat were observed during one measurement.
Raman and miniature fibre-optic spectrometers
Raman and fibre-optic spectrometers are proper instruments for rapid in situ mineral identification and are indicated to select appropriate samples and detect particular minerals for which it is interesting to study the associated micro-organisms. These instruments are described briefly in the following section.
Raman spectrometer
A DeltaNu RockHound model was used for the Rio Tinto field trip campaign.
Raman spectroscopy is based on inelastic scattering of light, used to study low-frequency modes of a system such as vibration or rotation. Monochromatic light is incident on the sample, and the scattered light (based on the Raman Effect) is analysed. Each mineral has a unique Raman spectral signature, which is compared with standard mineral Raman spectra in a database to identify the mineral composition of the sample.
The RRUFF Project by the University of Arizona and the California Institute of Technology is currently the largest database of mineral spectroscopic data. Partially funded by NASA and with contributions from mineralogical societies all over the world, it provides a standard for terrestrial and planetary mineral identification. The RRUFF Raman library is a versatile collection of the Raman spectra of over 2500 mineral species measured with different excitation lasers, crystal orientations and samples.
In practical Raman spectra, spectral normalization, feature weighting, region selection, baseline correction, removal of cosmic ray events (CRE) and other corrections may be applied before calculating a similarity value. CrystalSleuth, developed as an analytical tool for the RRUFF Project, is a software that displays Raman spectra using input data files in ASCII xy format, and utilizes the RRUFF library to identify the mineral spectrum that has the highest correlation with the input spectrum.
Miniature fibre–optic spectrometer
Also a miniature fibre–optic spectrometer model Ocean Optics USB2000 was employed during the campaign.
Fibre–optic spectrometers are optical instruments designed to measure light intensity in the ultraviolet, visible and near-infrared spectral regions. Spectroscopic measurements are used to measure reflected components of light at different wavelengths, to determine the type and concentration of chemical components in a sample, among other applications.
TERRA XRD/XRF Instrument
CheMin is the X-ray diffraction (XRD) instrument onboard the NASA Mars Science Laboratory (MSL). The architecture of CheMin is shown in Fig. 4. A fine X-ray beam is generated by a microfocus X-ray tube combined with a 60 μm diameter pinhole collimator. The material to be analysed is loaded in a vertical cell composed of two thin polymer windows separated by 175 μm. The cell is placed in the X-ray beam and vibrated to generate granular motion for improved statistics. A CCD detector collects the X-ray signal scattered by the sample in transmission mode. The CCD is operated in direct detection (i.e. no phosphor is used for conversion of the X-ray signal to visible light) to allow measurement of the energy of incoming photons as well as their location on the detector. The CCD of the MSL instrument is cooled to −100°C with a cryocooler to limit dark current.

Fig. 4. Schematical layout of the CheMin instrument and typical data output.
A number of prototypes based on this architecture have been developed over the last decade to demonstrate the concept and refine the design of the MSL instrument. The CheMin-4 prototype was implemented for field operation and deployed in several extreme environments as Rio Tinto (Spain). The system showed good performance, but its deployment potential was limited by the weight (30 kg) and size of the unit, the labour intensive data processing required to extract XRD and XRF, and the requirement for periodical vacuum pumping of the CCD chamber. Due to the fidelity of the CheMin 4 design to the MSL instrument geometry, a number of these instruments are used today in laboratories to study Mars analogue materials and simulate the operation of the MSL instrument.
A commercial instrument called Terra (Fig. 5) was developed by inXitu, Inc. in 2007 to optimize the usability in a field deployment context. The architecture is based on the same general layout as CheMin but was redesigned around a smaller CCD to save cost, mass and power. The CCD is cooled to −45°C using a Peltier cooler. The system includes an embedded computer to control the instrument, acquire and process data in real time, and offer a graphic user interface through a wireless link. Li-ion batteries provide 4–5 hours of autonomous operation. The complete instrument weighs less than 15 kg, including batteries and a rugged case.

Fig. 5. Terra instrument deployed in the field during the CAREX workshop.
The diffraction resolution of Terra is slightly better than that of previous systems (0.25–0.3°2θ). XRD data of sufficient quality for mineral identification of major phases can be obtained in as little as few minutes. XRF data, although limited in energy range (3–15 keV), are useful to restrict the search space for mineral identification with complex samples. Terra is commercially available and used for a number of applications such as exploration, mining, cement plants, education, etc.
Mössbauer
For the field trip, two MIMOSII sensor heads were employed (see Fig. 6). Each sensor head was equipped with a 57Co-source (∼30 mCi). The in situ power supply was ensured by two car batteries. One 45 A h−1 car battery delivered enough energy to run a complete measurement arrangement (sensor head plus electronic-board) for ca. 4.5 days continuously.

Fig. 6. Mössbauer spectrometer MIMOS II in measuring position. The sensor head can be placed in any direction depending on the sample to be analysed.
MIMOSII is equipped with four Si-PIN-detectors. For the Exomars mission, the enhanced follow-up version of the spectrometer, MIMOSIIA, was planned to be part of the scientific payload. The silicon-drift-detectors (SDD) of the MIMOSIIA sensor head will provide a significant better signal-to-noise ratio (SNR).
MIMOS II determines different Fe-bearing phases and the distribution of Fe among them. The penetration depth of the 14.4 keV gamma radiation is of the order of a few hundred micrometers (depending on the composition and density of the sample). The instrument is able to collect 14.4 keV gamma-ray spectra and 6.4 keV X-ray spectra simultaneously, thus providing depth selective information of the sample. See Klingelhöfer et al. (2003) Athena MIMOSII Mössbauer spectrometer investigation. JGR 108, for details.
Vent sampler
Marine hydrothermal systems are extreme and unstable environments located on the ocean floor. These vents are high in dissolved minerals and maintain temperatures above 300°C. The evidence of life in the hydrothermal-associated habitats abounds, but evidence within the hydrothermal plume is elusive and difficult to validate. A Hydrothermal Vent Biosampler (HVB) (Fig. 7) was developed by the JPL Robotics Vehicles Group to collect ‘pristine’ biological samples (i.e. fluids untainted by microbes entrained from the surrounding waters) from these marine environments. The HVB was built to withstand temperatures in excess of 400°C and pressure tested to a depth of 6500 m. In situ sensing devices have been positioned throughout the system to monitor real-time temperature and flow rates during sampling. To account for low-biomass samples, the HVB employs a series of three commercial in-line stainless-steel filters (90, 60 and 7 μm) and a large surface area custom-made collection filter (0.2 μm) that concentrates most of the biological samples. The filters are used to concentrate 20 litres of fluid into a final volume of 500 ml (filtered material is collected off the filter by back flushing with 0.5 litre of sterile water).

Fig. 7. HVB on the bank of Lynx pond.
Signs Of Life Detection System (SOLID)
Immunosensors based on protein microarray technology have been applied in the recent years as a multiplex immunoassay platform for high-throughput detection and analysis of biomolecules in complex clinical (e.g. Sánchez-Carbayo, Reference Sánchez-Carbayo2006; Borrebaeck & Wingren, Reference Borrebaeck and Wingren2009) and environmental samples (Rivas et al. Reference Rivas, García-Villadangos, Moreno-Paz, Cruz-Gil, Gómez-Elvira and Parro2008). We have developed the SOLID instrument concept for automated in situ analysis of environmental samples for astrobiological applications (Parro et al. Reference Parro, Rodríguez-Manfredi, Briones, Compostizo, Herrero and Vez2005, Reference Parro, Fernández-Calvo, Rodríguez-Manfredi, Moreno-Paz, Rivas, García-Villadangos, Bonaccorsi, González-Pastor, Prieto-Ballesteros and Schuerger2008, Reference Parro and Timmis2010). In this campaign, we used the field prototype SOLID2 for the analysis of different samples from rocks and sediments selected by the CAREX team. Up to 0.5 g of sample were automatically processed by ultrasonication, filtered through 15 μm and then incubated with LDCHIP200 (the core biosensor of SOLID, a life detector chip with 200 antibodies). After image capturing, fluorescent signals were quantified by commercial microarray software (Genepix Pro.) and plotted.
Results
FluorCam
Mat species composition
Both brown and green mats were dominated by the rhodophyte Cyanidium caldarium. The colonies were accompanied by green filamentous alga cf. Klebsormidium. In both samples, small pennate diatoms (cf. Pinnularia) were observed, but higher numbers have been observed in the green mat. The genera Chlamydomonas and Euglena have been observed in the green mat only (Fig. 8).

Fig. 8. Mat community species. Microscope Olympus BX-51 (Olympus C&S, Japan), software QuickPhotoCamera 2.3 (Promicra, Czech Republic), objective magnification 100×, immersion oil.
In the sample Mary 03 small pinnate diatoms (cf. Pinnularia) were dominant. The green filaments of cf. Klebsormidium were also observed often. The C. caldarium was less abundant than in other mat samples. The representatives of Euglena were found.
In the sample Mary 04 the rhodophyte C. caldarium and filamentous green alga cf. Klebsormidium were dominant. The pennate diatoms were rare.
The Lichen sample was dry. The phycobiont was probably green alga Trebouxia that is most frequent.
No species determination analyses were performed for the Stone sample.
Photochemistry
The values of the photochemical parameters are summarized in Table 2. All indicate that the green and brown mat communities were not subjected to serious stress. No signal was observed in Lichen samples and this sample was not evaluated.
Table 2. The values of the photochemical parameters (means±sd). The ΦPSII, NPQ and qP were evaluated at steady-state light conditions in the end of the measurement
The significance of differences evaluated for mat colour (green and brown) and light treatment (sun or shadow) by two-way ANOVA test (Statistica software). The F V/F M of the green mat was higher (n=12, F=6.64, p=0.032) and the combination of mat colour and light treatment had also increased the F V/F M (n=12, F=5.86, p=0.042). The light treatment did not affect the F V/F M. The ΦPSII was only affected by the combination of mat colour and light treatment (n=12, F=6.80, p=0.031). No influences of the mat colour, light treatment and their combinations on the NPQ and qP were found.
The measurements of the Stone sample proved possibility of the fluorescence measurements on a rock (Fig. 9). The Stone showed similar photochemical performance as the mats from the Jana's stream.

Fig. 9. The Stone sample. The fluorescence measurements reveal the photochemically active region.
Raman Spectrometer
The Raman spectra of some mineral samples collected at Rio Tinto, along with their matches from the RRUFF Raman library, are depicted below (Figs. 10 and 11). CrystalSleuth was used for spectral visualization, pre-processing and matching. The numbers on the X-axis denote wavenumbers in cm−1, and the Y-axis denotes autoscaled intensity values. The spectra obtained using DeltaNu RockHound are in black, and in blue are the corresponding spectra from the RRUFF library.

Fig. 10. Raman spectra of copiapite.

Fig. 11. Raman spectrum of sample named Fernando09_2 (yellow), and its comparison with copiapite from the RRUFF library.


TERRA XRD/XRF instrument
A Terra instrument was deployed in the field during the CAREX and used to analyse a number of samples collected on the site. Samples were dried, crushed and sieved to 150 μm, then 20–50 mg of material was loaded into the sample cell. The sample cell was disassembled and cleaned prior to every analysis. Data were collected over minutes to tens of minutes.
XRD data were analysed using Xpowder, a software for phase identification and quantitative analysis. Fig. 14 shows the XRD and XRF of one of the samples analysed in the field. The mineralogical results of all samples analysed are presented in Table 3.
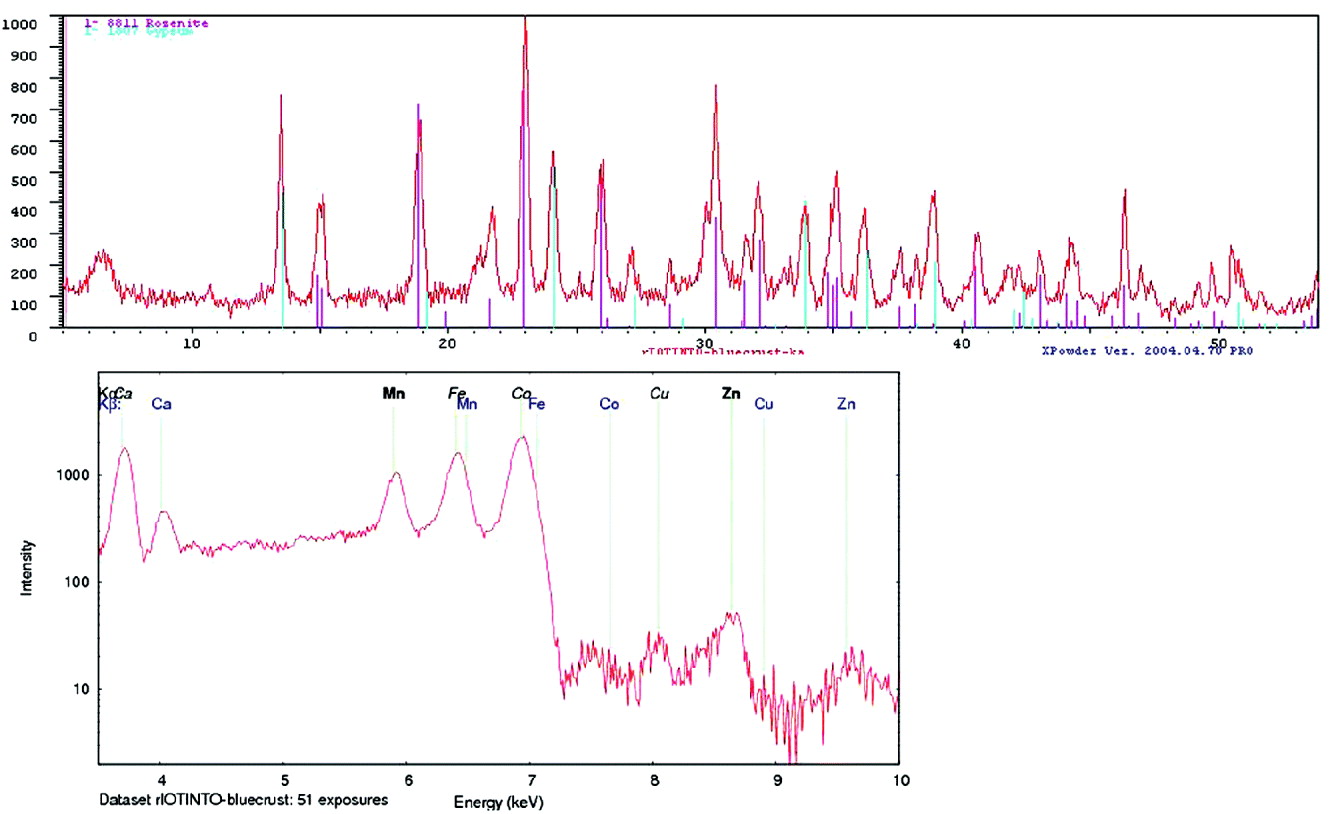
Fig. 14. XRD pattern of sample ‘bluecrust’ and phase identification using Xpowder and a mineral database; Rosenite (FeSO4-4(H2O)) and gypsum (CaSO4-2(H2O)). XRF spectrum obtained in parallel with the same sample.
Table 3. Samples analysed in the field during CAREX

Mössbauer Instrument
During the field trip, 15 spectra were obtained in situ.
At ‘Pena de Hierro’, red and black portions of two samples of Gossan were analysed, in the case of sample 1 on a freshly exposed surface. Each spectrum was integrated for a duration of 2 hours. On a small sample, the red surface was measured.
At ‘Nacimiento del Rio Tinto’, a yellow evaporite with popcorn-like texture and a white crust precipitate were measured for 30 minutes each at reduced velocity.
At ‘El Loco’, one sample of bedrock from the river (‘El Loco River’) and one sample of outcrop material (‘El Loco Outcrop’) were measured, followed by analyses of a crust on top of reddish substrate material approx. 50 cm from the water surface. The crust exhibited a colour gradient from white to yellow towards the water. Both white and yellow portions were measured (2 hours each). A reddish crust on black substrate material about 3 m from the previous samples and a yellow evaporite with popcorn-like texture were also measured.
At ‘Dique de la Pena’, one sample of volcanic rock was measured for 1 hour.
The ‘El Loco’ evaporites and crust are the only samples that could only be analysed in situ.
From all other materials, samples have been distributed between different groups for further analysis in the lab. We will show only two spectra as examples.
‘Pena de Hierro’ Gossan material
All spectra obtained on the Gossan material at Pena de Hierro show a mixture of haematite and goethite. The two spectra obtained on red material show at least one additional doublet. This minor doublet can be interpreted as silicate in the case of ‘Pena1 (red)’, and as nanophase ferric oxide (npOx) in the case of ‘Pena2 (red)’, respectively. Fits with more than one doublet are in agreement with the data, but not conclusive. npOx is used as a generic name for nanometer-sized and non-crystalline or poorly crystalline particles that contain Fe3+ and unknown or imprecisely known amounts of O2, H2O, OH, (SO4)2, (PO4)3. npOx particles can be discrete particles in a powder or components of composite particles. Examples of npOxs for which enough chemical and mineralogical information have been obtained to warrant assignment of a mineral name include ferrihydrite and schwertmannite [Fe8O8(SO4)(OH)6d nH2O], and superparamagnetic particles (at room temperature) of goethite and haematite (Fernandez-Remolar et al. Reference Fernandez-Remolar, Morris, Gruener, Amils and Knoll2005).
The small ‘Raman-Mössbauer sample’ (Figs. 15 and 16) contains haematite and silicate and a doublet with an isomer shift of ∼0.37 mm s−1 and a quadruple splitting of ∼0.6 mm s−1 that can be interpreted as npOx. This sample does not contain goethite.

Fig. 15. Pena de Hierro, sample 1, black material.

Fig. 16. Pena de Hierro, sample 1, red material.
Additional measurements on samples taken at this site, and on separate black and red material, will help us to confirm this interpretation.
Vent Sampler
Prior to use, the HVB was sterilized by pumping 20% H2O2 through the closed system for 30 minutes. To flush H2O2 from the system, sterile water was pumped through a closed system and then an additional 2 litres of H2O was pumped through each valve in an open system.
The HVB was deployed on the bank of Lynx Pond (Fig. 7). The intake line was inserted into the pond water. The water was first pumped through the bypass pipe and flushed through the flow outlet line to verify the HVB was properly functioning and to prevent cross-contamination between samplings. After flushing the bypass pipe, the pump was then rotated to valve 1, and water from the pond was flushed through the filtration system for 10 minutes. After 10 minutes, the pond water was also flushed through the bypass pipe and then filtered through valve 2 for 10 minutes. For the third valve, 2 litres of water was collected from Jana's stream using a water bottle and brought to the HVB. The water was flushed through the bypass pipe and an additional 2 litres of water was collected from the stream and filtered through the third valve. Each of the three separate valves was not back-flushed to collect the filtrate from the 0.2 μm filters. This is due to not having access to proper laboratory equipment in the field to concentrate the back-flush for transport.
Filters collected from the HVB were placed individually in sterile 50 ml conical tubes. Ten millilitres of PBS was added to each tube, covering the filter. The filters were sonicated using a Branson CH1012-25-12 (Branson Ultrasonics Corp., Danbury, CT) for 2 minutes at a frequency of 25 kHz. The sonicated samples were then aseptically transferred to Amicon Ultra-15 centrifugal filter tubes (Millipore, Jaffrey, NH), which were in turn placed within a Eppendorf 5804 R refrigerated centrifuge (Eppendorf; Westbury, NY) and spun at 4000 rpm using the A-4-44 rotor for 5 minutes. Each filter unit has a molecular mass cut-off of 50 kDa, which facilitates the concentration of bacterial cells, spores and exogenous nucleic acid fragments greater than 100 bp into a final volume of ca. 500 μl. The resulting volume was aseptically transferred to a sterile microfuge tube. An equal amount of sterile PBS was concentrated in a separate filter tube, serving as a negative control for each concentration/extraction. DNA was isolated from each concentrated sample using MoBio UltraClean Soil DNA Isolation kit following manufacturer's instructions (Mo Bio Laboratories Inc., Carlsbad, CA).
All quantitative PCR reactions were performed using a Bio-rad CFX96 (Bio-rad Laboratories; Hercules, CA). Universal bacterial 16S rRNA primers 1369F (5′-GGTGAATACGTTCYCGG-3′) and 1492R (5′-GGWTACCTTGTTACGACTT-3′) were used. Amplification was done with the following cycle parameters: 95°C for 180 seconds, and 40 cycles of 95°C for 10 seconds, 55°C for 30 seconds followed by melt curve analysis.
Bacterial DNA concentrations from the filters ranged from 102 to 104 copy numbers (Fig. 17). Further analysis is needed, and all DNA samples will be sent to Lawrence Berkeley National Laboratory for PhyloChip analysis.

Fig. 17. qPCR Results using universal bacterial 16S rRNA primers.
SOLID
The results indicated the presence of bacteria whose presence have been reported previously (González-Toril et al. Reference González-Toril, Gómez, Rodríguez, Fernández, Zuluaga, Marín, Amils, Cuminielly and García2001; Garrido et al. Reference Garrido, González-Toril, García-Moyano, Moreno-Paz, Amils and Víctor2008) as well as positive antigen–antibody reactions with antibodies against biochemical extracts from Rio Tinto environmental samples (Rivas et al., Reference Rivas, García-Villadangos, Moreno-Paz, Cruz-Gil, Gómez-Elvira and Parro2008) (Fig. 18).

Fig. 18. Immunoprofiling environmental samples with a life detector chip (LDCHIP200). Immuno-histograms obtained from the analysis of Río Tinto samples during CAREX2009 campaign with SOLID2 and LDCHIP200 immunosensor. Bars represent fluorescent intensity of the corresponding antibody on the biochip. The most relevant positive signals are numbered, and correspond to antibodies raised against: (1, 2) cellular extracts from Río Tinto water; (3, 4) yellow sediments from Río Tinto; (5) brown filaments from RT; (6) Leptospirillum ferrooxidans; (7) L. pherrifilum culture supernatant; (8, 9) Acidithiobacillus ferrooxidans cells and culture medium; (10) A. albertensis cells; (11) Shewanella spp. culture medium; (12) molybdenum transporter ModA peptide; (13) Ferritin from Pyrococcus furiosus; (14) Lectin potato (not an antibody); (15) cortisol; (16) Atrazine; (17) dinitrophenol; (18) cell extra from dark red sediments; (19) extract from 154 m deep sample from Rio Tinto; (20) L. pherrifilum supernatant and S100 extract IVE1S1 y S100 cellular extract; (21) Bacillus spp. environmental isolate from Río Tinto. Note how the fluorescent signals disappear when sample 3.2 become drier. Sample 7 is a wet sample more similar to wet sample 3.2, but clearly more abundant in L. pherrifilum (peaks 20).
Conclusions
The importance of the Rio Tinto CAREX field trip came from the step forward of a multidisciplinary campaign. Different specialists working together in the field for a collaborative campaign with the aim of a real-time descriptive campaign of a particular field site suppose an advantage for the future. Good and integrative results were obtained from the interdisciplinary Rio Tinto CAREX field campaign. The results reported from the different instruments deployed in the field gave us different points of view from which we were able to integrate different aspects of the science from the place.
We can report here the results from Mary samples took in Anabel's garden area analysed by FluorCam technology. Results from the fluorescence measurement provided insight into ecophysiology of photosynthetic micro-organisms. All investigated samples showed good physiological status indicating adaptation/acclimatization to the Rio Tinto environment. The instrument was able to detect photochemical activity and its heterogeneity even in benthic mat sample where the algae were embedded in clay. The measurement of the Stone sample rock revealed the area inhabited by photosynthetic micro-organisms. The microbes were active and in healthy condition in such an extreme environment. It was possible not only to study the active situation of the micro-organisms present in the sample but also to identify by microscope images. Attending to Mössbauer spectra hydronium jarosite was the main component of the precipitated material covering the stone sample rock. The rock was mainly composed of Gossan material and showed a mixture of haematite and goethite in its composition. The advantage of the application of different techniques and the integration of the results gave us the possibility of the analysis of both the biological diversity and the composition of the material where microbes are settled at the same time.
FluorCam measurements revealed photochemical activity in all samples with the exception of Lichen, good physiological status of the samples indicating adaptation and/or acclimatization of the algae to the Rio Tinto environment as well as areas inhabited by photosynthetic micro-organisms in the Stone sample and their photochemical performance. The measurement of the variable chlorophyll fluorescence should be a useful method for distinguishing photosynthesizing micro-organisms in a community and estimation of their primary production in situ. Detailed laboratory experiments are necessary to find the exact correlations between the fluorescence signal and oxygen production and/or carbon fixation.
The DeltaNu RockHound Raman spectrometer was successful in detecting inhomogeneities in rock samples that are within its beam width of 50 μm. The CrystalSleuth library search in general did not yield plausible mineral matches, but its RRUFF database can be used to compare the measured Raman spectrum with the spectra of suspected mineral constituents accurately for corroboration and validation.
The reflectance spectra obtained from the Ocean Optics USB2000 can be used to recognize different types of rocks that may appear to be similar, or which may be inaccessible, based on subtle differences in how materials reflect light across a broad wavelength range at the same time we are studying the prokaryotes biodiversity by SOLID. This method was also successfully tested using samples obtained from Rio Tinto.
In addition, it was shown that Mössbauer spectra of good quality can be obtained within 2 hours and at temperatures of ∼35°C, using a Si-PIN detector system and a 30 mCi source. The enhanced follow-up version of the spectrometer, MIMOSIIA for the ESA ExoMars mission, will be equipped with SDD instead of Si-PIN detectors, thus providing a significantly better SNR. Other important conclusion was that some targets could only be measured in situ, either because they could not be sampled, or because they might have been influenced by a change of environment. This demonstrates the value of in situ measurements. In contrast to other instruments, MIMOS II is able to measure not only a surface layer but also the underlying substrate, thus providing depth-selective information about a sample. With their different fields of view and penetration depth, MIMOS II and a Raman spectrometer provide complementary information about a sample. It was possible to identify the mineralogy reported previously also for long-term investigations in the area. Some potential protective micro niches (oases) were identified and analysed with molecular tools using both equipments, Vent Sampler and SOLID. With these equipments we got some results that indicated the presence of bacteria whose presence has been reported previously by others authors as Acidithiobacillus gen. and other prokaryotes (Figs. 17 and 18). Similar results were reported by the analysis developed on the samples obtained with the Vent Sampler and SOLID (Fig. 18). Acidithiobacillus-related sequences were obtained as well as other related chemolithotrophic bacteria (Leptospirillum related sequences). Both results from SOLID and Vent Sampler were congruent, showing the presence of related bacteria sequences.
The multidisciplinary approach reported good integrative results. The complementary data obtained for the different specialist supported us for understanding the extreme system under study during campaign. These campaigns are tremendously useful and the data obtained can support scientist with powerful tools for comprehension of the model of those field sites. In addition, this experience was a good training for what could be a real space missions and the analysis of the reported data from them.


