


1. Introduction
Natural disasters have devastating impacts on human and economic development. In only two decades (1992–2012), environmental disasters affected 4.4 billion people worldwide, claimed 1.3 million lives and caused US$2 trillion in economic losses (United Nations, 2012). A variety of economic consequences of environmental shocks have been documented in the literature. For instance, extreme natural events may cause population mobility in poor countries (Gray and Mueller, Reference Gray and Mueller2012; Drabo and Mbaye, Reference Drabo and Mbaye2015) and rich countries (Strobl, Reference Strobl2011; duPont et al., Reference duPont, Noy, Okuyama and Sawada2015), affect household income and expenditures (Arouri et al., Reference Arouri, Nguyen and Youssef2015; Lohmann and Lechtenfeld, Reference Lohmann and Lechtenfeld2015), and impact the local labour market of affected countries (Coffman and Noy, Reference Coffman and Noy2012; Halliday, Reference Halliday2012). Natural disasters also contribute to the maintenance of armed conflicts (Ghimire and Ferreira, Reference Ghimire and Ferreira2015), trap vulnerable populations in poverty (Carter et al., Reference Carter, Little, Mogues and Negatu2006; Jakobsen, Reference Jakobsen2012; Rodriguez-Oreggia et al., Reference Rodriguez-Oreggia, de la Fuente, de la Torre and Moreno2012), and depreciate human capital in early stages of life (Torche, Reference Torche2011; de Oliveira and Quintana-Domeque, Reference de Oliveira and Quintana-Domeque2016; Rosales-Rueda, Reference Rosales-Rueda2016).
Nonetheless, environmental disasters can have either positive or negative effects on economic growth. Some studies have shown that natural hazards boost economic growth (Albala-Bertrand, Reference Albala-Bertrand1993; Skidmore and Toya, Reference Skidmore and Toya2002; Noy and Vu, Reference Noy and Vu2010; Fomby et al., Reference Fomby, Ikeda and Loayza2011; Cunado and Ferreira, Reference Cunado and Ferreira2014), while others provide evidence of negative effects in the short run (Rasmussen, Reference Rasmussen2004; Noy, Reference Noy2009; Strobl, Reference Strobl2011, Reference Strobl2012), medium run (McDermott et al., Reference McDermott, Barry and Tol2014) and long run (Raddatz, Reference Raddatz2009; Hsiang and Jina, Reference Hsiang and Jina2014).Footnote 1 In particular, Loayza et al. (Reference Loayza, Olaberría, Rigolini and Christiaensen2012) show that disasters do affect economic growth, but not always negatively, with effects that differ across types of disasters and economic sectors.
Low-income and developing countries are more likely to experience human and economic losses than are developed countries (Toya and Skidmore, Reference Toya and Skidmore2007), and the growth performances of such countries are especially responsive to environmental shocks (Noy, Reference Noy2009; Loayza et al., Reference Loayza, Olaberría, Rigolini and Christiaensen2012; Strobl, Reference Strobl2012).Footnote 2 Political instability (Cavallo et al., Reference Cavallo, Galiani, Noy and Pantano2013), an absent/imperfect financial sector (McDermott et al., Reference McDermott, Barry and Tol2014), low access to international markets and a lack of institutional quality (Felbermayr and Gröschl, Reference Felbermayr and Gröschl2014) appear to be important mediating factors.
Notably, Latin America is exposed to a variety of natural disasters that can jeopardize economic growth (Stillwell, Reference Stillwell1992). For instance, Brazil is highly exposed to climate disasters, and ongoing global warming will further increase the risk of such environmental hazards in the near future. Predictions from the Intergovernmental Panel on Climate Change show the intensification of droughts in Northeast Brazil throughout the 21st century due to increasing global temperatures (Seneviratne et al., Reference Seneviratne, Nicholls, Easterling, Goodess, Kanae, Kossin, Luo, Marengo, McInnes, Rahimi, Reichstein, Sorteberg, Vera, Zhang, Field, Barros, Stocker, Qin, Dokken, Ebi, Mastrandrea, Mach, Plattner, Allen, Tignor and Midgley2012). Between 1995 and 2014, almost half of the total losses due to climate disasters occurred in this specific region of the country (Centro Universitário de Estudos e Pesquisas em Desastres, 2016).
The current investigation aims to provide evidence of the impact of natural disasters on the economic growth of municipalities in Ceará state, which is one of the states most affected by climatic hazards in Brazil (Centro Universitário de Estudos e Pesquisas em Desastres, 2016). Within the great semiarid region lies 87 per cent of the state's territory, as well as 56 per cent of its population.Footnote 3 Although its population is the eighth largest among Brazilian states (i.e., 8.5 million, which is slightly larger than the population of Austria), Ceará had the fifth lowest per capita GDP (US$6,652 PPP) in 2010, which is economically comparable to Guatemala (US$6,578 PPP). Such a level of exposure and economic vulnerability to environmental hazards is shared by the other Northeast states, making Ceará a suitable and representative case study area.
This investigation relies on an unexplored data source on disasters in Brazil. The information on natural disasters comes from the Damage Assessment Report (Relatório de Avaliação de Danos – AVADAN) carried out by the Civil Defence when a disaster occurs. Findings show that economic growth is negatively affected by damage from droughts and floods, which have consequences for the agriculture and service sectors. The output growth of municipalities is particularly responsive to large natural disasters that lead municipalities to declare a state of emergency or public calamity.
Furthermore, water supply infrastructure (WSI) increases the resilience of the service sector to droughts but not that of the agriculture sector, which is highly dependent on water resources. It reflects rural-urban differences in the access to WSI in Ceará. Since 2000, public investment in infrastructure of water provision has been focused on ensuring the access to water in large urban areas of the state (Ceratti, Reference Ceratti2013), while public policy in rural areas has mainly focused on small WSI such as rainfed water cisterns and water delivery trucks (Gutiérrez et al., Reference Gutiérrez, Engle, Nys, Molejón and Martins2014).
Last but not least, the Garantia-Safra (GS) programme – a microinsurance policy for natural disasters – helps municipalities to mitigate the effects of droughts and floods on the economic growth of the agriculture sector. Beneficiaries may use the (extra) resources from the GS programme to maintain their livestock instead of smoothing human consumption, once family farmers usually access cash transfer-based programmes such as Bolsa Família and rural pension (Silva, Reference Silva2014). The programme may help family farmers in rural areas to avoid large losses due to natural disasters.
Therefore, this paper contributes to the growing literature dedicated to understanding the effects of natural disasters on economic growth (Cavallo and Noy, Reference Cavallo and Noy2011) by adding new evidence from a large developing country. In particular, the current study shows how responsive economic growth is to environmental shocks in a poor region of Brazil, whereas other recent studies provided evidence from developed regions of the country (Ribeiro et al., Reference Ribeiro, Stein, Carraro and Ramos2014; Haddad and Teixeira, Reference Haddad and Teixeira2015; de Lima and Barbosa, Reference de Lima and Barbosa2018). Moreover, the study provides evidence of the role played by WSI (Hallegatte, Reference Hallegatte2009; Gutiérrez et al., Reference Gutiérrez, Engle, Nys, Molejón and Martins2014) and disaster microinsurance (Cummins and Mahul, Reference Cummins and Mahul2009; Clarke and Grenham, Reference Clarke and Grenham2013) in the adaptation and response to natural disasters associated with climate change.
The remainder of this study is structured as follows: section 2 describes the data sources, section 3 presents the empirical strategy, and section 4 analyses the results. Finally, section 5 concludes the study.
2. Data
2.1 Study area
Ceará state, the study area, is located in Northeast Brazil (see figure 1) and has a total area of 148,886| km2 (or 1.8 per cent of the country's territory). The climate is predominantly tropical hot semi-arid, which favours the occurrence of drought episodes that are often associated with large-scale climate phenomena, such as El Niño and La Niña, or with an intense meridional sea surface temperature gradient over the tropical Atlantic (Marengo et al., Reference Marengo, Alves, Alvala, Cunha, Brito and Moraes2017).
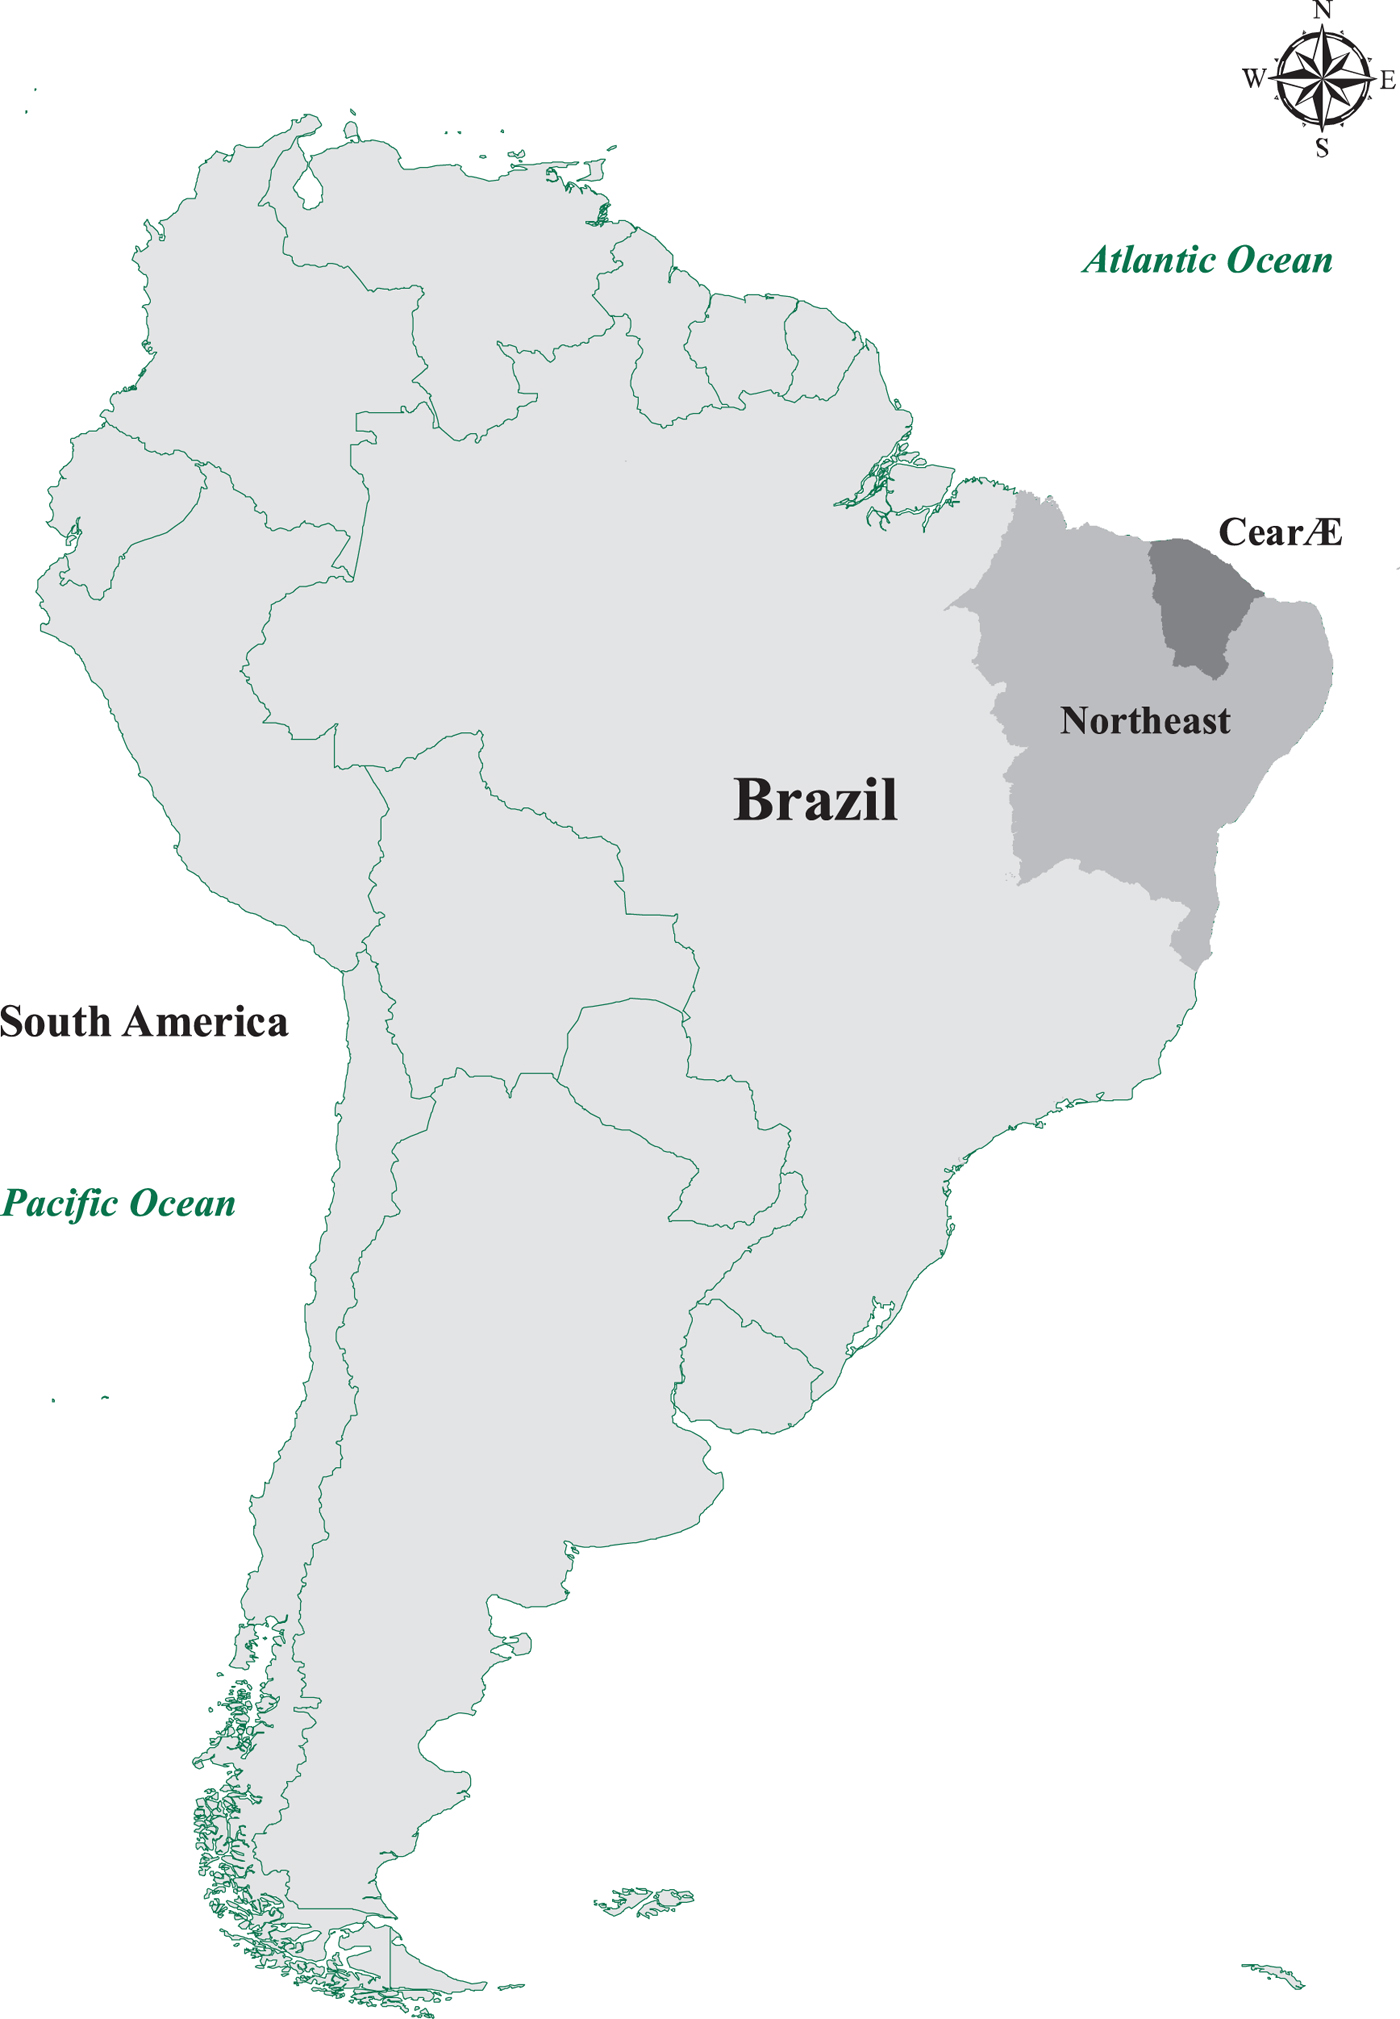
Figure 1. Map of Ceará State, Northeast, Brazil
The population size of municipalities in the state is nearly 46 thousand inhabitants on average, with Fortaleza (the state capital) being the largest municipality (2.45 million inhabitants) and Guramiranga being the smallest (4.1 thousand inhabitants). Regarding economic activity, the service sector is the most important economic sector for the municipalities and is responsible for almost 64 per cent of total GDP. The share of industry in GDP is 21 per cent, while that of agriculture is only 6 per cent.Footnote 4 The metropolitan region of Fortaleza (14 municipalities) has 42 per cent of the total population and approximately 65 per cent of the total GDP (72 and 65 per cent of the respective gross added value of services and industry, and only 9 per cent of the gross added value of agriculture). In contrast, municipalities within the semiarid region are responsible for slightly more than a third of the total GDP (37 per cent), and 81 per cent of the gross added value of agriculture.
2.2 Information on natural disasters in Brazil
This analysis uses information from the AVADAN, which comprises data about natural disasters, human disasters and mixed disasters (i.e., when human actions contribute to natural disasters). It must be filled out by trained professionals of the Civil Defence within the first 120 h following a disaster (Ministé)rio da Integração Nacional, 2007.Footnote 5
The AVADAN collects information about the affected areas (e.g., urban and rural areas), human damage (e.g., number of homeless, displaced, injured, sick, and fatalities), and direct damage to (i) buildings (e.g., homes; health and education establishments; public and community infrastructure; and rural, industrial and commercial buildings), (ii) natural resources (e.g., water, land, air, flora and fauna), (iii) the economy (e.g., crops, livestock, manufacturing, and services/commerce), and (iv) essential services (e.g., the water and power supply, transportation, communication, sewage and garbage collection, health and education service, and food supply). Taking Integrated Research on Disaster Risk (2014) as a reference, the AVADAN provides compatible information to compute loss indicators and covers the same categories of hazards as international databases on disasters such as the EM-DAT.
In 2012, Brazil adopted the classification and corresponding codification of the International Disaster Database (EM-DAT) of the Center for Research on the Epidemiology of Disasters (CRED) in order to bring national legislation into line with international criteria. In the same year, the AVADAN was replaced by a shorter and less detailed version of the Damage Assessment Report, called the Information Disaster Form (Formulário de Informação do Desastre). To preserve the homogeneity of the data source, this analysis is restricted to the period 2002–2011.
2.3 Descriptive statistics on natural disasters in Ceará
As shown in table 1, extreme climate events are the most frequent disaster in Ceará, with droughts (76.4 per cent) accounting for three times more reported disasters than floods (22.9 per cent) from 2002 to 2011. Other natural disasters include coastal erosion, landslides, and forest fires, which account for less than 1 per cent of reported events. It is worth noting that 75 per cent of all recorded disasters (76 per cent of droughts and 74 per cent of flood events) in Ceará have Damage Assessment Reports.Footnote 6 Loayza et al. (Reference Loayza, Olaberría, Rigolini and Christiaensen2012), using EM-DATA from 1965 to 2005, show that only 30 per cent and 49 per cent of drought and flood events respectively contain information on damages across countries.
Table 1. Descriptive statistics on natural disasters in Ceará State from 2002 to 2011

Notes: Standard deviations are in parentheses. All monetary values are in real terms regarding the GDP deflator of 2012.
a Records about natural disasters come from Centro Universitário de Estudos e Pesquisas sobre Desastres (2013).
Table 1 also shows that the average annual losses per municipality are approximately R$6 million (or US$4.3 million PPP) in Ceará, with losses from floods being almost three times larger than losses from droughts. Such a difference is mainly explained by the direct damage to homes, as well as to public and private infrastructure, when floods take place in urban areas. Other disasters, specifically coastal erosion, have average losses of about R$110 million (or US$79 million PPP), making them potential outliers in the sample. Moreover, approximately 45 per cent of the total sample (N = 1, 840) has at least one Damage Assessment Report between 2002 and 2011, in which 34 per cent of the sample reported damages caused by drought and 12.5 per cent reported damages caused by floods.
In addition, reported droughts and floods are associated with the precipitation in the municipalities. Figure 2(a) shows that drought episodes are highly predominant over the years, except in 2004 and 2009 when floods were the most reported natural disaster.Footnote 7 The pairwise correlation across time between the average annual precipitation and total reports of droughts is − 0.719 (p-value < 0.05), and regarding total reports of floods, it is 0.774 (p-value < 0.05). Across municipalities, the pairwise correlation between total number of reports and average annual precipitation is − 0.663(p − value < 0.05).

Figure 2. Damage assessment reports and annual precipitation in Ceará
Although the number of notifications is informative about the frequency of disasters, the direct damage of natural disasters is useful for capturing the intensity of the environmental shocks.Footnote 8 That is,
 $${\rm N}{\rm D}_{i\comma t} = \sum\limits_j {\displaystyle{{{\rm Disaster\ Losse}{\rm s}_{i\comma j\comma t}} \over {{\rm Populatio}{\rm n}_{i\comma t-1}}}} \comma \;$$
where i is the index of municipalities, j indicates the type of disaster (i.e., droughts and floods), and t is the year of the disaster. Disaster losses are standardized by lagged population size in order to avoid the contemporaneous effect of environmental hazards on population (Noy, Reference Noy2009). Because the per capita losses exhibit large standard errors, the natural log is computed in order to prevent the potential influence of outliers (see table 1).
2.4 Determinants of output growth
Furthermore, determinants of economic growth may reduce the vulnerability of municipalities to environmental hazards (Toya and Skidmore, Reference Toya and Skidmore2007), making them important confounding factors if they are not taken into account in the analysis.Footnote 9 Table 2 provides average and standard deviations of the output growth and control variables.
Table 2. Descriptive statistics of the sample

Notes: Standard deviations are in parentheses.
a The output growth rate is the difference between the natural logarithm of per capita GDP and its lagged value (i.e., ln GDPpc t – ln GDPpc t–1).
In the neoclassical growth literature, the accumulation of physical and human capital and technological progress are key determinants of economic growth (Durlauf et al., Reference Durlauf, Johnson, Temple, Aghion and Durlauf2005). Because of the absence of an appropriate measure of physical capital, an index based on principal components is obtained using post offices, radio stations, schools and health establishments. The index ranges from 0 to 100, and each covariate is normalized by population size. Electricity consumption is included as a proxy for investment in physical capital. Enrolment in high school, normalized by population size, is included as a proxy for human capital stock. Technology is assumed to be exogenous and constant across municipalities (Mankiw et al., Reference Mankiw, Romer and Weil1992).
In addition, per capita public spending is included in order to capture the effect of local government consumption on growth (Barro, Reference Barro1990). The relevance of the formal labour market to economic growth is captured by the proportion of formal workers relative to population size (La Porta and Shleifer, Reference La Porta and Shleifer2014). Finally, vulnerability to natural disasters is accounted for by the following variables: hospital beds per inhabitant (World Health Organization, 2013) and WSI (i.e., number of reservoirs and water pipeline systems) (Hallegatte, Reference Hallegatte2009).
3. Empirical strategy
The empirical strategy relies on the standard empirical growth equation proposed by Islam (Reference Islam1995). Several studies have extended the growth equation to incorporate the intensity of natural disasters, assuming a multiplicative risk formulation (Noy, Reference Noy2009; Loayza et al., Reference Loayza, Olaberría, Rigolini and Christiaensen2012; Felbermayr and Gröschl, Reference Felbermayr and Gröschl2014). That is,
 $$\ln y_{i\comma t} = \beta \ln y_{i\comma t-1} + \rho \ln {\rm N}{\rm D}_{i\comma t} + \theta \ln X_{i\comma t} + \mu _t + \lambda _i + \varepsilon _{i\comma t}\comma \;$$
where y i, t is the output per capita of municipality i in year t, and y i, t−1 is the lagged output per capita. The vector of explanatory variables includes covariates that account for determinants of economic growth in the municipalities, X it, and the measure of the direct damage caused by natural disasters, NDit. The formulation also includes the time-specific effect, μt, which reflects the potential productivity growth and common shocks over time. The unit-specific fixed effect, λi, captures effects from unobserved fixed characteristics of municipalities that can be correlated with economic growth and losses due to natural disasters.
The generalized method of moments (GMM) developed for dynamic models of panel data (Holtz-Eakin et al., Reference Holtz-Eakin, Newey and Rosen1988; Arellano and Bond, Reference Arellano and Bond1991; Arellano and Bover, Reference Arellano and Bover1995) is adopted as the empirical strategy, taking advantage of first differences and internal instruments to deal with unobserved heterogeneity and simultaneity issues. However, some explanatory variables may be highly persistent in the short panel, producing weak internal instruments (Durlauf et al., Reference Durlauf, Johnson, Temple, Aghion and Durlauf2005). In this case, the GMM system (Arellano and Bover, Reference Arellano and Bover1995; Blundell and Bond, Reference Blundell and Bond1998) is used in the current study.Footnote 10
A particular issue is whether damage caused by natural disasters is endogenously determined in equation (1). In the literature, the measures of natural disasters are usually treated as exogenous covariates (Skidmore and Toya, Reference Skidmore and Toya2002; Raddatz, Reference Raddatz2007; Noy, Reference Noy2009; Loayza et al., Reference Loayza, Olaberría, Rigolini and Christiaensen2012), although human and economic losses are likely to depend on the level of development of the affected area (Toya and Skidmore, Reference Toya and Skidmore2007).Footnote 11 Loayza et al. (Reference Loayza, Olaberría, Rigolini and Christiaensen2012) argue that reverse causation is not an issue in equation (1) because economic growth may only help countries or regions reduce their vulnerability to environmental hazards in the long run.
In the short run, however, several unobserved policy responses to natural disasters may compensate their adverse effects or even improve the economic growth of the affected municipalities.Footnote 12 Thus, the direct damage from natural disasters is likely to be endogenously determined in equation (1). Since natural disasters are associated with municipal precipitation in Ceará (see figure 2), the deviation of the annual precipitation of municipalities relative to their historical average over the last 30 years is used as an external instrument.Footnote 13 A robustness analysis is provided in order to test whether the output growth of municipalities is responsive to the lack and excess of rainfall.
4. Results
4.1 Baseline estimations
Table 3 provides the estimated effects of the direct damage of natural disasters, measured by per capita losses (see table 1), on the output growth rate of municipal economies. The results show that disaster damage negatively affects the economic growth of municipalities in Ceará, Brazil. Specifically, the output growth of agriculture is negatively affected by damage from droughts and floods, while the economic growth of services is affected by damage from floods. Industry remains unresponsive to natural disasters.
Table 3. Effects of direct damage from natural disasters on the output growth of municipalities
Notes: The vector of endogenous variables includes the lagged natural log of per capita GDP, the natural log of per capita electricity consumption, the natural log of formal workers relative to the total population, the natural log of per capita government expenditures, and the natural log of per capita losses due to natural disasters. The vector of predetermined variables includes the natural log of enrolments in high school relative to the total population, the infrastructure index (0–100), water supply infrastructure (i.e., number of reservoirs plus water pipeline systems), and the natural log of hospital beds per inhabitants. The deviation of annual precipitation relative to the historical average and its lagged values are used as external instruments. Robust standard errors are in parentheses.
All variables are in log terms. ***p − value < 0.01, **p − value < 0.05.
It is worth noting that the estimations in table 3 account for the infrastructure of municipalities, which implies that the effects do not operate through physical capital formation (Loayza et al., Reference Loayza, Olaberría, Rigolini and Christiaensen2012). In agriculture, the effects of droughts are likely to operate through the loss of efficiency caused by the lack of water resources. For instance, droughts can cause crop losses and reduce livestock (Chimeli et al., Reference Chimeli, de Souza Filho, Holanda and Petterini2008). Floods, in contrast, can destroy crops that are sensitive to excessive rainfall, such as corn, beans, rice and cassava, which are predominant in Ceará (Sun et al., Reference Sun, Li, Ward and Moncunill2006). In the service sector, floods can lead firms to suffer asset loss, prevent workers from arriving at their workplaces or leaving the job earlier (Haddad and Teixeira, Reference Haddad and Teixeira2015). Consequently, floods reduce labour productivity (Leitner et al., Reference Leitner, Oberhofer and Raschky2009).
The results from table 3 also contrast with studies that have documented a positive effect of floods on the output growth rate of agriculture (Loayza et al., Reference Loayza, Olaberría, Rigolini and Christiaensen2012; Cunado and Ferreira, Reference Cunado and Ferreira2014). One hypothesis is that water accumulation from floods might result in relative gains for total factor productivity (e.g., intensive use of irrigation technology), which might outweigh losses from the destruction of public infrastructure and land (Loayza et al., Reference Loayza, Olaberría, Rigolini and Christiaensen2012). However, rainfed agriculture is predominant in Ceará, since only 1.5 per cent of the total area of all rural establishments uses irrigation technology. In addition, family farming occupies 44 per cent of the total area of rural establishments in Ceará, making it responsible for 64 per cent of total crops and 51 per cent of livestock (Guilhoto et al., Reference Guilhoto, Azzoni and Ichihara2009). Footnote 14 In Brazil, family farming exhibits low access to agricultural policies (e.g., credit policies and technical assistance) and technologies, as well as poor market and socioeconomic integration (Medina et al., Reference Medina, Almeida, Novaes, Godar and Pokorny2015), suggesting a high vulnerability to environmental shocks.
In terms of magnitude, an increase of one standard deviation in direct damage from natural disasters reduces the output growth rate by 3.1 per cent (= −0.0129 × 2.4369). This effect is about one-third of the estimated effect of natural disasters on the output growth of developing countries, as documented by Noy (Reference Noy2009). The same variation in the direct damage from droughts leads to a decrease of approximately 2.4 per cent (= −0.0117 × 2.0830) in the GDP growth rate and nearly 6.5 per cent (= −0.0298 × 2.0830) in output growth of agriculture. In the case of floods, a similar variation in direct damage implies a drop of approximately 2.3 per cent (= −0.0132 × 1.7557) in overall output growth and a reduction of 4.2 per cent (= −0.0240 × 1.7557) and 1 per cent (= −0.0057 × 1.7557), respectively, in the economic growth rates of agriculture and services.
4.2 Robustness analysis
It is important to confirm whether the results from table 3 find support in alternative estimations of equation (1). The current subsection present two robustness checks that aim to verify (i) whether the output growth of municipalities is responsive to the lack and excess of rainfall, and (ii) whether the economic growth of municipalities is affected by the size of natural disasters, according to the classification of the Civil Defence regarding the intensity of disasters.
4.2.1 Response of output growth to the lack and excess of rainfall
In this subsection, equation (1) is re-estimated by replacing the direct damage from natural disasters with the following binary variables: (i) the lack of rainfall is defined as I(Deviation < p25 or –24.9%); and (ii) the excess of rainfall is expressed as I(Deviation > p75 or 21.7%).Footnote 15
Table 4 shows that the overall growth rate is responsive to excessive rainfall but not to the lack of rainfall. Municipalities with excessive rainfall experience a 4.6 per cent drop in overall output growth, which is particularly driven by the effects on the agriculture and service sectors.Footnote 16 The output growth of agriculture is also responsive to the lack of rainfall, which is the most susceptible economic sector to natural disasters in Ceará. Such evidence supports the baseline results in table 3.
Table 4. Regressing output growth rate during drought and flood episodes

Notes. See the notes to table 3 for the list of control variables included in the regressions. Robust standard errors are in parentheses.
All variables are in log terms. ***p − value < 0.01, **p − value < 0.05.
The non-significance of the estimate for the lack of rainfall, however, does not mean that output growth is unaffected by droughts. Indeed, the economic growth performance of municipalities in Ceará may be responsive to severe droughts. This leads to the following robustness analysis that aims to verify whether the output growth of municipalities is responsive to small and large natural disasters.
4.2.2 Response of output growth to large natural disasters
The AVADAN provides information about the scale of disasters (i.e., small, medium, large and very large), taking into consideration not only human and material losses but also the level of local vulnerability and the risks of a worsening disaster scenario. Based on such classification of disasters, Civil Defence recommends whether the Federal Government should recognize a state of emergency or a public calamity (Ministério da Integração Nacional, 2007).
Large and very large disasters,  ${\rm ND}_{it}^{L} $, which can lead to abnormal conditions in affected municipalities (i.e., a state of emergency or public calamity) are reported by 10.4 per cent of the total sample (N = 1, 840) with average per capita losses of about R$484.6 (or US$384 PPP). Low and medium disasters,
  ${\rm ND}_{it}^{S} $, account for 36.5 per cent of the total sample with average per capita losses of R$193.7 (or US$139.1 PPP). Thus, equation (1) is re-estimated with the number of small
  ${\rm \lpar ND}_{it}^{S}$) and large disasters
  $\lpar {\rm ND}_{it}^{L} \rpar $, that is,
 $$\Delta {\rm ln\ }y_{i\comma t} = \beta \ln y_{i\comma t-1} + \phi \ln {\rm ND}_{it}^L + \varphi \ln {\rm ND}_{it}^S + \theta \ln X_{i\comma t} + \mu _t + \lambda _i + \varepsilon _{i\comma t}.$$
Table 5 shows that output growth is only affected by the number of large natural disasters, particularly by large droughts and floods.
Table 5. Effects of episodes of natural disasters on the output growth of municipalities
Notes: See the notes to table 3 for the list of control variables included in the regressions. Robust standard errors are in parentheses.
All variables are in log terms. ***p − value < 0.01, **p − value < 0.05, and *p − value < 0.1.
Notice that the economic growth rate of the service sector is particularly affected by large floods. Recent evidence from Brazil has shown the negative consequences of intense floods on economic growth in developed states. For instance, Ribeiro et al. (Reference Ribeiro, Stein, Carraro and Ramos2014) show that the 2008 floods in Santa Catarina reduced industrial production by 5.1 per cent, while de Lima and Barbosa (Reference de Lima and Barbosa2018) show a drop of approximately 7.6 per cent in GDP per capita. Haddad and Teixeira (Reference Haddad and Teixeira2015) find that floods reduce city growth and residents' welfare in São Paulo, although economic activity in large urban centres tends to recover quickly from severe floods (Kocornik-Mina et al., Reference Kocornik-Mina, McDermott, Michaels and Rauch2015).
Notice that the linear combination of estimated coefficients  $\lpar \hat{\varphi} + \hat{\phi}\rpar $ provides the average effect of the episodes of natural disasters regardless of their scale of magnitude. This evidence is aligned with the baseline results in table 3. The linear combination in column (1) suggests that an increase of one standard deviation in the number of natural disasters leads to a reduction of approximately 1.6 per cent (= −0.0302 × 0.5457) in the output growth rate.
4.2.3 Additional robustness analyses
Two additional robustness checks are performed in the current study, both of which are available in the online appendix. Table A2 shows the absence of persistence in the effects of the direct damage from natural disasters, while table A3 replicates table 3 by including variables that capture the party alignment of mayors with state governors and presidents between 2002 and 2011. If a mayor's party alignment facilitates the recognition of a state of emergency or a public calamity, then such an alignment would favour municipalities in accessing fund transfers that help them cope with the disaster damage, undermining estimates in table 3. Results show that this is not the case in Ceará, since the estimates remain unchanged after accounting for mayors' party alignments.
4.3 Analysis of mitigating factors
4.3.1 The role of water supply infrastructure
In the past two decades, investment in WSI has been the main resilience policy for droughts in Ceará (Gutiérrez et al., Reference Gutiérrez, Engle, Nys, Molejón and Martins2014). Therefore, it is important to test whether the WSI of municipalities can attenuate the effects of natural disasters on the output growth rate. Water supply infrastructure is proxied by the sum of total water reservoirs and water pipeline systems (with a mean value and standard deviation equal to 1.34 and 1.58, respectively). To test such a hypothesis, equation (1) is re-estimated to include interactions between direct damage and the measure of WSI, that is,
 $$\eqalign{ \ln y_{i\comma t} =& \beta \ln y_{i\comma t-1} + \rho \ln {\rm N}{\rm D}_{i\comma t} + \varphi {\rm WS}{\rm I}_{i\comma t} + \delta \lpar {\ln {\rm N}{\rm D}_{i\comma t} \times {\rm WS}{\rm I}_{i\comma t}} \rpar \cr & + \theta \ln X_{i\comma t} + \mu _t + \lambda _i + \varepsilon _{i\comma t}.}$$
In table 6, estimated interactions show that WSI helps municipalities to mitigate the effect of natural disasters on the output growth of the service sector but does not mitigate the impact on the agriculture sector. A water reservoir or water pipeline system would reduce the magnitude of the impact of the direct damage of droughts on the output of services by almost 30 per cent.
Table 6. Heterogeneous effects of natural disasters on output growth due to water supply infrastructure

Notes: See the notes to table 3 for the list of control variables included in the regressions. Robust standard errors are in parentheses.
All variables are in log terms. ***p − value < 0.01, ** p − value < 0.05.
Perhaps this evidence reflects rural-urban differences in the access to water resources in Ceará, since public investments in water reservoirs and pipeline systems aim to guarantee access to water in urban areas rather than rural areas. For instance, public investment in WSI amounts to US$730 million between 2000 and 2011, expanding guaranteed water supply from 10,333.4 million m3 to 1,692.7 billion m3 in that period. The built infrastructure mainly benefited the metropolitan region of Fortaleza (3.6 million people) and rural communities around the new reservoirs (300,000 people) (Ceratti, Reference Ceratti2013).
As highlighted by Gutiérrez et al. (Reference Gutiérrez, Engle, Nys, Molejón and Martins2014), one-fourth of the population live in rural areas and most of them are dispersed and disconnected from the perennial water supplies.Footnote 17 Moreover, the existing infrastructure (i.e., water dams) are small, precarious (or abandoned), and insufficient to serve rural population during extended periods of droughts.Footnote 18 All these factors combined with drought events increase the cost of water provision in rural communities. Thus, the construction of rainfed water cisterns and well drilling, as well as the use of water delivery trucks, have become the main alternatives policies to WSI in rural areas of Ceará state (Gutiérrez et al., Reference Gutiérrez, Engle, Nys, Molejón and Martins2014).
Therefore, it is not a surprise that large WSI increases the resilience of the service sector to direct damage from droughts in Ceará. Whether small infrastructures of water provision can help to mitigate the effects of natural disasters on the agriculture sector in Northeast Brazil is still an open question.
4.3.2 The role of the Garantia-Safra programme
The GS programme is a disaster microinsurance policy funded by the federal and state governments, as well as the municipalities.Footnote 19 It is one of the actions of the National Programme for Strengthening Family Agriculture (Plano Nacional de Fortalecimento da Agricultura Familiar – PRONAF) and aims to ensure a minimum income to family farmers who joined the programme before the planting season and who live in municipalities with at least 50 per cent of crop losses due to droughts or floods.Footnote 20 The programme covers the Northeast region and part of Minas Gerais and Espírito Santo states, especially municipalities within the semiarid region.Footnote 21 On average, 190,619 family farmers joined the programme between 2003 and 2011, while 98,200 received benefits.Footnote 22 The programme helps family farmers to smooth consumption and can even be used to maintain their livestock.
To test whether the GS programme can mitigate the impact of natural disasters on the output growth of agriculture, equation (1) is reformulated to include the interaction between the measure of natural disasters and the measure of the GS programme. That is,
 $$\eqalign{ \ln y_{i\comma t} = & \beta \ln y_{i\comma t-1} + \rho \ln {\rm N}{\rm D}_{i\comma t} + \varphi {\rm G}{\rm S}_{i\comma t} + \delta \lpar {\ln {\rm N}{\rm D}_{i\comma t} \times {\rm G}{\rm S}_{i\comma t}} \rpar \cr & + \theta \ln X_{i\comma t} + \mu _t + \lambda _i + \varepsilon _{i\comma t}.}$$
In table 7, Specification 1 uses the number of small farmers benefiting from the programme, normalized by lagged population size (with a mean and standard deviation equal to 2.18 per cent and 3.71, respectively), while Specification 2 uses the total amount of payments to small farmers, normalized by lagged total output (with a mean and standard deviation equal to 0.38 per cent and 0.66, respectively).
Estimated interactions in both Specifications 1 and 2 show that the GS programme alleviates the effects of direct damage from droughts and floods on the output growth of agriculture. On average, the GS programme in affected municipalities reduces the magnitude of the impact of the direct damage of droughts by almost 18 per cent and by nearly 27 per cent in the case of floods.
Table 7. Heterogeneous effects of natural disasters on output growth due to the Garantia-Safra programme

Notes: See the notes to table 3 for the list of control variables included in the regressions.
All variables are in log terms. ***p − value < 0.01, **p − value < 0.05.
A potential explanation behind this evidence is that family farmers make use of the benefit from the GS programme as investment in their small production. Silva (Reference Silva2014) investigates the allocation of resources from the GS programme by family farmers in a small rural settlement in the municipality of Ocara, Ceará. The findings suggest that the benefit is mainly used to treat and prevent diseases, as well as to feed animals. It is also allocated to buy water and food, according to the consumption of the family production unit. These families also access cash transfer-based programmes such as Bolsa Família and rural pension, which allow them to allocate the extra resources from the GS programme with their livestock (Silva, Reference Silva2014).Footnote 23
Therefore, the allocation of the benefit to production rather than to human consumption could explain the mitigating role of the GS programme regarding the effects of natural disasters on the growth performance of the agricultural sector, especially because family farming is responsible for the great part of rural production in Ceará state (Guilhoto et al., Reference Guilhoto, Azzoni and Ichihara2009).
5. Conclusion
Based on an unexplored database on natural disasters in Brazil, the current study shows that damage from environmental shocks reduces the GDP growth rate of municipal economies in Ceará state, Northeast Brazil. The output growth of agriculture is affected by damage caused by droughts and floods, while the output growth of services is only responsive to damage caused by floods. The economic growth of municipalities is especially responsive to the occurrence of large natural disasters that lead to an emergency condition or public calamity. This is worrisome evidence, since global warming has tended to intensify environmental hazards in Northeast Brazil throughout the 21st century (Seneviratne et al., Reference Seneviratne, Nicholls, Easterling, Goodess, Kanae, Kossin, Luo, Marengo, McInnes, Rahimi, Reichstein, Sorteberg, Vera, Zhang, Field, Barros, Stocker, Qin, Dokken, Ebi, Mastrandrea, Mach, Plattner, Allen, Tignor and Midgley2012) with particular consequences for agricultural productivity in Ceará state (Ferreira Filho and de Moraes, Reference Ferreira Filho and de Moraes2014; Assunção and Chein, Reference Assunção and Chein2016).
Despite improvements in the management of water resources over the last few decades, there are still challenges in responding and adapting to natural disasters, especially droughts in Ceará (Gutiérrez et al., Reference Gutiérrez, Engle, Nys, Molejón and Martins2014). For instance, WSI increases the resilience of the economic growth of the service sector to droughts but not for the agriculture sector. This may reflect urban-rural inequality in the access to water resources in Ceará. Thus, public policy should prioritize water provision to rural areas, incorporating technologies that help small farmers to better adapt to environmental hazards (e.g., water desalination and reuse). In terms of policy response, the Garantia-Safra programme plays an important role by mitigating the effects of droughts and floods on the economic growth of agriculture in a Brazilian state where family farming is predominant and highly vulnerable to natural disasters.
Supplementary material
The supplementary material for this article can be found at https://doi.org/10.1017/S1355770X18000517.
Author ORCIDs
Victor Hugo de Oliveira 0000-0002-4737-7062
Acknowledgements
I thank two anonymous referees for helpful comments and suggestions. This is a substantially revised version of a previous paper, ‘Natural disasters and economic growth in the northeastern Brazil: evidence from municipal economies of the State of Ceará’, that circulated as a working paper (IPECE Texto para Discussão n.122 October/2017). Any errors contained in the paper are my own.


